
Abstract
Background
Texture analysis and machine learning methods are useful in distinguishing between benign and malignant tissues.
Purpose
To discriminate benign from malignant or metastatic mediastinal lymph nodes using F-18 fluorodeoxyglucose (FDG) positron emission tomography/computed tomography (PET/CT) and contrast-enhanced computed tomography (CT) texture analyses with machine learning and determine lung cancer subtypes based on the analysis of lymph nodes.
Material and Methods
Suitable texture features were entered into the algorithms. Features that statistically significantly differed between the lymph nodes with small cell lung cancer (SCLC), adenocarcinoma (ADC), and squamous cell carcinoma (SCC) were determined.
Results
The most successful algorithms were decision tree with the sensitivity, specificity, and area under the curve (AUC) values of 89%, 50%, and 0.692, respectively, and naive Bayes (NB) with the sensitivity, specificity, and AUC values of 50%, 81%, and 0.756, respectively, for PET/CT, and NB with the sensitivity, specificity, and AUC values of 10%, 96%, and 0.515, respectively, and logistic regression with the sensitivity, specificity, and AUC values of 21%, 83%, and 0.631, respectively, for CT. In total, 13 features were able to differentiate SCLC and ADC, two features SCLC and SCC, and 33 features ADC and SCC lymph node metastases in PET/CT. One feature differed between SCLC and ADC metastases in CT.
Conclusion
Texture analysis is beneficial to discriminate between benign and malignant lymph nodes and differentiate lung cancer subtypes based on the analysis of lymph nodes.
Introduction
Mediastinal lymph nodes are sites where many malignancies, including lung cancer, often metastasize (1,2). Computed tomography (CT) and F-18 fluorodeoxyglucose (FDG) positron emission tomography/computed tomography (PET/CT) are commonly used non-invasive techniques for mediastinal nodal staging. CT has a low sensitivity of approximately 44%. FDG PET also has low specificity since inflammation in lymph nodes stimulates a high FDG uptake and causes false-positive findings (3). Therefore, a histopathological examination after invasive techniques is the gold standard method for mediastinal nodal staging (3,4). As an alternative solution, studies in the literature have investigated the differentiation of benign and malignant mediastinal lymph nodes using texture analysis on CT (5,6) or FDG PET images (7,8).
Texture analysis in medical imaging has gained importance in recent years. It is considered that medical images contain more numerous quantitative features. The relationship between the gray levels of pixels and voxels in the determined volume of interest and heterogeneity of tumoral tissues has been investigated for the differentiation of various histopathologies (9). Some researchers have shown that texture analysis helps differentiate histopathological subtypes of primary lung lesions in lung cancer (10,11).
The first aim of the present study was to separately determine the power of the texture analysis and machine learning methods of CT and FDG PET in the discrimination of benign and malignant mediastinal lymph nodes. The second aim was to determine histopathological subtypes in mediastinal lymph nodes using texture analysis in patients with lung cancer. To the best of our knowledge, there is no study in the literature evaluating the relationship between the texture analysis of mediastinal lymph node metastases and primary lung cancer subtypes.
Material and Methods
This research was approved by the ethics board of Dokuz Eylul University School of Medicine (Decision no. 2020/23-13). Our institutional review board waived informed consent due to the retrospective design of the study. Between September 2017 and March 2020, 370 patients underwent endobronchial ultrasonography-guided transbronchial needle aspiration (EBUS-TBNA). The tumor board determined the lymph nodes to be sampled according to PET/CT and thoracic CT images. Some of these patients underwent PET/CT and chest CT, while others underwent only PET/CT or only chest CT. Lymph nodes located at mediastinal stations 2, 4, 7, and 11 according to the International Association for the Study of Lung Cancer proposal (12) were sampled and analyzed with the EBUS-TBNA technique. The study included lymph nodes with a definitive benign or malignant histopathological result. The patient exclusion criteria are listed in Fig. 1. The final sample included 121 lymph nodes of 84 patients examined with FDG PET/CT and 114 lymph nodes of 80 patients examined with enhanced chest CT.
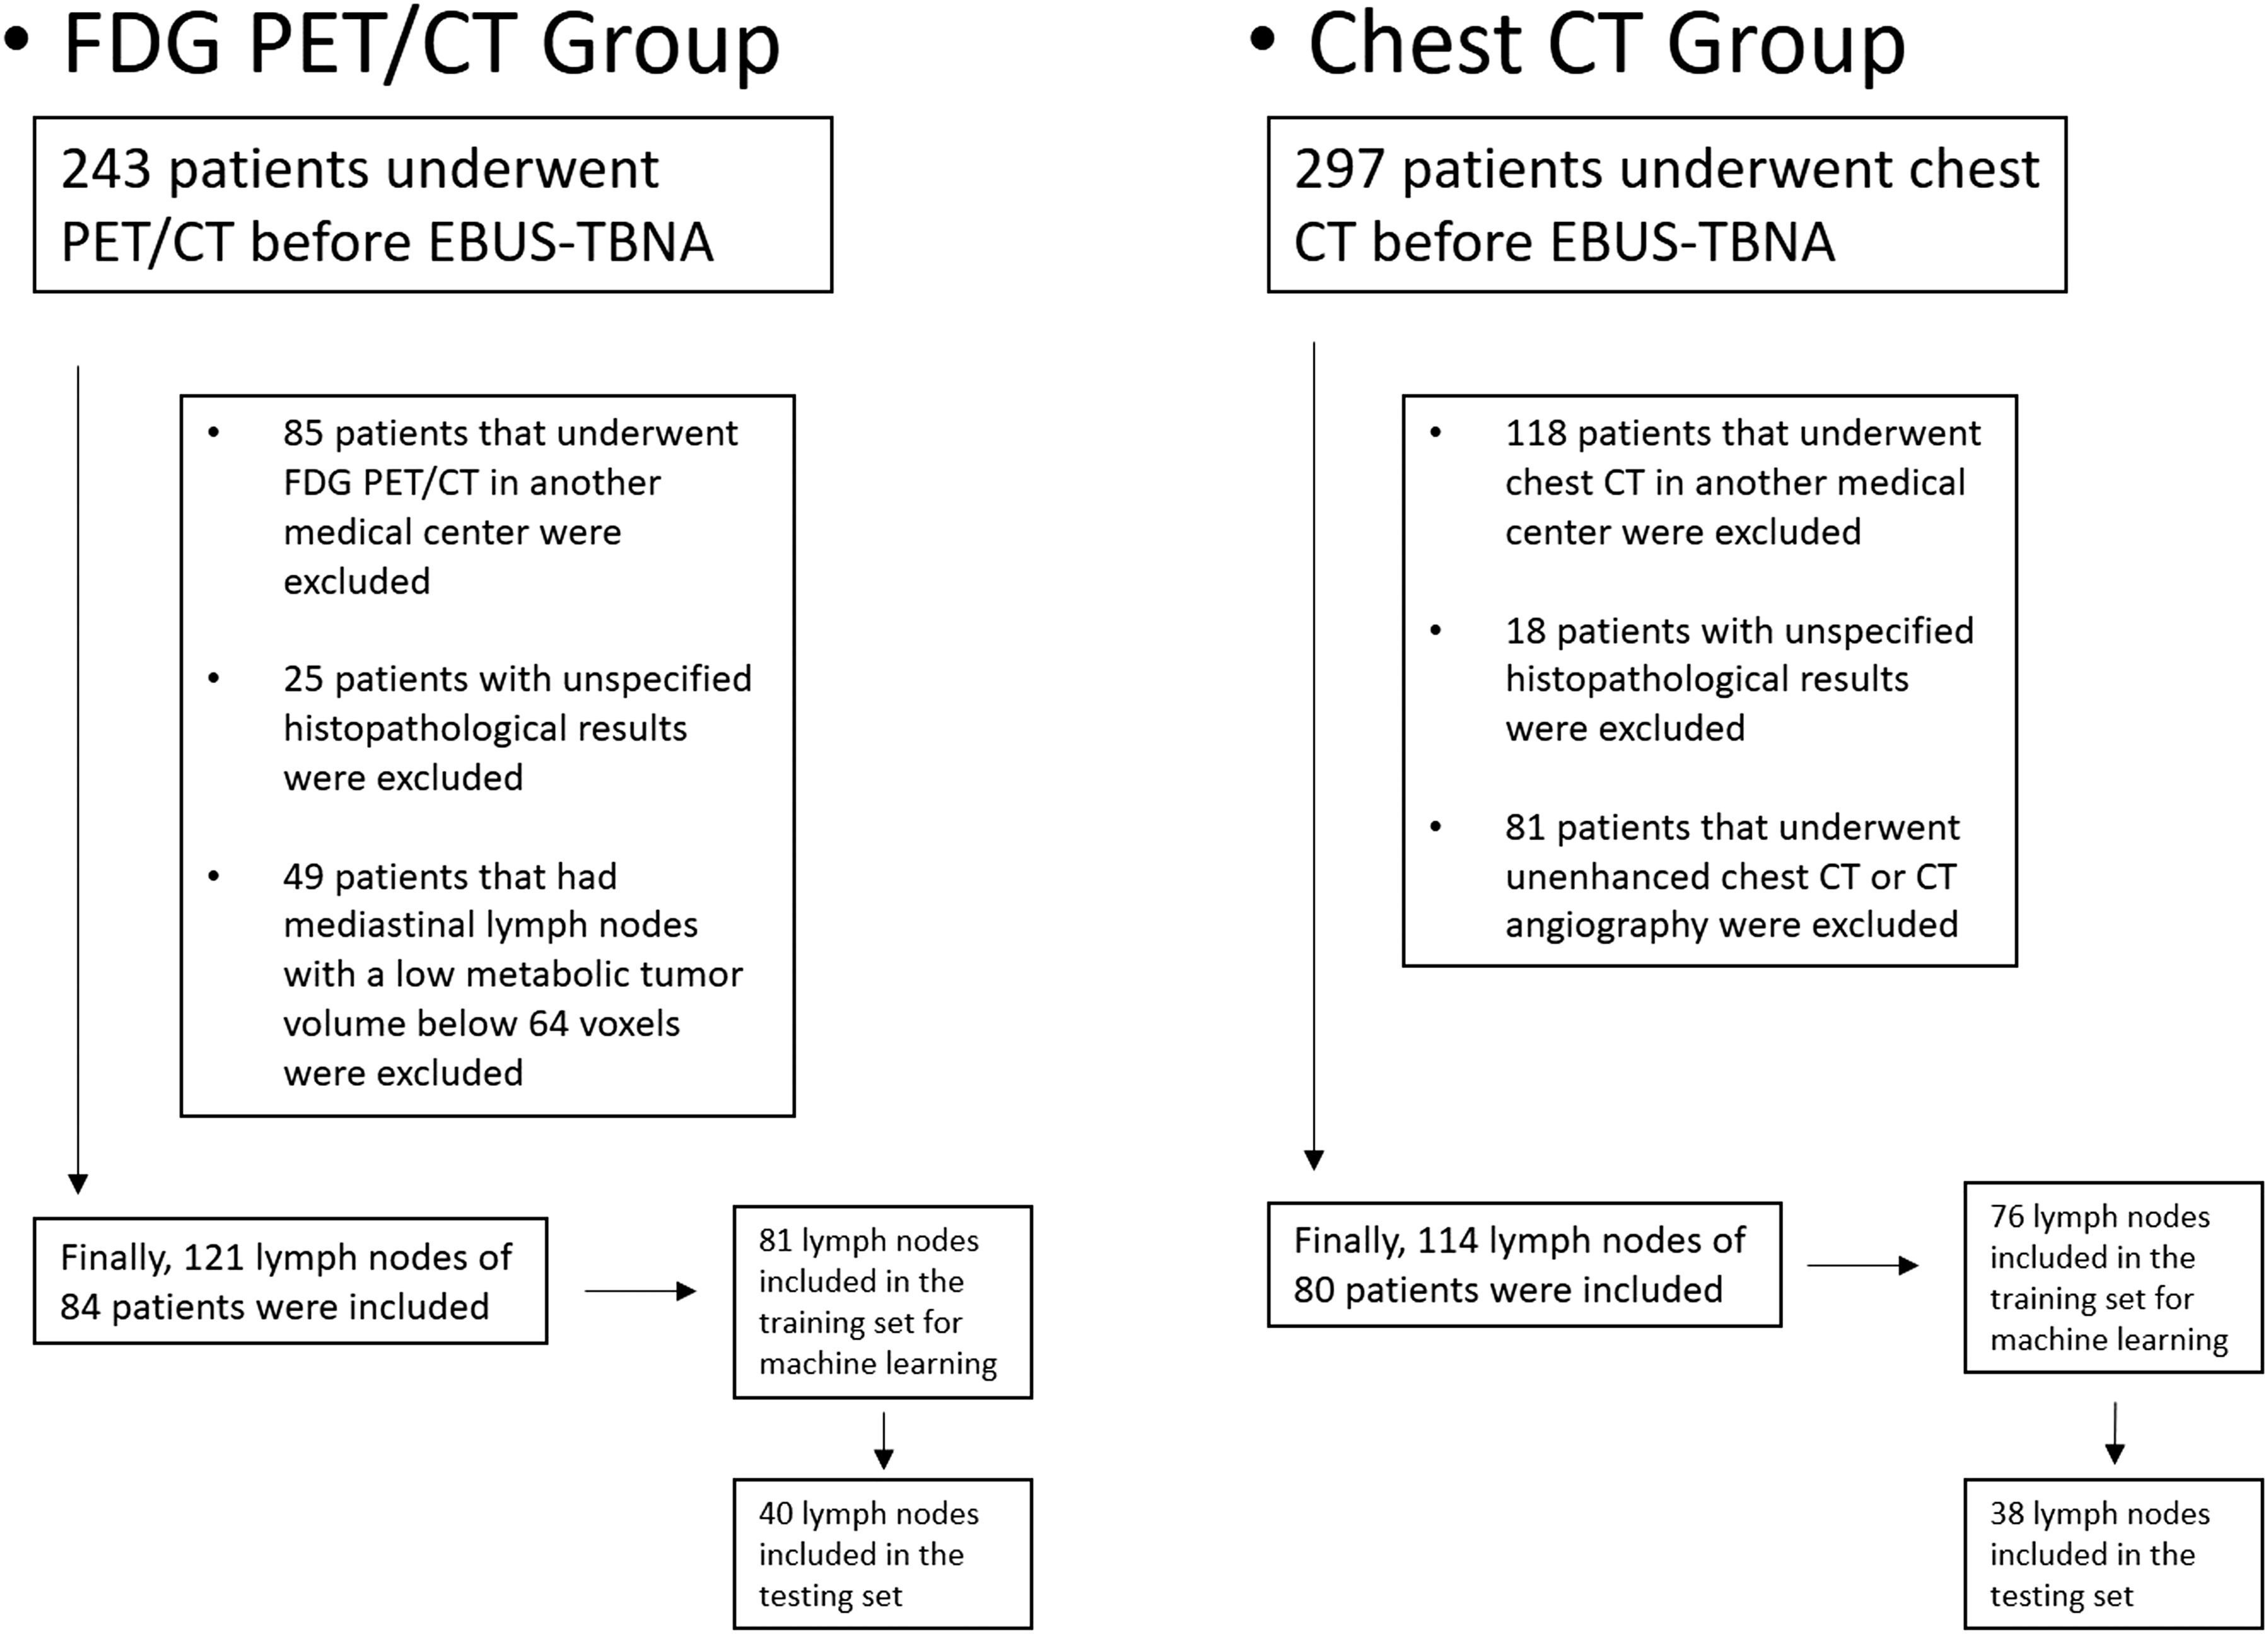
Flow chart and patient exclusion criteria.
FDG PET/CT imaging protocol
Imaging was performed using a combined PET/CT scanner (Philips Gemini TOF, 16 slices, Eindhoven, Netherlands). After 6 h of fasting, 0.11 mCi/kg F-18 FDG was administered to the patients intravenously using an automatic infusion device if blood sugar was <200 mg/dL. All the patients were weighed in the PET/CT unit on the day of their scan and rested for 1 h in a quiet room with no light. Then, first, unenhanced CT scanning was performed from the vertex to the upper thigh using the following parameters: matrix = 512 × 512; 120 kVp; 50 mAs; and slice thickness = 5 mm. This was followed by PET scanning performed from the vertex to the upper thigh (1.5 min/bed). PET images were obtained with the 3D acquisition mode under shallow breathing. The voxel size was 4 × 4 × 4 mm. The PET images were reconstructed with a row action maximum likelihood algorithm. Standardized uptake values were calculated by normalizing them according to the body weight of each patient (13).
Enhanced chest CT imaging protocol
All the patients underwent CT examinations of the chest or both the chest and upper abdomen following the intravenous injection of an anionic iodinated contrast medium at a rate of 3 mL/s. For the compensation of differences in the cardiac output of the patients, a region of interest (ROI) was placed on the aorta with the bolus tracking method. All the CT examinations were performed using one of the following multiple-row detector CT scanners: Brilliance CT 64-channel scanner and Brilliance CT 16-channel scanner (Philips Medical Systems, Eindhoven, the Netherlands). The CT acquisition parameters were as follows: tube setting = 120 kVp and 200–250 mAs; pitch = 0.75–1.0; section thickness = 2.0 mm; field of view = 35–40 cm; and matrix = 512 × 512.
FDG PET/CT texture analysis
FDG PET/CT texture analysis was performed using LIFEx version 6.3 software (lifexsoft.org) (14). A nuclear medicine physician with five years of PET/CT experience analyzed the images. Mediastinal lymph nodes with an FDG uptake higher than the mediastinal blood pool were drawn using a 3D ROI with the maximum standardized uptake (SUVmax) threshold of 40% obtained from the PET images. For the spatial resampling of the ROI, 4 × 4 × 4 mm spacing was used on the x, y, and z axes. A total of 64 gray levels were chosen for intensity discretization. For intensity rescaling, absolute scale bounds of 0–20 were chosen. Conventional features, namely gray-level co-occurrence matrix (GLCM), neighboring gray-level dependence matrix (NGLDM), gray-level run-length matrix (GLRLM), and gray-level zone-length matrix (GLZLM) (43 features in total), were extracted from the 3D ROI (Tables 1 and 2).
Meanings of the second-order texture features.
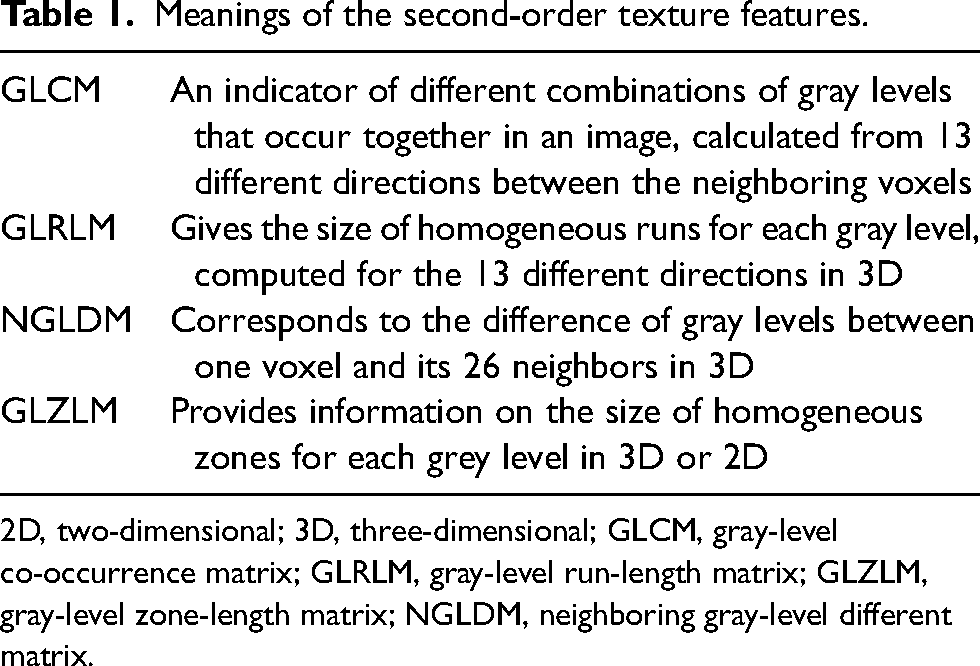
2D, two-dimensional; 3D, three-dimensional; GLCM, gray-level co-occurrence matrix; GLRLM, gray-level run-length matrix; GLZLM, gray-level zone-length matrix; NGLDM, neighboring gray-level different matrix.
Results of the LIFEx analysis of the FDG PET/CT texture features in the training set in the differentiation of benign and malignant lymph nodes.
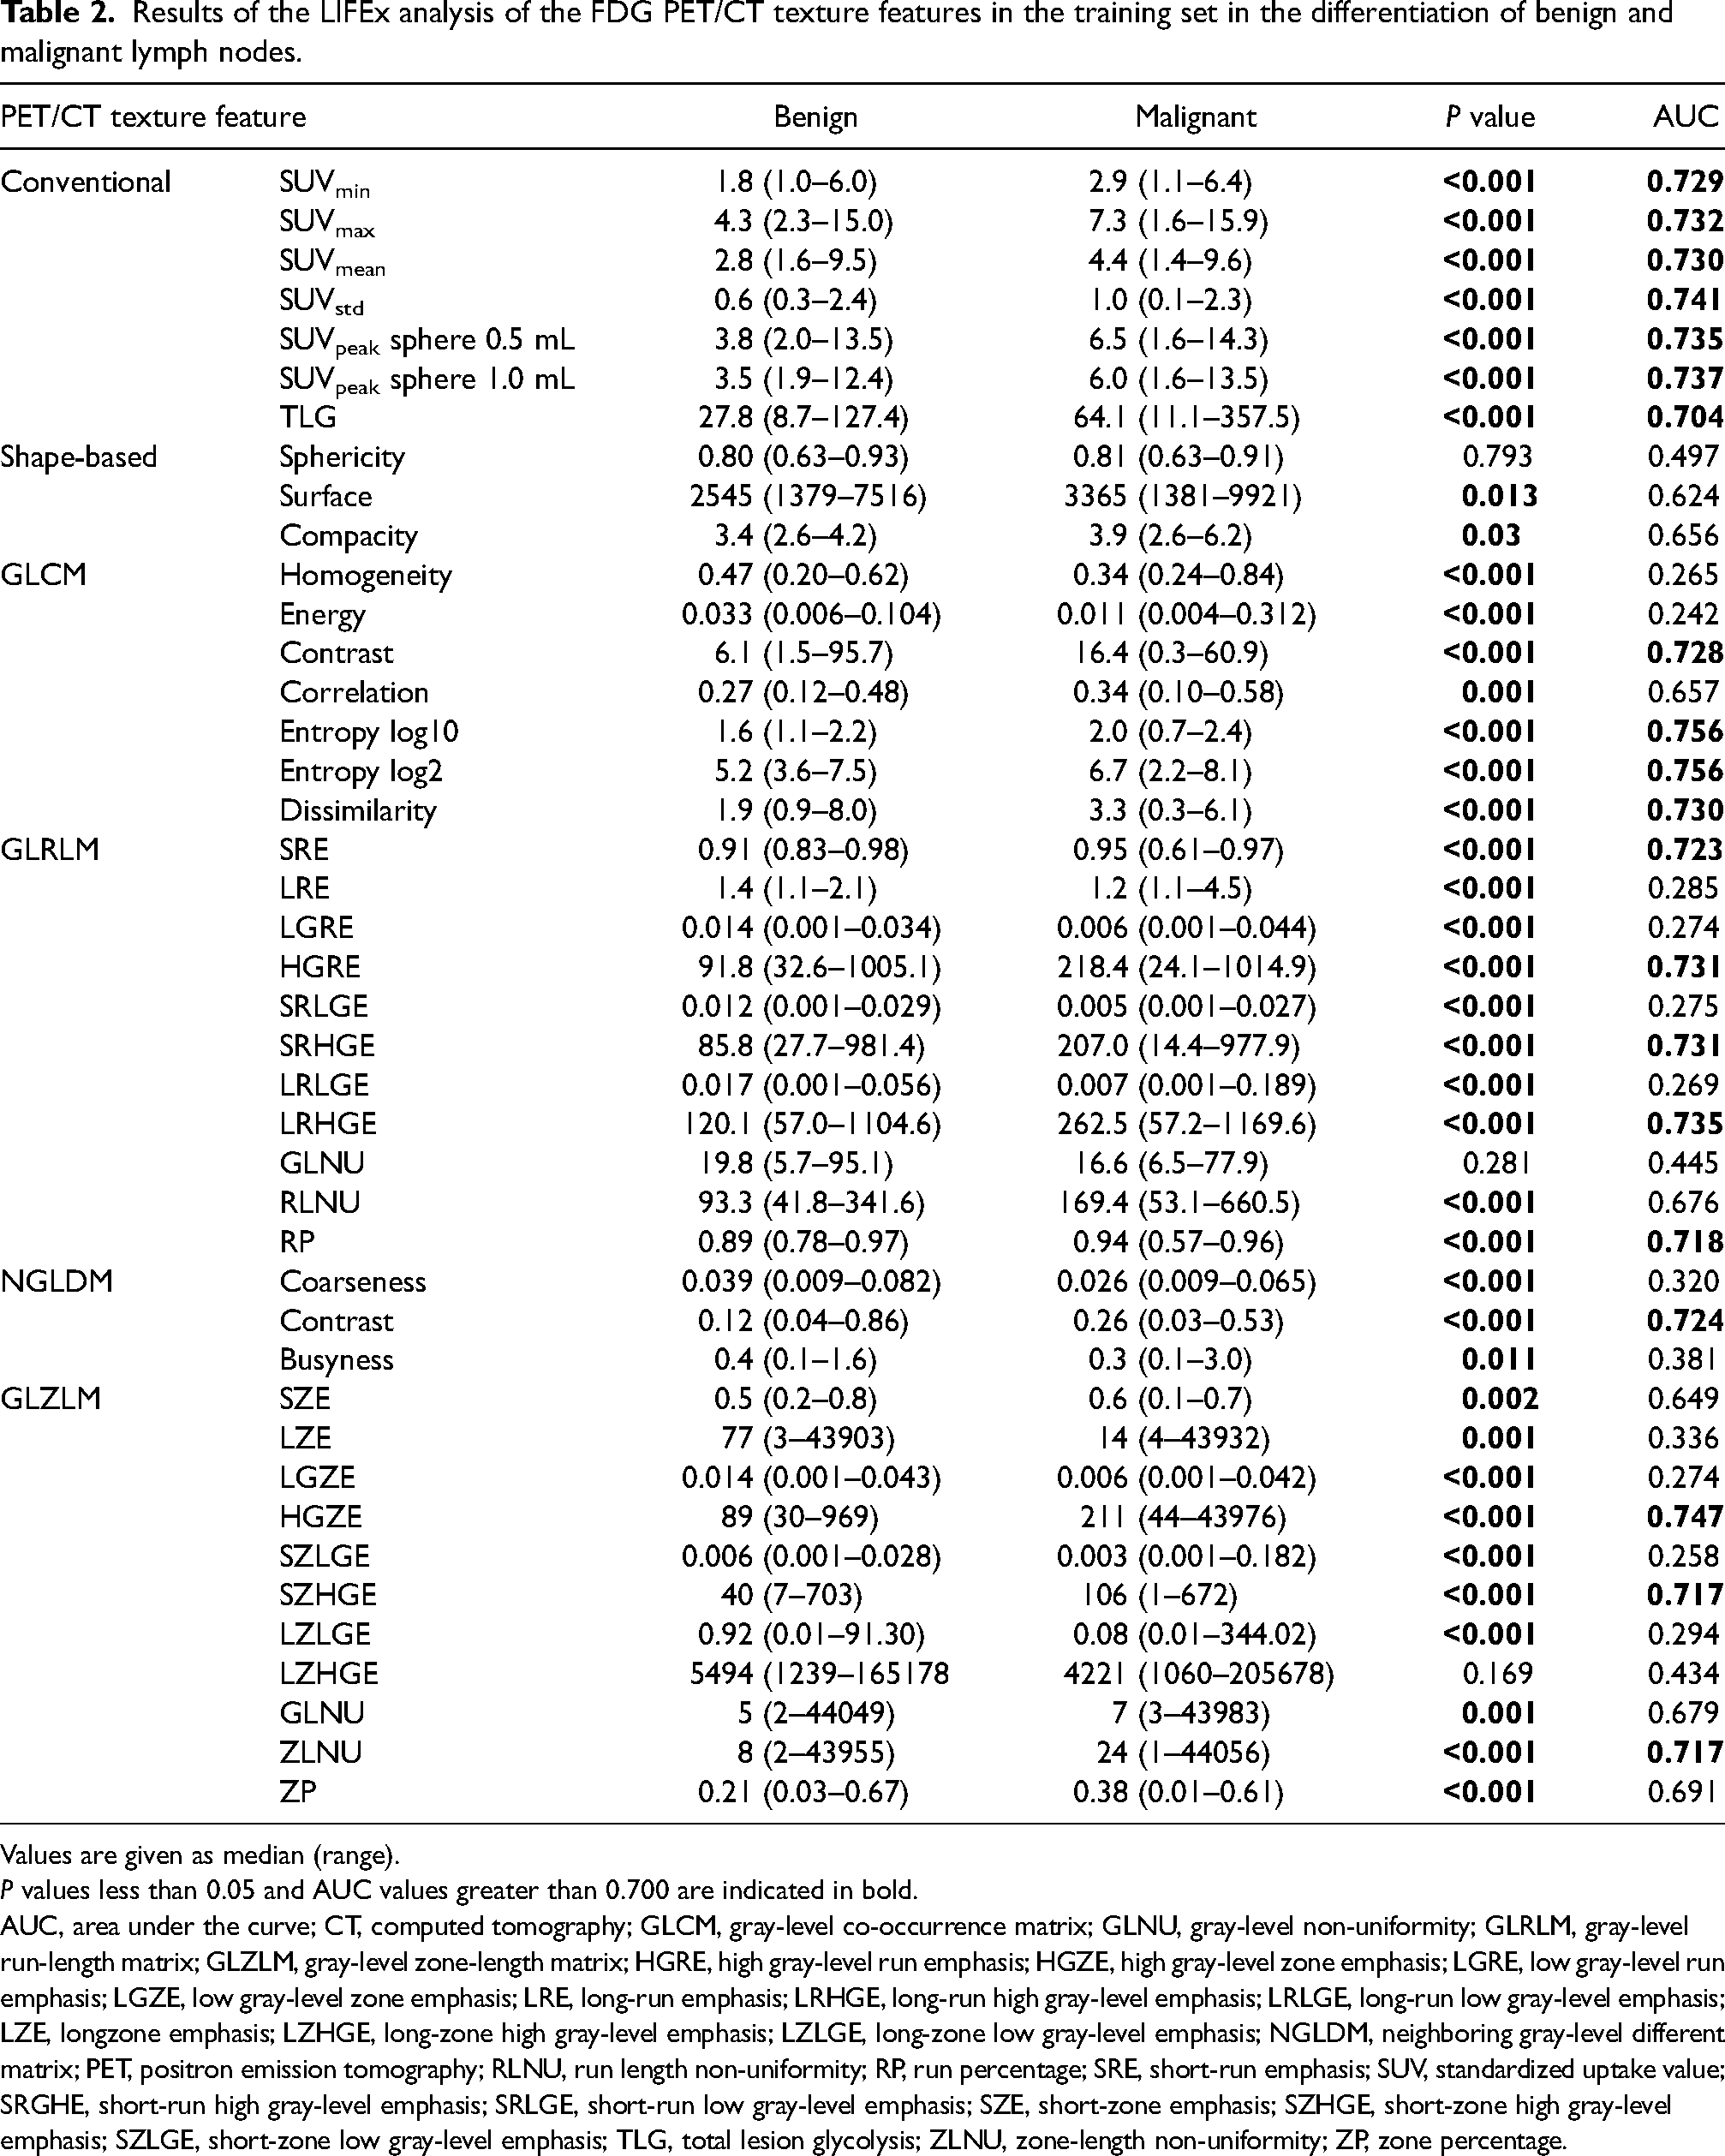
Values are given as median (range).
P values less than 0.05 and AUC values greater than 0.700 are indicated in bold. AUC, area under the curve; CT, computed tomography; GLCM, gray-level co-occurrence matrix; GLNU, gray-level non-uniformity; GLRLM, gray-level run-length matrix; GLZLM, gray-level zone-length matrix; HGRE, high gray-level run emphasis; HGZE, high gray-level zone emphasis; LGRE, low gray-level run emphasis; LGZE, low gray-level zone emphasis; LRE, long-run emphasis; LRHGE, long-run high gray-level emphasis; LRLGE, long-run low gray-level emphasis; LZE, longzone emphasis; LZHGE, long-zone high gray-level emphasis; LZLGE, long-zone low gray-level emphasis; NGLDM, neighboring gray-level different matrix; PET, positron emission tomography; RLNU, run length non-uniformity; RP, run percentage; SRE, short-run emphasis; SUV, standardized uptake value; SRGHE, short-run high gray-level emphasis; SRLGE, short-run low gray-level emphasis; SZE, short-zone emphasis; SZHGE, short-zone high gray-level emphasis; SZLGE, short-zone low gray-level emphasis; TLG, total lesion glycolysis; ZLNU, zone-length non-uniformity; ZP, zone percentage.
Results of the LIFEx analysis of the CT texture features in the training set in the differentiation of benign and malignant lymph nodes.
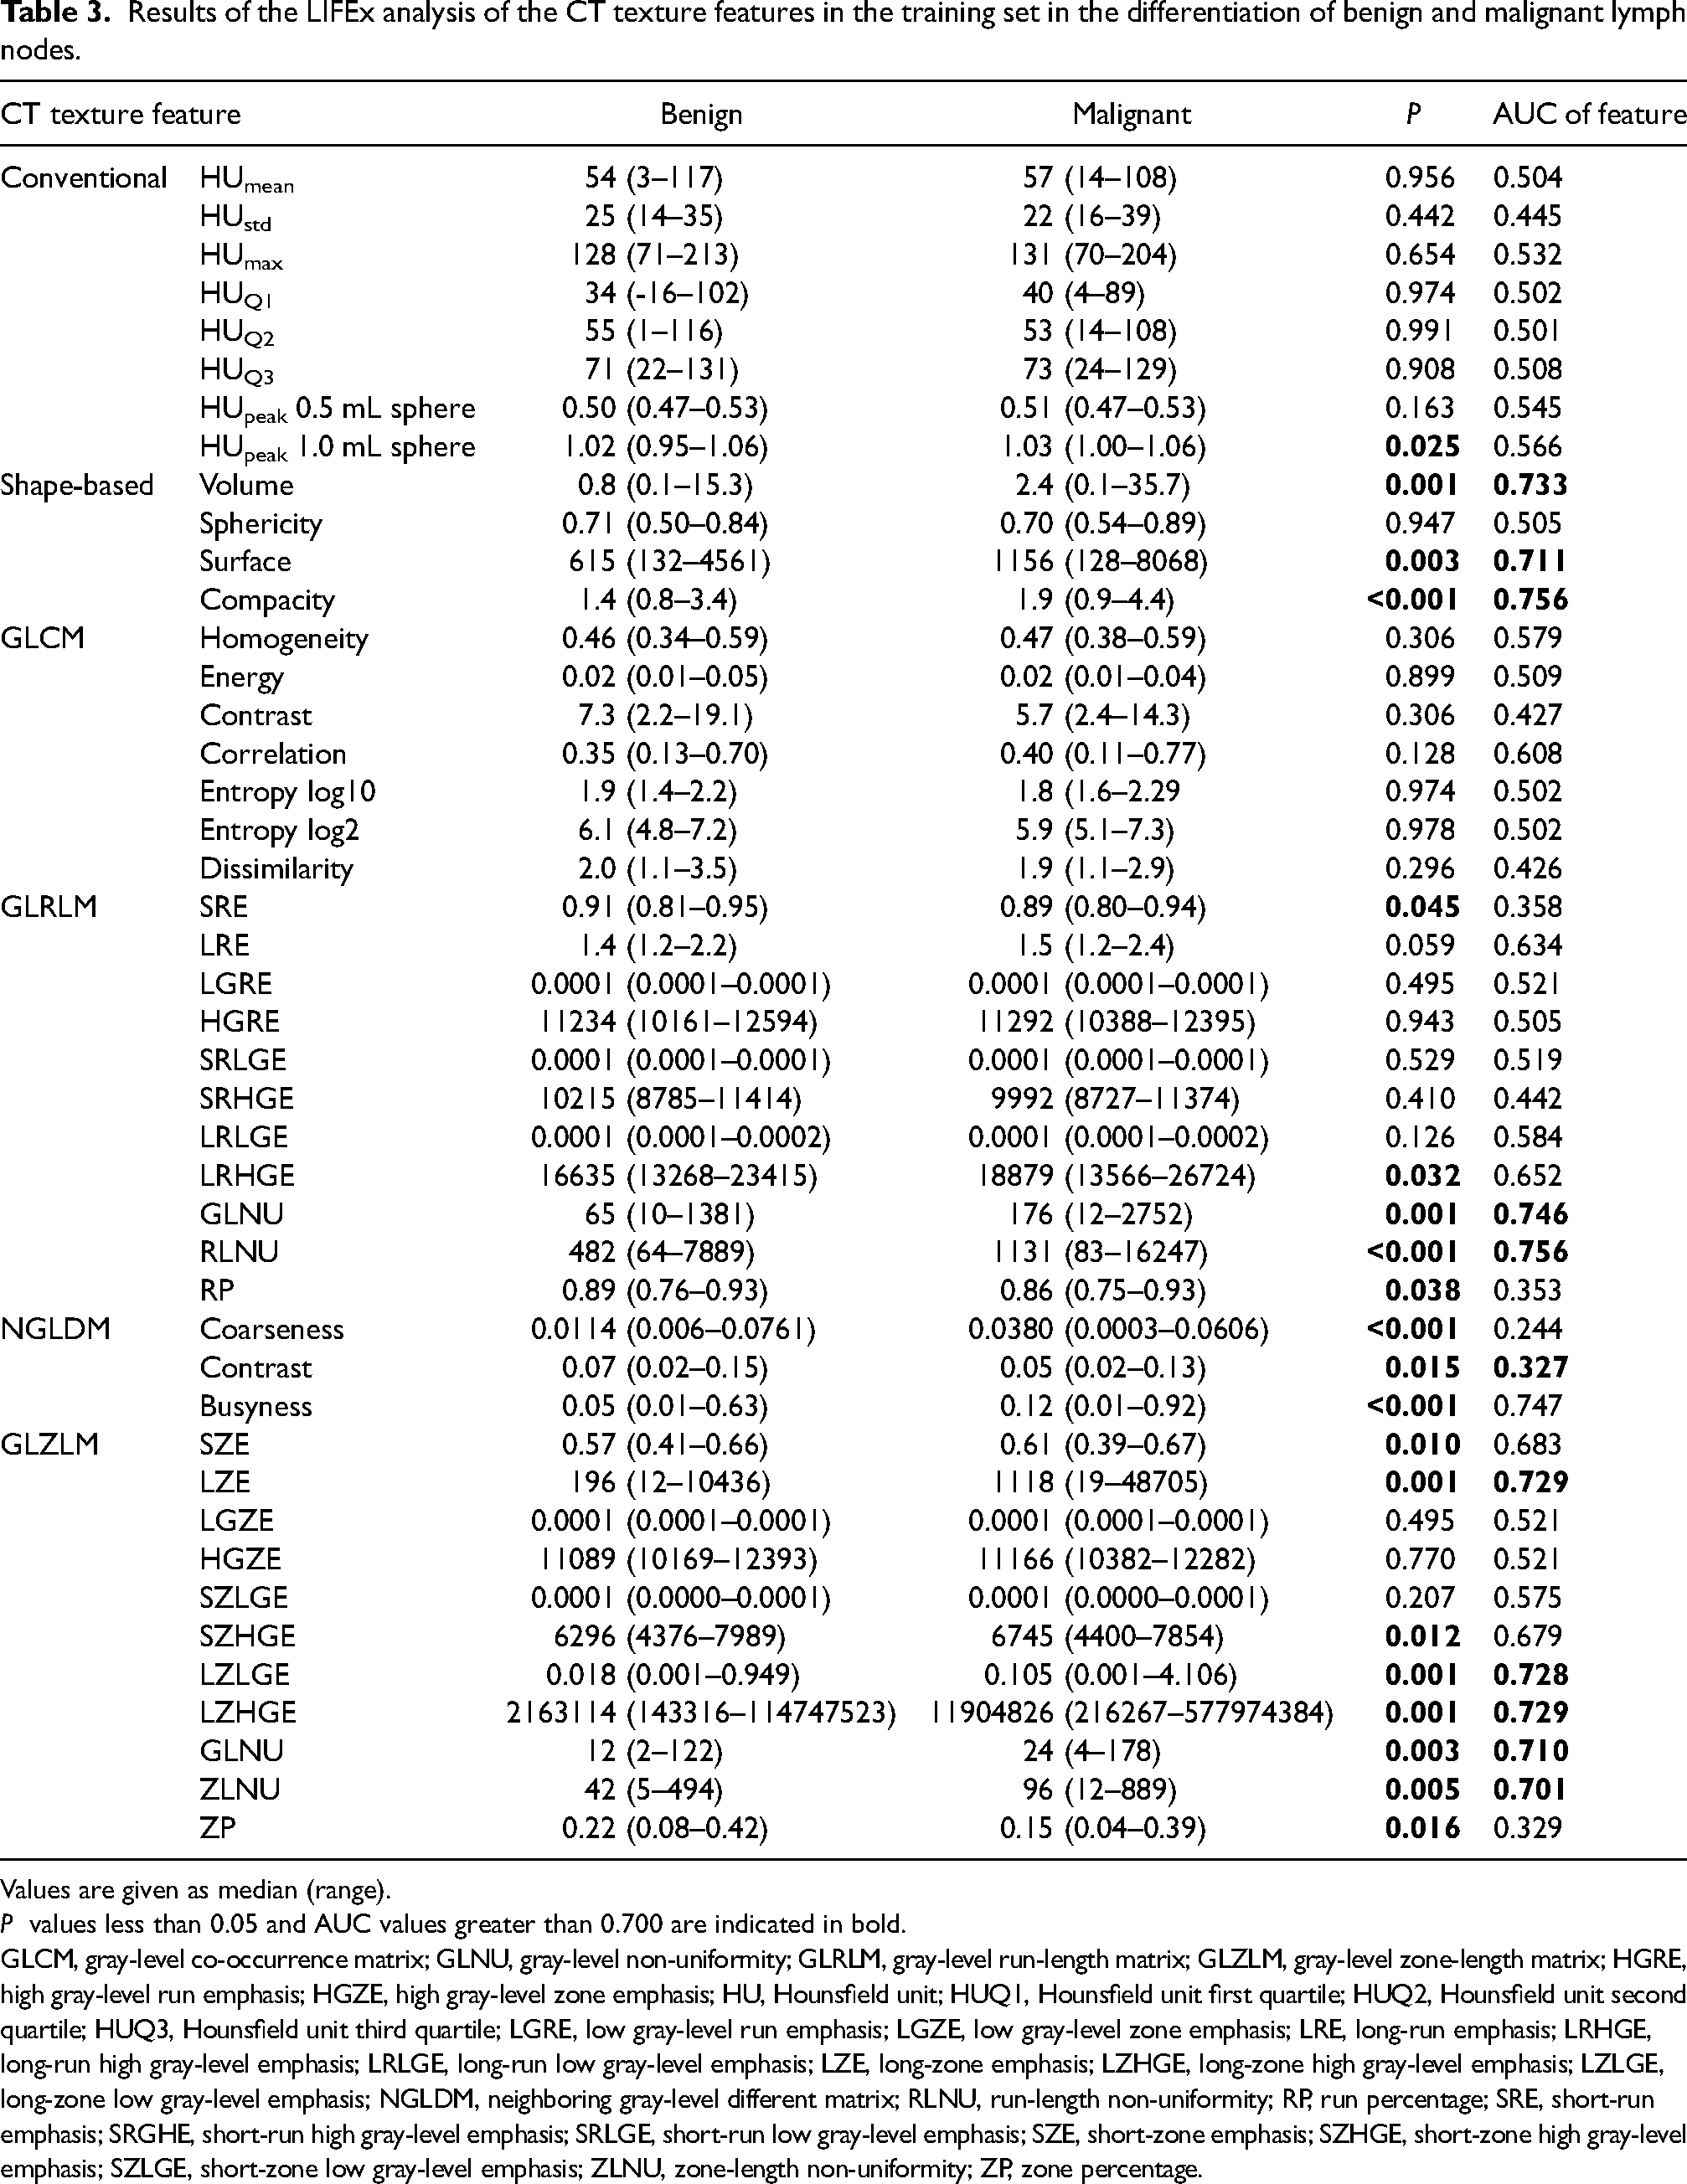
Values are given as median (range).
P values less than 0.05 and AUC values greater than 0.700 are indicated in bold. GLCM, gray-level co-occurrence matrix; GLNU, gray-level non-uniformity; GLRLM, gray-level run-length matrix; GLZLM, gray-level zone-length matrix; HGRE, high gray-level run emphasis; HGZE, high gray-level zone emphasis; HU, Hounsfield unit; HUQ1, Hounsfield unit first quartile; HUQ2, Hounsfield unit second quartile; HUQ3, Hounsfield unit third quartile; LGRE, low gray-level run emphasis; LGZE, low gray-level zone emphasis; LRE, long-run emphasis; LRHGE, long-run high gray-level emphasis; LRLGE, long-run low gray-level emphasis; LZE, long-zone emphasis; LZHGE, long-zone high gray-level emphasis; LZLGE, long-zone low gray-level emphasis; NGLDM, neighboring gray-level different matrix; RLNU, run-length non-uniformity; RP, run percentage; SRE, short-run emphasis; SRGHE, short-run high gray-level emphasis; SRLGE, short-run low gray-level emphasis; SZE, short-zone emphasis; SZHGE, short-zone high gray-level emphasis; SZLGE, short-zone low gray-level emphasis; ZLNU, zone-length non-uniformity; ZP, zone percentage.
Contrast-enhanced chest CT texture analysis
Segmentation of the lymph node was performed using LIFEx version 6.3 software (lifexsoft.org) (14). A chest radiologist with six years of thoracic imaging experience analyzed the images. A 3D ROI was manually drawn around the entire lymph node slice-by-slice. Solid areas of the lesion were included, excluding regions related to the beam-hardening artifact, calcifications, and vessels. In the CT texture analysis, 400 bins were selected for the number of gray levels, and their Hounsfield units (HU) were in the range of −1000 to 3000 for intensity rescaling, as described in the literature (15). For the spatial resampling of the ROI, 0.8 × 0.8 × 2 mm spacing was used on the x, y, and z axes. Conventional parameters, namely GLCM, NGLDM, GLRLM, and GLZLM (44 features in total), were extracted from the 3D ROI (Table 3).
Patient and lymph node characteristics, imaging indications, and results of EBUS-TBNA.
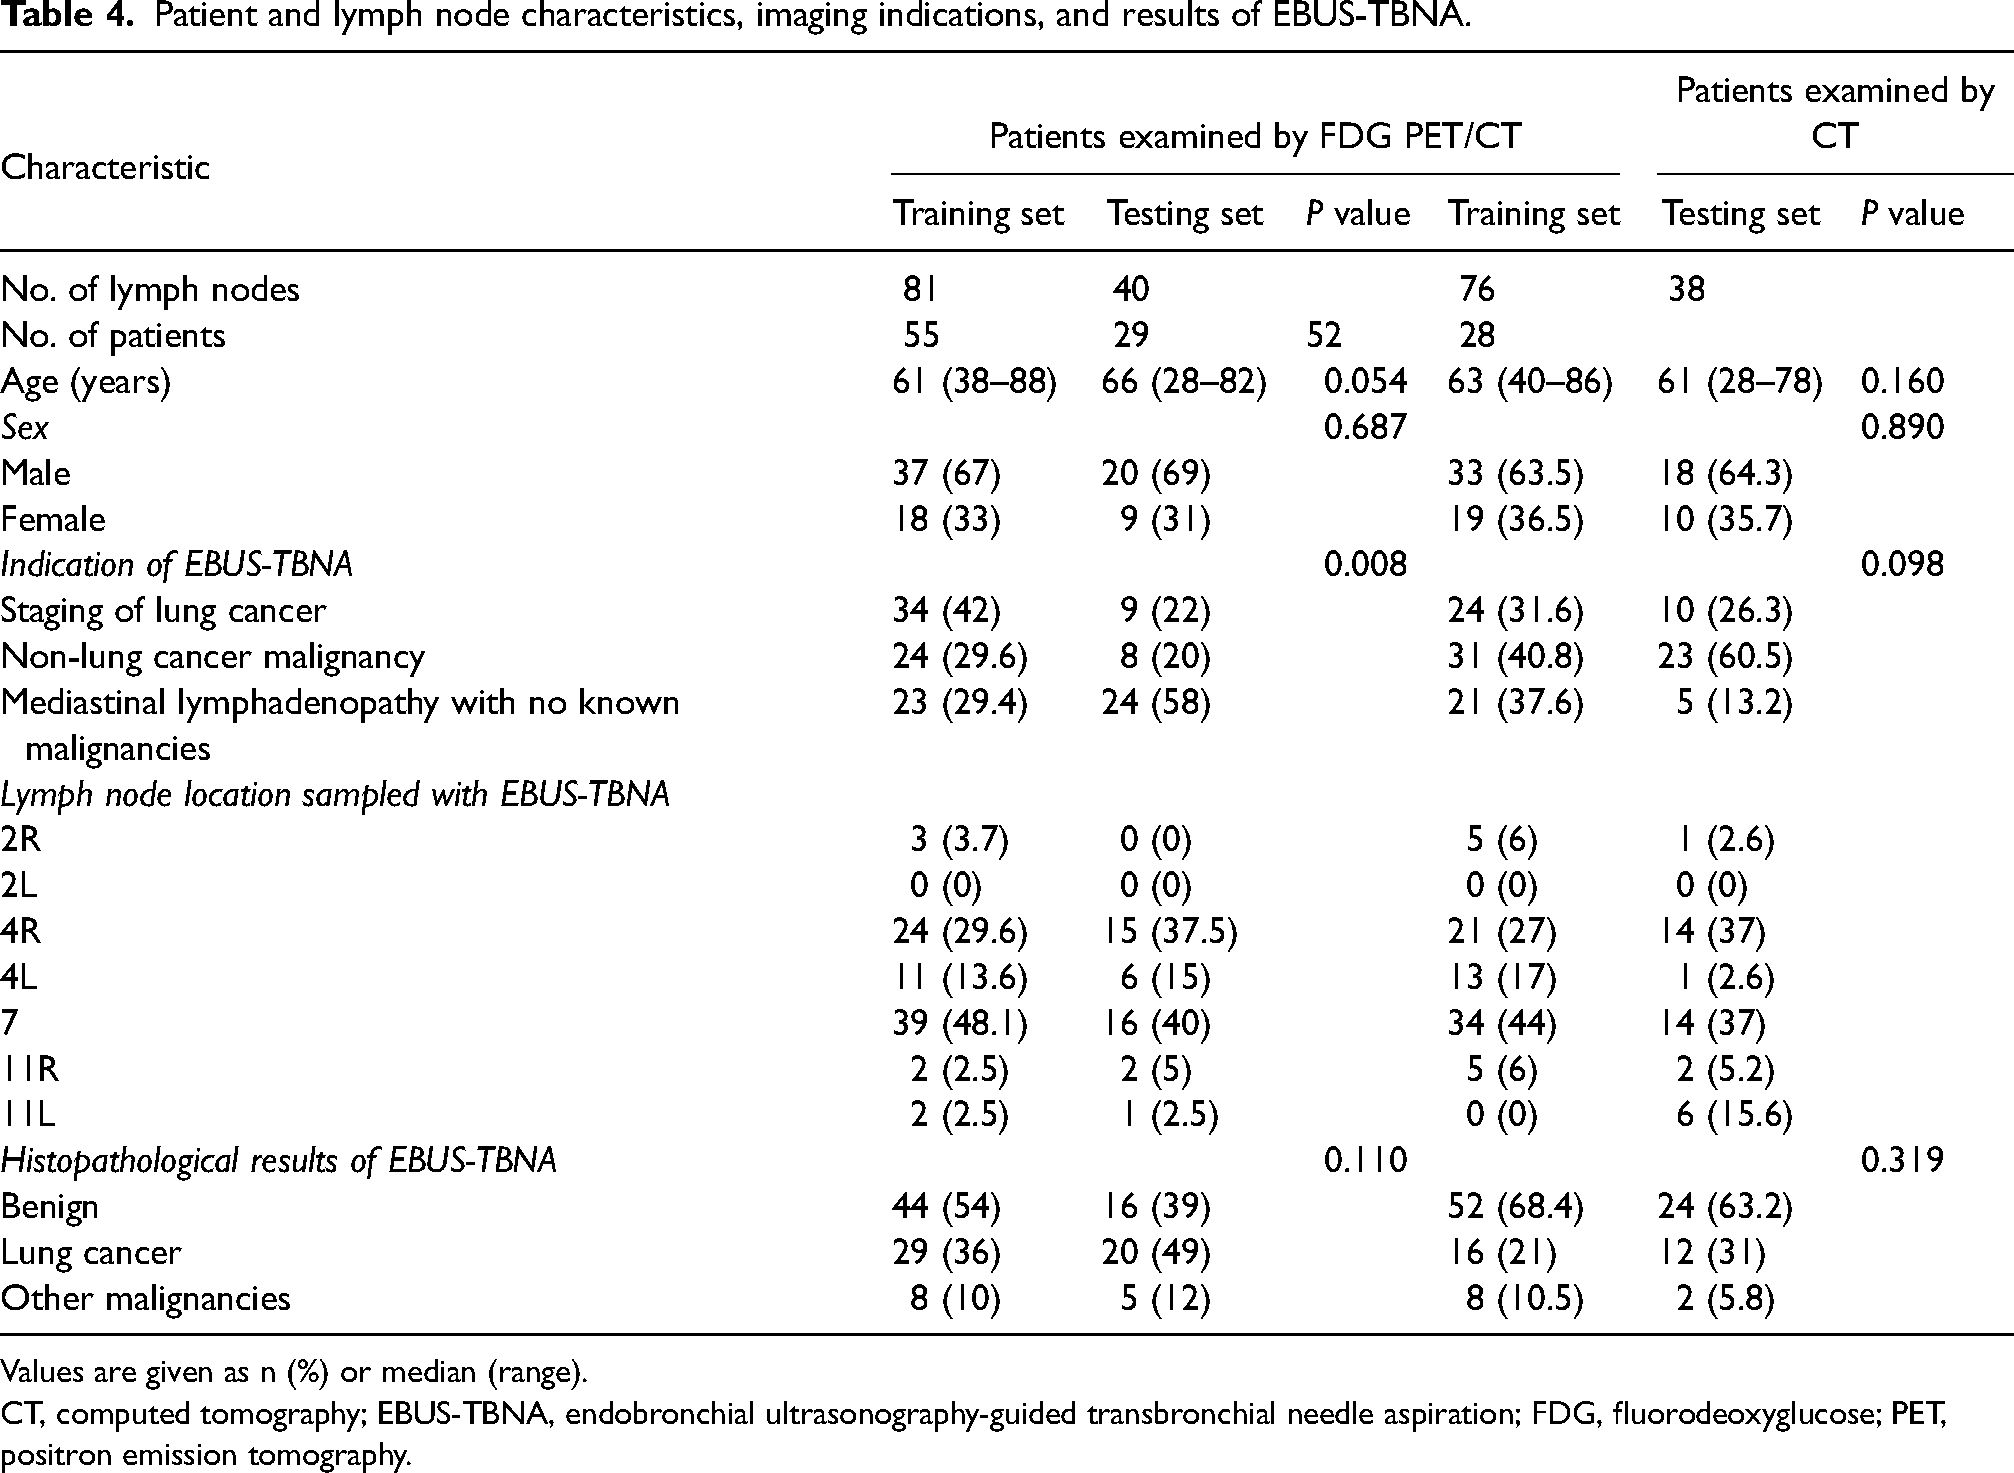
Values are given as n (%) or median (range).
CT, computed tomography; EBUS-TBNA, endobronchial ultrasonography-guided transbronchial needle aspiration; FDG, fluorodeoxyglucose; PET, positron emission tomography.
Statistical analysis
All statistical analyses were performed using SPSS software version 24 (IBM Corp., Armonk, NY, USA). P values <0.05 were considered statistically significant in all analyses.
The patient data were randomly divided into the training (67% of all patients) and testing (33% of all patients) sets. The chi-square test was used in the analysis of categorical variables. The Kolmogorov–Smirnov test was used to determine the normality of data distribution. Due to the non-normal distribution of the texture features, the Mann–Whitney U test was performed to compare features between the benign and malignant lymph nodes. Significantly different features were analyzed with the receiver operating characteristic (ROC) curve. The features with an area under the curve (AUC) value >0.7 were analyzed using Spearman‘s correlation coefficient, and those with a correlation coefficient “r” value <0.6 were selected for advanced modeling stages to prevent overfitting (16). The Waikato Environment for Knowledge Analysis, University of Waikato data mining software was used to create predictive models. The random forest, naive Bayes, support vector machine (SVM), k-nearest neighbor, decision tree, logistic regression, and neural network algorithms were used in the training set with 10-fold cross-validation. Then, the power of the models was determined with the testing set. Next, SUVmax was added to the PET models and the short-axis diameters of the lymph nodes were added to the CT models to investigate the changes in the diagnostic power of the models. The Kruskal–Wallis test was performed to determine whether the investigated features differed in small cell lung cancer (SCLC), lung adenocarcinoma, and lung squamous cell carcinoma (SCC) metastases in lymph nodes.
Results
The sample included 121 lymph nodes of the 84 patients enrolled in the FDG PET/CT group and 114 lymph nodes of the 80 patients enrolled in the enhanced chest CT group. In the FDG PET/CT group, the mean SUVmax of the lymph nodes was 6.5 ± 3.4. In the CT group, the mean short-axis diameter of the lymph nodes was 13.7 ± 6.7 mm. The detailed patient and lymph node characteristics are presented in Table 4.
PET/CT training set
The mean time interval between PET/CT and EBUS-TBNA was 19.4 days (range = 1–83 days). In total, 81 lymph nodes in 55 patients were analyzed in the PET/CT training group. Of them, 44 (54%) lymph nodes were benign according to the histopathological analysis. There were 29 (36%) lymph nodes with lung cancer metastases and 8 (10%) with non-lung cancer metastases (Table 4). In the lung cancer metastasis subgroup, 6 (21%) lymph nodes were identified as SCLC, 5 (17%) as adenocarcinoma, and 16 (55%) as SCC. Two lymph nodes (7%) were lung cancer metastases other than SCLC, adenocarcinoma, or SCC.
PET/CT testing set
A total of 40 lymph nodes in 29 patients were analyzed in the PET/CT testing group. Of them, 16 (39%) were benign in the histopathological analysis. There were 20 (49%) lymph nodes with lung cancer metastases and 5 (12%) with non-lung cancer metastases (Table 4). In the lung cancer metastasis subgroup, 2 (10%) lymph nodes were SCLCs, 9 (45%) were adenocarcinomas, and 9 (45%) were SCCs.
CT training set
The mean time interval between CT and EBUS-TBNA was 25 days (range = 5–86 days). A total of 76 lymph nodes in 52 patients were analyzed in the CT training set. Of them, 52 (68.4%) lymph nodes were benign according to the histopathological analysis. There were 16 (21%) lymph nodes with lung cancer metastases and 8 (10.5%) with non-lung cancer metastases (Table 4). In the lung cancer metastasis subgroup, 2 (25%) lymph nodes were determined as SCLC, 1 (6%) as adenocarcinoma, and 11 (69%) as SCC.
CT testing set
In total, 38 lymph nodes in 28 patients were analyzed in the CT testing test. Of them, 24 (63.2%) were benign in the histopathological analysis. There were 12 (31%) lymph nodes with lung cancer metastases and 2 (5.8%) with non-lung cancer metastases (Table 4). None of the lymph nodes in the lung cancer metastasis subgroup were SCLC, while 4 (33%) were adenocarcinomas and 6 (50%) were SCCs. Lastly, 2 (17%) lymph nodes were lung cancer metastases other than SCLC but unspecified.
Radiomic analysis and machine learning
In the PET/CT training set, seven conventional features, two shape-based features, seven GLCM features, 10 GLRLM features, three NGLDM features, and 10 GLZLM features significantly differed between the benign and malignant lymph nodes (Table 2). According to the steps described in the methods section, five features (TLG, GLRLM_SRE, GLRLM_RP, NGLDM_Contrast, and GLZLM_ZLNU) were included in the machine learning algorithms. Seven machine learning algorithms were evaluated, and their diagnostic results are shown in Tables 5 and 6 for the PET/CT radiomic results. The decision tree was the method with the highest accuracy in the testing set (73.8%). Naive Bayes was the method with the highest AUC value (0.756). After obtaining these results, we added SUVmax, a conventional PET parameter commonly used to distinguish benign from malignant mediastinal lymph nodes (17–19), to the models. Before this step, we performed the ROC analysis of SUVmax and determined 5.7 as the cutoff value (AUC = 0.732, sensitivity = 70.3%, specificity = 66%, positive predictive value [PPV] = 63.4%, negative predictive value [NPV] = 72.5%, and accuracy = 67.9%). After the addition of SUVmax to the models, the diagnostic performance of SVM and naive Bayes were observed to increase in the testing set (Table 6).
Diagnostic performance of different machine learning methods in the training set for FDG PET/CT.
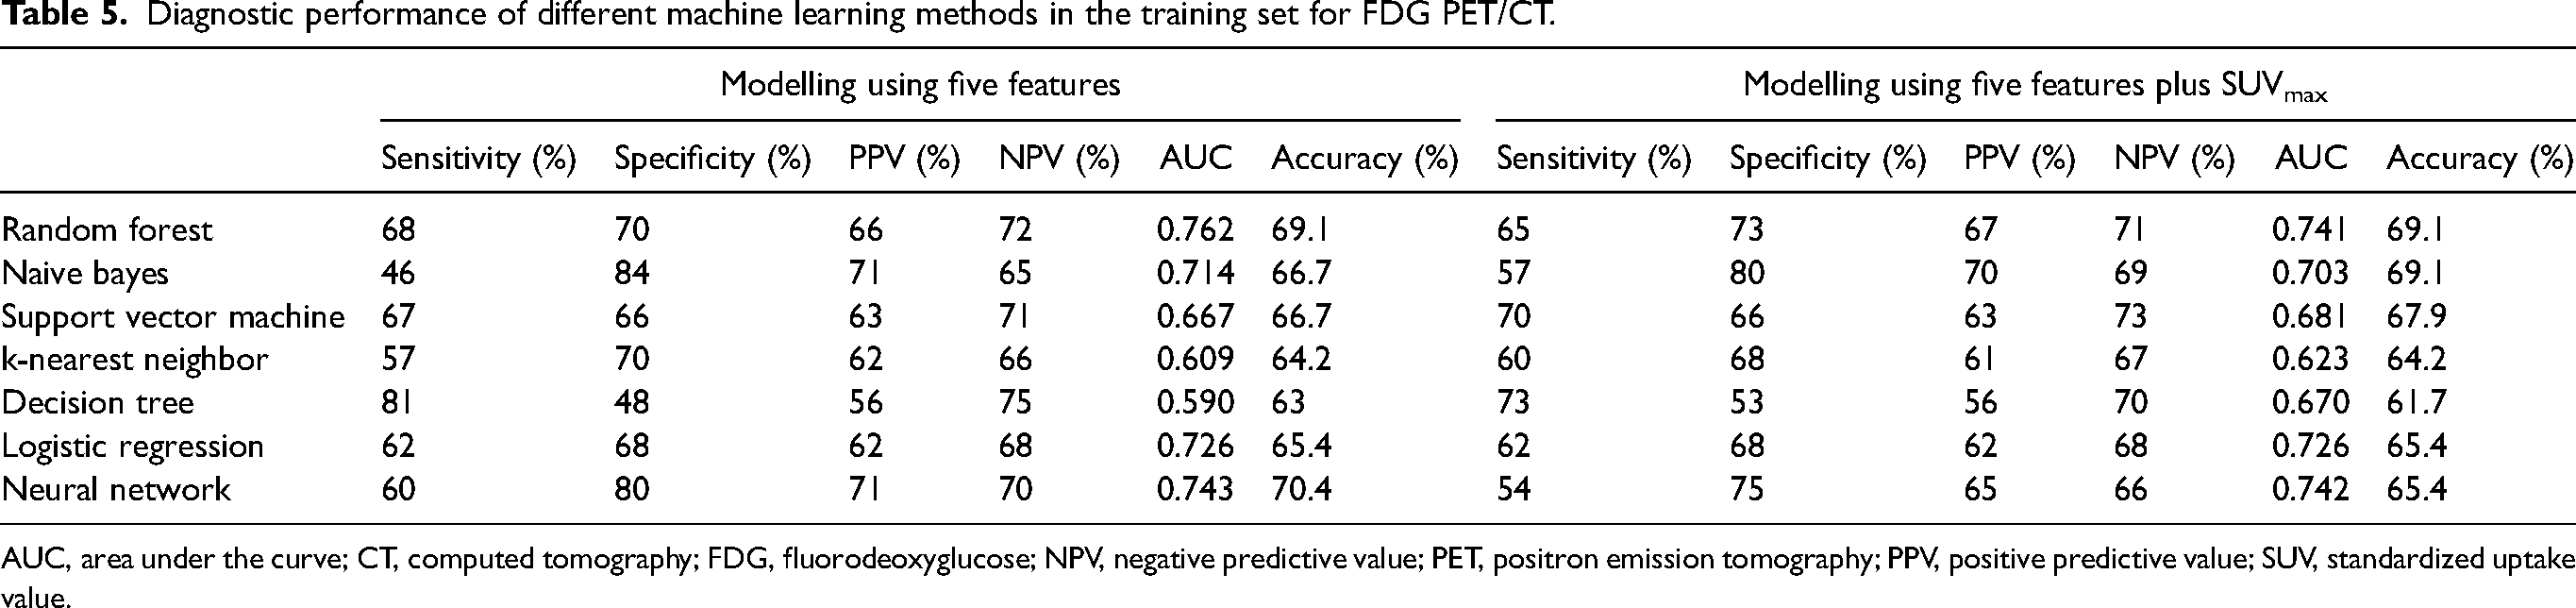
AUC, area under the curve; CT, computed tomography; FDG, fluorodeoxyglucose; NPV, negative predictive value; PET, positron emission tomography; PPV, positive predictive value; SUV, standardized uptake value.
Diagnostic performance of different machine learning methods in the testing set for FDG PET/CT.
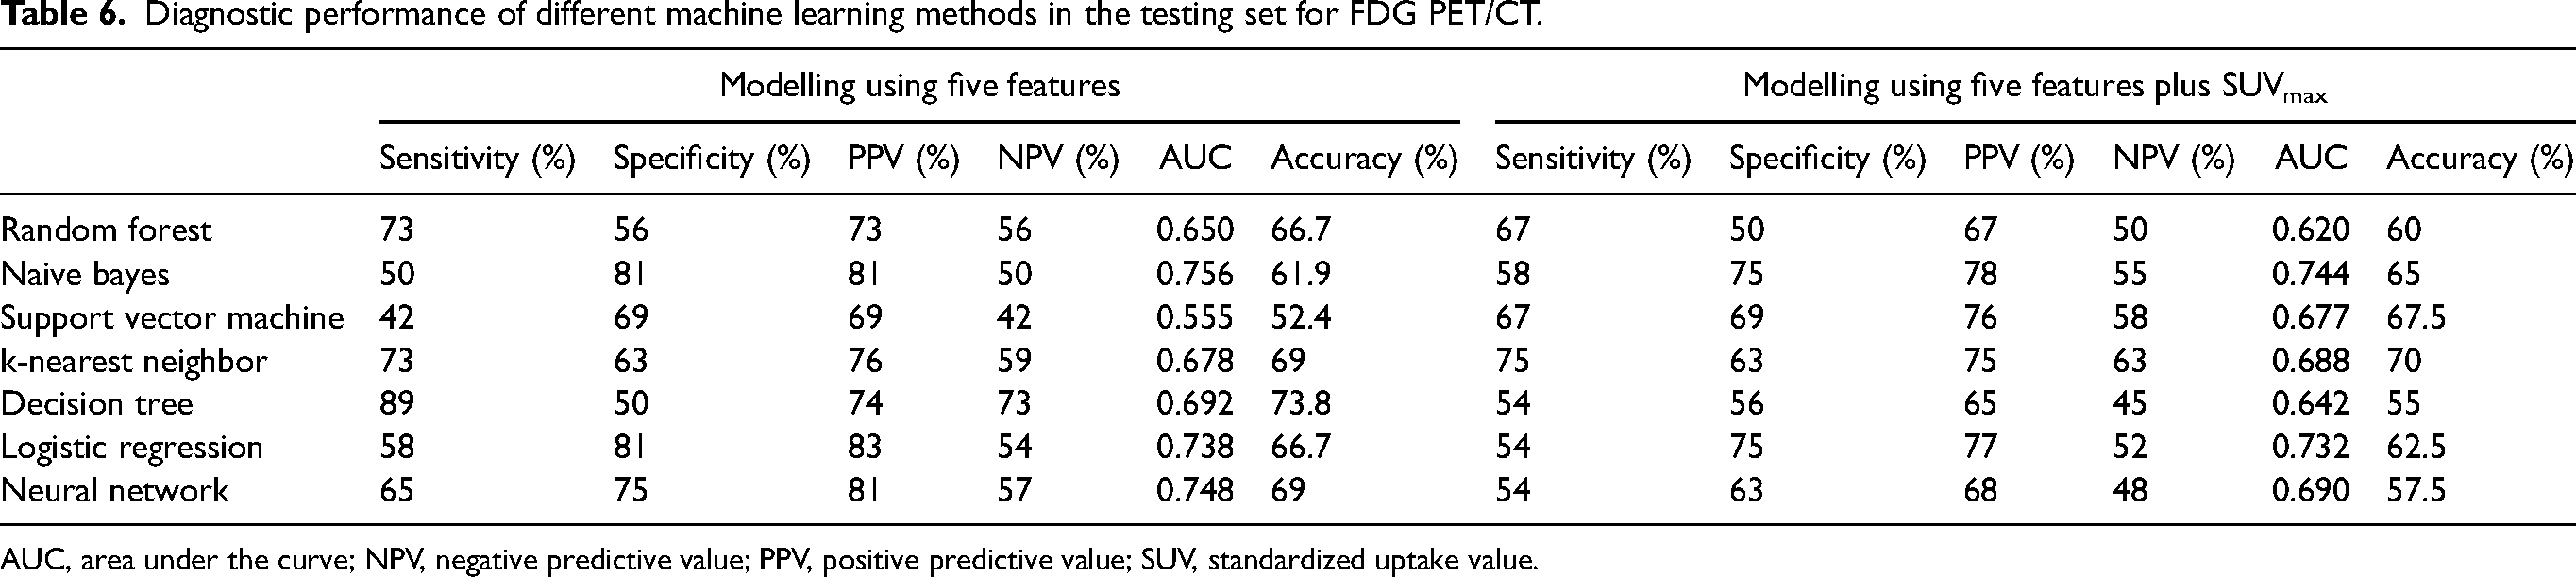
AUC, area under the curve; NPV, negative predictive value; PPV, positive predictive value; SUV, standardized uptake value.
In the CT training set, one conventional feature, three shape-based features, five GLRLM features, three NGLDM features, and eight GLZLM features significantly differed between the benign and malignant lymph nodes (Table 3). As explained above, five features (Shape_Surface, GLRLM_RLNU, GLZLM_ZP, GLZLM_ZLNU, and NGLDM_Busyness) were included in the machine learning algorithms. Seven machine learning algorithms were evaluated, and their diagnostics for the CT radiomic results are given in Tables 7 and 8. Naive Bayes was the method with the highest accuracy in the testing set (63.2%). Logistic regression was the method with the highest AUC value (0.631). After this step, we added the short-axis diameter of the lymph nodes to the models as numeric values and determined that the diagnostic performance of the naive Bayes, logistic regression, and neural network algorithms increased in the testing set (Table 8).
Diagnostic performance of different machine learning methods in the training set for contrast-enhanced chest CT.
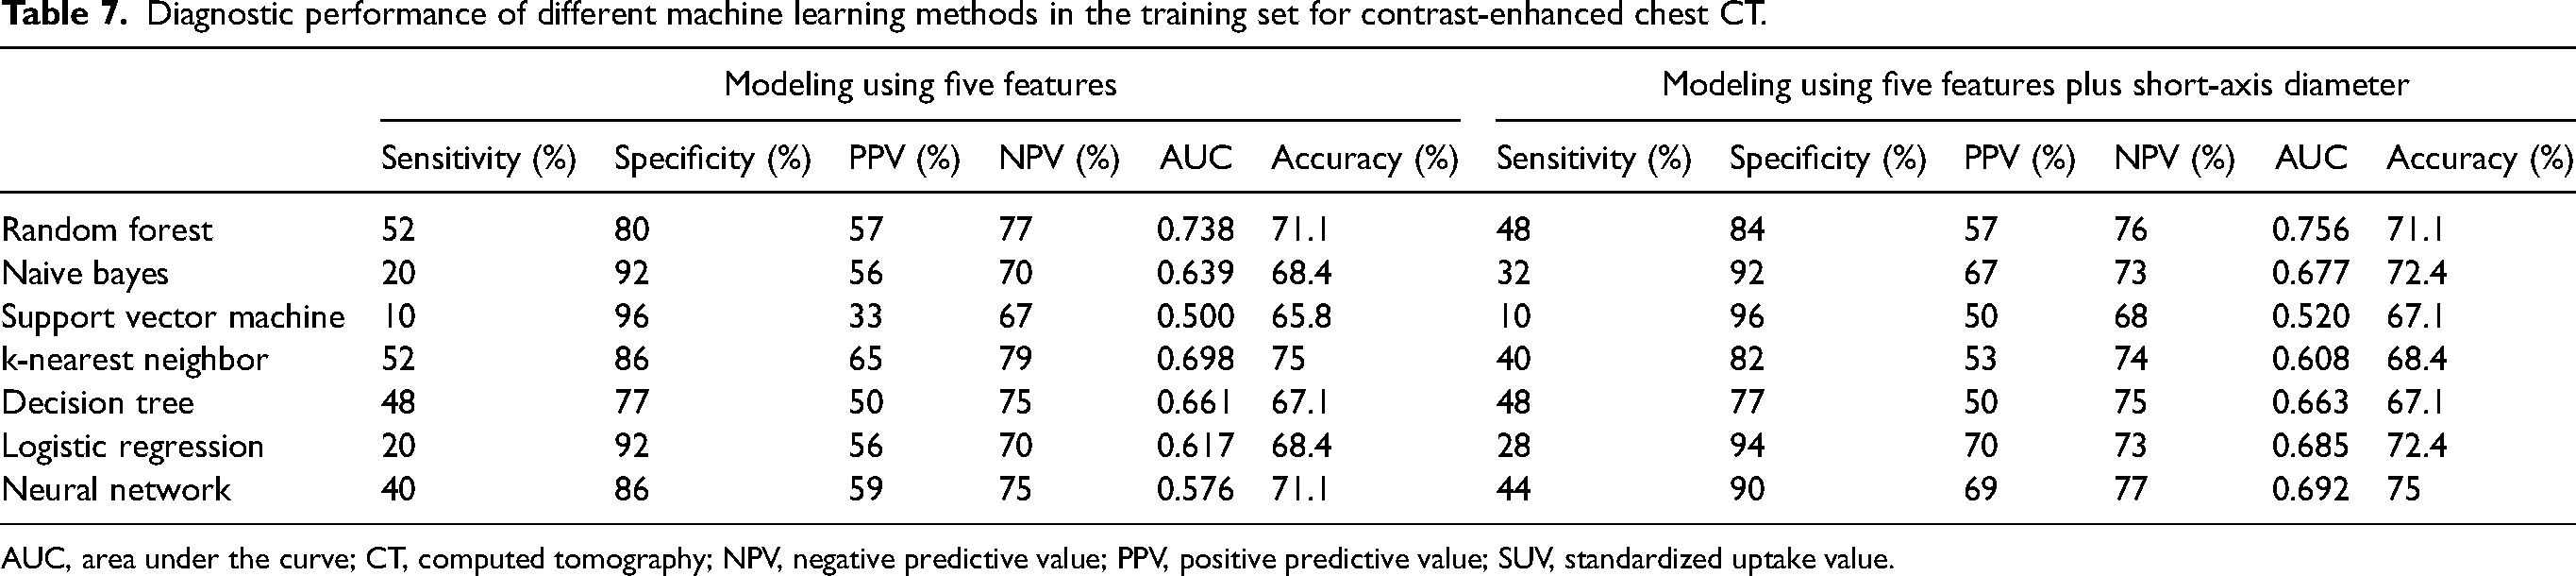
AUC, area under the curve; CT, computed tomography; NPV, negative predictive value; PPV, positive predictive value; SUV, standardized uptake value.
Diagnostic performance of different machine learning methods in the testing set for contrast-enhanced chest CT.
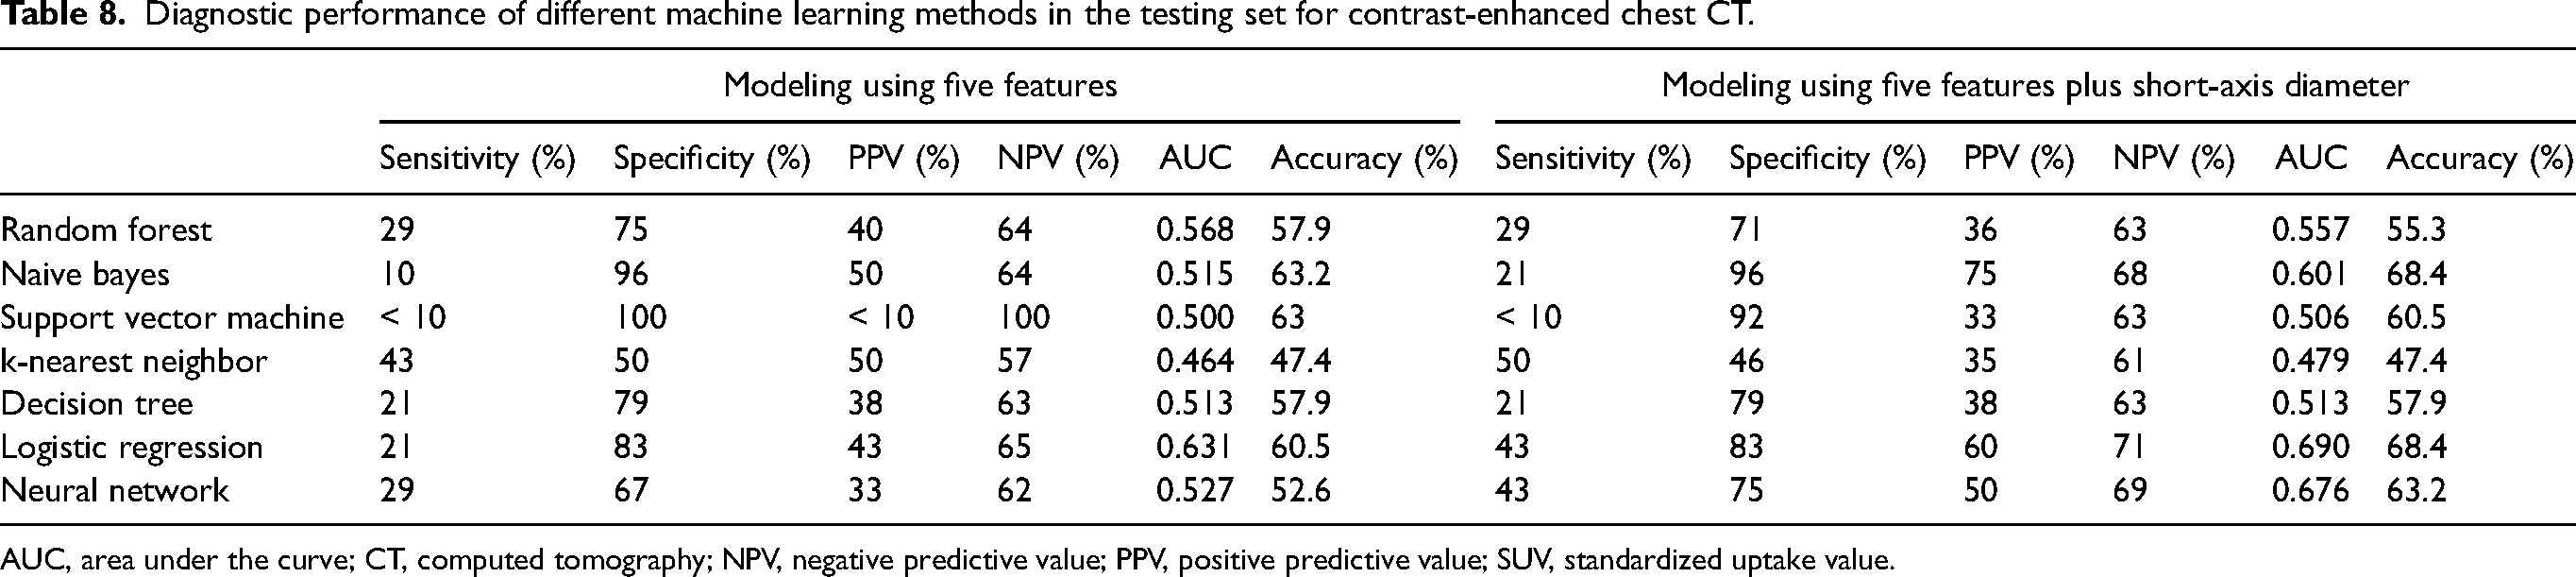
AUC, area under the curve; CT, computed tomography; NPV, negative predictive value; PPV, positive predictive value; SUV, standardized uptake value.
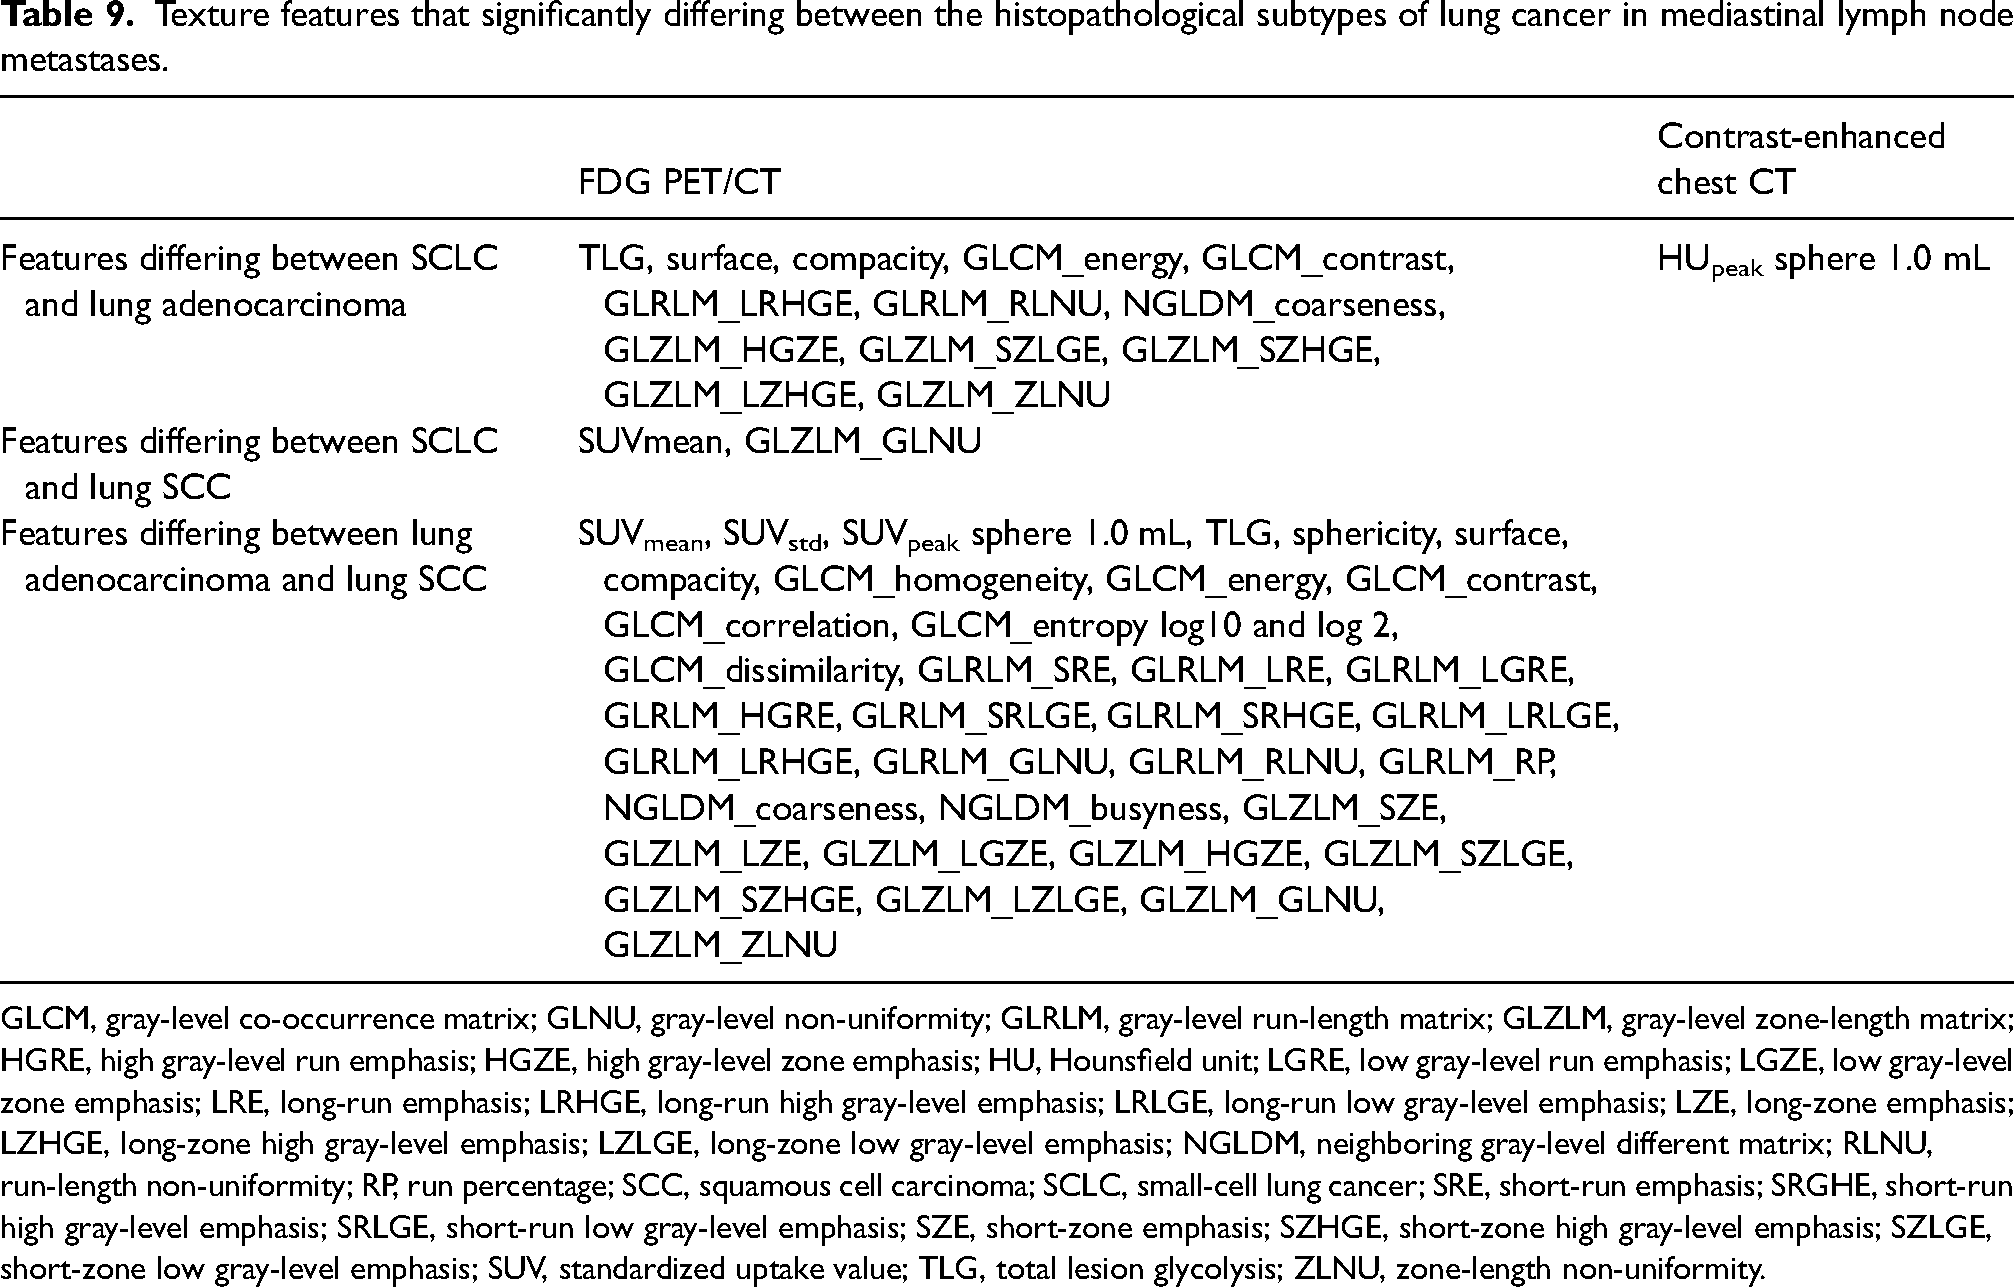
In the FDG PET/CT radiomic analysis, 13 features were able to differentiate between SCLC and adenocarcinoma, two features between SCLC and SCC, and 33 features between adenocarcinoma and SCC lymph node metastases. In the CT radiomic analysis, only one CT feature (HUpeak sphere = 1.0 mL) successfully distinguished between SCLC and adenocarcinoma lymph node metastases. No feature was able to differentiate between SCLC and SCC or between adenocarcinoma and SCC metastases (Table 9).
Texture features that significantly differing between the histopathological subtypes of lung cancer in mediastinal lymph node metastases.
GLCM, gray-level co-occurrence matrix; GLNU, gray-level non-uniformity; GLRLM, gray-level run-length matrix; GLZLM, gray-level zone-length matrix; HGRE, high gray-level run emphasis; HGZE, high gray-level zone emphasis; HU, Hounsfield unit; LGRE, low gray-level run emphasis; LGZE, low gray-level zone emphasis; LRE, long-run emphasis; LRHGE, long-run high gray-level emphasis; LRLGE, long-run low gray-level emphasis; LZE, long-zone emphasis; LZHGE, long-zone high gray-level emphasis; LZLGE, long-zone low gray-level emphasis; NGLDM, neighboring gray-level different matrix; RLNU, run-length non-uniformity; RP, run percentage; SCC, squamous cell carcinoma; SCLC, small-cell lung cancer; SRE, short-run emphasis; SRGHE, short-run high gray-level emphasis; SRLGE, short-run low gray-level emphasis; SZE, short-zone emphasis; SZHGE, short-zone high gray-level emphasis; SZLGE, short-zone low gray-level emphasis; SUV, standardized uptake value; TLG, total lesion glycolysis; ZLNU, zone-length non-uniformity.
Discussion
In the assessment of mediastinal lymph nodes, the SUVmax, MTV, and TLG parameters are commonly used for PET/CT and the maximum short-axis diameter and density parameters for CT. However, these parameters only reflect the main and gross features of lymph nodes and have certain limitations (3). The assessment of the anatomical heterogeneity of lesions and their heterogeneity in glucose metabolism can provide more detailed information. In the present study, we aimed to differentiate benign and malignant mediastinal lymph nodes using the texture analysis and machine learning methods. We determined that some machine learning methods had high AUC values in the CT and PET/CT testing sets. In addition, we investigated the contribution of tumor heterogeneity to the histopathological subtype distinction in patients with lung cancer. Most of the PET/CT texture features and one of the CT texture features successfully discriminated between histopathological subtypes.
Studies on texture analysis show that in lung cancer, benign/malignant lymph nodes in the mediastinum can be distinguished using FDG PET/CT (7,8) and chest CT (20–22). In the present study, 39 of the 43 PET/CT features and 20 of the 44 CT features significantly differed between the benign and malignant lymph nodes. When we reduced the features and introduced the remaining features to the machine learning methods, we determined that decision tree and naive Bayes were the two most successful methods. Decision tree had higher sensitivity than the other algorithms (89%). Naive Bayes had low sensitivity (41%), but its specificity was higher than the others (81%). After adding SUVmax to the models, the accuracy of SVM and naive Bayes increased and the sensitivity of both methods increased as expected, while the specificity of the remaining five methods was reduced. In a study by Gao et al., SVM had an AUC value of 0.689 in the discrimination between benign and malignant mediastinal lymph nodes based on the FDG PET/CT texture analysis (8). However, the authors stated that the number of malignant lymph nodes and the mean SUVmax value of the lymph nodes were low. In our study, the mean SUVmax of the lymph nodes was 6.5 ± 3.4. Three machine learning methods had an AUC value >0.700, and after the addition of SUVmax to the methods, two machine learning methods had an AUC value >0.700 (Table 6). In another study, Wang et al. used FDG PET/CT texture analysis and the SVM, random forest, and AdaBoost machine learning methods. In that study, machine learning successfully discriminated between the benign and malignant lymph nodes, with AUC values being >0.900. Furthermore, the authors found that the addition of clinical diagnostic features, such as SUV, tumor size, and local heterogeneity to the machine learning methods increased their AUC values (7). However, they did not perform a correlation analysis between the texture features and did not reduce the features in the model. In our study, we determined lower AUC values, which can be attributed to our feature reduction in order to achieve more reliable machine learning modeling. After adding SUVmax to the machine learning methods, we observed that the diagnostic power of some of the methods increased.
Andersen et al. performed contrast-enhanced thorax CT in patients with lung cancer and modeled features that differed between benign and malignant mediastinal lymph nodes using logistic regression. The authors calculated the sensitivity, specificity, accuracy, and AUC values of the model as 53%, 96.8%, 82.6%, and 0.834, respectively (21). In another unenhanced thorax CT study conducted with the same objective, Pham et al. used SVM as a machine learning method and reported the AUC value as 0.890 (20). In another study using unenhanced thorax CT, Bayanati et al. used logistic regression and determined the sensitivity and specificity values as 81% and 80%, respectively. When the authors used SVM, the accuracy was 71% (23). In all these studies, the authors emphasized the importance of providing complementary information for the radiologist rather than texture analysis replacing conventional assessment. In our study, the specificity of the naive Bayes and SVM methods was high, which is consistent with previous studies. However, the sensitivity of these two methods was low. The diagnostic power increased in three of the seven investigated methods when the short-axis diameter of the lymph nodes was added to the machine learning models, which mainly increased the sensitivity and did not affect specificity. However, the sensitivity was not high enough. In our study, the number of patients was not sufficient to group them by cancer stage. Studies with a higher number of patients and homogeneous cancer stage groups can produce more accurate results to reveal the role of texture analysis in determining lymph node metastasis in different stages of disease. The detection of micrometastases in lymph nodes by imaging methods is challenging with the current device technology and agents used in molecular imaging, and therefore a histopathological examination is required under these conditions. However, determining non-metastatic lymph nodes reliably and with high specificity can reduce unnecessary invasive procedures and diagnostic costs. In this sense, texture analysis may become an essential diagnostic tool.
In lung cancer, there are different histopathological subtypes, such as SCLC, adenocarcinoma, and SCC. Treatment and prognosis differ depending on these subtypes. The investigation of nodular lesions of primary lung cancer with FDG PET/CT (10,11,24) and chest CT texture analysis (23,25) shows that texture features significantly differ between histopathological subtypes. When the relevant literature is examined, there is no study investigating the differentiation of histopathological subtypes in mediastinal lymph nodes.
In the present study, lymph nodes with histopathologically proven lung cancer metastasis were examined in the PET/CT and CT groups separately for intratumoral heterogeneity. In the PET/CT group, 13 features differed between SCLC and adenocarcinoma, two features between SCLC and SCC, and 33 features between adenocarcinoma and SCC lymph node metastases. Intratumoral heterogeneity was not surprising in the metastases of tumors with different biological behaviors. In the CT group, only one feature differed between SCLC and adenocarcinoma lymph node metastases. No feature was able to discriminate between SCLC and SCC or between adenocarcinoma and SCC metastases. FDG uptake is a complex process affected by multiple factors, such as Ki-67, vascularization, hypoxia, and hypermetabolism (26), and this may explain why intratumoral heterogeneity is more prominent in FDG PET/CT images than CT. These results are promising in terms of obtaining accurate and early diagnostic results in cases where histopathological sampling can be performed from neither primary tumor nor mediastinal lymph nodes.
The present study has some limitations due to its retrospective nature and technical limitations of texture analysis. The number of patients in this study was not sufficient to achieve meaningful statistical results. More reliable results can be obtained by including a higher number of patients and homogenous lung cancer subtype groups. In addition, prospective studies to be conducted with patients at similar tumor stages can provide more accurate information. As another limitation, due to the nature of texture analysis in PET/CT, we included lymph nodes with 64 or greater voxels in PET/CT; thus, the evaluation of micrometastasis in lymph nodes was unsatisfactory. Since the histopathological analysis of lymph nodes was performed using EBUS-TBNA materials, the histopathological examination of the entire lymph nodes could not be performed. Therefore, we were not able to rule out the presence of co-existent micrometastasis in lymph nodes that were considered benign.
In conclusion, examining mediastinal lymph nodes in FDG PET/CT and contrast-enhanced chest CT with texture analysis and machine learning methods can contribute to the differentiation of benign and malignant histopathologies. The addition of SUVmax and short-axis diameter of lymph nodes to diagnostic models increases diagnostic accuracy. In patients with lung cancer and mediastinal lymph node metastasis, the histopathological subtype of lung cancer can be determined by analyzing mediastinal lymph nodes on FDG PET/CT with tissue analysis. These results need to be confirmed by multi-center studies with a large number of patients.
Footnotes
Declaration of conflicting interests
The author(s) declared no potential conflicts of interest with respect to the research, authorship, and/or publication of this article.
Funding
The author(s) received no financial support for the research, authorship, and/or publication of this article.