
Abstract
Background
Accurate prediction of the histological grade and Ki-67 expression of soft tissue sarcoma (STS) before surgery is essential for the subsequent diagnosis, treatment, and prognostic evaluation of patients.
Purpose
To evaluate intravoxel incoherent motion (IVIM) and diffusion kurtosis imaging (DKI) in predicting the histological grade and Ki-67 expression of STS.
Material and Methods
A total of 40 patients underwent 3-T MRI, including conventional sequences; IVIM and DKI parameters were obtained. All patients were divided into a low-grade (grade 1 and grade 2) group and a high-grade (grade 3) group through pathological analysis. Ki-67 expression of each lesion was calculated. Chi-square test, independent sample t-test, Mann–Whitney U test, Pearson, Spearman, and receiver operating characteristic curve analysis were performed.
Results
There were 17 patients in the low-grade group and 23 in the high-grade group. Ki-67 expression was in the range of 10%–80%. D value was inversely correlated with Ki-67 expression. MK value showed a moderate positive correlation with Ki-67 expression. Regarding histological grading, only the peritumoral enhancement was statistically different between low- and high-grade STS on conventional MRI (P=0.024). The high-grade group had significantly higher MK value and lower D and MD value than the low-grade group. MK value showed the best diagnostic performance. The combination of MK and MD yielded the highest specificity (88.24%), and the combination of D, MK, and MD yielded the best area under the curve value (0.841) and sensitivity (95.65%).
Conclusion
IVIM and DKI parameters were correlated with Ki-67 expression and could help differentiate between low- and high-grade STS.
Introduction
Soft tissue sarcoma (STS) is a rare type of heterogeneous tumor. Studies had pointed out that histological grade was an independent and most important prognostic factor for STS (1–3). At present, the most widely used was the scoring and grading system proposed by the FNCLCC system (4). In previous studies, scholars tended to classify grade 2 and grade 3 STS into the high-grade group (5,6). However, we noted that other studies suggested that neoadjuvant chemotherapy was more effective for advanced patients with histological grade 3 (7–9). Higher mortality and local recurrence rates exist in patients with grade 3 STS. The proliferating cell nuclear antigen Ki-67 is currently one of the most reliable indicators of cell proliferation activity. It has been suggested that Ki-67 has better accuracy and reproducibility than the FNCLCC system in assessing tumor prognosis (10). Several long-term follow-up studies have shown that high Ki-67 expression in STS may be associated with higher mortality and recurrence rates (11,12). Thus, preoperative assessment of histologic grading and Ki-67 expression is essential for establishing individualized treatment plans and predicting prognosis in STS.
At present, preoperative evaluation of histological grade and Ki-67 expression mainly depends on puncture biopsy, but the limitations of the puncture site and the high heterogeneity of STS may lead to underestimate for the histological features (13). Diffusion-weighted imaging (DWI) has been widely used in the field of skeletal and muscular system lesions in recent years (14). DWI reflects the degree of diffusion of free water in the tissue and supplements functional information that is difficult to provide with conventional magnetic resonance imaging (MRI). The apparent diffusion coefficient (ADC) is used to quantitatively analyze the tissue diffusion information (15). In the identification of benign and malignant soft tissue tumors, histological grade, and evaluation of cell proliferation, a simple single index model has been proved to be reliable (16–18). However, traditional ADC is affected by microcirculation perfusion, and this is calculated on the assumption that the water molecule is Gaussian, while the real diffusion of water molecules is irregular non-Gaussian motion. Intravoxel incoherent motion (IVIM) can separate perfusion and diffusion information in the tissue through multi-b-value imaging (19), and diffusion kurtosis imaging (DKI) can evaluate the most realistic non-Gaussian motion patterns of water molecules in tissues (20). These two imaging modes made up for the shortcomings of DWI from different perspectives. It has been shown that IVIM and DKI values reflect different histopathological features, and there are already large meta-analyses and multicenter studies about different histopathological parameters such as cell count and/or Ki-67 expression (21–26).
Therefore, the aim of the present study was to evaluate the association between IVIM and DKI quantitative parameters and histopathological features in STS. We hypothesized that IVIM and DKI can provide more functional information than conventional MRI and traditional DWI to evaluate the histological grade and Ki-67 expression in STS.
Material and Methods
This retrospective case-control study was approved by the ethics committee. The need to obtain written informed consent from the participants was waived.
Study population
From September 2018 to March 2020, a total of 120 patients with suspected soft tissue masses were accepted in our hospital. In total, 90 patients underwent 3-T MRI including complete conventional MRI sequences, IVIM, and DKI images. The following exclusion criteria were used: (i) IVIM and DKI image artifacts were too hard to complete postprocessing analysis; (ii) patients who had received any relevant treatment before surgery; (iii) tumors occurring in the abdomen and pelvis; and (iv) patients whose final classification could not be determined after repeated observations by pathologists. Finally, 40 patients (22 men [mean age = 56.5 years, age range = 22–73 years], 18 women [mean age = 52 years, age range = 37–62 years]) were included in the study.
MRI acquisition
All MRI examinations were used through the GE Discovery 750W 3.0T MRI scanner (GE Healthcare, Milwaukee, USA). The 16-channel phased array abdomen and large flexible coil were selected. Conventional MRI scans used fast spin-echo (FSE) sequences and fat-suppressed (FS) sequences. The echo-planar imaging sequence was used for IVIM and DKI. The scanning layer thickness, layer spacing, layer number, and field of view were consistent with the cross-section T2-weighted (T2W) imaging sequence. The IVIM original image was collected using 8 b-values (0, 25, 50, 75, 100, 200, 500, and 800 s/mm2). The collection time was 2 min 33 s. Three b-values (0, 1000, and 2000 s/mm2) were used to collect DKI original images. Each b-value was applied with diffusion-sensitive gradient fields in 15 directions. The total acquisition time was 8 min 50 s. Finally, contrast-enhanced T1-weighted (T1W) imaging sequences were collected by injection of contrast agent through the cubital vein. Detailed MRI parameters are shown in Table 1.
MRI parameters for the different sequences.
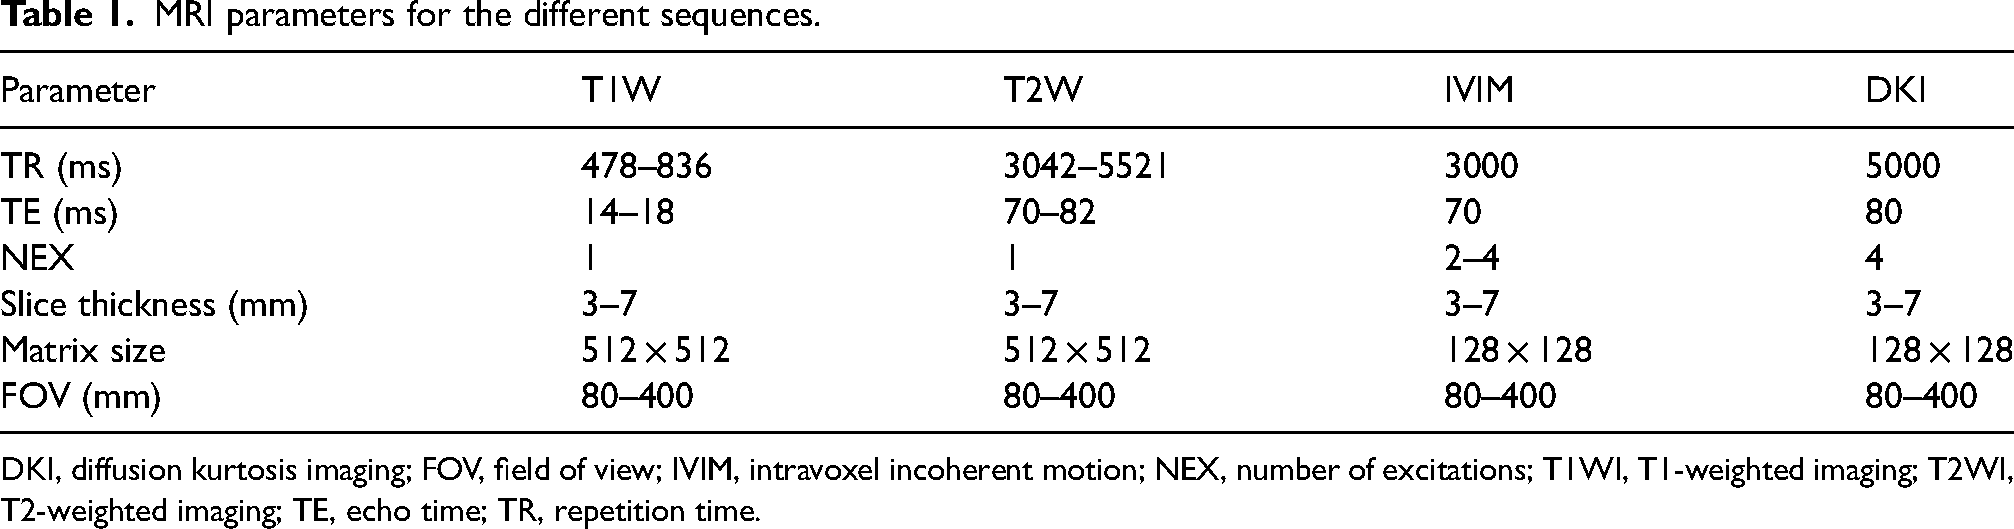
DKI, diffusion kurtosis imaging; FOV, field of view; IVIM, intravoxel incoherent motion; NEX, number of excitations; T1WI, T1-weighted imaging; T2WI, T2-weighted imaging; TE, echo time; TR, repetition time.
MRI analysis
Analysis of all MRI scans was independently performed by two skeletal muscle radiologists with 8 and 20 years of experience who were blinded to patients’ pathology results. All MRI scans were analyzed before surgery. The intra-group correlation coefficient (ICC) was used to assess the consistency of the two observers’ analysis of conventional MRI signs and the measurement of IVIM and DKI parameters (ICC < 0.40 = poor agreement; 0.41–0.59 = fair agreement; 0.60–0.74 = good agreement; 0.75–1.00 = excellent agreement).
IVIM and DKI images
The image postprocessing operation was performed by ADW4.7 workstation Functool software, which was provided by the GE original company.
IVIM: Multi-b-value images were postprocessed using Functool software. After adjusting the threshold and reducing the background noise, the single exponential model and the double exponential model were selected for image fitting. After manually delineating the region of interest (ROI), standard ADC, true diffusion (D), pseudo-diffusion (D*), and perfusion fraction (f) maps were obtained.
DKI: The kurtosis model was selected to fit multiple b-value (0, 1000, 2000) images, and 3D synchroview (GE Healthcare, Chicago, IL, USA) was used to ensure that the size and location of the ROI were completely consistent with the IVIM. Subsequently, mean kurtosis (MK) and mean diffusion (MD) maps were acquired.
ROI sketching principles: Standard ADC maps were selected for ROI positioning. The solid tumor region with the lowest ADC value (darkest) was chosen as the ROI, which corresponds to the highest DWI image signal region or the most obvious T1W imaging enhancement region. If there was no ADC low signal area, the largest section of the tumor was selected for delineation. Mucus, cystic changes, necrosis, calcification, and bleeding areas were avoided during the delineation process according to conventional MR sequences and enhancement sequence. It was essential to avoid the edges of the tumor to reduce the effects of partial volume effects.
Conventional MRI analysis
The tumor size, location, tumor heterogeneity, and tumor margins were recorded by two observers on conventional MRI. The maximum transverse diameter of the tumor was distinguished by 5 cm. The location of the tumor included subcutaneous and deep tissues. High T2W imaging heterogeneity is defined as more than half of tumors presenting mixed signals. Peritumoral enhancement, necrosis, and T2W imaging peritumoral edema were divided into present or absent.
Pathological analysis
Histopathological types, histological grade, and Ki-67 expression diagnosis of all tumors were jointly performed by two pathologists with >10 years of diagnostic experience. They were blinded to the patients’ clinical and MRI results. The degree of differentiation of tumor cells, the number of mitotic figures, and the area of tumor necrosis visible under the microscope were strictly determined according to the scoring standards of the FNCLCC system. All patients were divided into grade 1, grade 2, or grade 3. Grades 1 and 2 were classified as the low-grade group and grade 3 as the high-grade group. Immunohistochemical analysis was performed using Ki-67 antibody (1:200, Dako). A minimum of 1000 cells from five random high magnification fields were counted to identify Ki-67 positive cells present at a relatively uniform density. Their percentage of the total number of cells was calculated as Ki-67 positive expression.
Statistical analysis
Statistical analyses were performed using SPSS version 26.0 (IBM Corp., Chicago, IL, USA). The normality of all continuous variable data was tested. All MRI features in the high- and low-grade groups were compared. Categorical variables were analyzed using a chi-square test. For continuous variables, an independent sample t-test and Mann–Whitney U test were used. Pearson and Spearman analyses were performed on the correlation between the variables. The receiver operating characteristic (ROC) curve analysis was performed on the statistically significant parameters, and cutoff value, area under the curve (AUC), sensitivity, and specificity were used to evaluate the diagnostic efficacy of predicting the high-grade group.
Results
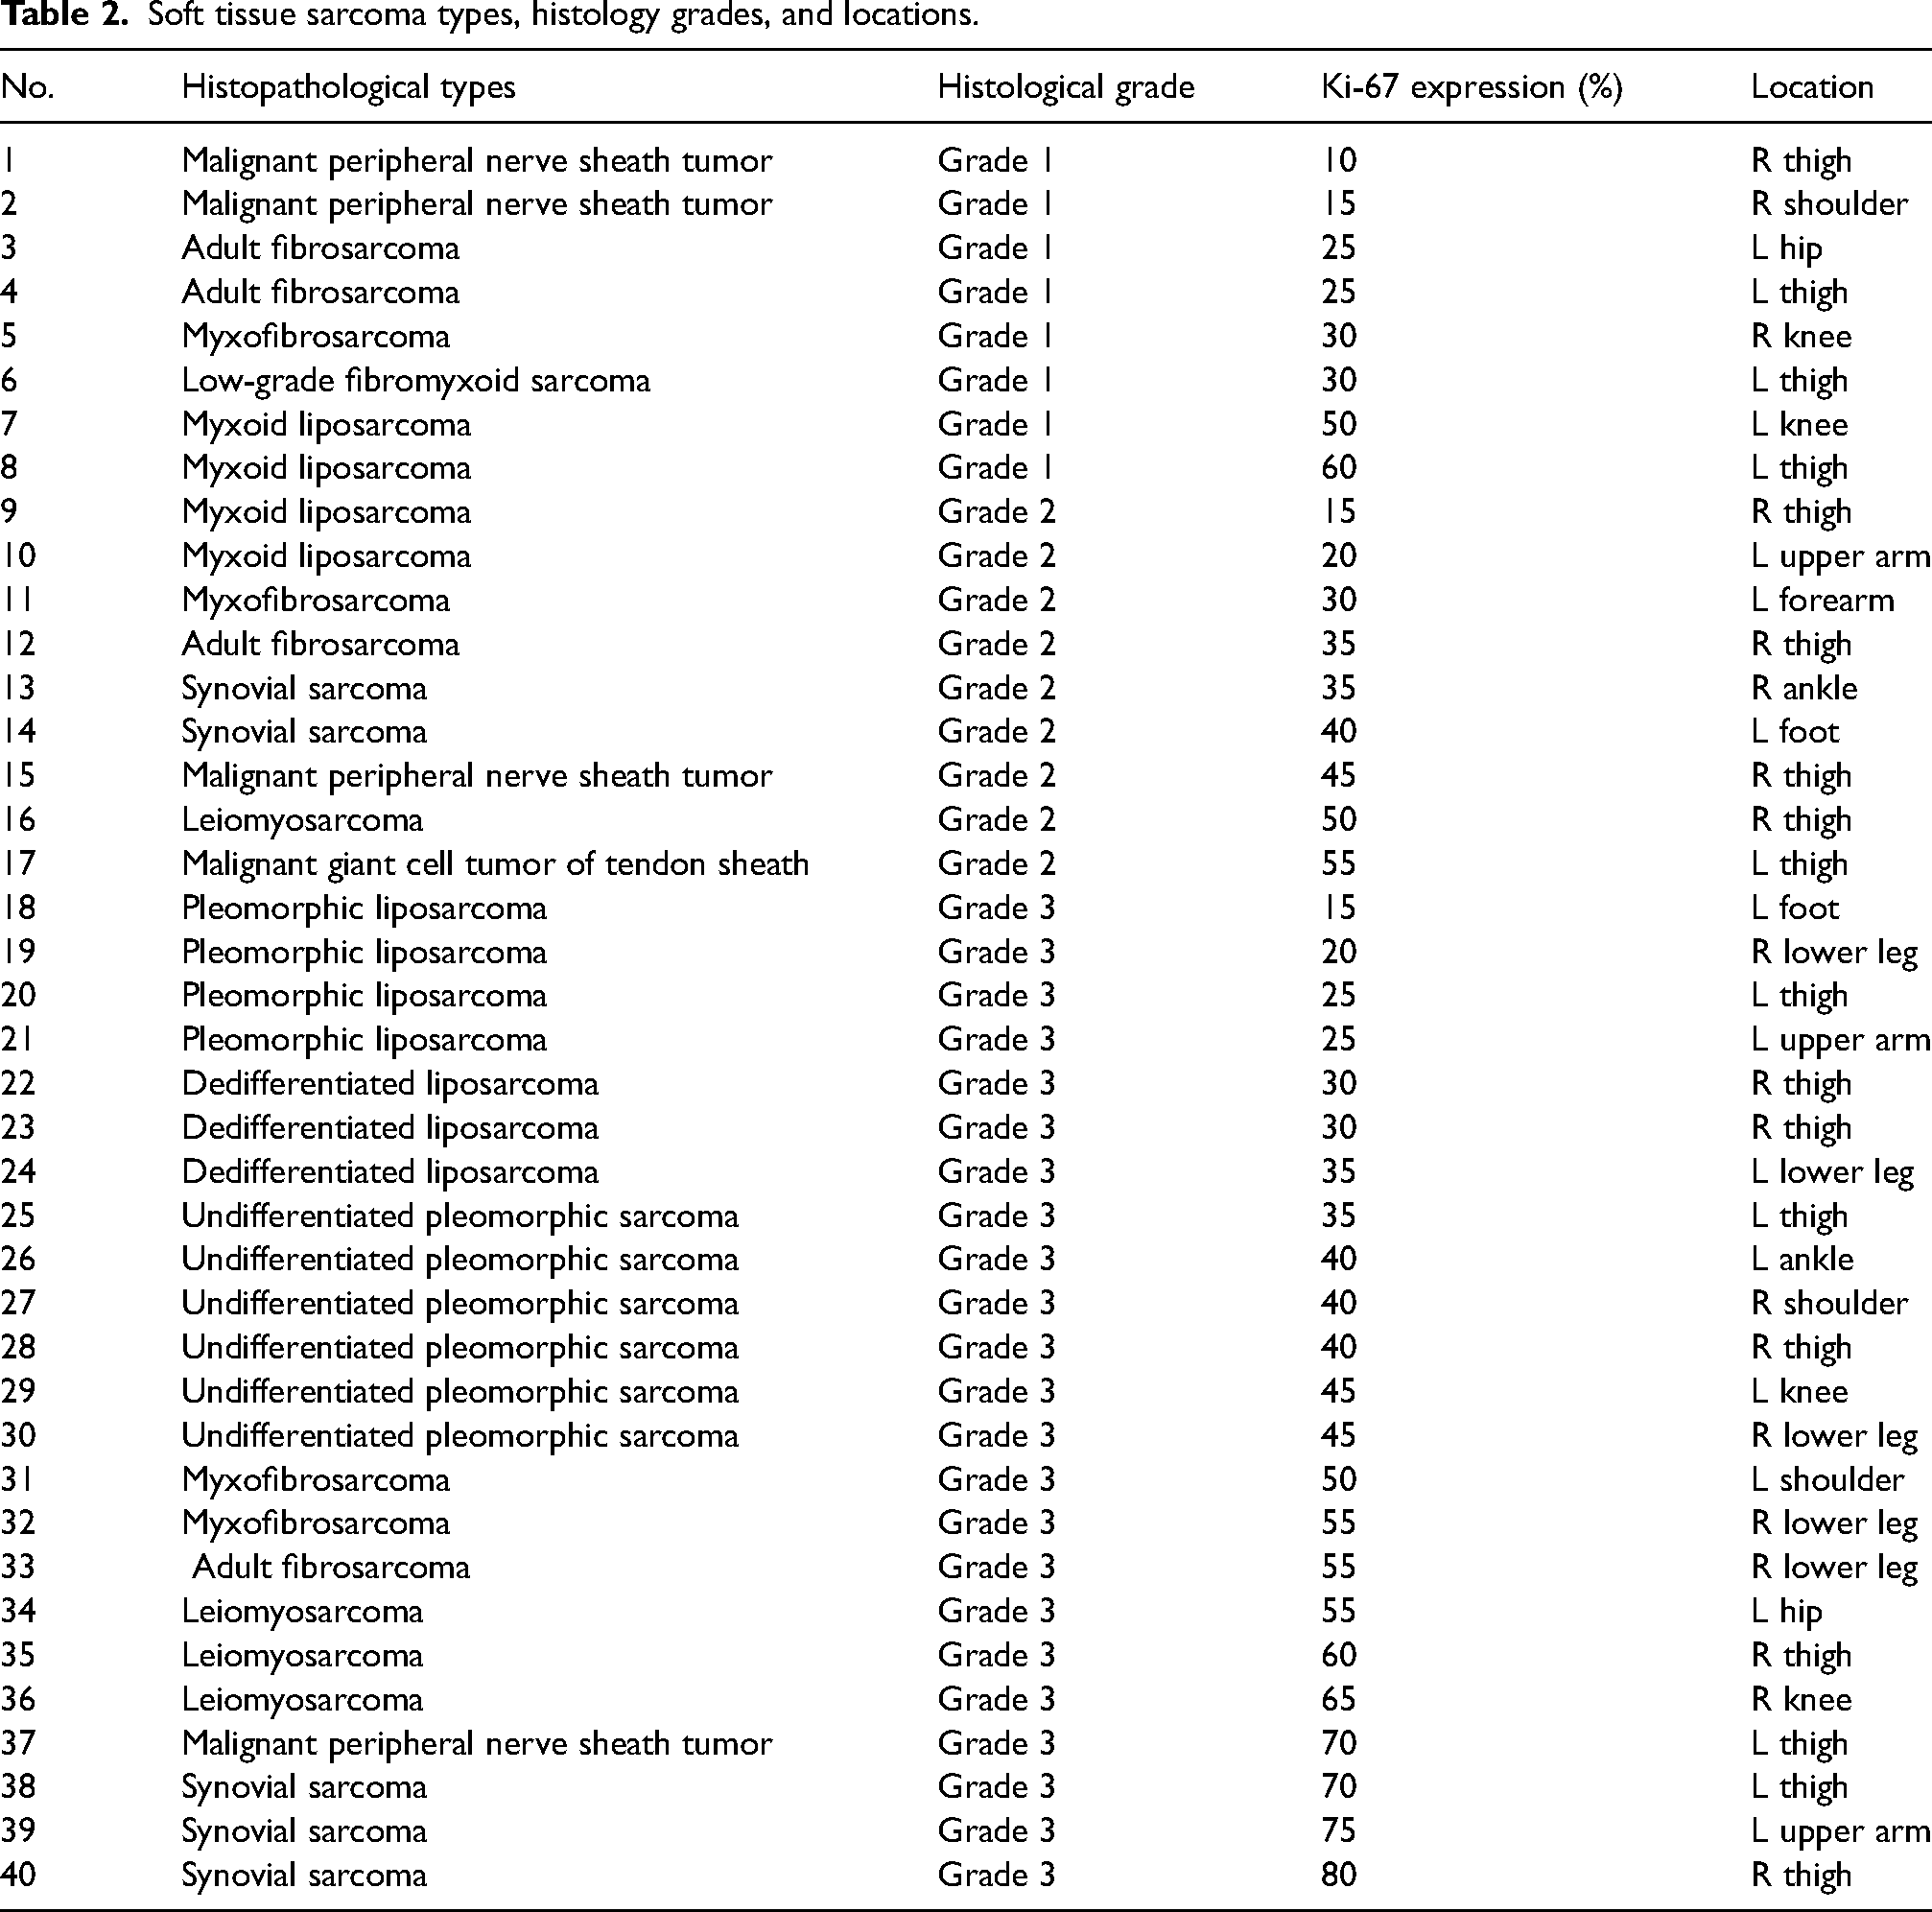
Fig. 1 shows the flow of patients included in this study. A total of 40 patients were selected for the study. There were 17 patients in the low-grade group (8 patients for grade 1 and 9 patients for grade 2) and 23 patients in the high-grade group (grade 3). Among the 40 lesions, Ki-67 expression was in the range of 10%–80%. The pathological results and locations of all lesions are shown in Table 2.
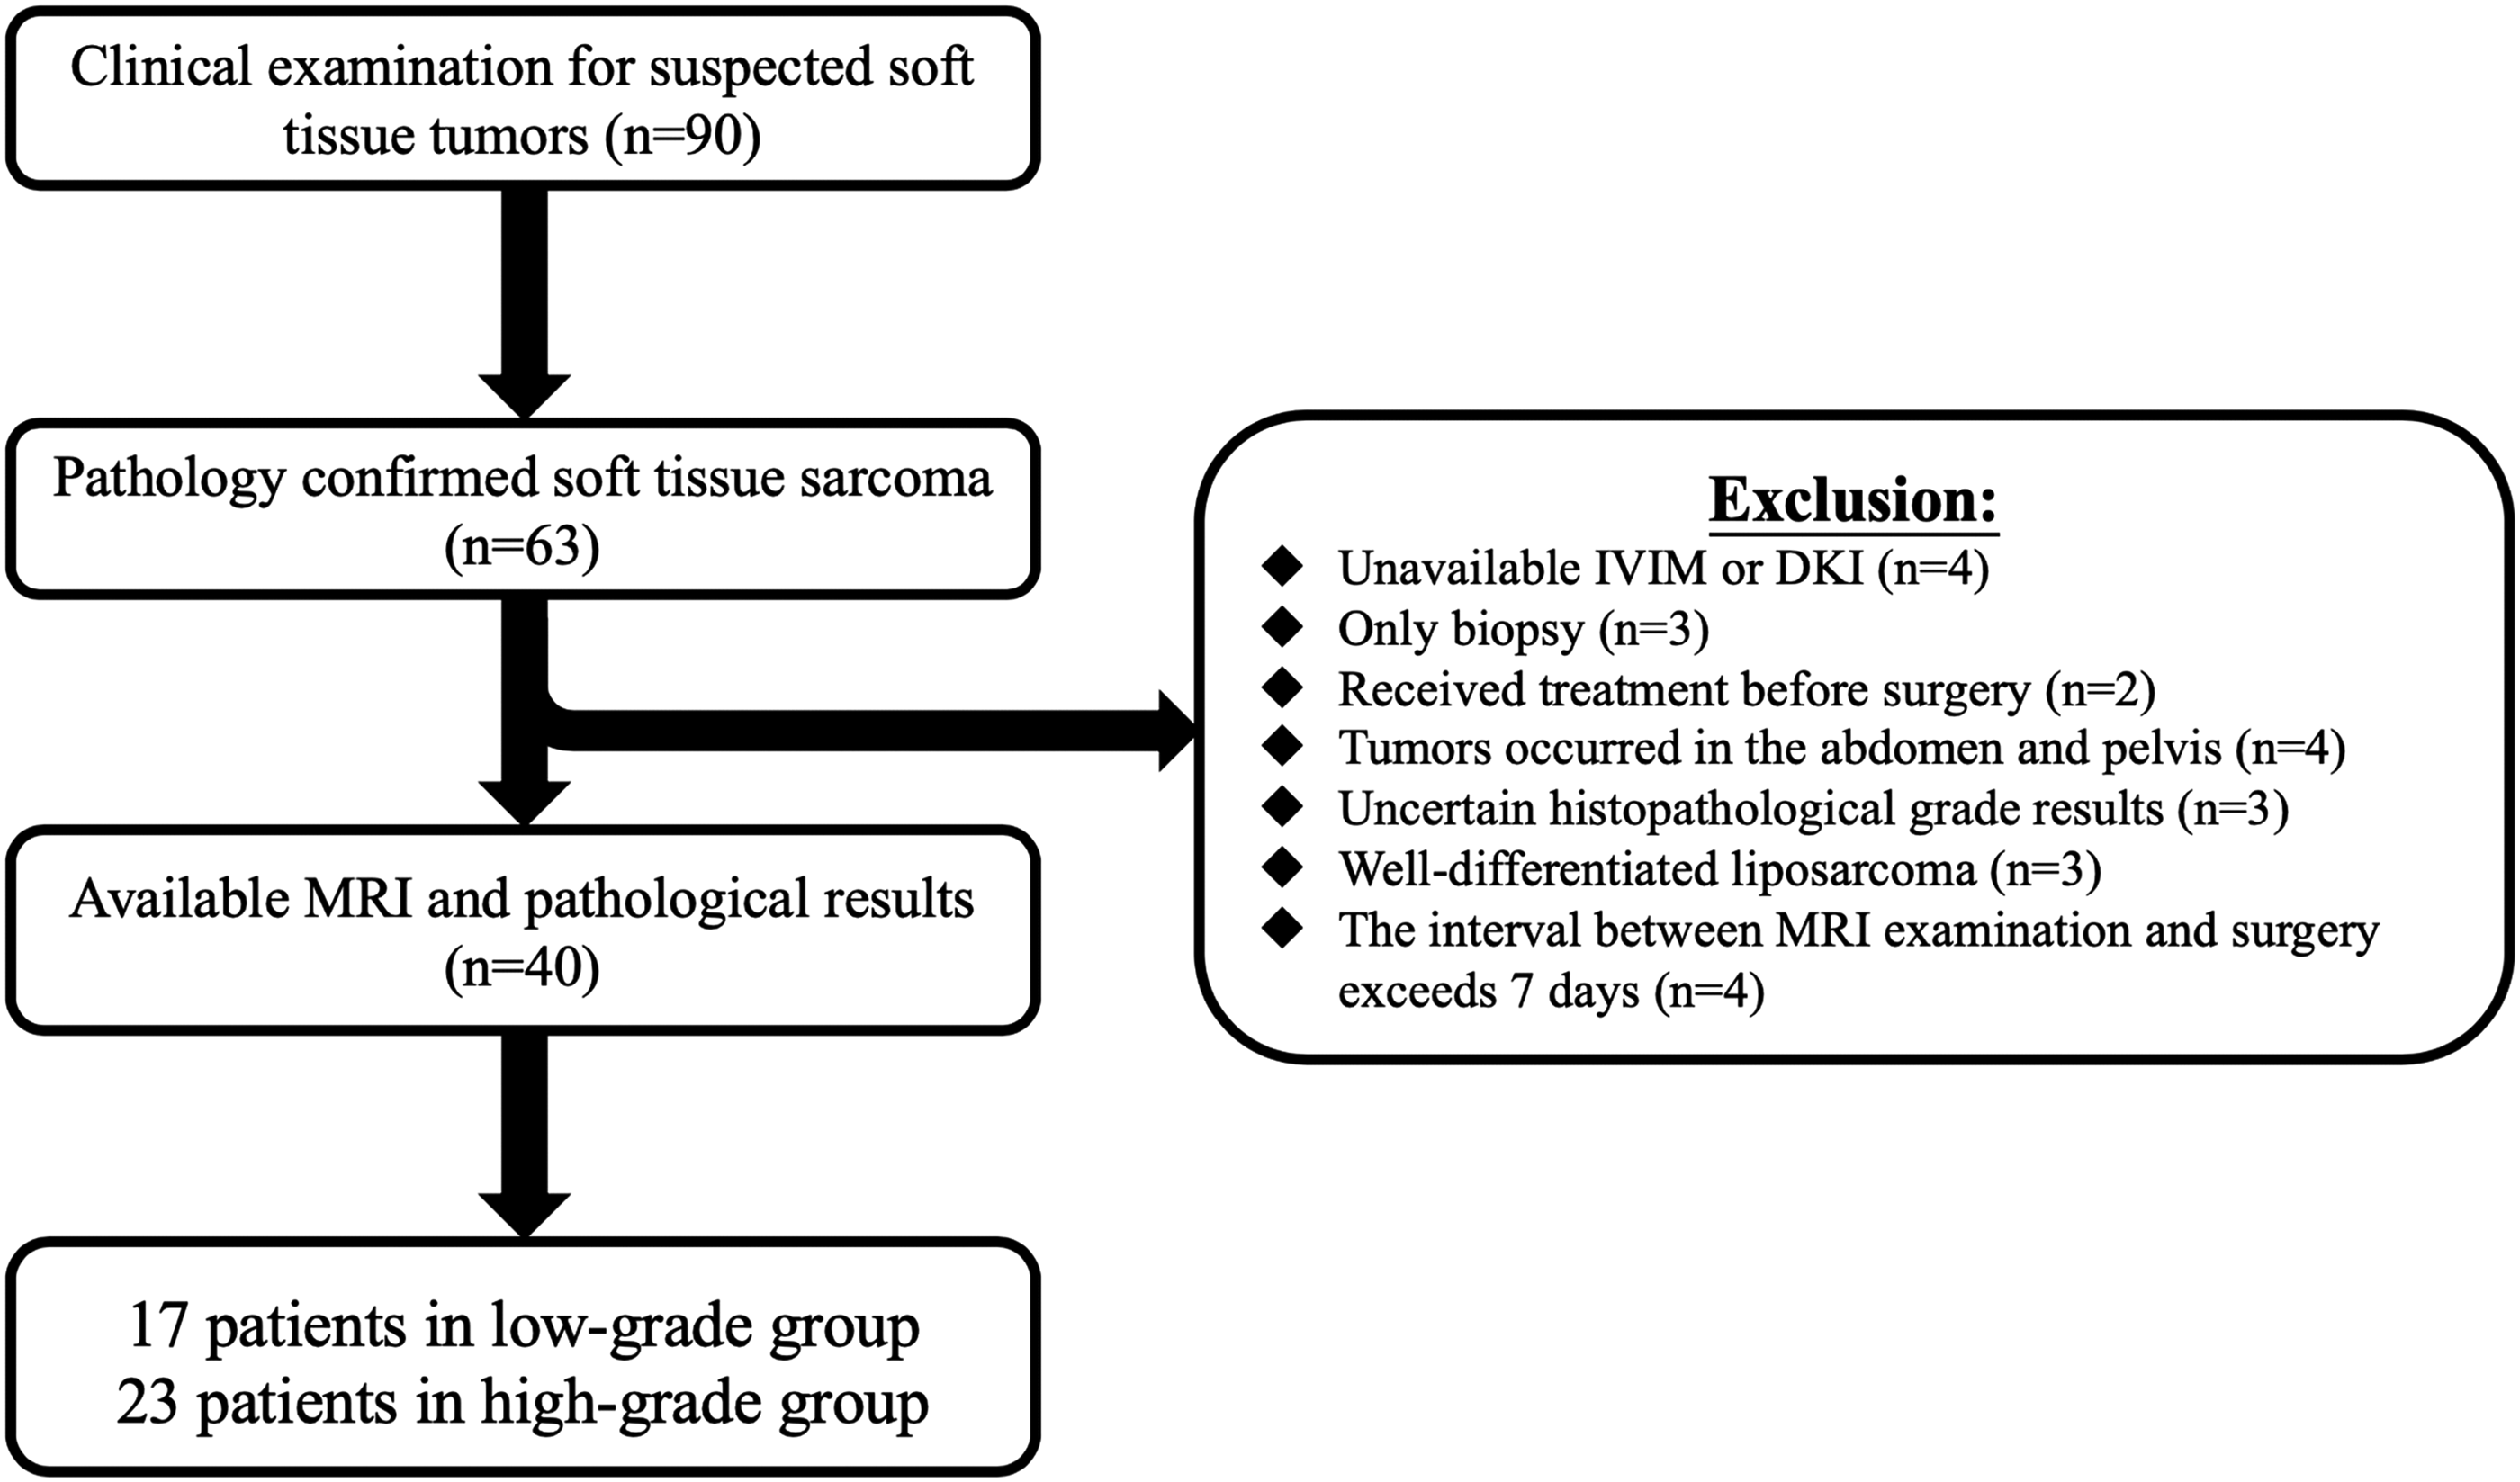
Flow chart.
Soft tissue sarcoma types, histology grades, and locations.
Spearman correlation coefficient showed that D value was inversely correlated with Ki-67 expression (r = –0.372; P = 0.018). MK value showed a moderate positive correlation with Ki-67 expression (r = 0.570; P < 0.001). However, standard ADC, D*, f, and MD values did not show any significant correlations (P > 0.05). Furthermore, Pearson examination revealed a moderate positive correlation between Ki-67 expression and histological grading (r = 0.364; P = 0.021).
D and MD values showed a negative correlation with histological grade (r = –0.351; r = –0.422). MK value showed a positive correlation with histological grade (r = 0.454; P = 0.003). Standard ADC, D*, and f values did not show any significant correlations (P > 0.05).
Among all conventional MRI features, only peritumoral enhancement was statistically different between the high- and low-grade groups (P = 0.024). The IVIM and DKI parameters measured by two observers showed excellent consistency (ICC > 0.940).
As shown in Table 3, the high-grade group had a significantly lower D value (P = 0.014) than the low-grade group; however, standard ADC, D*, and f values had no significant difference between the high- and low-grade groups. When the cutoff value was 1.306 × 10⁻³ mm2/s, the AUC, sensitivity, and specificity for differentiating between high- and low-grade STS were 0.729, 73.9%, and 70.6%, respectively (Figs. 2 and 3).
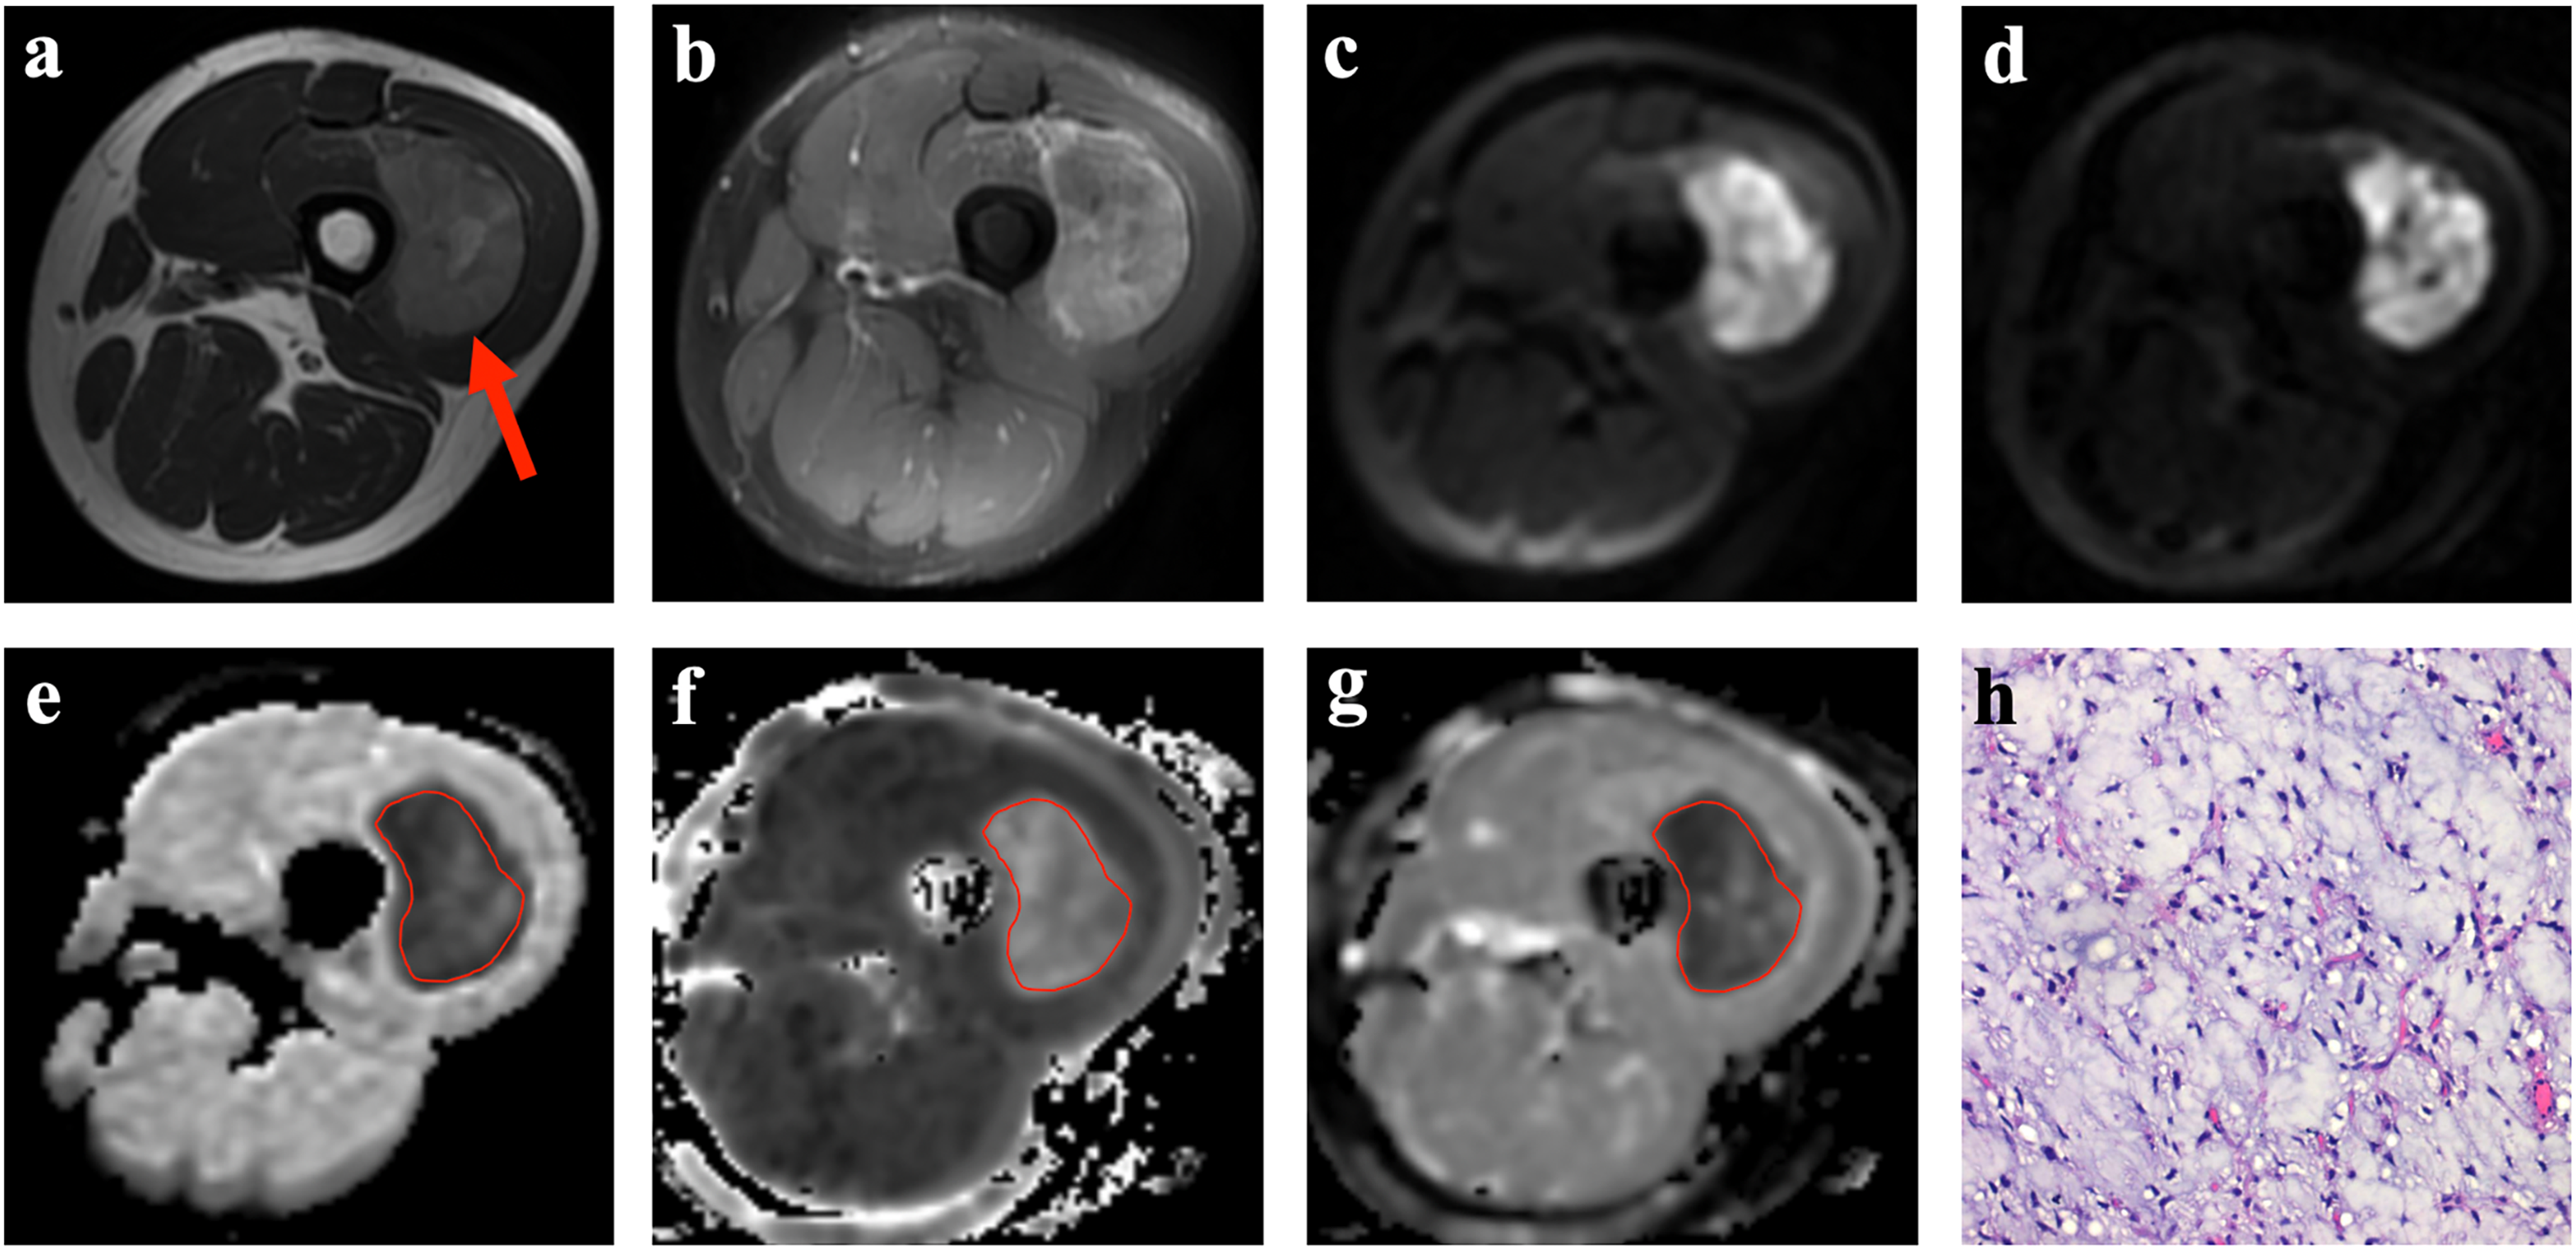
A myxoid liposarcoma in a 35-year-old patient. (a)The tumor was located in deep tissue of the thigh (red arrow). It performed slightly heterogeneous signal intensities (SI) at T2-weighted imaging. (b) After injection of contrast agent, the lesion was evenly strengthened, and no peritumoral enhancement was found. (c, d) IVIM (b-value = 500 s/mm2) and DKI (b-value = 2000 s/mm2) images identified high signal intensities. (e–g) The ROI was manually placed at the lowest signal of the ADC map. The D, MK, and MD maps and corresponding values are as follows:1.53 × 10⁻³mm2, 0.47, and 1.61 × 10⁻³mm2, respectively. (h) Postoperative pathological examination (hematoxylin & eosin–stained, ×400) confirmed the lesion as low-grade (grade 2) soft tissue sarcoma. ADC, apparent diffusion coefficient; DKI, diffusion kurtosis imaging; IVIM, intravoxel incoherent motion; MK, mean diffusion; MK, mean kurtosis; ROI, region of interest.
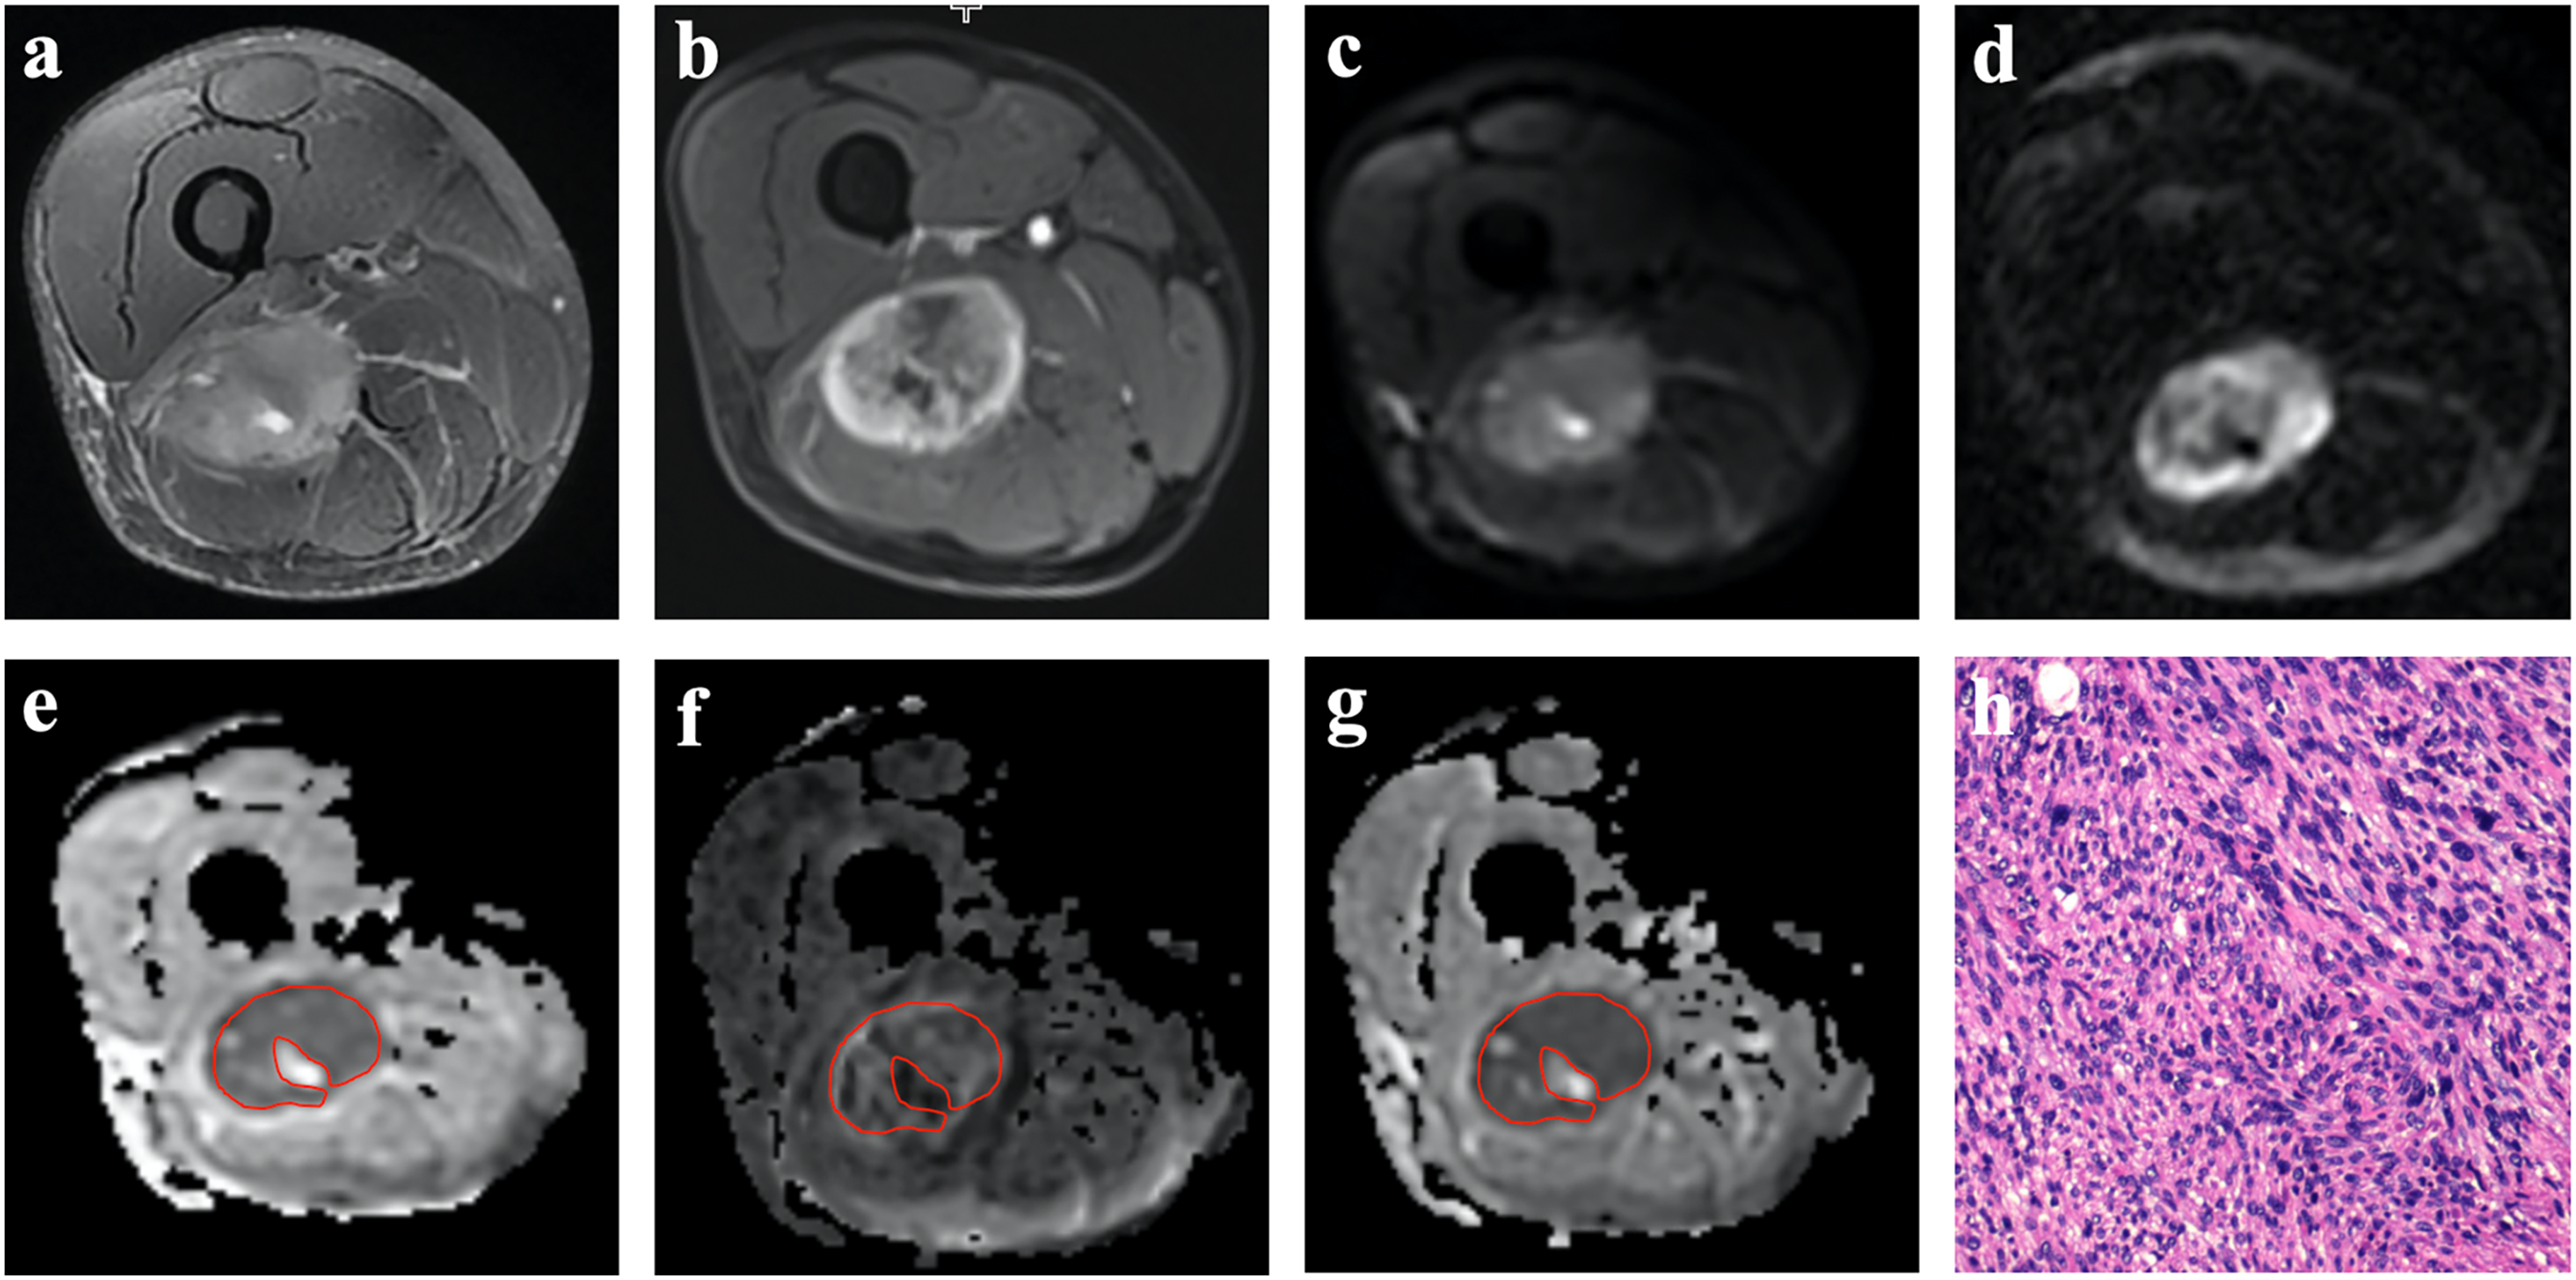
A leiomyosarcoma in a 55-year-old patient. (a) The tumor was located in the deep tissue of the thigh (red arrow). It performed highly heterogeneous signal intensities (SI) at T2-weighted imaging. (b) After injection of contrast agent, the lesion was performed unevenly strengthened and peritumoral enhancement was demonstrated on T1-weighted imaging (black arrow). (c, d) IVIM (b = 500 s/mm2) and DKI (b-value = 2000 s/mm2) images identified high signal intensities. (e–g) The ROI was manually placed at the lowest signal of the ADC map. The D, MK, and MD maps and corresponding values are as follows:1.12 × 10⁻³mm2, 0.68, 1.39 × 10⁻³mm2, respectively. (h) Postoperative pathological examination (hematoxylin & eosin–stained, ×400) confirmed the lesion as high-grade (grade 3) soft tissue sarcoma. ADC, apparent diffusion coefficient; DKI, diffusion kurtosis imaging; IVIM, intravoxel incoherent motion; MK, mean diffusion; MK, mean kurtosis; ROI, region of interest.
Quantitative and qualitative MRI characteristics of soft tissue sarcomas.
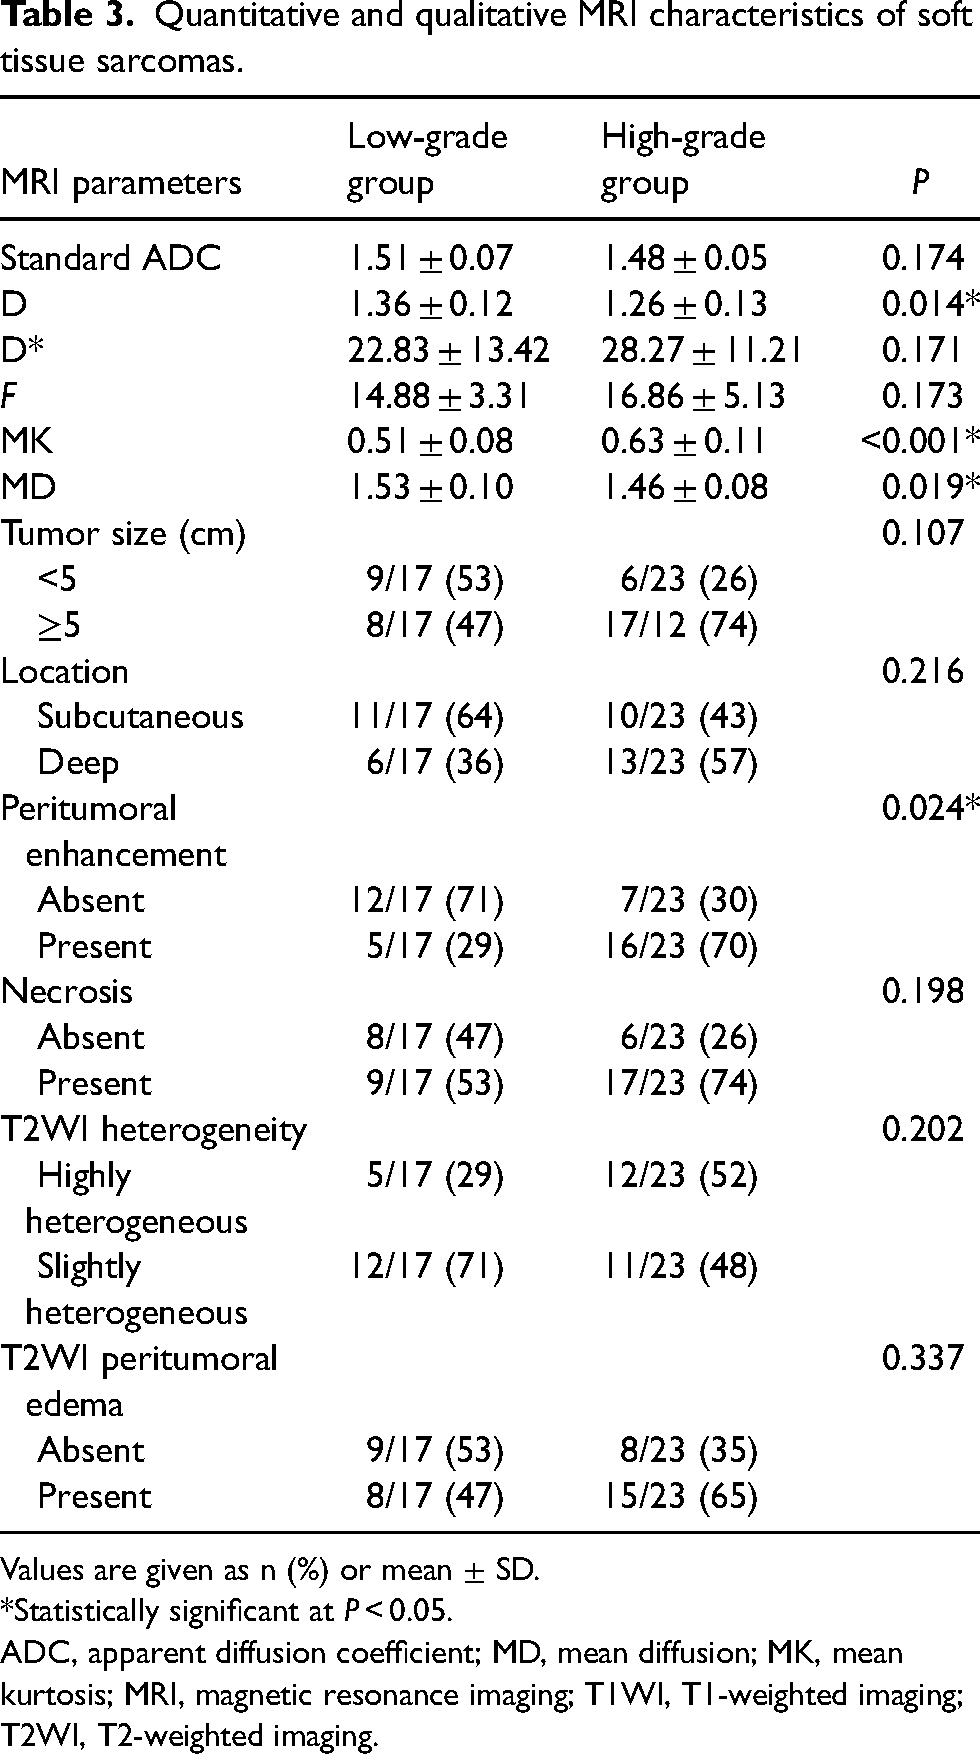
Values are given as n (%) or mean ± SD.
*Statistically significant at P < 0.05.
ADC, apparent diffusion coefficient; MD, mean diffusion; MK, mean kurtosis; MRI, magnetic resonance imaging; T1WI, T1-weighted imaging; T2WI, T2-weighted imaging.
The high-grade group had a significantly higher MK value (P < 0.001) and lower MD value (P = 0.019) than the low-grade group (Table 2). The MK value showed the best diagnostic performance. The AUC of the MK value for differentiating between high- and low-grade group was 0.812. With a cutoff value of 0.552, the sensitivity and specificity were 78.3% and 76.5%, respectively. The AUC of the MD value for differentiating between the high- and low-grade group was 0.694. At a cutoff value of 1.518 × 10⁻³ mm2/s, the sensitivity and specificity were 78.3% and 64.7%, respectively (Figs. 2 and 3).
Table 4 showed the value of joint diagnostics with statistically significant parameters. The combination of MK and MD yielded the highest specificity (88.2%). The combination of D, MK, and MD yielded the best AUC value (0.900) and sensitivity (95.7%) than other models.
Diagnostic performance of IVIM and DKI parameters for differentiating between high- and low-grade groups.
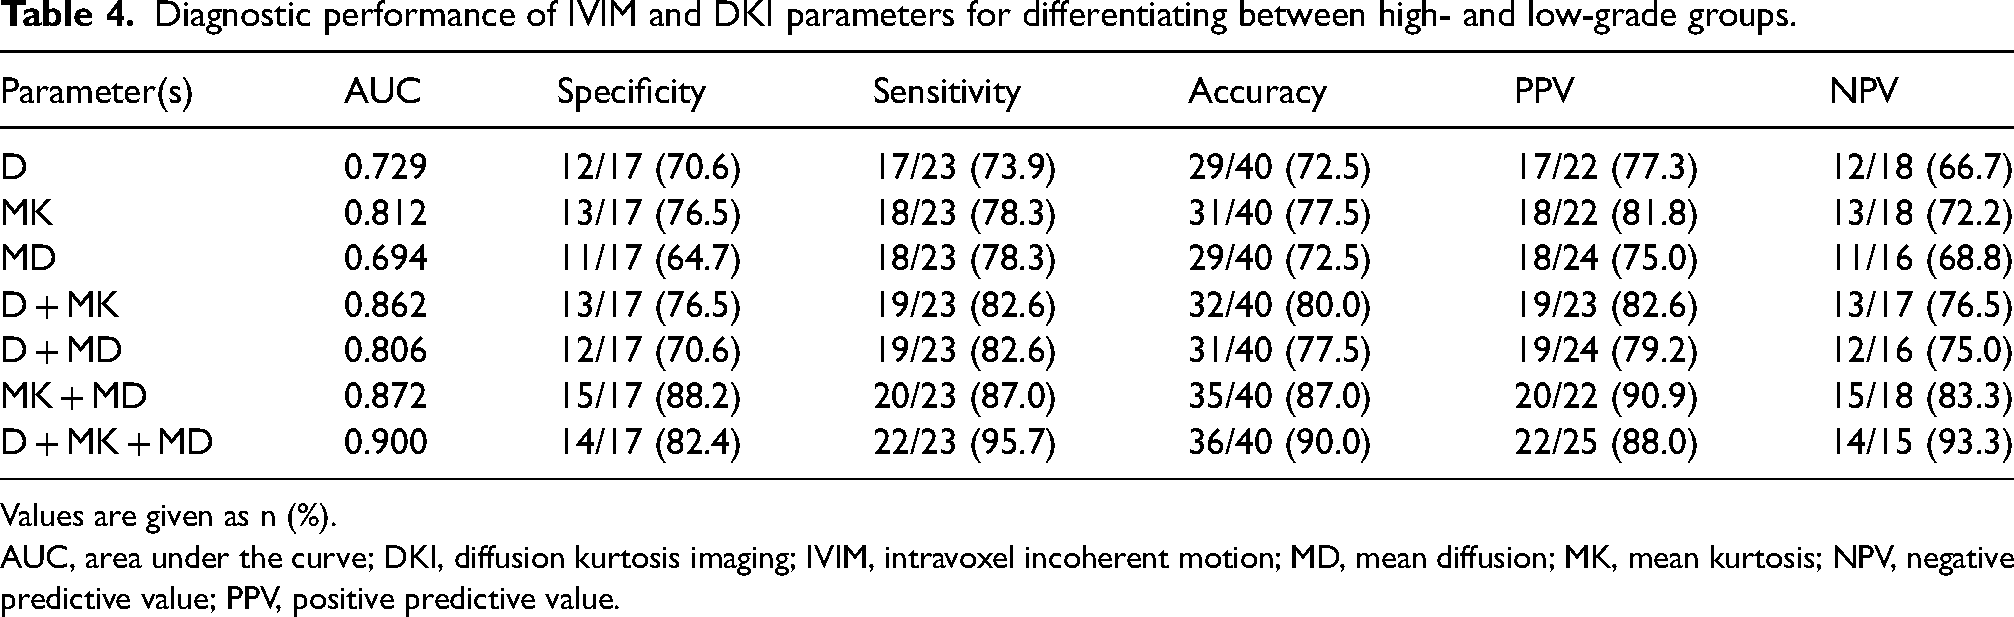
Values are given as n (%).
AUC, area under the curve; DKI, diffusion kurtosis imaging; IVIM, intravoxel incoherent motion; MD, mean diffusion; MK, mean kurtosis; NPV, negative predictive value; PPV, positive predictive value.
Discussion
It has become a hot research topic in recent years to evaluate more accurately the histological grading and cell proliferation ability of STS by MRI. With regard to the histological grading, we found that conventional MRI has potential markers suggesting high-grade lesions and D values obtained from IVIM, and MK and MD values obtained from DKI can be used as reliable predictors of grade 3 STS. With regard to the proliferative capacity of sarcoma cells, D and MK values proved to be very useful in predicting Ki-67 expression.
IVIM is an optimized sequence model based on traditional DWI. In the present study, we found that the standard ADC value obtained from the traditional single-index model cannot predict grade 3 STS, which is inconsistent with the research by Chhabra et al. (18). We speculated that the diversity of histological types and the small sample size might have contributed to this result. In addition, the measurement of standard ADC could be affected by many factors, such as the steroid component in the mucus matrix, and the rich capillaries might cause inaccuracies in the ADC value. The D value could reflect the diffusion information of pure water molecules. Our results revealed that the D value could predict grade 3 STS, which is consistent with the results of Togao et al. (27) and Zhu et al. (28). We argued that grade 3 STS was often accompanied by more vigorous mitosis, which led to increases in the number of tumors and the size of the nucleus. The narrowing gap between the inside and outside of the cell further limits the diffusion movement of water molecules. Therefore, the grade 3 STS has a lower D value than grade 2 and grade 3 STS.
A negative correlation between ADC values and Ki-67 expression has been demonstrated in solid tumors such as breast cancer, hepatocellular carcinoma, and cervical cancer (29–32). With regard to STS, Lee et al. first showed a weak negative correlation between ADC values and Ki-67 (17), while Yuan et al. explored a moderate negative correlation between ADC and D values and Ki-67 expression in a mouse model of rhabdomyosarcoma (33). Our study showed that ADC values did not correlate with Ki-67 expression, while D values decreased as Ki-67 expression increased. Although it is theoretically suggested that increased cell number and cell density per unit volume leads to a narrowing of the cell gap and thus causes a restriction in the true diffusion of water molecules (34), the instability brought about by the histological type cannot be ignored. Targeted studies for each subtype of sarcoma may be more clinically instructive.
The D* and f values reflect the microcirculation perfusion in the tissue, which is mainly affected by the number and length of capillaries and the permeability of the blood vessels (35). Our research demonstrated that both were of no value in distinguishing histological grade and Ki-67 expression, which was consistent with a previous study conducted on hepatocellular carcinoma (36). We reviewed several studies that applied IVIM to soft tissue tumors and found that scholars are controversial about the ability of D* and f to reflect the microcirculation of soft tissue tumors. According to the research by Wu et al. (37) and Du et al. (38), D* and f values could distinguish the blood supply status of benign and malignant soft tissue tumors. Conversely, Lim et al. got completely different results (39). We believed that the setting of b-values might cause this difference. Wu selected 9 b-values <200 s/mm2 to complete IVIM image acquisition and obtained stable D* and f value measurement results. However, only two b-values <100–200 s/mm2 were selected in the study by Lim et al., and the D* and f values obtained were unstable. In our study, 5 b-values were selected for the measurement of perfusion parameters, which may be the critical point for modeling stability. The larger standard deviation in the final measurement results also implies that the accurate modeling of the D* value requires more b-values to guarantee. In addition, the research by Yuan et al. indicated that D* could reflect the expression of VEGF in a mouse model of rhabdomyosarcoma, while the f value could not (40). Marzi et al. argued that there was no significant correlation between the perfusion parameters derived from IVIM and DCE-MRI parameters in soft tissue tumors (41). Therefore, we believe that the reliability and stability of the D* and f values used to reflect the perfusion level of STS need to be further confirmed by the selection of more b-values, accurate modeling, and narrowing the scope of the study.
Our research revealed that both MK and MD values show excellent value in predicting STS at grade 3; MK showed the highest diagnostic accuracy. Our findings are consistent with the study by Falk et al. (42). According to the research by Crombe et al., tumor heterogeneity is an independent predictor of grade 3 STS (43), and we tried to quantitatively evaluate this phenomenon using MK values. At the same time, our research shows that the diagnostic ability of the MK value is much higher than the MD value. This may mean that the histological grade of STS is not only reflected in cell density. Grade 3 STS can cause changes in tissue hypoxia, abnormal angiogenesis, necrosis, bleeding, and so on while growing rapidly, and MK can more accurately reflect the complexity of the tumor. The MD value measurement is more susceptible to interference, such as mucus and perfusion volume. Therefore, we believe that the MK value is more advantageous in evaluating high-grade STS.
The value of kurtosis parameters in assessing cell proliferation capacity in epithelial ovarian tumors and breast cancer has been investigated (44,45). To our knowledge, this is the first time that kurtosis parameters have been used to explore cell proliferative capacity in STS. We found that MK values showed the best correlation out of Ki-67 expression. Specifically, MK values increased with significantly higher Ki-67 expression, which is consistent with previous findings (44). DKI has the advantage of reflecting the anisotropy of the diffusive movement of water molecules within the tissue, whereas conventional DWI and IVIM imaging assess molecular movement within the tissue by isotropic techniques (46). However, the use of DKI in soft tissue tumors is still relatively rare, and the optimal scanning protocol for acquiring high b-value images is still in the developmental stage (47,48). Nevertheless, in this study, DKI remains the best imaging tool to evaluate the histological grading and cell proliferation capacity of STS.
Through the multi-parameter joint analysis, the predictive ability of quantitative parameters for grade 3 STS has been further improved. Diagnostic sensitivity increased from 78.26% to 95.65%, and diagnostic specificity was raised from 76.47% to 88.24%. We found that all parameters overlapped between the two groups of STS, and a multi-parameter combination can effectively avoid this interference.
In previous studies, peritumoral enhancement is considered a reliable predictor of grade 3 STS, which is consistent with our findings (43,49). However, other conventional MRI features, such as T2W imaging heterogeneity and necrosis, were unable to predict grade 3 STS in this study. We infer that the sample size may have a certain impact. At the same time, this may also indicate that the stability of qualitative diagnosis is not as good as quantitative analysis.
The present study has some limitations. First, the sample size was small. The variety of STS categories might affect our results. Second, the IVIM scanning scheme used in this study may not be the best choice, and we think this will be a hot issue in the next step. Finally, we did not separately analyze the STS rich in mucus components. The steroid components may affect the accuracy of the ADC results.
In conclusion, our study confirms the reliability of IVIM and DKI in predicting histological grade and Ki-67 expression; the quantitative parameters obtained from IVIM and DKI have high stability. In addition, the DKI model is more accurate than the IVIM model. The MK value had the best correlation with histological grading and cell proliferation capacity. Future research is needed to optimize MRI protocols to provide an imaging basis for clinical decision-making.
Footnotes
Declaration of conflicting interests
The author(s) declared no potential conflicts of interest with respect to the research, authorship, and/or publication of this article.
Funding
The author(s) disclosed receipt of the following financial support for the research, authorship, and/or publication of this article: This research was supported in part by grants from the National Natural Science Foundation of China (#81771804).