
Abstract
Background
The goal of medical imaging is not only to identify the entity “hepatocellular adenoma,” but to detect typical magnetic resonance (MR) patterns of the subtypes so that lesions with a higher malignant transformation rate could be differentiated from those that should just be controlled.
Purpose
To evaluate the differentiation between subtypes of hepatocellular adenomas using hepatobiliary specific contrast agent (Gd-EOB-DTPA) in MR imaging.
Material/Methods
A total of 11 patients with 39 lesions with histologically proven hepatocellular adenomas were evaluated. Of the, 34 were inflammatory hepatocellular adenomas (IHCA) and 5 were HNF1α adenomas. No β-catenin-mutated adenoma was found. In all patients, a standard protocol considering the guidelines of the international consensus conference of Gd-EOB-DTPA was performed in a 1.5-T scanner. Besides a qualitative analysis of all sequences, we measured the quantitative signal intensity (SI) ratio in all examinations.
Results
Qualitative analysis showed that best sequences for differentiation of HNF1α adenomas from IHCA were T1-weighted (T1W) precontrast (P = 0.03) and portalvenous phase (P < 0.0001) as well as arterial phase (P = 0.002). All adenomas were hypointense in hepatobiliary phase (15 min). The quantitative analyses of the SI ratio and of lesion-to-liver contrast (LLC) ratio show statistically significant differences in T1W precontrast (SI: P = 0.035; LLC: P = 0.049) and portalvenous phase (SI: P = 0.002; LLC: P = 0.002).
Conclusion
Subtyping of hepatocellular adenomas using Gd-EOB-DTPA is possible due to qualitative and quantitative analyses regarding T1W precontrast and portalvenous phase. In addition, the SI ratio and liver-to-lesion contrast ratio in the arterial phase gave additional qualitative information for differentiation.
Keywords
Introduction
Hepatocellular adenoma (HCA) is a rare benign liver tumor that typically occurs in young healthy women of childbearing age.
In the 1990s, this entity contained a more or less heterogeneous group of adenomatous lesions. A detailed classification system considering histopathological features was missing and different tendencies of malignant transformations of supposed subtypes were not taken into account.
In 2006, the members of a French research group from the Institute of Pathology in Bordeaux published a systematic study about the subtyping of HCAs based on molecular, biological, and immunohistochemical patterns.
According to that, HCAs could be classified into three defined subtypes and one unclassified group as shown below (the corresponding prevalences are in brackets) (1–7).
HCA with HNF1α mutation (35%) HCA with β-catenin mutation (10%) inflammatory HCA (IHCA) (45%) unclassified HCA (10%)
Of particular clinical and therapeutic interest is the fact that HCA with β-catenin mutation shows a higher tendency of malignant transformation than the other subtypes.
The goal of medical imaging is not only to identify the entity “hepatocellular adenoma,” but to detect typical magnetic resonance (MR) patterns of the subtypes so that lesions with a higher malignant transformation rate could be differentiated from those that should just be controlled.
Systematic studies dealing with MR morphological patterns of adenoma subtypes using hepatobiliary specific contrast agent are currently rare.
The aim of the present study was to evaluate the subtyping of HCAs due to MR morphological features using gadolinium ethoxybenzyl diethylenetriamine pentaacetic acid (Gd-EOB-DTPA). The comparison is based on both qualitative and quantitative characteristics and the results are reviewed on statistical significance.
Material and Methods
The observation unit comprised all of the magnetic resonance tomography (MRT) studies carried out with Gd-EOB-DTPA on patients with confirmed HCA over a period of five years. Patients who also had proven diffuse liver parenchymal damage of any etiology were excluded. In a total of 11 patients, 39 HCAs could be defined as units for study, where only patients with histological confirmation of at least one of the well-defined liver lesions were considered. In patients with multiple loci, in addition to the histologically confirmed lesion, loci with equivalent signal behavior and a minimum axial diameter of 10 mm were included.
Image acquisition, study protocols, and sequence parameters
The studies were conducted using a total of three MRT systems with a field strength of 1.5 T using a standardized protocol sequence. An element of the protocol was the addition of a native T1-weighted (T1W) sequence with fat saturation before contrast administration, and depending on the instrument used, supplemented by a T1 in-phase/opposed-phase sequence or a T1 non-fat-saturation sequence. The contrast agent dynamics included the following phases: arterial, venous, and equilibrium phases; and a hepatocyte-specific phase that was preceded by a T2-weighted (T2W) sequence. The instrument-specific sequence parameters used are shown in Table 1.
Standardized sequence protocol for liver MRI with Gd-EOB-DTPA.
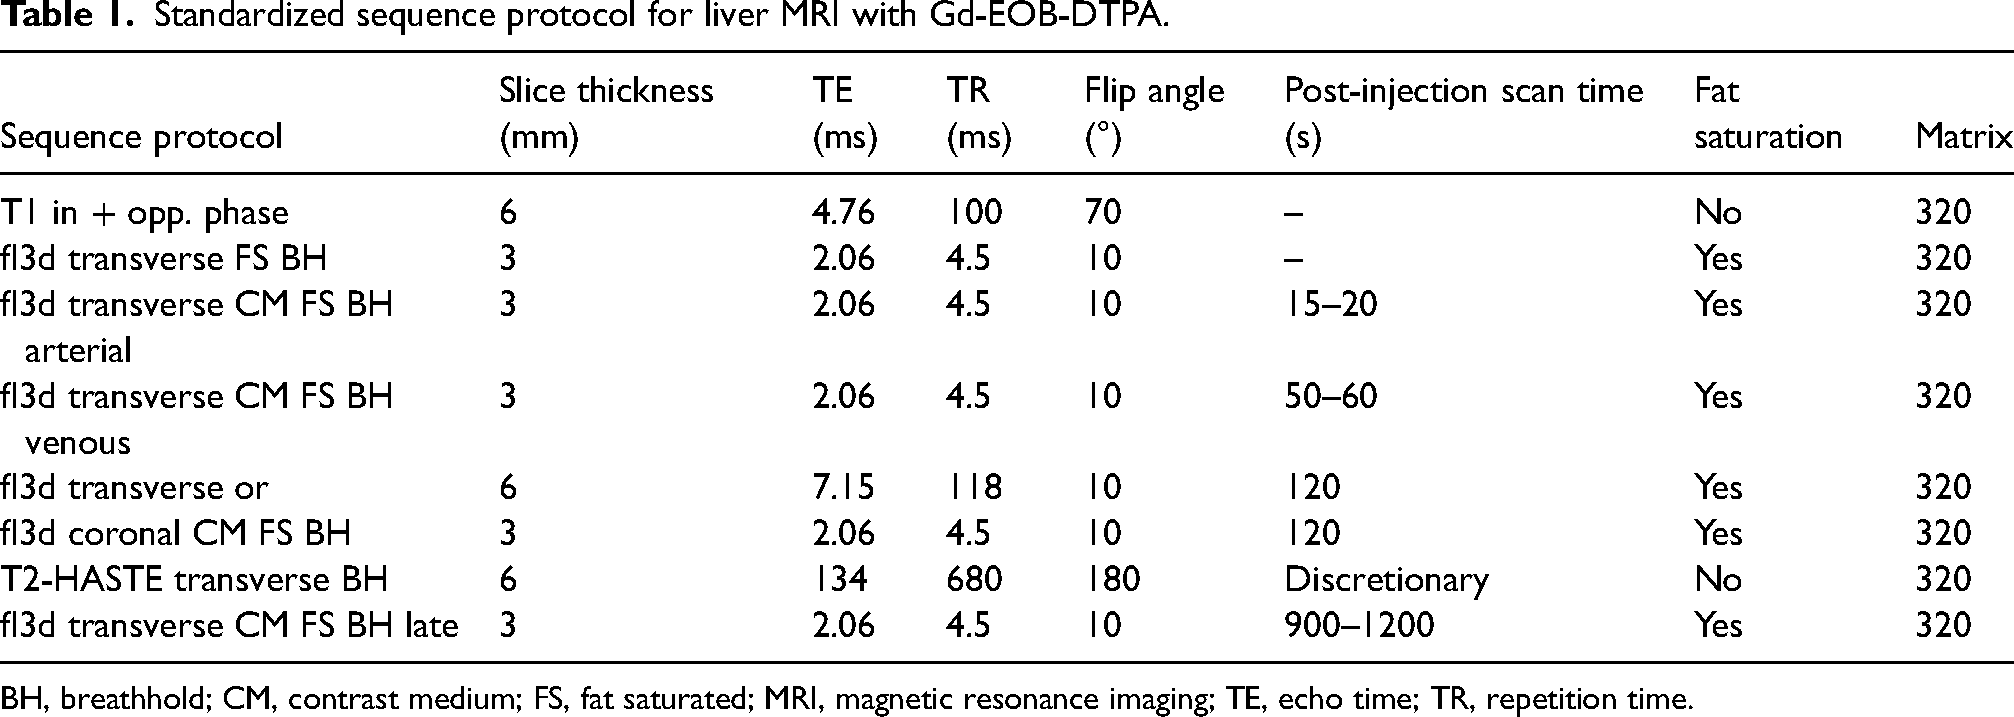
BH, breathhold; CM, contrast medium; FS, fat saturated; MRI, magnetic resonance imaging; TE, echo time; TR, repetition time.
The contrast agent dynamics sequences were performed after administration of a CARE bolus of 0.5 mL of Gd-EOB-DTPA at a flow rate of 1 mL/s. The contrast agent dose was calculated at 0.1 mL/kg body weight (=0.025 mmol/kg body weight) and was administered intravenously at a flow rate of 1 mL/s.
Parameters for the liver lesion studies
The patient population was analyzed for sex and age distribution, as well as the number of lesions present. The following parameters were determined for all liver lesions detected: size in the axial stratification in two dimensions; location of the lesion; the presence of hemorrhagic inclusions; the presence of a central scar; delineation of afferent arterial vessels; or lipomatous components.
In addition, qualitative and quantitative analyses were carried out of the intensity of each lesion compared to the rest of the liver parenchyma in the native and all dynamic contrast agent sequences.
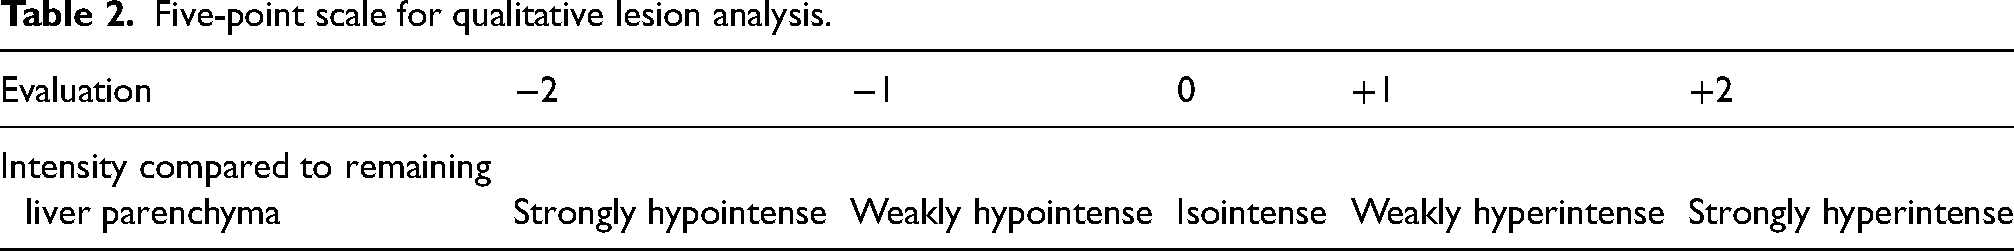
Qualitative analysis
The qualitative analysis was carried out using a 5-point scale (Table 2). Each included lesion was compared by intensity relative to the surrounding liver tissue and was assigned an appropriate value based on the ranking scale.
Five-point scale for qualitative lesion analysis.
Quantitative analysis
The quantitative analysis was performed by identifying a region of interest (ROI) that was centrally located in the lesion to be studied, as well as a representative point in the remaining liver parenchyma/paraspinal muscles. Vessel sections or bile ducts were explicitly avoided, and the size of the ROI was at least 25 mm2. The native and all dynamic contrast agent phases were considered. Using the ROI values determined, the signal intensity (SI) ratio as well as the lesion-to-liver contrast (LLC) for all phases were calculated as follows: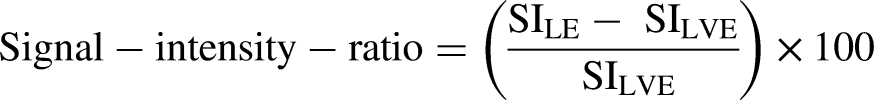

For the analysis, descriptive statistics were calculated for all subgroups and both parameters (SI and LLC ratios) for all sequences used in each case, namely minimum, maximum, first quartile, median, third quartile, mean, variance, and standard deviation. To visualize the results, the calculated descriptive statistics data were used to create the corresponding box plots for all subgroups, parameters, and sequence phases. Statistical comparisons were performed by means of Mann–Whitney tests; two-sided P values <0.05 were considered to be descriptively significant.
Results
The observation unit included a total of 11 patients (11 women; mean age = 38 years) with histologically confirmed HCAs. From the subgroup analysis, 34 out of 39 adenomas could be classified as inflammatory adenomas, of which 0 had additional β-catenin mutation. Five adenomas were of the HNF1α subtype. No pure β-catenin-mutated adenomas or unclassified adenomas were found.
The mean number of existing lesions per patient was 3.5; the maximum was 7 lesions in one patient. Patients with adenomatosis by definition were not seen. Taking all lesions with a minimum diameter of 10 mm in the axial stratification into account, the mean long diameter was 31.4 mm and the short diameter was 23.1 mm.
There was an increased incidence of HCA in the right lobe of the liver, with 69.2% in comparison to 30.8% in the left hepatic lobe. Of the 39 adenomas, six showed signs of internal hemorrhaging with T1 hyperintense portions, where the severity found was quite varied between only peripheral to diffuse and strong. The patients thus fell into two subgroups (1 HNF1α, 5 IHCA). Because of either signal loss in the chemical shift sequence or signal loss in the native fat-saturated T1 sequence, fat inclusions could be detected in 12 (30.7%) of the 39 HCAs. An overview of the parameters studied is shown in Table 3.
Overview of the parameter studies for the main HCA group.
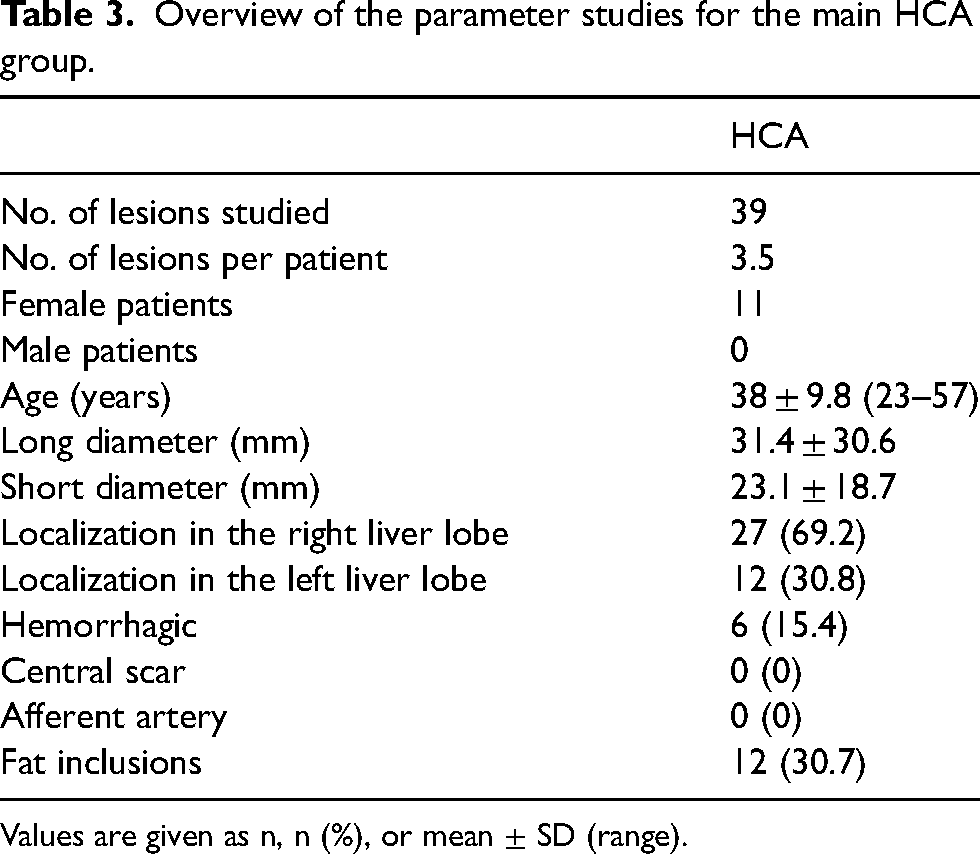
Values are given as n, n (%), or mean ± SD (range).
Comparisons between the adenoma subgroups
Qualitative comparison of IHCA – HNF1α adenomas
Of the 39 hepatocellular adenomas present, 34 were associated with the inflammatory adenoma subtype, and 5 with the HNF1α adenoma subtype. No pure β-catenin-mutated adenomas were present in the population studied, and likewise there were no unclassified adenomas. Applying the 5-point ranking system for the qualitative analysis of the lesions in the two extant adenoma subgroups described gives the following absolute frequencies.
The majority of HNF1α adenomas appear as hypointense (4/5) in the native T1W image, whereas the majority of the inflammatory adenomas appear as iso- or hyperintense (26/34) (P = 0.03). All the HNF1α adenomas appear in the arterial phase without relevant intensity increases, whereas more than half of the inflammatory adenomas appear as strongly hyperintense compared to liver tissue (P = 0.002). In the venous phase, all the HNF1α adenomas appeared to be hypointense compared to the rest of the liver tissue, although 31 of the 34 inflammatory lesions appeared to be at least iso- or hyperintense (P < 0.0001) (Tables 4 and 5). No significant differences were apparent in the T2W sequence or the hepatobiliary phase, and all the adenomas appeared hypointense.
Five-point scale representation of the IHCA group in the individual protocol phases.
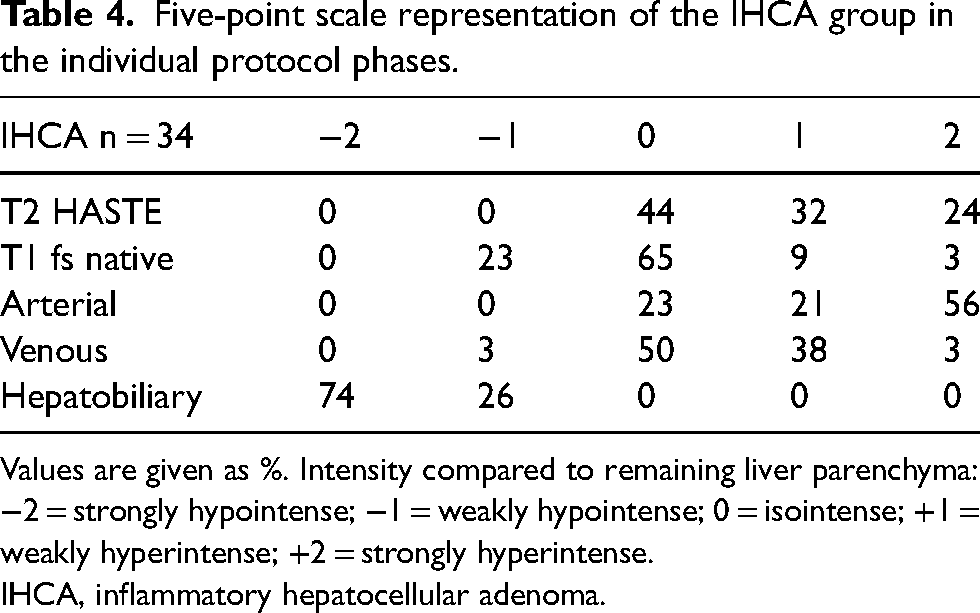
Values are given as %. Intensity compared to remaining liver parenchyma: −2 = strongly hypointense; −1 = weakly hypointense; 0 = isointense; +1 = weakly hyperintense; +2 = strongly hyperintense.
IHCA, inflammatory hepatocellular adenoma.
Five-point scale representation of the HNF1α adenoma group in the individual protocol phases.
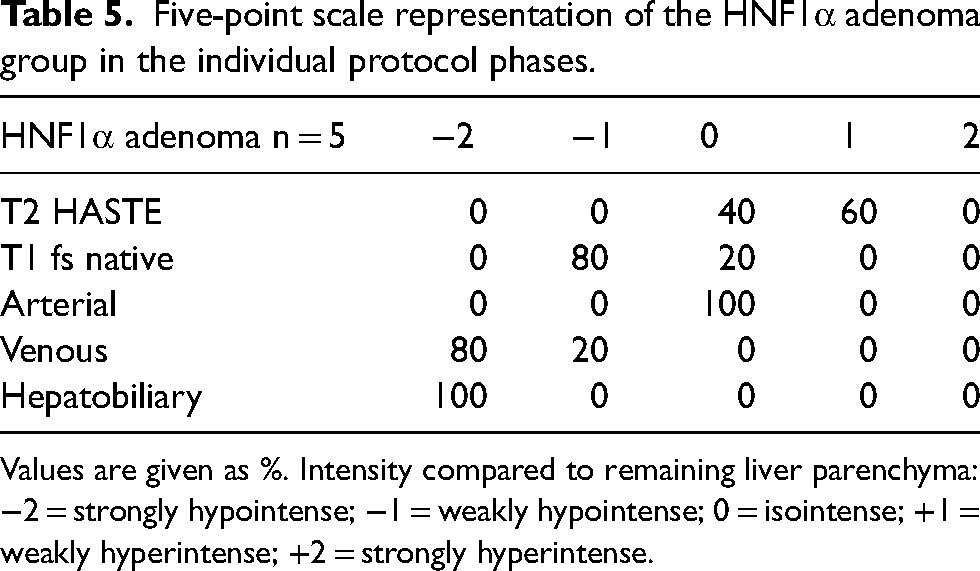
Values are given as %. Intensity compared to remaining liver parenchyma: −2 = strongly hypointense; −1 = weakly hypointense; 0 = isointense; +1 = weakly hyperintense; +2 = strongly hyperintense.
Quantitative comparison of IHCA – HNF1α adenomas
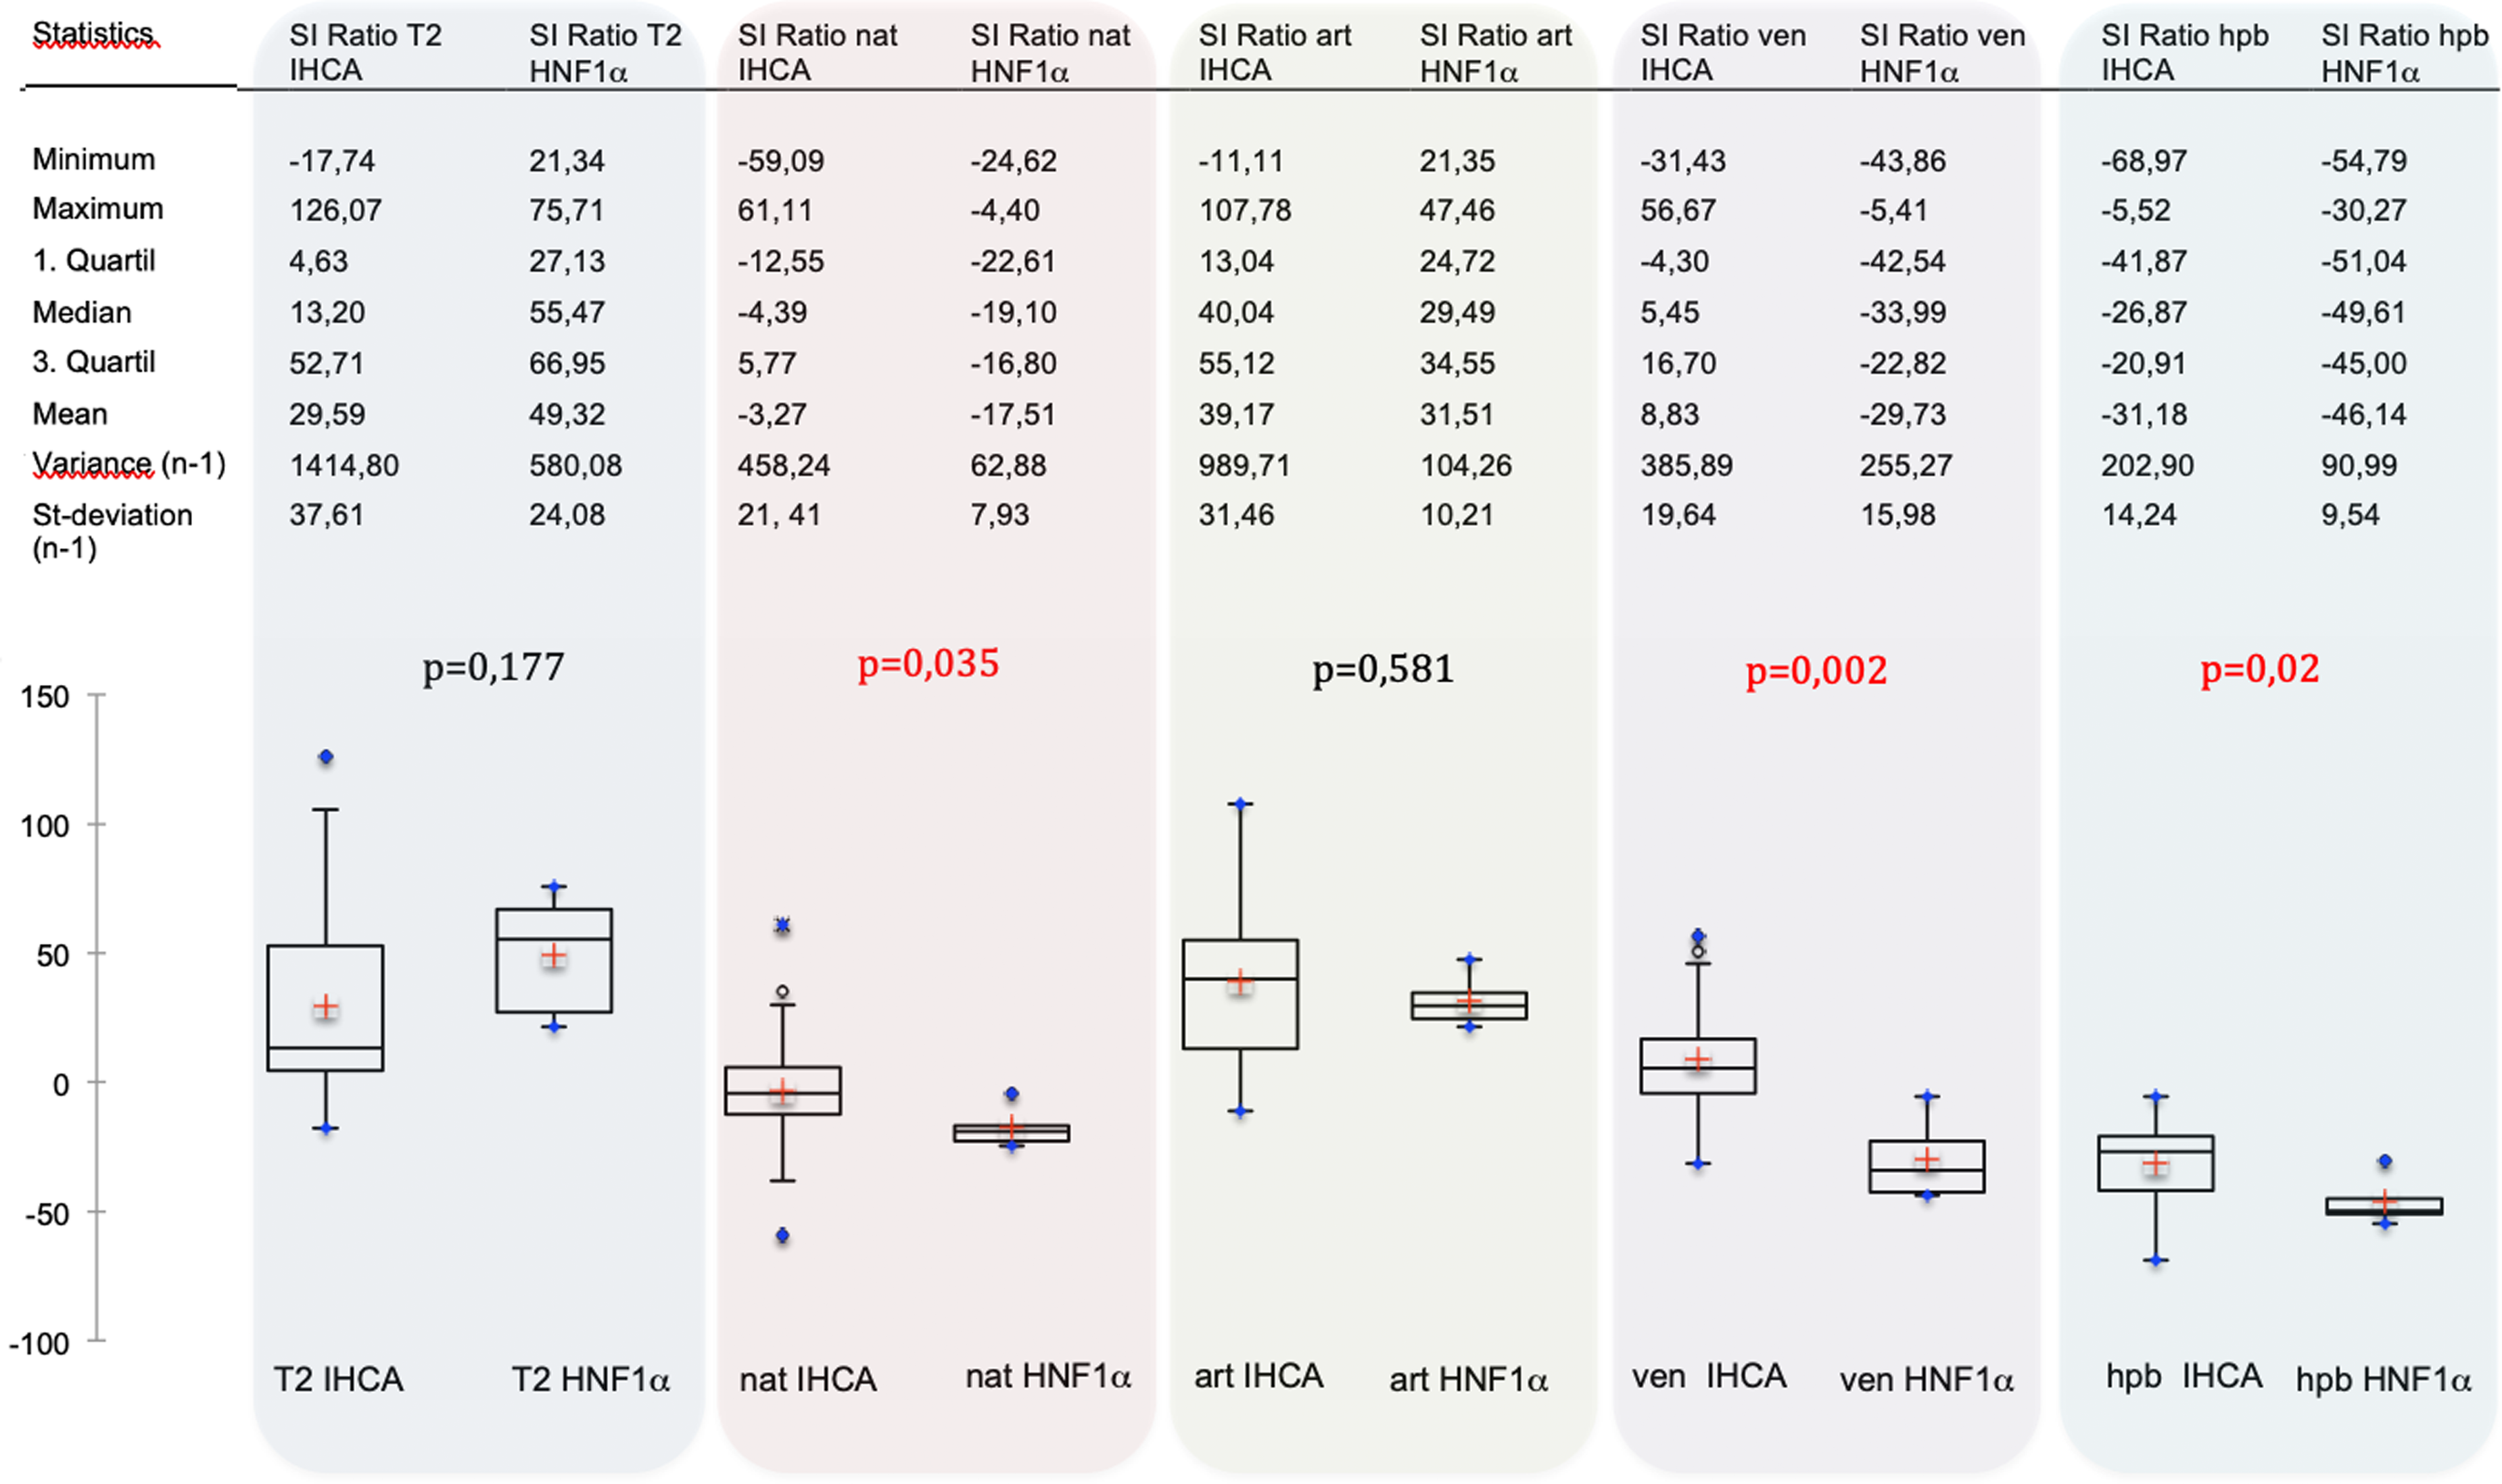
A summary of the descriptive statistics, box plots, and the calculated P values for the IHCA and HNF1α subgroups are shown in Figs. 1 and 2.
A summary of the descriptive statistics, box plots, and the calculated P values for the IHCA and HNF1α subgroups. IHCA, inflammatory hepatocellular adenoma.
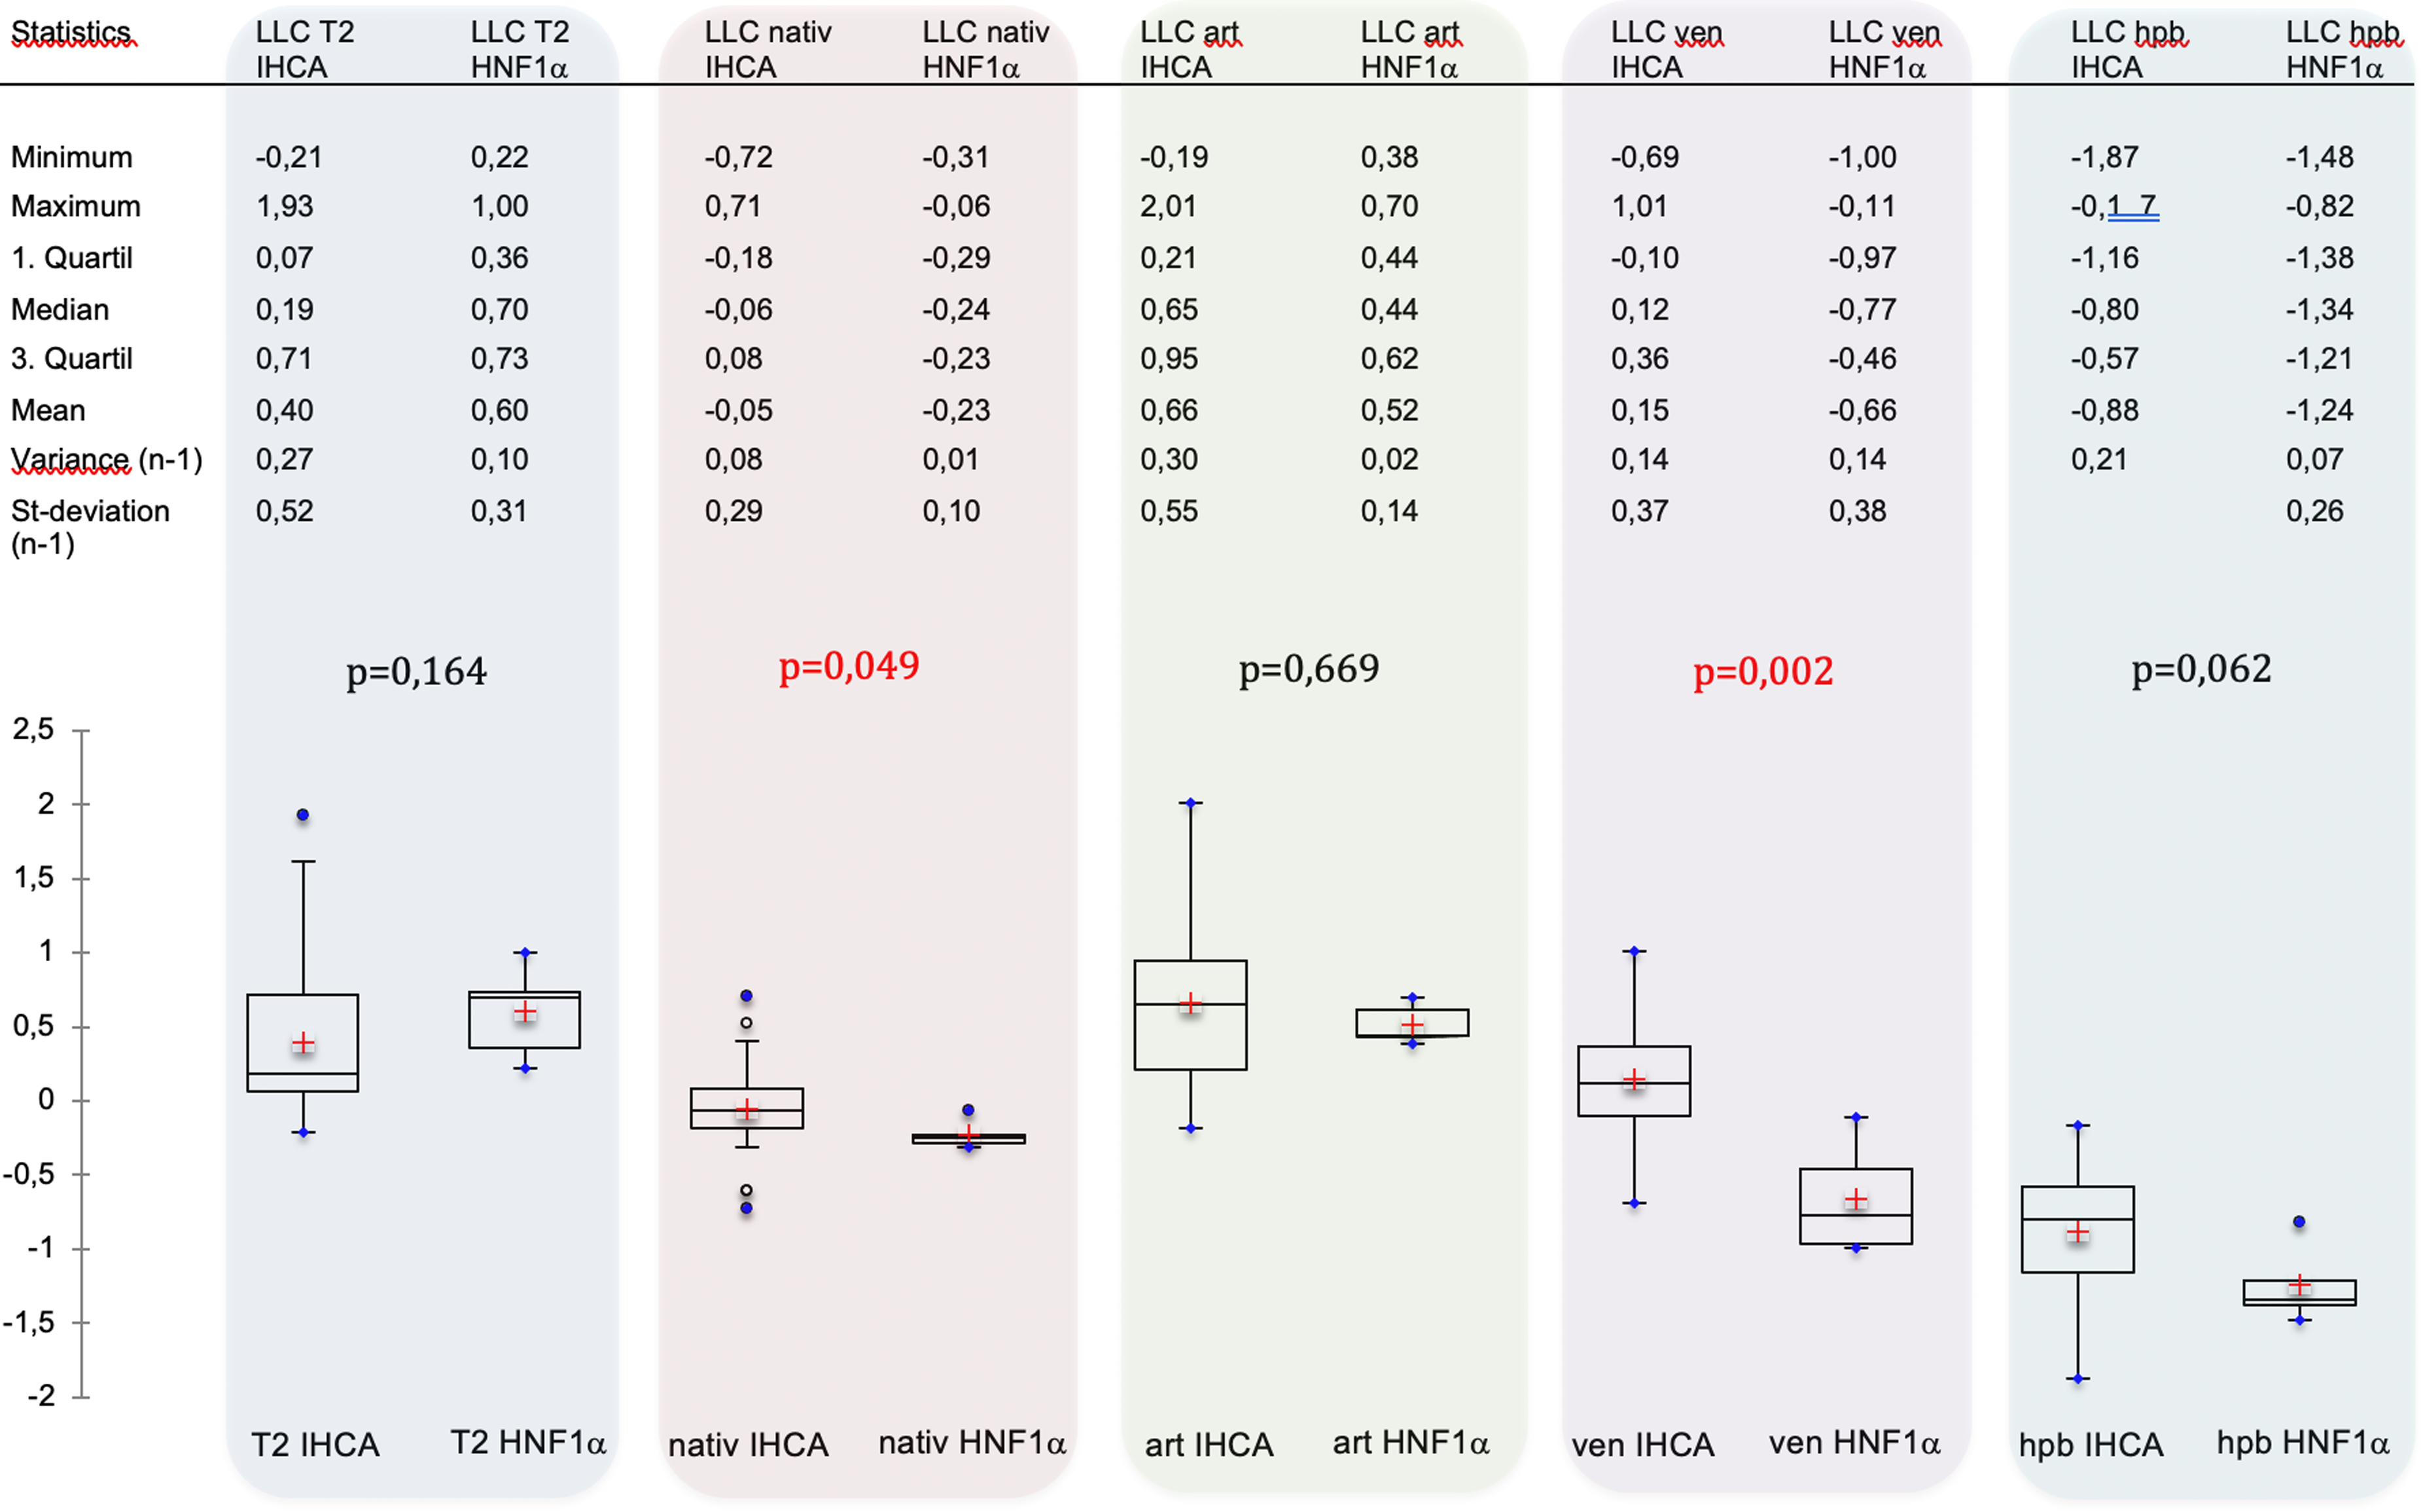
A summary of the descriptive statistics, box plots, and the calculated P values for the IHCA and HNF1α subgroups. IHCA, inflammatory hepatocellular adenoma.
Considering the measures of location and variation for the two adenoma groups, a broader distribution is apparent for the IHCA subtype compared to HNF1α in the data in all phases and for the two calculated parameters. From the plots of the SI ratio versus LLC, the following common factors are seen: for the T2 and arterial phase, the entire box (i.e. the interquartile range) for both subgroups is localized in the positive range, where all values for the HNF1α adenomas (even the outliers) lie above the 0 line (T2: P = 0.164 for LLC and P = 0.177 for the SI ratio; arterial: P = 0.669 for the LLC and P = 0.581 for the SI ratio). By contrast, all the data for both groups in the hepatobiliary phase fall within the negative range of values (P = 0.62 for the LLC and P = 0.02 for the SI ratio). Although all data for the HNF1α adenomas are in the negative range for the native and the venous phases, the box for the IHCA adenomas cuts the zero line into two phases (native: P = 0.049 for the LLC and P = 0.035 for the SI ratio; venous: P = 0.002 for the LLC and P = 0.002 for the SI ratio). Thus, the calculated P values show statistically significant differences between the two adenoma subgroups for the LLC and SI ratios in both the native and venous phases. Similarly, in the hepatobiliary phase, significant differences are apparent in the LLCs (but not the SI ratios) for both groups. Considering the T2 and arterial phases, no statistical significance is apparent for the two calculated parameters obtained.
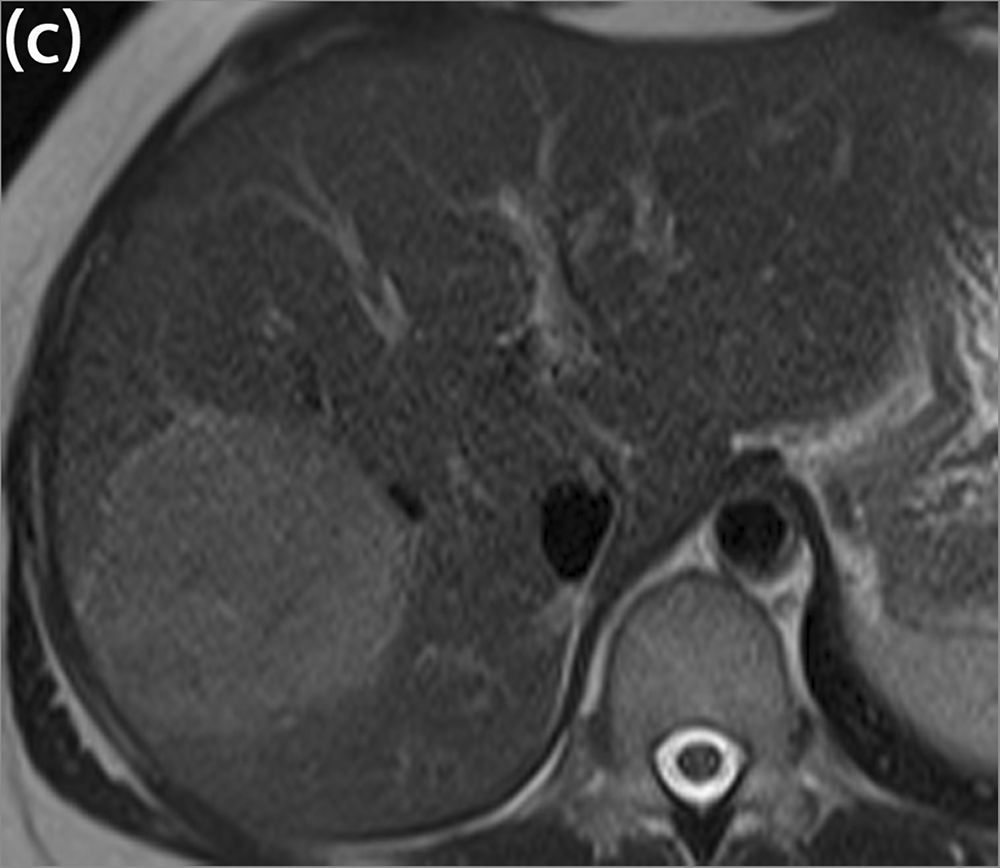
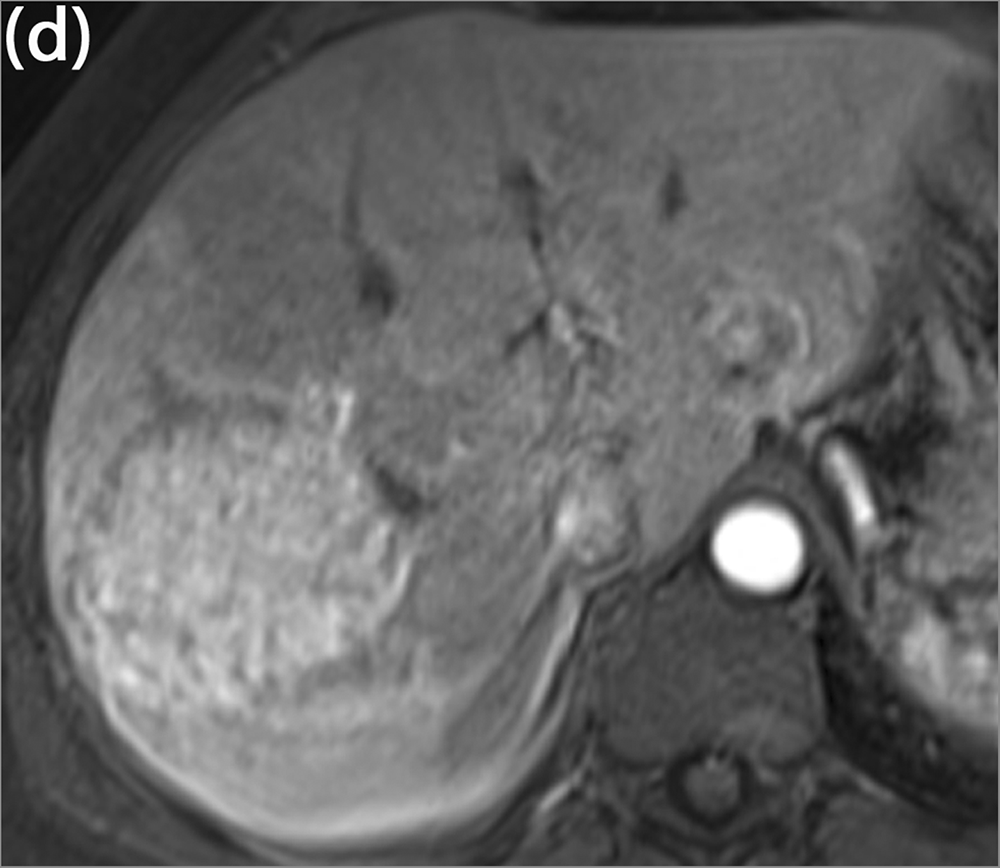
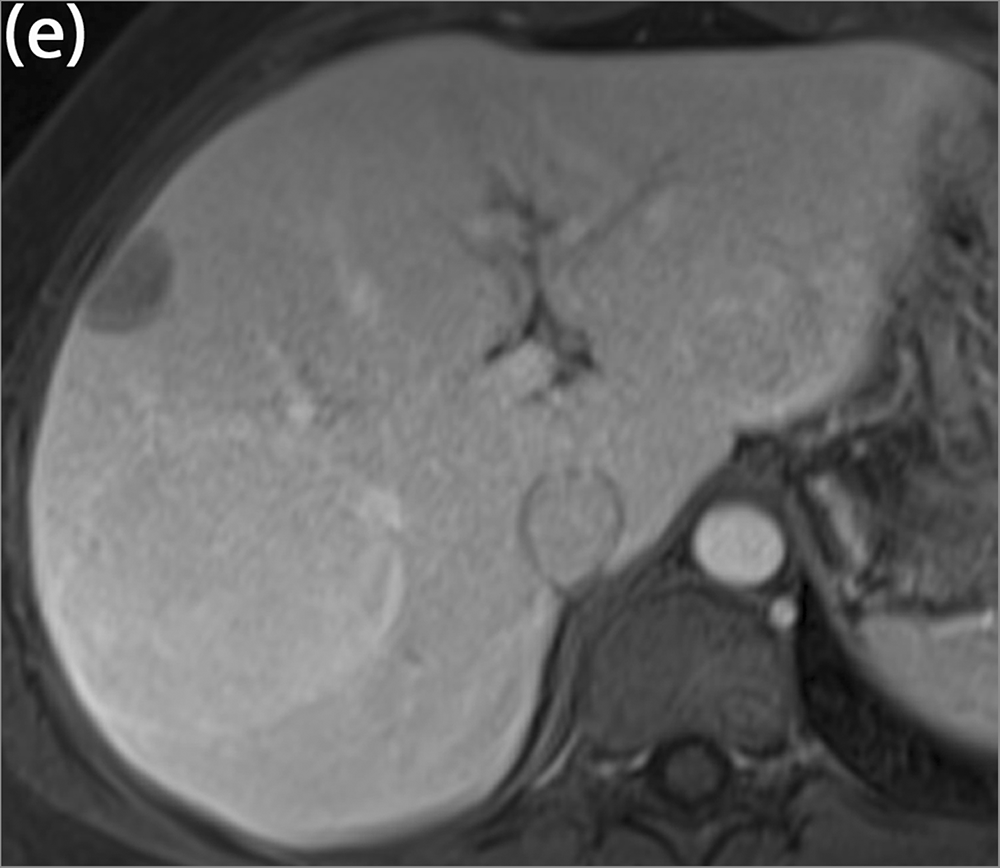
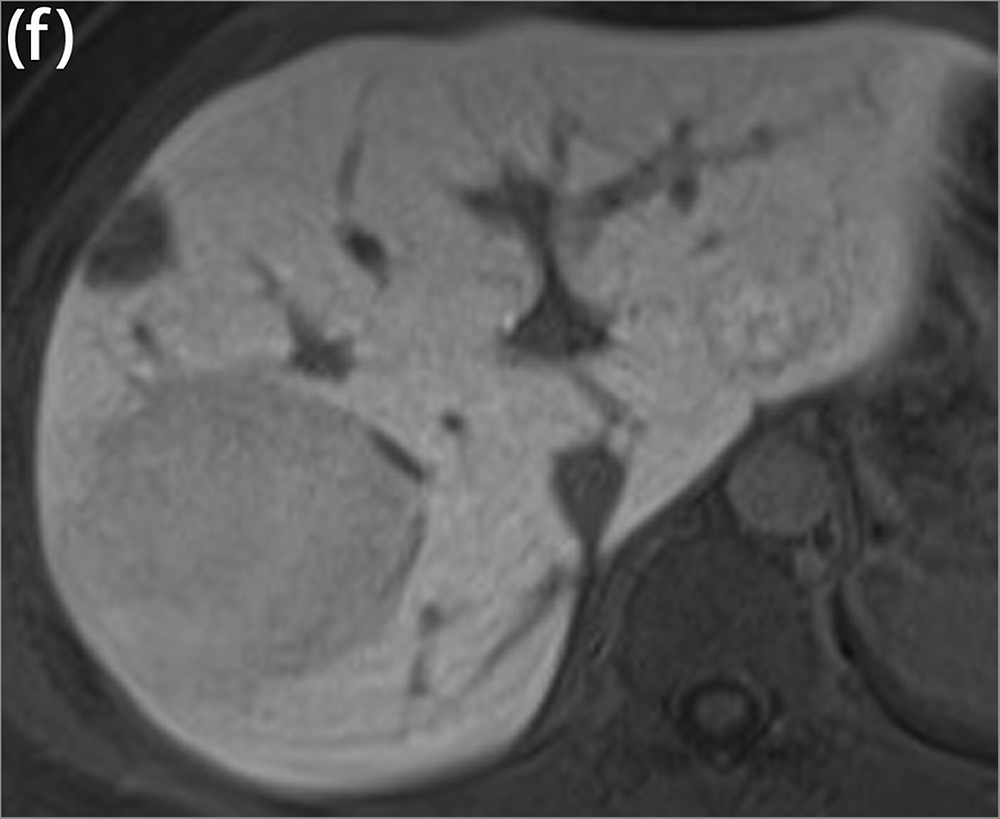
An example of a patient with histologically confirmed HNF1α adenoma as well as IHCA is shown in Figs. 3–8.
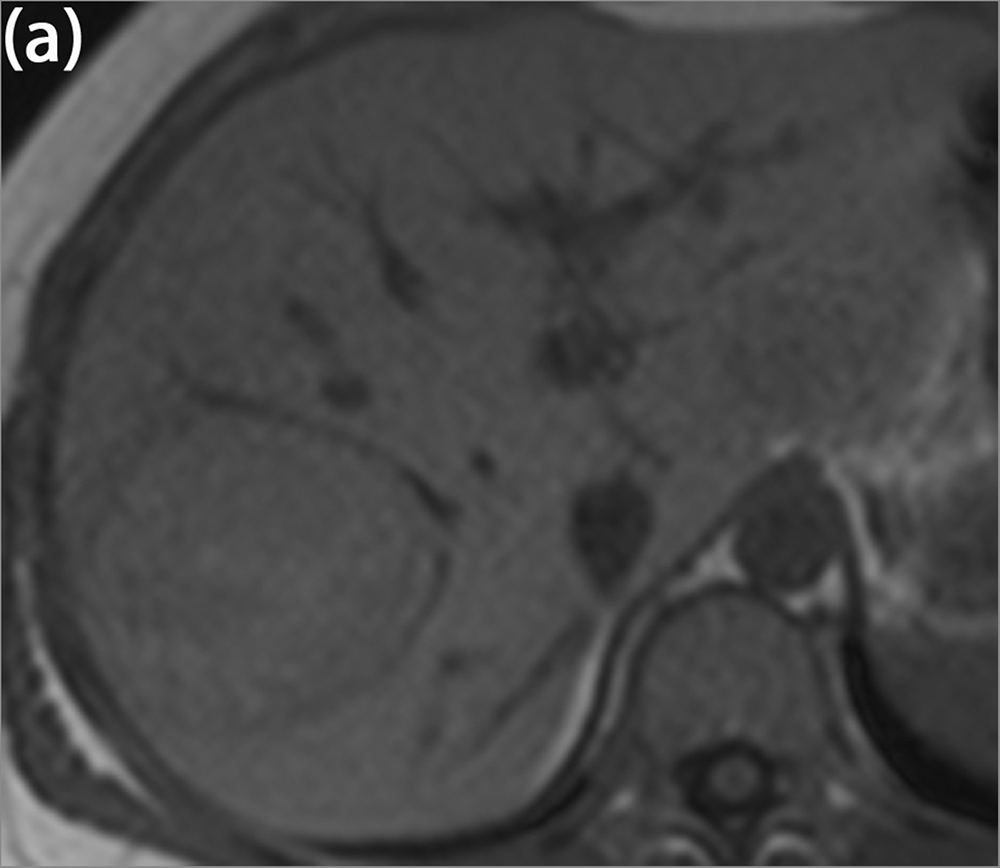
A 33-year-old asymptomatic patient with histologically confirmed HNF1α adenoma in segment VIII and histologically confirmed IHCA in segment VII. IHCA, inflammatory hepatocellular adenoma. T1 fl2d tra in-phase.
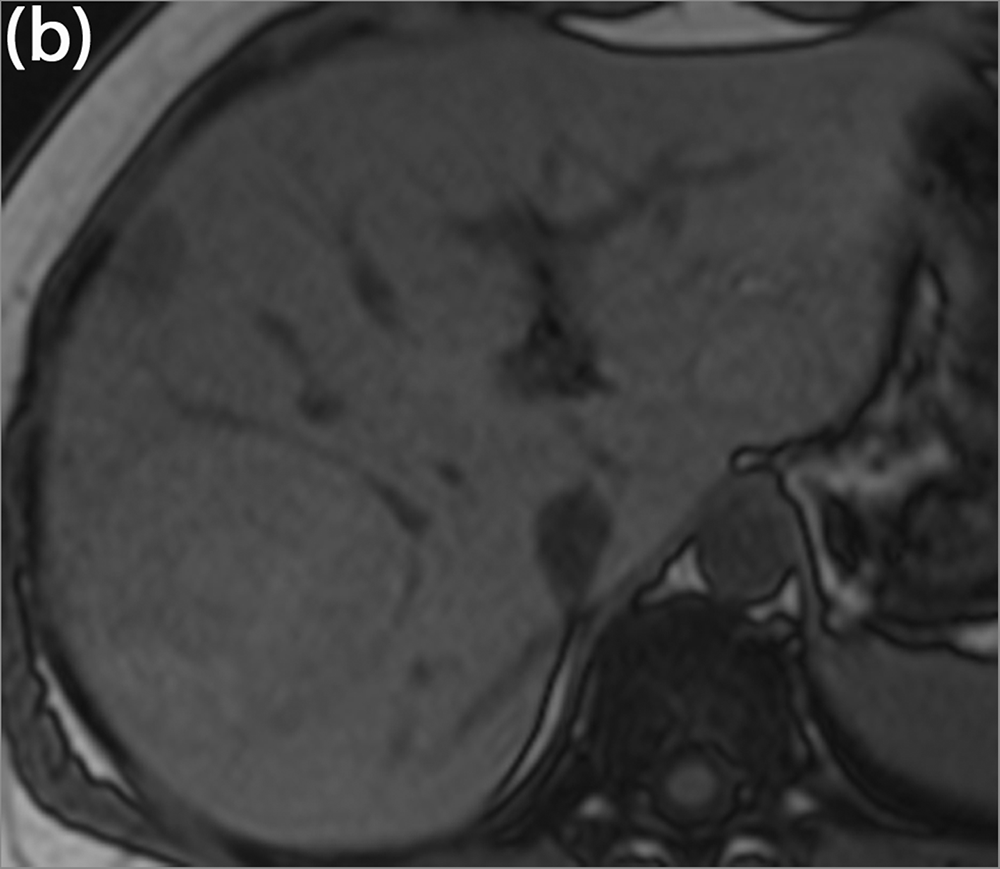
A 33-year-old asymptomatic patient with histologically confirmed HNF1α adenoma in segment VIII and histologically confirmed IHCA in segment VII. IHCA, inflammatory hepatocellular adenoma. T1 fl2d tra opposed-phase: typical evidence of fat in the HNF1α adenoma in the opposed phase.
A 33-year-old asymptomatic patient with histologically confirmed HNF1α adenoma in segment VIII and histologically confirmed IHCA in segment VII. IHCA, inflammatory hepatocellular adenoma. T2 HASTE tra.
A 33-year-old asymptomatic patient with histologically confirmed HNF1α adenoma in segment VIII and histologically confirmed IHCA in segment VII. IHCA, inflammatory hepatocellular adenoma. T1 fl3d tra CM arterial: no significant hyperarterialization of the HNF1α and a typical strong hyperarterialization of the IHCA. CM, contrast medium.
A 33-year-old asymptomatic patient with histologically confirmed HNF1α adenoma in segment VIII and histologically confirmed IHCA in segment VII. IHCA, inflammatory hepatocellular adenoma. T1 fl3d tra CM venous: hypointensity of the HNF1α adenoma in the venous phase and isointensity of the IHCA in the venous phase. CM, contrast medium.
A 33-year-old asymptomatic patient with histologically confirmed HNF1α adenoma in segment VIII and histologically confirmed IHCA in segment VII. IHCA, inflammatory hepatocellular adenoma. T1 fl3d tra CM hepatobiliary after 15 min: both adenomas appear hypointense in the hepatobiliary phase CM, contrast medium.
Discussion
HCA is a rare benign liver tumor, the incidence of which is estimated in the literature to be 0.1–4 per 100,000. It is often diagnosed only accidentally, due to the typical patient population being healthy, young women of childbearing age. Adenomas are asymptomatic in most cases, and imaging is often done only in the context of an investigation of upper abdominal discomfort, when the foci cause distension pain in the liver capsule due to their size, or they become symptomatic due to substantial hemorrhage. Large patient populations are thus often available for very long observation periods. The present work includes an observation period of five years, during which 39 HCAs could be evaluated through MR imaging studies with enhancement from Gd-EOB-DTPA; according to the current literature, this is one of the largest adenoma populations investigated with Gd-EOB-DTPA to date. Previous studies on the typical MR morphological features of HCA showed hemorrhage and lipomatous inclusions as typical for adenoma (8–17), where the frequencies given for these characteristics vary widely. Consistent with the work of Grazioli et al., none of the HCAs in our study showed a central scar (18) and 15% of the observed adenomas showed signs of hemorrhage, which is comparable to the results reported by Ronot et al., in which hemorrhage was observed in 12.7% of the examined adenomas (11). Due either to signal loss in the chemical shift sequence or signal loss in the native fat-saturated T1 sequence, fat inclusions could be detected in 30.7% of adenomas. This reflects the similar relationship described by Grazioli et al., who found 53.5% fat inclusions in adenomas (18). Bise et al. claim an even higher amount of fat inclusions, especially for the HNF1α adenomas of 67% . Thus, the present results regarding the MR morphological criteria for HCAs confirm the abovementioned trend in the literature of being able to attribute the typical features to these lesions.
As described above, according to the study by a French research group headed by Bioulac-Sage et al., adenomatous liver lesions can be divided into three defined subtypes and one unclassified group (1–5,14–17).
The aim of the present was the elaboration of the typical MR morphological characteristics of the respective subgroups using Gd-EOB-DTPA. In the patient population studied with 39 HCAs, a total of 34 were of the inflammatory adenoma subtype (IHCA) and 5 could be associated with the subtype HCA having the HNF1α mutation. No pure HCAs with the β-catenin mutation or unclassified adenomas were found, which should be regarded as a limitation of the study, especially with due regard to the higher tendency of malignant transformation of the β-catenin-mutated subtype. Consequently, only the two subgroups of IHCA and HNF1α adenomas could be compared, while these already account for about 75% of HCAs. In previous studies using non-liver-specific contrast agents, to date a total of seven pure HCAs with the β-catenin mutation could be detected (11,19,20), but these exhibited no specific MR morphological characteristics.
Considering the qualitative evaluation of the two adenoma subgroups IHCA and HNF1α, most lesions appear as isointense or weakly hyperintense in the T2W sequence, and by calculating the P value, the overall result is no significant difference in the intensities (P = 0.602). Nevertheless, it is striking that 11 of 34 inflammatory adenomas were weakly hyperintense while 8 of 34 were strongly hyperintense compared to the rest of the liver tissue, while none of the HNF1α adenomas appeared as strongly hyperintense. The reason for this comes from the histologic features described for this subtype: the sinusoidal dilatations described can cause the hyperintense T2 signal response (16,19). A potentially increased occurrence of dilations in the edge region of the focus was described by van Aalten in a 2011 study as an “atoll sign,” which contains a narrow, particularly T2-hyperintense focus edge boundary (20) and is meanwhile considered a classic sign by authors such as Auer et al. (16). Bise et al. further described a “crescent sign” corresponding to a partial peripheral rim, hyperintense on T2W images and/or arterial phase with persistent delayed enhancement as a new pattern of IHCA (15), In our population, four of the inflammatory adenomas exhibited the “atoll sign” described, while none of the HNF1α adenomas did. In the native T1W phase, the IHCA was highly variable, appearing anywhere from weakly hypointense to strongly hyperintense, while up to 80% of the HNF1α adenomas appeared weakly hypointense, reflecting the increased fat content of HNF1α adenomas (P = 0.03), histologically described as a typical pattern that has already been described several times (15,16,18–20). Bise et al. described a low T1 signal in combination with mild hypervascularization in arterial phase and low signal in the hepatobiliary phase as a new hypovascular pattern in HNF1α adenomas (15). There are only few data at present on dynamic contrast agent sequences using Gd-EOB-DTPA for the subgroup analysis of adenomas, but what is known is comparable to results from studies carried out with non-liver-specific contrast agents. Auer et al. claim that the use of Gd-EOB-DTPA is of added value for subtyping the differentiation of HCAs and that diagnostic accuracy can be improved (16). As described, a strong arterial enhancement and a persistent venous enhancement (absence of washout) are attributed to IHCAs (18,19). We were able to confirm both characteristics in the present work, and from the calculated P values to classify them as statistically significant: 19 of 34 IHCAs were found in the arterial phase contrast to appear strongly hyperintense in comparison to the rest of the liver tissue, thus demonstrating a strong arterial enhancement. Of the 34 lesions, 7 showed a weak arterial enhancement, while only 8 remained isointense. By contrast, all HNF1α adenomas appeared isointense in the arterial phase (P = 0.002), exhibiting 100% washout in the venous phase with hypointense signal behavior, which occurred in only 3 out of 34 from the IHCA group (P < 0.0001), consistent with findings of Wong et al., who found arterial enhancement that persists on later phase in IHCA and variable arterial enhancement that does not persist on later phases in HNF1α adenomas (17). The increased arterial vascularization in the IHCA group is most likely caused by relatively more prolific and stronger arterial vessels (19). As an explanation of the persistent venous enhancement in the IHCAs, one can also point to sinusoidal extensions that lead to a slowing of the blood flow and thus cause an accumulation of contrast agent in the venous phase condition (17,19). Regarding the hepatobiliary phase, all lesions, regardless of subtype, appeared hypointense compared to the rest of the liver tissue, which confirms both the common theory of signal behavior of adenomas as an overall group using liver-specific contrast agent (10,18,21) and the results to date on the behavior of the subtypes (18). Thus, no significant differences between the two subgroups can be detected in the hepatobiliary phase (P = 0.190). Auer et al., in contrast to our results, were able to demonstrate a significant Gd-EOB-DTPA uptake in IHCA in the hepatobiliary phase and use this as a diagnostic criterion in addition to rim enhancement (16). In contrast to the typical MR morphology of hepatocellular carcinoma (HCC), no adenoma subtype showed hyperarterialization in combination with venous washout. Aside from that, HCC is a typical tumor of patients with diffuse liver disease; our study population only included patients with focal liver lesions without any diffuse parenchyma disease.
In the results of the quantitative analysis, from the calculations of the SI ratio and the LLC and the interpretation of the box plots, a comparison of the adenoma subgroups shows an equivalent positional distribution with respect to the 0 line for the boxes for the SI ratio and LLC. The calculated P values at an assumed significance level of 5%, however, are not congruent with significant differences; while the SI ratio in the hepatobiliary phase does exhibit a significant difference between the two subgroups (P = 0.02), the LLC in the same phase does not (P = 0.062). Thus, it appears to matter which parameter is calculated here for the quantitative evaluation of lesions. Comparing the P values from the qualitative with those from the quantitative analyses, the following similarities arise: significant differences were found in the native T1W sequence as well as in the venous phase. No significance in the T2W phase could be proven by any method. The following unexpected results are noted: in the arterial phase, the qualitative analysis shows significance (P = 0.002), while the quantitative analysis with P = 0.58 (SI ratio) and P = 0.669 (LLC) does not. By contrast, as described above, the SI ratio showed significant differences in the hepatobiliary phase with P = 0.02, which were not confirmed by the LLC or the qualitative evaluation.
The present study has some limitations. First, the sample size for the two groups is very different, and the HNF1α adenoma group in particular is very small, which consequently can lead to a large impact on the descriptive statistics by individual effects. Moreover, the predictions based on the use of a ROI (22) are of limited validity, especially in inhomogeneous lesions. Representative results also require the ROI to be of a constant size, and to be located far away from possible vascular, bile duct, or capsule sections, requirements that were followed explicitly in the present work. However, representativeness is limited for inhomogeneous, intralesional areas, and by hemorrhaging or the fatty components that are common in adenomas. In addition, it should be noted that the categorization system used for the qualitative analysis is a purely visual evaluation, and the cutoff points for each category were chosen arbitrarily.
In conclusion, the best sequences for the differentiation of HNF1α adenomas from IHCA were the T1W precontrast and portal venous phase as well as the arterial phase. All adenomas were hypointense in hepatobiliary phase (15 min). The quantitative analyses of the SI ratio and LLC ratio show statistically significant differences in the T1W precontrast and portal venous phases.
Footnotes
Declaration of conflicting interests
The author(s) declared no potential conflicts of interest with respect to the research, authorship, and/or publication of this article.
Funding
The author(s) received no financial support for the research, authorship, and/or publication of this article.