
Abstract
Background
Accurate differentiation of nodular fasciitis (NF) from soft tissue sarcoma (STS) before surgery is essential for the subsequent diagnosis and treatment of patients.
Purpose
To develop and evaluate radiomics nomograms based on clinical factors and magnetic resonance imaging (MRI) for the preoperative differentiation of NF from STS.
Material and Methods
This retrospective study analyzed the MRI data of 27 patients with pathologically diagnosed NF and 58 patients with STS who were randomly divided into training (n = 62) and validation (n = 23) groups. Univariate and multivariate analyses were performed to identify the clinical factors and semantic features of MRI. Radiomics analysis was applied to fat-suppressed T1-weighted (T1W-FS) images, fat-suppressed T2-weighted (T2W-FS) images, and contrast-enhanced T1-weighted (CE-T1W) images. The radiomics nomograms incorporating the radiomics signatures, clinical factors, and semantic features of MRI were developed. ROC curves and AUCs were carried out to compare the performance of the clinical factors, radiomics signatures, and clinical radiomics nomograms.
Results
Tumor location, size, heterogeneous signal intensity on T2W-FS imaging, heterogeneous signal intensity on CE-T1W imaging, margin definitions on CE-T1W imaging, and septa were independent predictors for differentiating NF from STS (P < 0.05). The performance of the radiomics signatures based on T2W-FS imaging (AUC = 0.961) and CE-T1W imaging (AUC = 0.938) was better than that based on T1W-FS imaging (AUC = 0.833). The radiomics nomograms had AUCs of 0.949, which demonstrated good clinical utility and calibration.
Conclusion
The non-invasive clinical radiomics nomograms exhibited good performance in the differentiation of NF from STS, and they have clinical application in the preoperative diagnosis of diseases.
Introduction
Nodular fasciitis, also known as nodular pseudosarcomatous fasciitis, is a transiently benign myofibroblastic / fibroblastic tumor that typically presents as a rapidly growing mass, followed by spontaneous regression (1,2). Nodular fasciitis is fairly common in soft tissues and represents approximately 11% of all benign soft tissue tumors (3). Due to its rapid growth, high cellularity, mitotic activity, and infiltrative ability, it can mimic STS both pathologically and radiologically (4). Therefore, the early identification and diagnosis of nodular fasciitis are challenging.
Nodular fasciitis can be classified into myxoid, cellular, and fibrous subtypes based on the predominant histological composition (5), and different cellular components may coexist in the same lesion at the same time. The histological diversity of nodular fasciitis likely accounts for the variable and non-specific MRI appearance of the lesions (6,7). In addition, some nodular fasciitis lesions are misdiagnosed as STS due to aggressive imaging characteristics, such as transcompartmental spread, as well as skeletal and intra-articular invasion (8). As such, the overlapping magnetic resonance imaging (MRI) manifestations pose a challenge for differential diagnosis upon visual inspection. Currently, the preoperative diagnostic workup of STS largely relies on core puncture biopsies (9). However, studies have reported that only 40% of nodular fasciitis cases can be confirmed as such by fine needle aspiration (10,11). Furthermore, reactive fibroblasts and myofibroblasts surrounding malignant lesions may be sampled at the time of puncture, leading to a misdiagnosis of nodular fasciitis. Therefore, there is an urgent need for a non-invasive and accurate method to distinguish the two types of soft tissue tumors before surgery.
Radiomics can extract high-dimensional and quantitative features from multimodal medical images, identify tumor phenotypes, and define the underlying pathophysiology (12–14). Radiomics is a non-invasive alternative in the differential diagnosis, staging, and prognostic evaluation of soft tissue tumors (15–17). In a recent study, Timbergen et al. used a radiomics model based on MRI to distinguish desmoid-type fibromatosis from STS with high accuracy, similar to the conclusions of radiologists (18). Presently, clinical radiomics nomograms that combine radiomics and clinical factors for differentiating nodular fasciitis from STS are relatively limited.
The aim of the present study was to develop clinical radiomics nomograms and to determine whether the nomograms can accurately differentiate nodular fasciitis from STS.
Material and Methods
Patients
The ethics committee approved this retrospective study, and the institutional review board waived written informed consent. This study included 85 patients with pathologically confirmed nodular fasciitis (n = 27) and STS (n = 58) between January 2010 and October 2021 at the Second Hospital of Dalian Medical University.
The inclusion criteria were as follows: (i) pathologically confirmed nodular fasciitis or STS; (ii) MRI performed within two weeks of treatment, including fat-suppressed T1-weighted (T1W-FS) images, fat-suppressed T2-weighted (T2W-FS images), and contrast-enhanced T1-weighted (CE-T1W) images; and (iii) absence of localized or systemic treatment before MRI. Patients were excluded for the following reasons: (i) lesions were recurrent (n = 5); (ii) they had undergone core biopsy only (n = 10); (iii) they had retroperitoneal, abdominal, or pelvic cavity tumors (n = 9); (iv) preoperative MRI data were not available (n = 7); (v) final pathological results were inconclusive (n = 0); and (vi) clinical data were not available (n = 3). All patients were randomly divided into training (n = 62) or validation groups (n = 23) with a ratio of 7:3. The flow chart of the patient enrollment process is shown in Fig. 1.
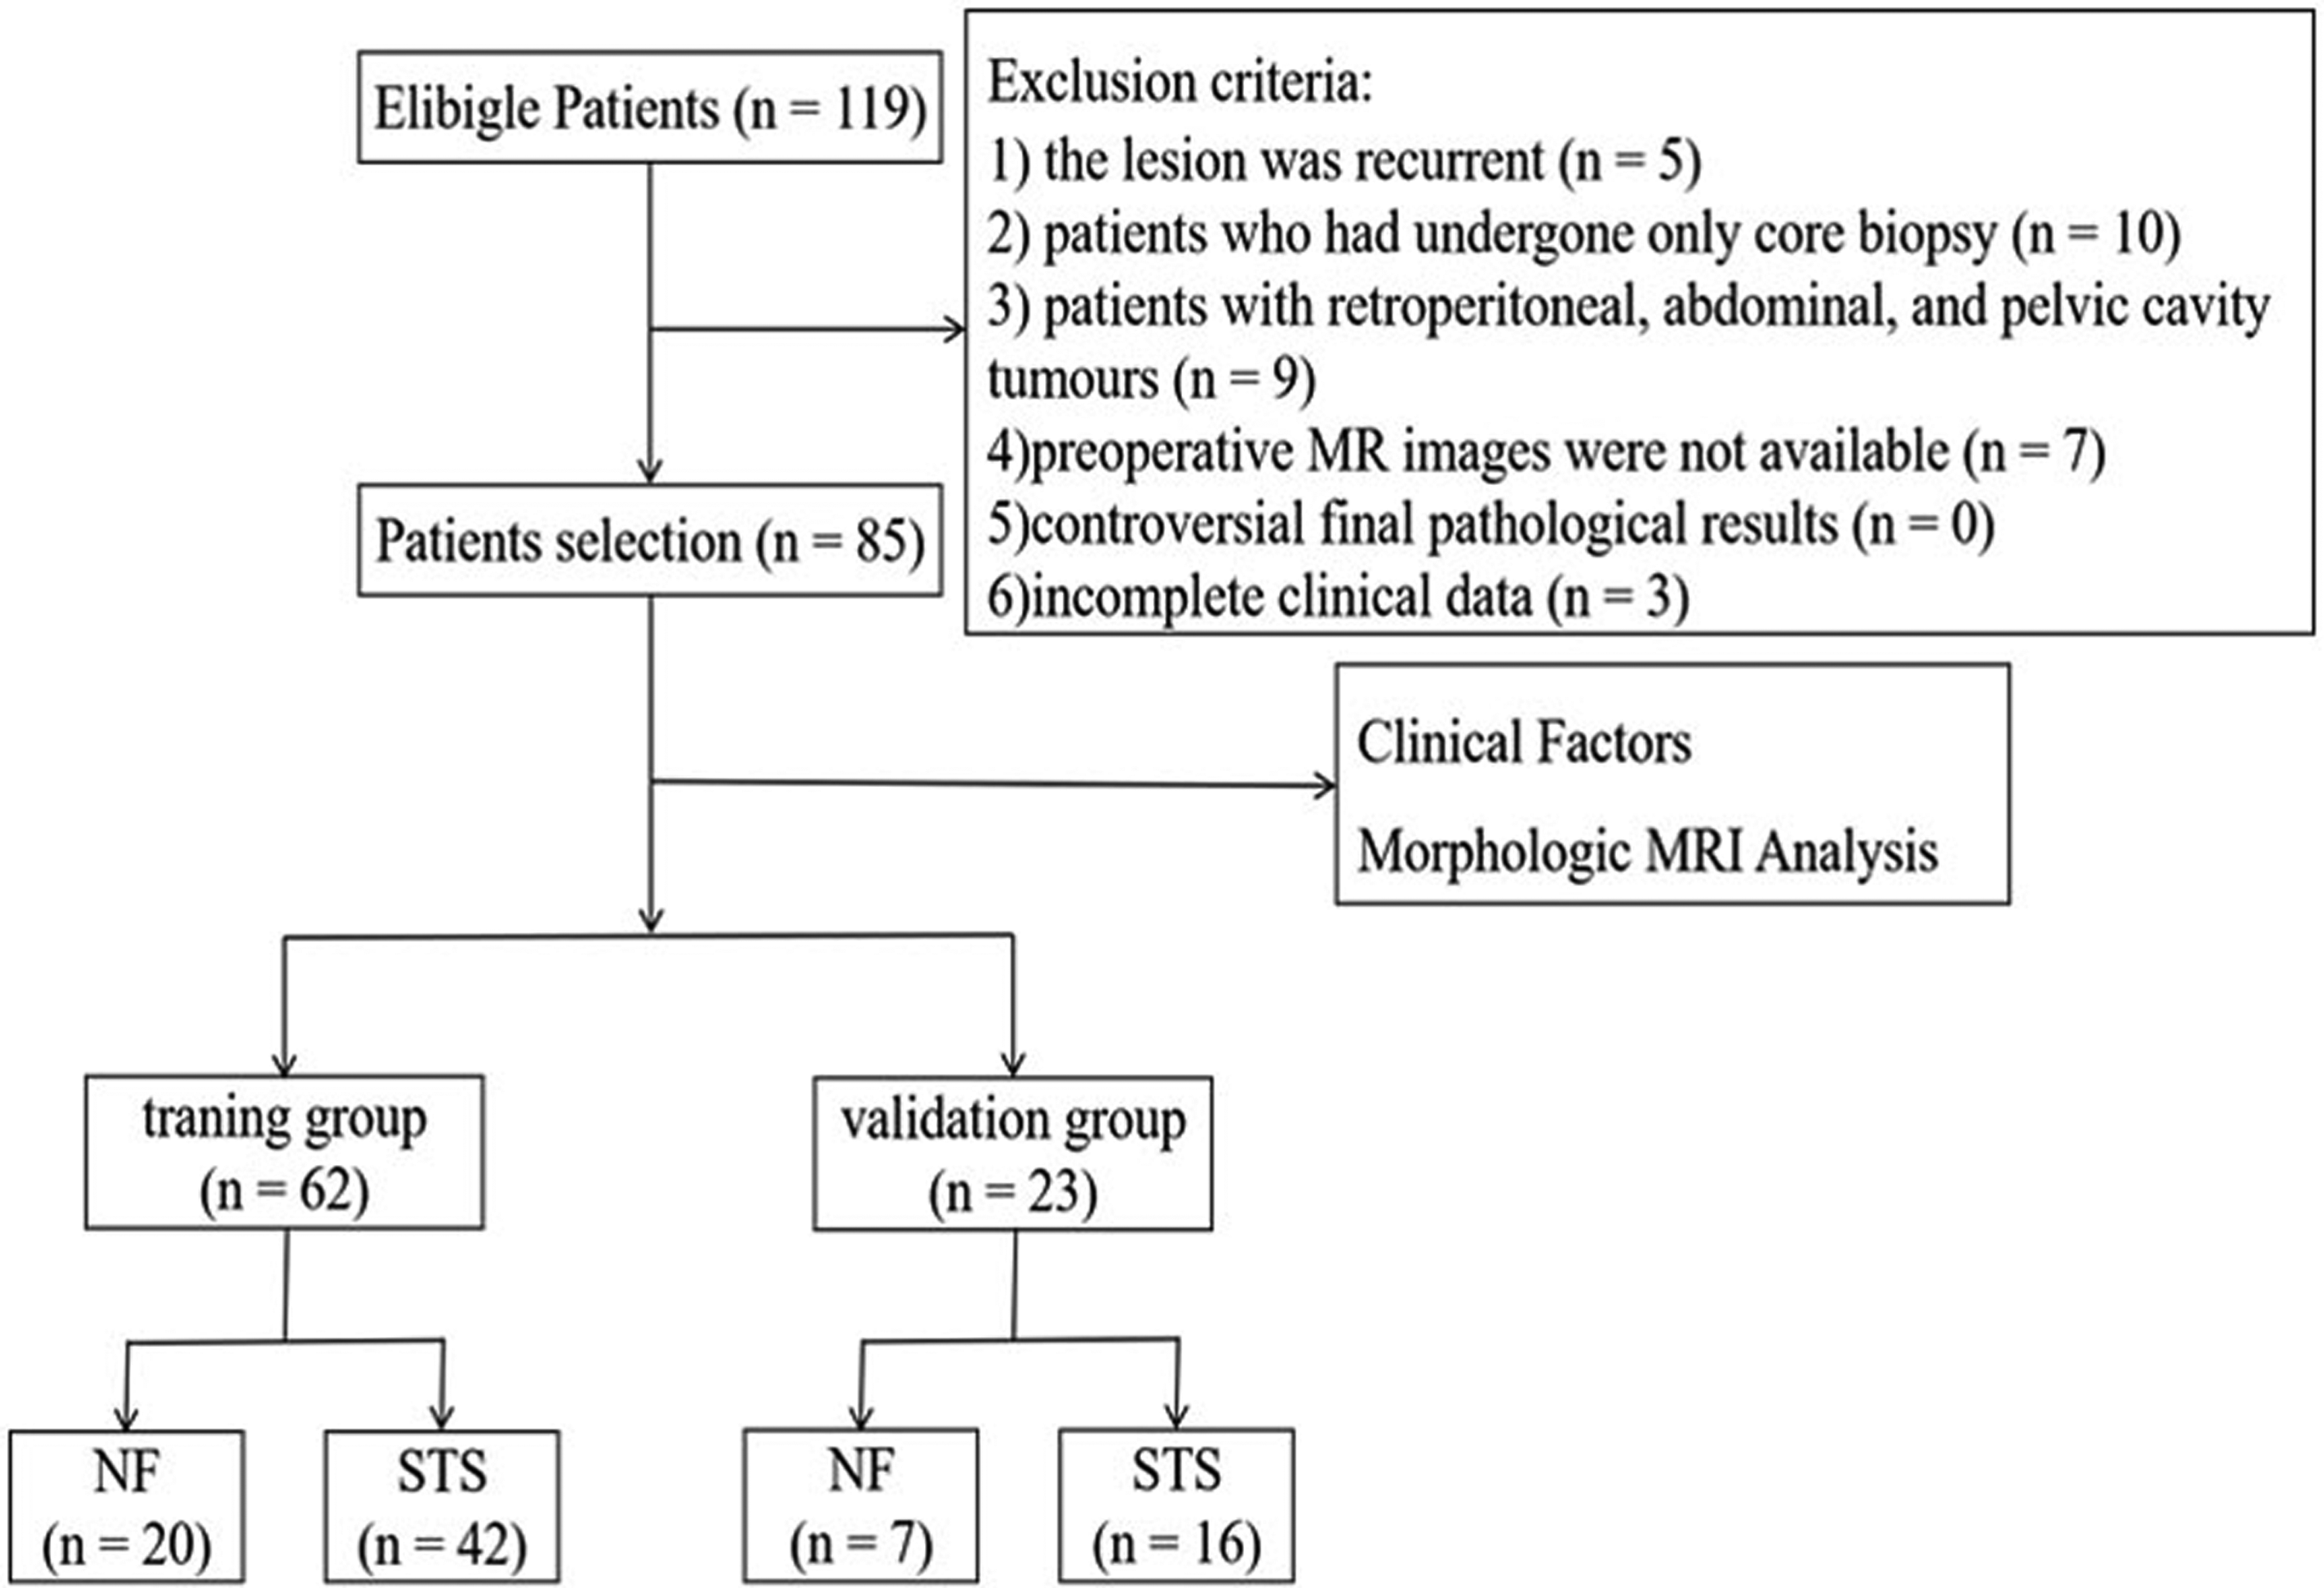
Flow chart of the patient enrollment process.
Clinical factors
The clinical factors of the patients, including age, sex, clinical presentation, tumor location, tumor size, and disease course, were obtained from medical records.
Magnetic resonance imaging analysis
MR examinations were performed using 3.0-T (Discovery MR 750 W; GE Healthcare, Waukesha, WI, USA) MR scanners, respectively. CE-T1W imaging was acquired after administration of 0.1 mmol/kg of gadolinium-based contrast material (Gadovist; Bayer, Leverkusen, Germany). The MR scan parameters are summarized in Table S1 (Supplemental Materials).
Conventional MRI scans were retrospectively reviewed by two musculoskeletal radiologists (one with 10 years of experience in soft tissue tumor imaging, and the other, a musculoskeletal radiology fellow, with four years of experience). The two radiologists were informed that all patients had nodular fasciitis or STS but had no knowledge of the clinical or histological findings. In cases of disagreement, a third senior supervising radiologist (with 15 years of experience in bone and muscle imaging) was consulted.
The radiologists recorded the following information: (i) depth (superficial, intermediate, or deep); (ii) longest diameter; (iii) signal intensity and heterogeneity (<50% or >50%) of three scans; (iv) necrosis (0%, 0–50%, or >50% of the tumor volume); (v) margin (clear and sharp: <50%, 50%–90%, or >90% of the whole tumor circumference); (vi) peritumoral edema on T2W-FS imaging (absent, limited, or extensive); (vii) peritumoral enhancement (defined as gross parenchymal enhancement outside of the tumor border on CE-T1W imaging without mass effects); (viii) capsule (defined as a visible rim of low T2W imaging signal intensity around all or part of the tumor border); (ix) septa (defined as a visible rim of low T2W-FS imaging signal intensity within the tumor); (x) tail sign (19) (defined as thick aponeurotic enhancement on CE-T1W imaging); and (xi) invasion (invasion of bone, blood vessels, or nerves).
Image normalization and tumor segmentation
The radiomics workflow is shown in Fig. 2. After considering the heterogeneous parameters of the two MRI readers, the MRI scans were separately normalized with non-parametric and non-uniform intensity. The three-dimensional volumes of interest (VOIs) were manually segmented by two radiologists (readers I and II with one and three years of experience in musculoskeletal MRI, respectively) using ITK-SNAP software (version 3.8.0, https://www.itksnap.org). In cases of disagreement, a senior radiologist with 10 years of experience reviewed all the contours and defined the tumor's borders.
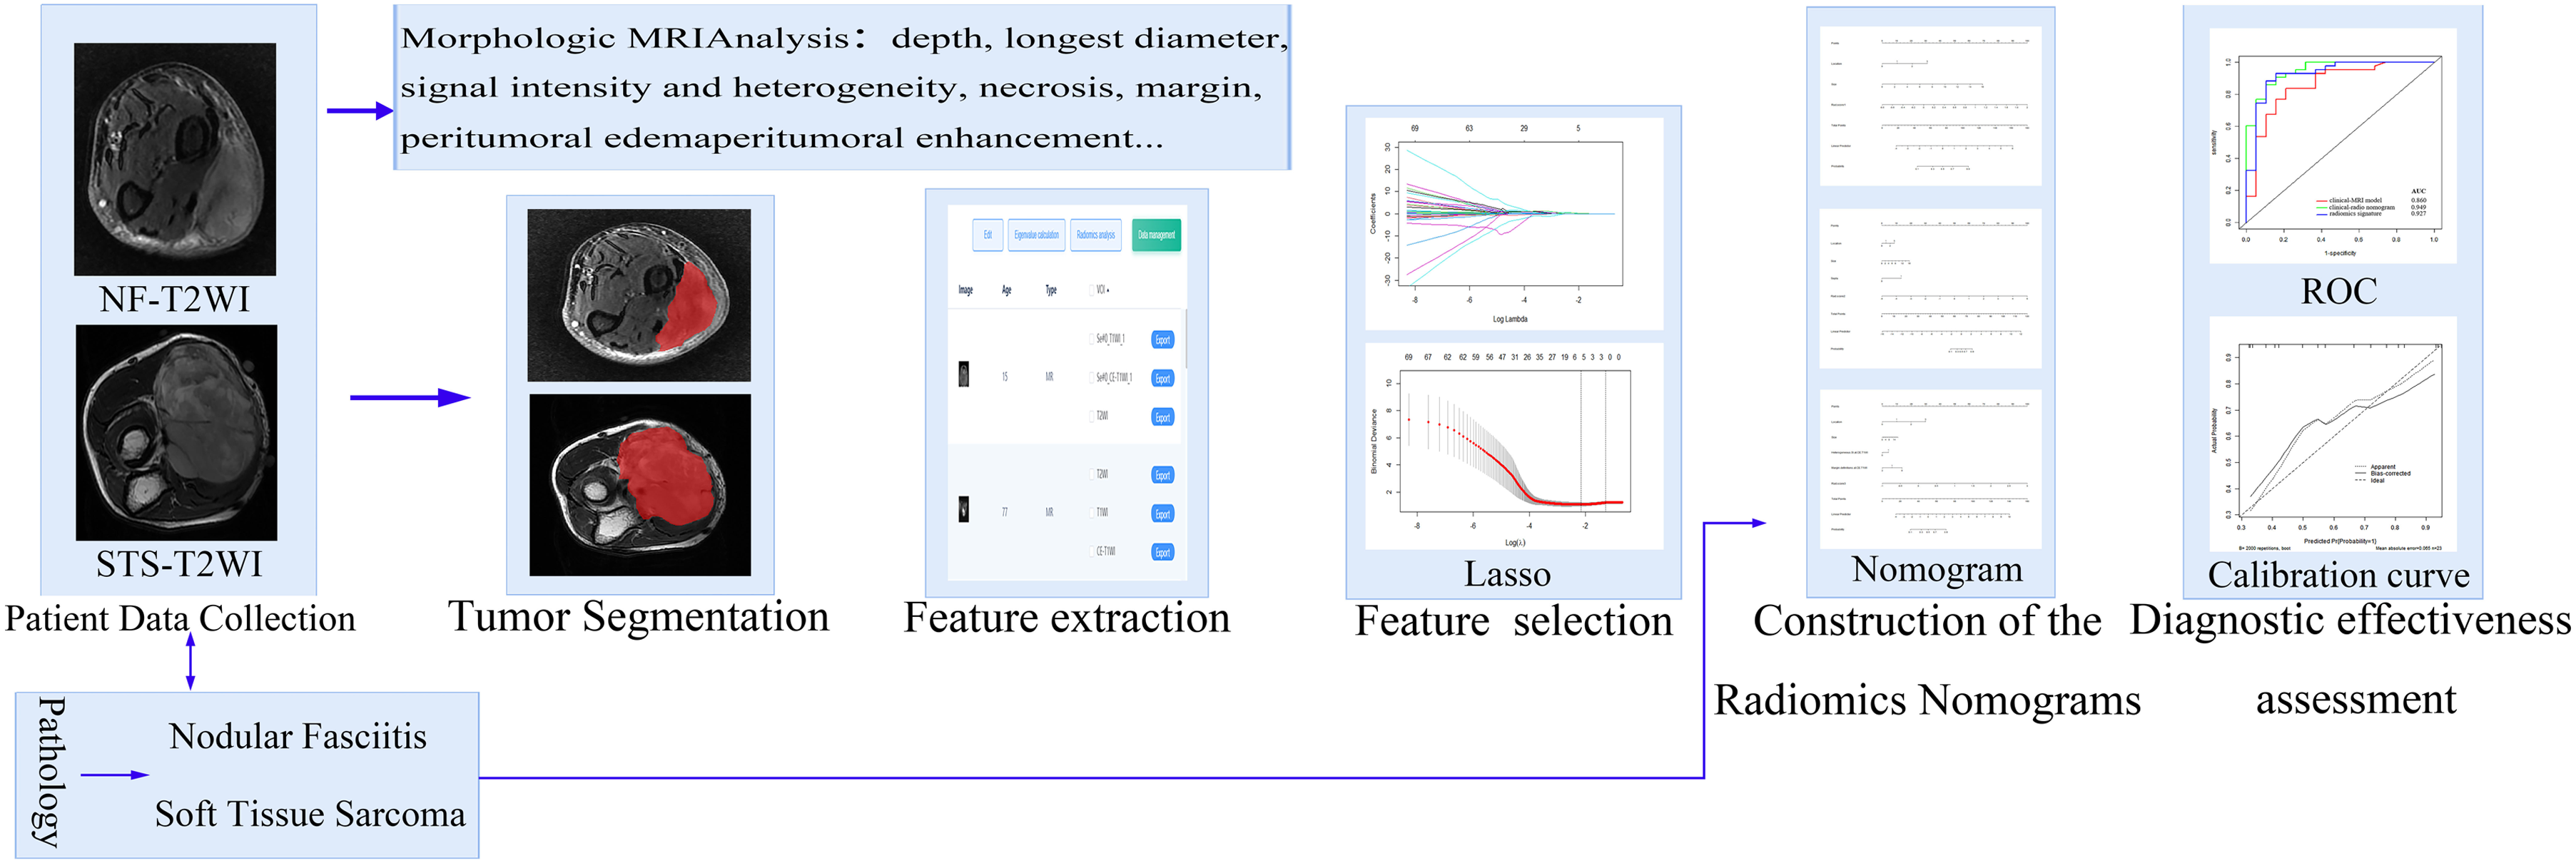
Radiomics workflow.
Feature extraction and selection
All VOI files were imported into a radiomics cloud platform (Huiying Medical Technology Beijing Co., Ltd., http://radcloud.cn), and 1409 quantitative features were extracted from the MRI scans (20). The extracted features included four categories (21,22), namely, (i) first-order features (histogram statistics features); (ii) shape-based features; (iii) texture-based features, including the gray level co-occurrence matrix (GLCM), gray level dependence matrix (GLDM), gray level run length matrix (GLRLM), gray level size zone matrix (GLSZM), and neighboring gray tone difference matrix (NGTDM); and (iv) higher-order statistics features, including Laplacian of Gaussian, wavelet, square, square root, and logarithm.
Univariate logistic regression analysis and the least absolute shrinkage and selection operator (LASSO) method were used to select the optimal radiomics features. Univariate logistic regression analysis was used to exclude features with P < 0.05. The LASSO method was used to identify the optimal features, calculate the coefficients, and obtain the most relevant features.
Construction of radiomics signatures
Three radiomics signatures were structured based on T1W-FS imaging (rad-score1), T2W-FS imaging (rad-score2), and CE-T1W imaging (rad-score3). The radiomics score (rad-score) was calculated for each patient using a linear combination of the selected features multiplied by their respective LASSO coefficients, followed by the addition of the regularization term.
Development of clinical MRI and radiomics nomograms
The clinical factors and semantic features of MRI scans were analyzed by univariate analysis. Variables associating with P values <0.5 by univariate analysis were included in multivariate logistic regression analysis. The independent predictors with statistical significance in multivariate logistic regression analysis were constructed as clinical radiomics nomograms based on T1W-FS imaging (rad-score1), T2W-FS imaging (rad-score2), CE-T1W imaging (rad-score3), and combined with MRI, respectively.
Statistical analysis
Statistical analyses were conducted with SPSS Statistics 26.0 software (IBM Corp., Armonk, NY, USA) and R software (version 4.0.5, https://www.r-project.org). We compared the clinical factors and semantic features of MRI scans between nodular fasciitis and STS using the Student's t-test for normally distributed continuous variables, the Mann–Whitney test for non-normally distributed continuous variables, and the chi-square test or the Fisher's exact test for categorical variables. To ensure reproducibility and consistency of the radiomics features, we applied intra- and inter-class correlation coefficients to evaluate the intra- and inter-observer agreement between the two radiologists (23). Radiomics features with intraclass correlation coefficient (ICC) values >0.75 were considered to have good consistency and were selected for further analysis. The two radiologists’ performance was evaluated with the receiver operating characteristic (ROC) curve analysis compared with the final radiomics models’ performance.
Results
Clinical factors and magnetic resonance imaging analysis
The baseline clinical factors and the results of univariate analyses of 85 patients are reported in Table 1. The STS group consisted of six cases of fibromyxosarcoma, 11 cases of leiomyosarcoma, 14 cases of myxoid liposarcoma, 13 cases of undifferentiated pleomorphic sarcoma, 7 cases of synovial sarcoma, 3 cases of malignant peripheral nerve sheath tumors, 2 cases of dermato fibrosarcoma, and 2 cases of vascular sarcomas. In univariate analyses, tumor location, size, and disease course showed statistical significance between nodular fasciitis and STS groups (χ² = 12.118, P = 0.005; t = −4.029, P = 0.000, and t = −2.028, P = 0.046, respectively). No significant differences in age, sex, and symptoms were observed between nodular fasciitis and STS groups (P = 0.072, P = 0.110 and P = 0.069, respectively).
Baseline characteristics of the population study and distribution.
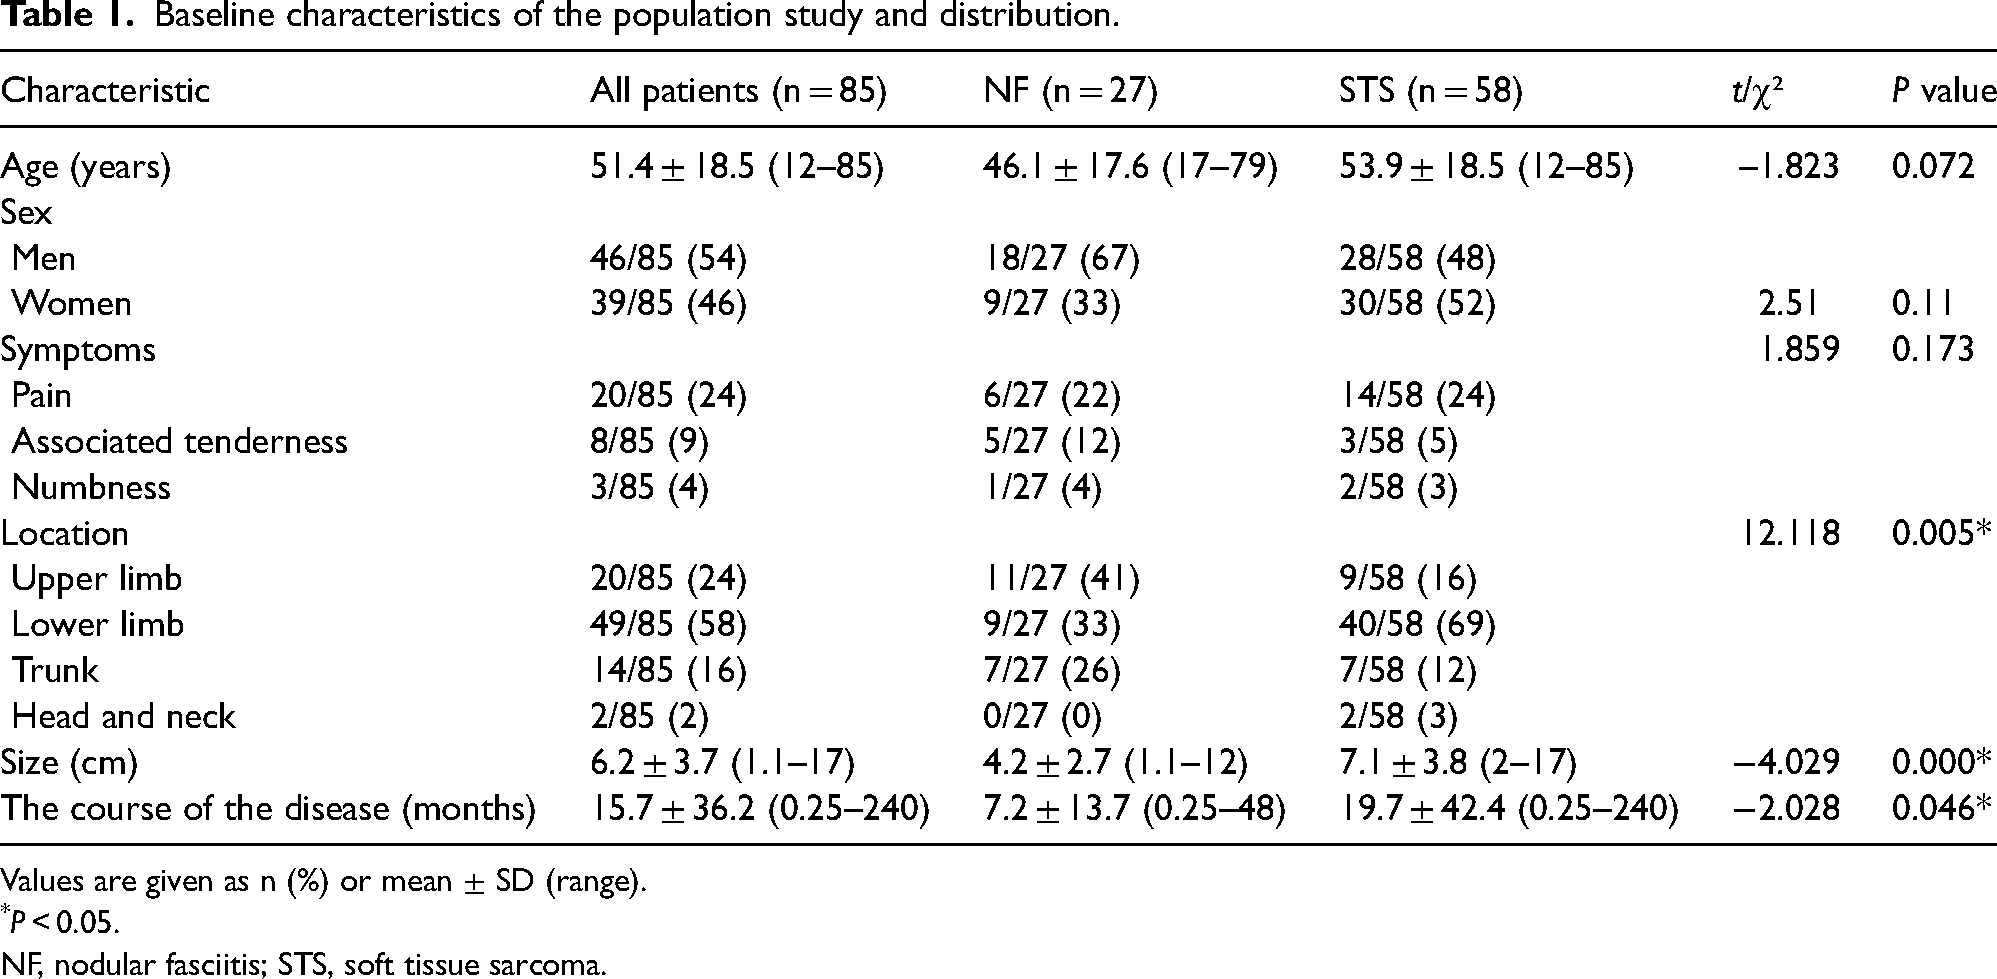
Values are given as n (%) or mean ± SD (range).
*P < 0.05.
NF, nodular fasciitis; STS, soft tissue sarcoma.
The semantic image analysis of 85 patients is shown in Table 2. Representative conventional MR images of nodular fasciitis and STS, which were confirmed by pathology, are shown in Figs. 3 and 4, respectively. There was a statistically significant difference (P < 0.05) between the nodular fasciitis and STS groups in terms of the heterogeneous signal intensity on T2W-FS and CE-T1W imaging, margin definitions on CE-T1W imaging, the enhancement pattern, necrosis, peritumoral enhancement, and septa.
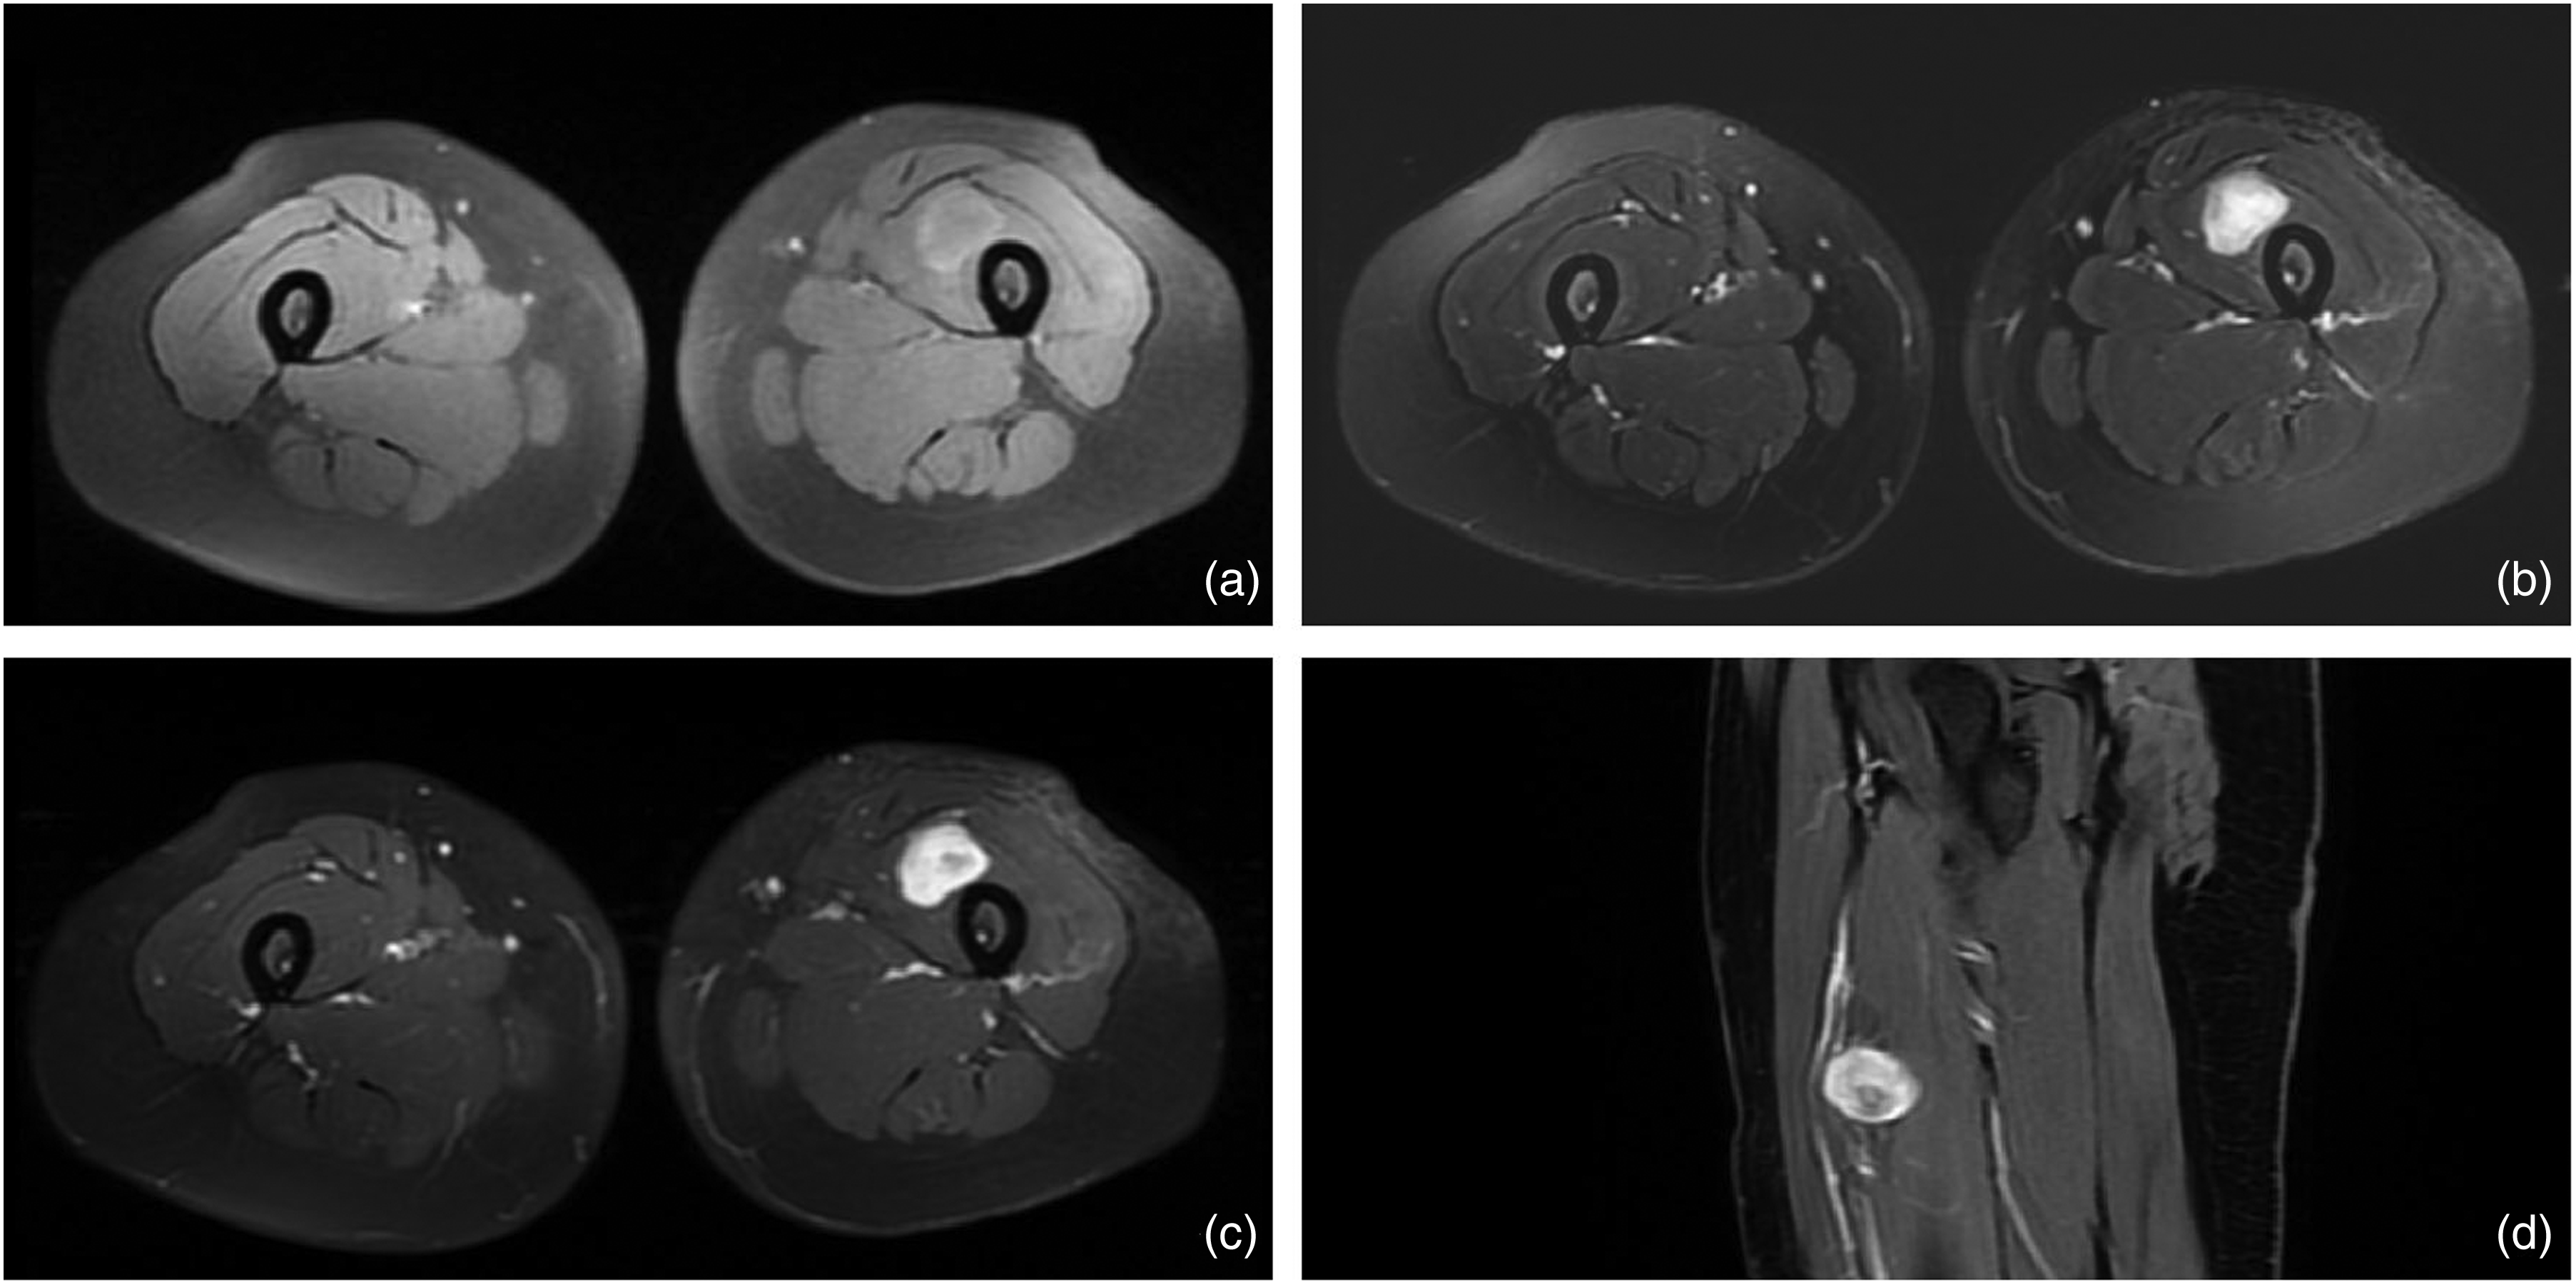
MR image of a 29-year-old female patient with NF, showing a round mass in the vastus intermedius of the left thigh, with clear and smooth boundaries; (a) T1W-FS shows isointensity, and slight hyperintensity around the mass; (b) T2W-FS shows homogeneous hyperintensity; (c, d) CE-T1W shows homogeneous enhancement. CE, contrast-enhanced; FS, fat-suppressed; MR, magnetic resonance; NF, nodular fasciitis; T1W/T2W, T1-/T2-weighted.
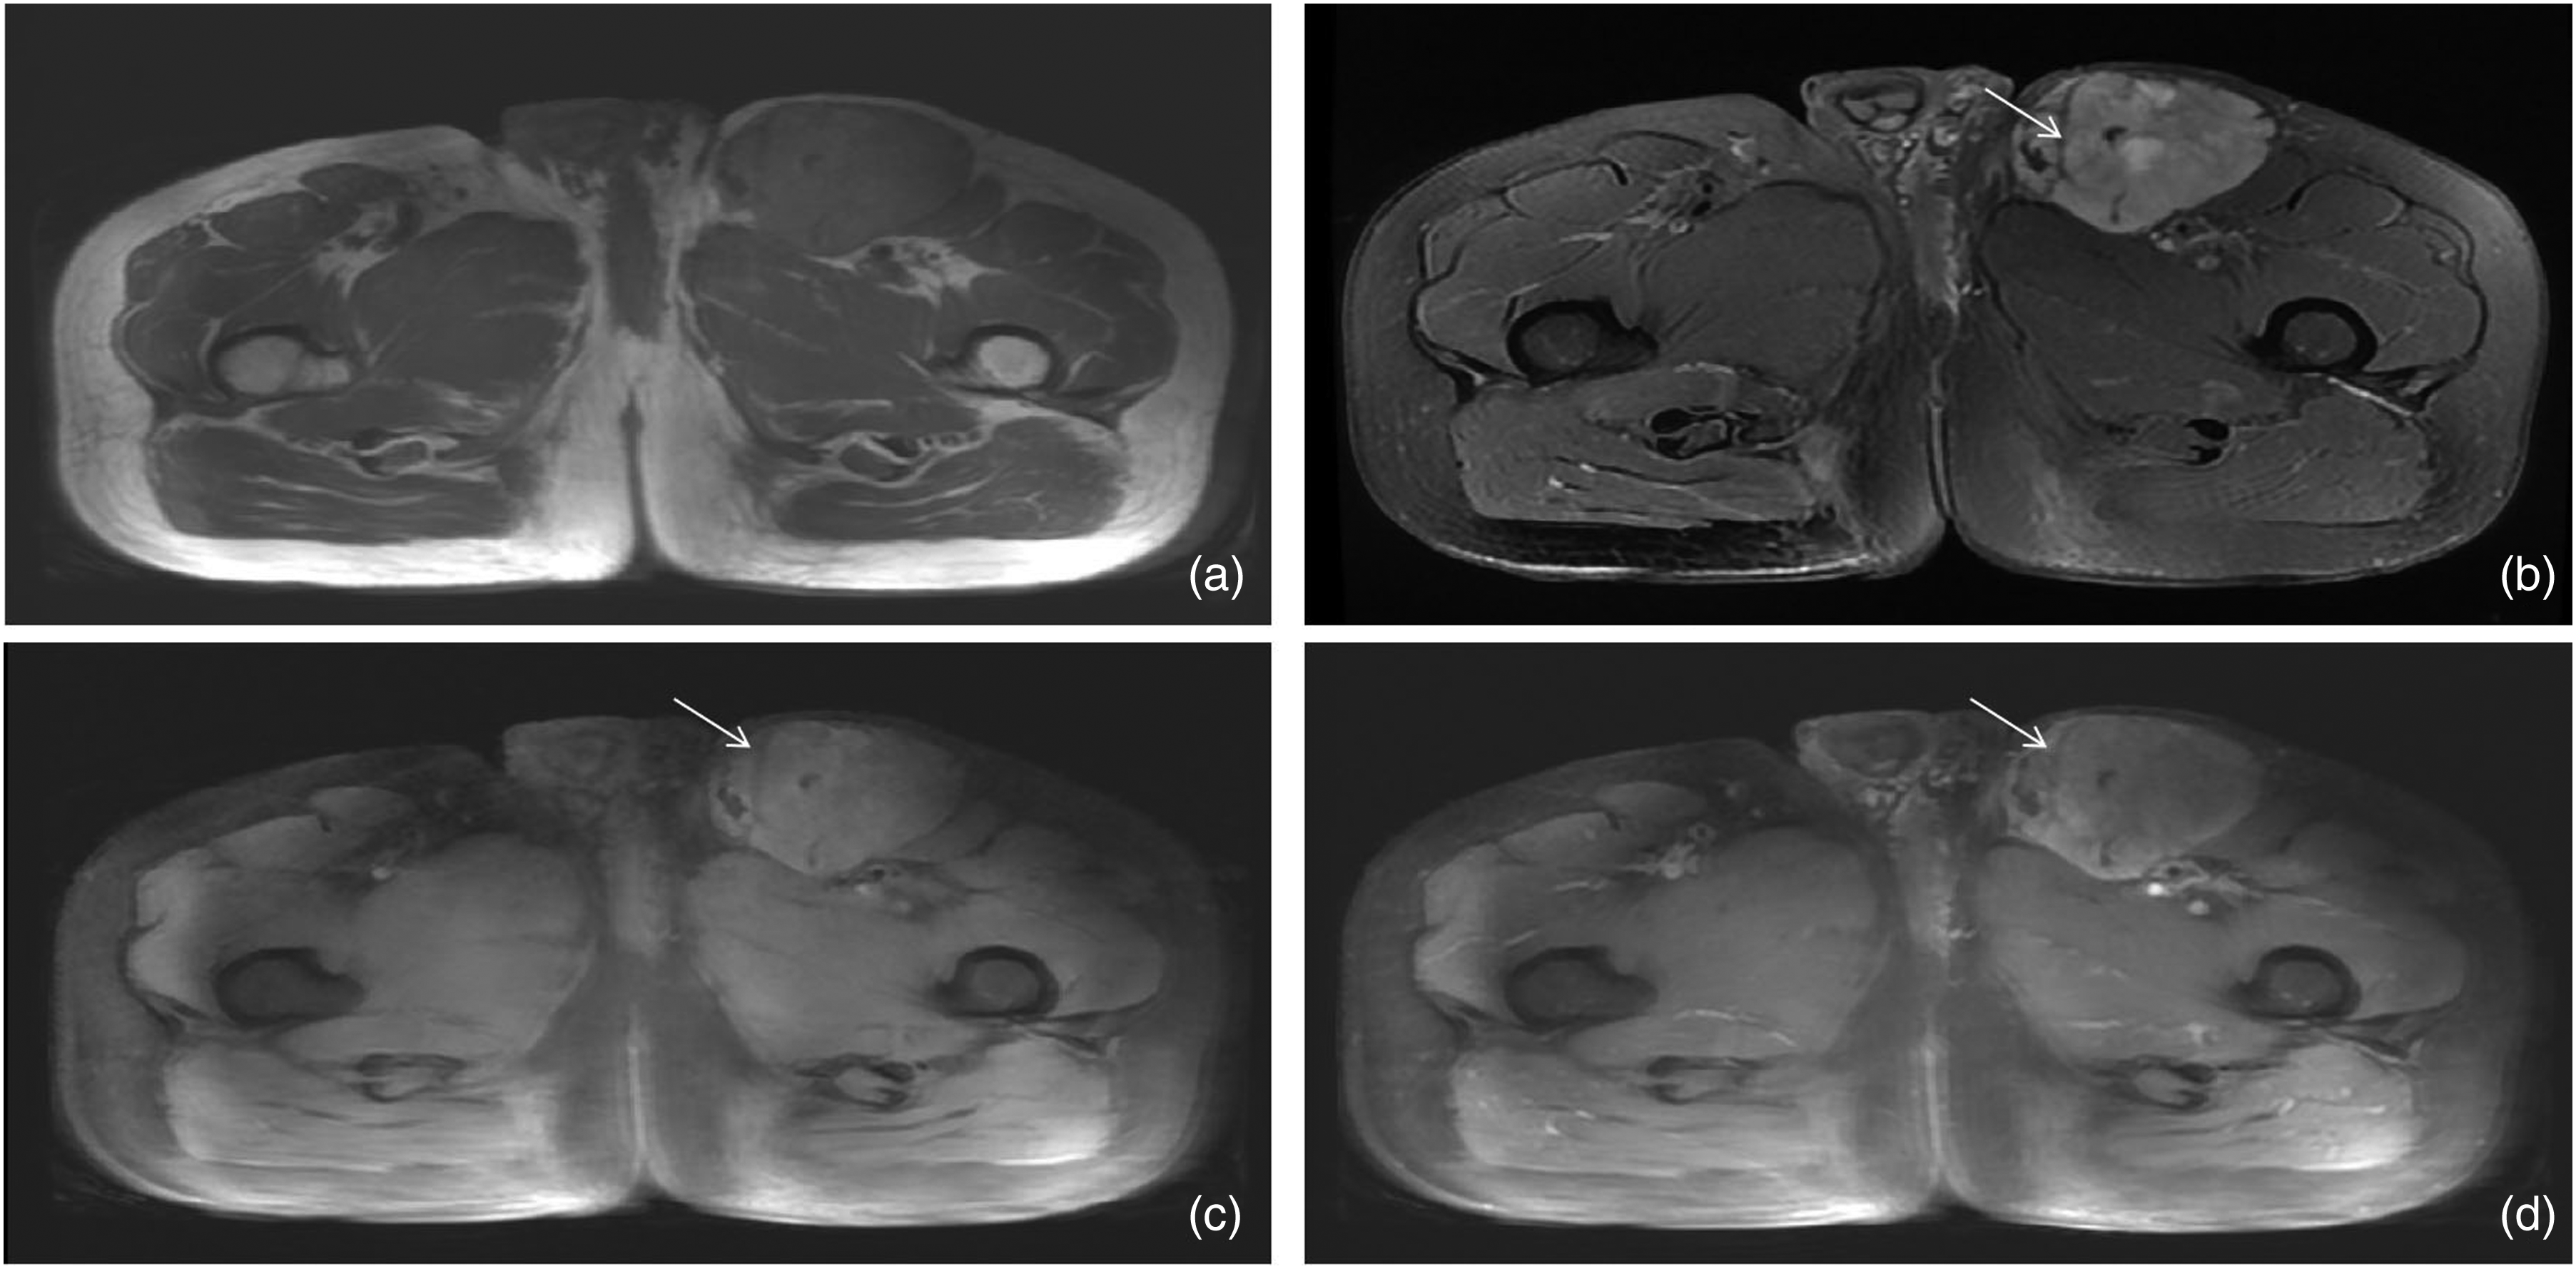
MR image of a 61-year-old man with myxofibrosarcoma, showing an irregular mass in the subcutaneous fat layer of the left thigh with leaves on the edge. The tumor shows isointensity on (a) T1W imaging and the tumor signal of (c) the fat suppression sequence has not been reduced. It shows unhomogeneous hyperintensity on T2W-FS. (b) The linear hypointensity septa can be seen in the tumor. (d) Unhomogeneous enhancement. MR, magnetic resonance; T1W/T2W, T1-/T2-weighted.
Associations between conventional MRI features in NF and STS (univariable analysis).
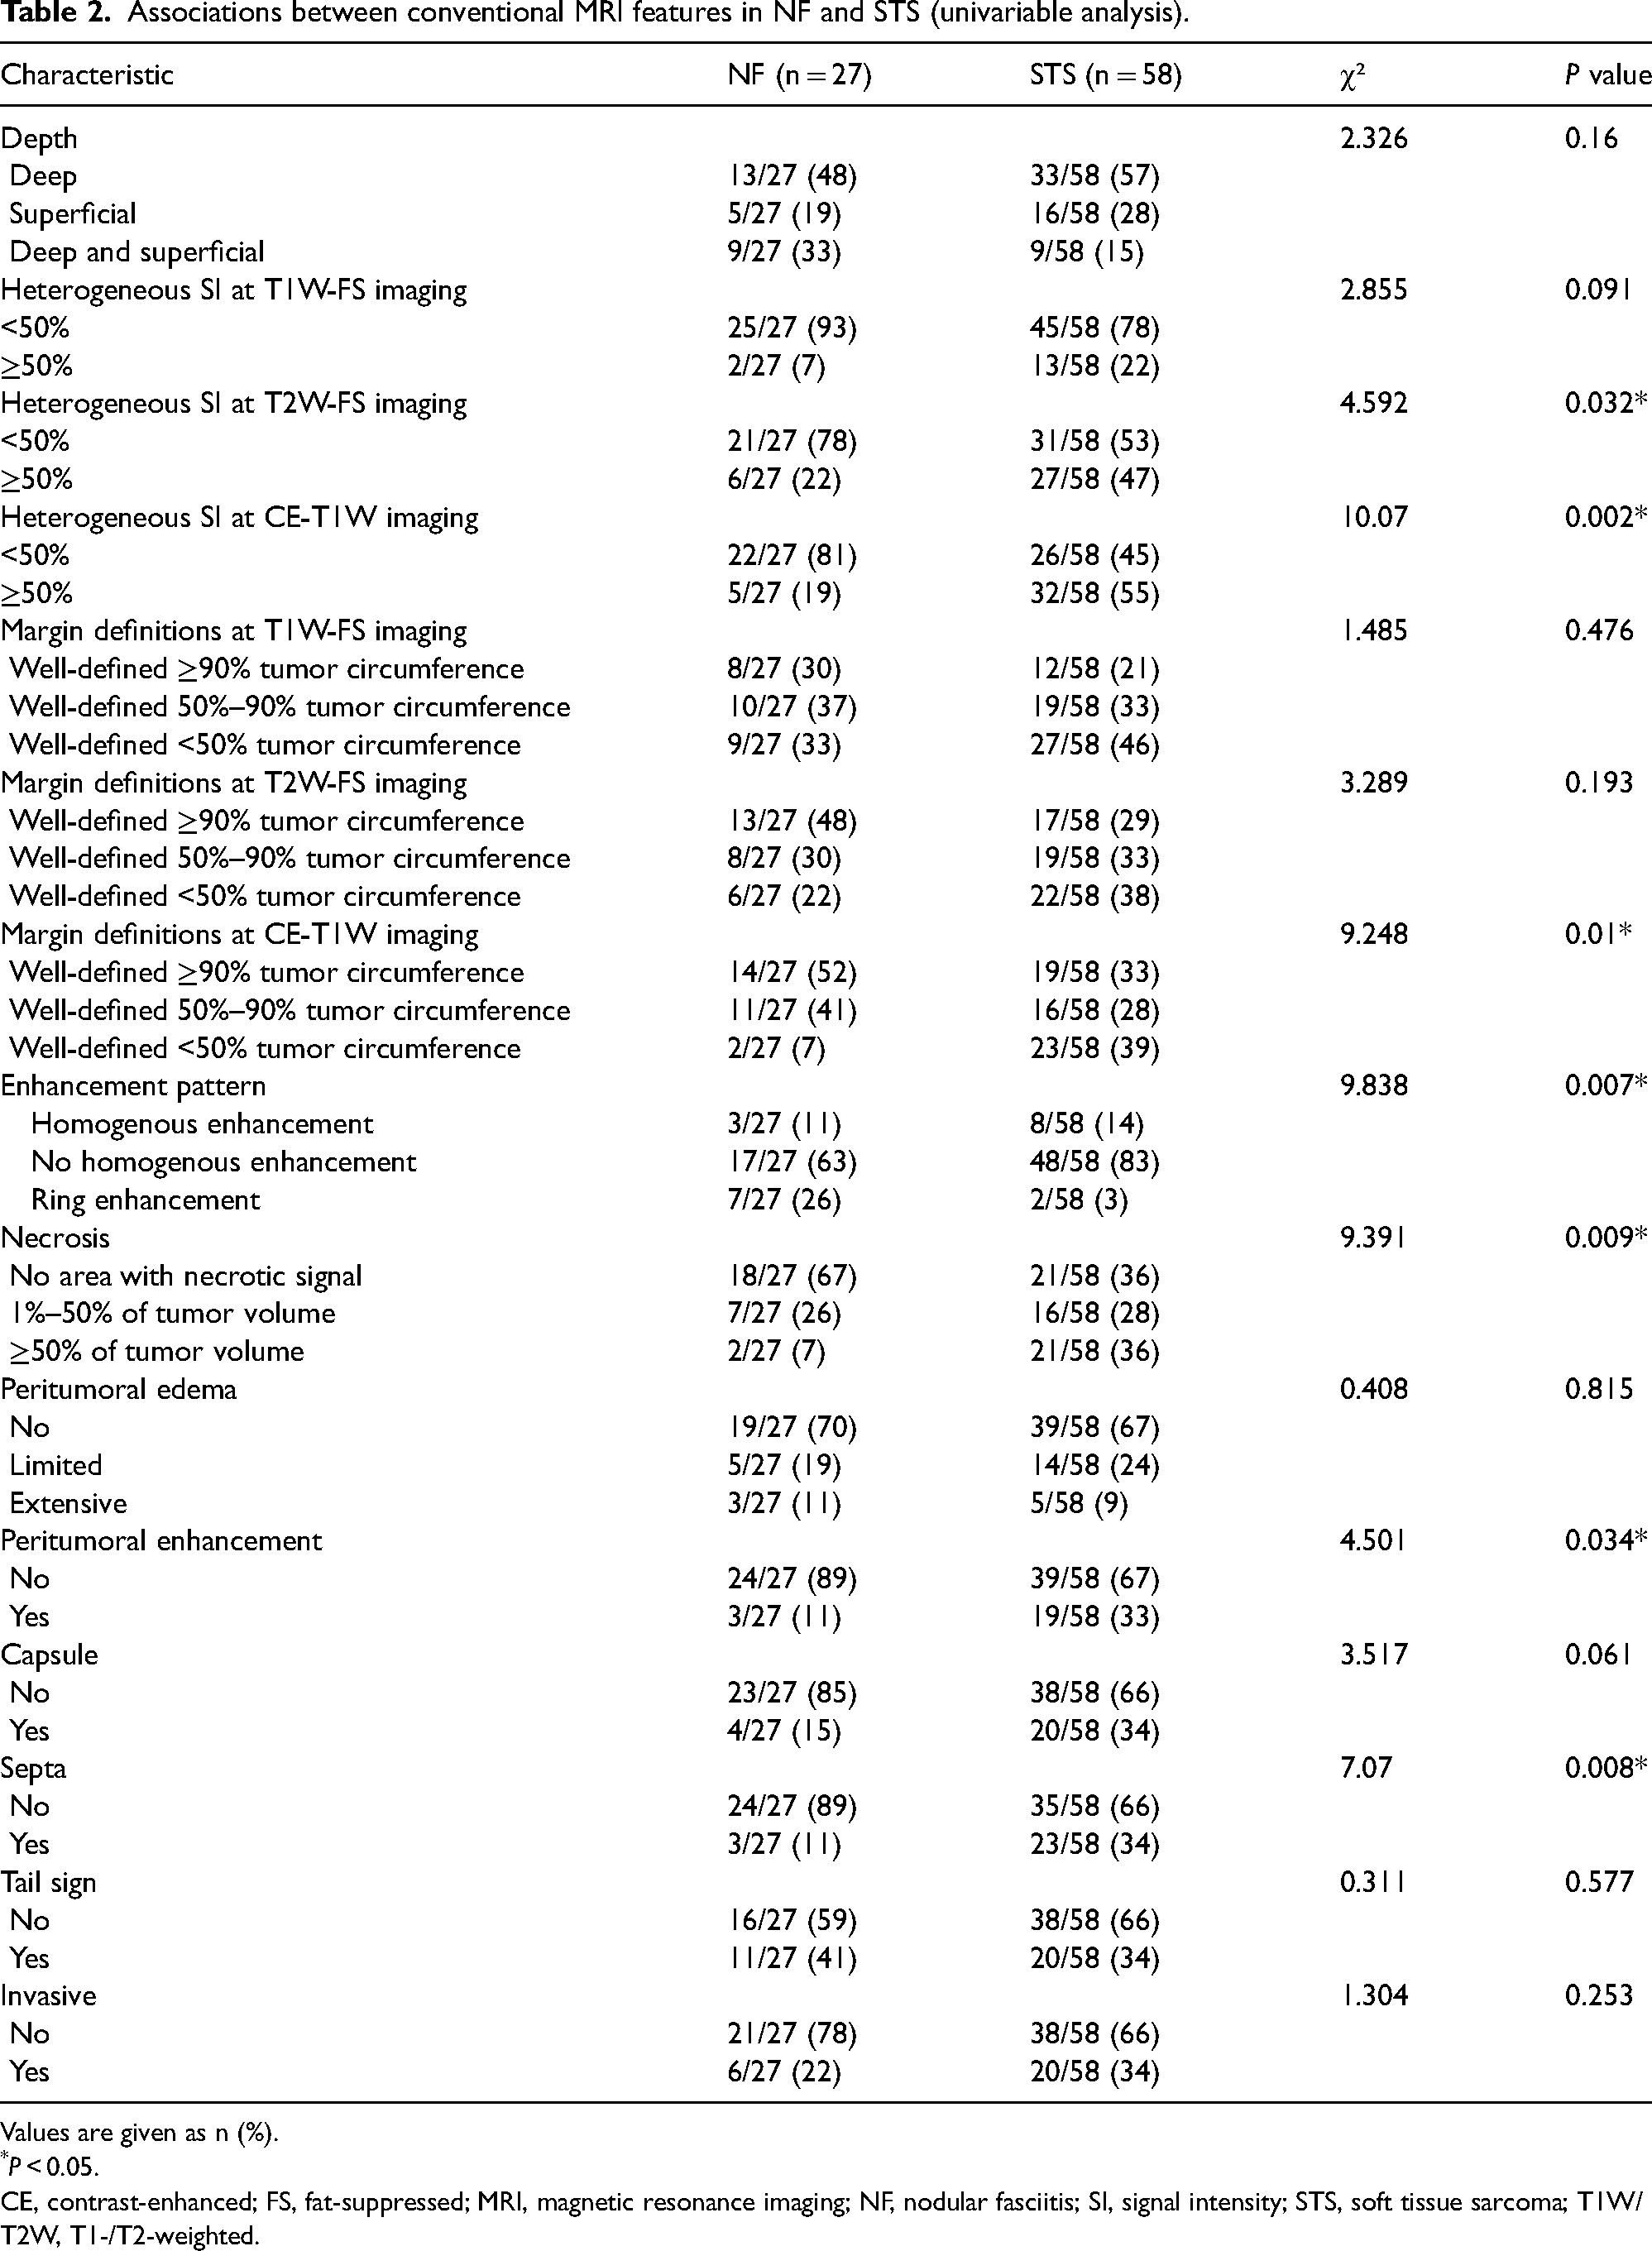
Values are given as n (%).
*P < 0.05.
CE, contrast-enhanced; FS, fat-suppressed; MRI, magnetic resonance imaging; NF, nodular fasciitis; SI, signal intensity; STS, soft tissue sarcoma; T1W/T2W, T1-/T2-weighted.
In multivariate analyses, tumor location (odds ratio [OR] = 4.142; 95% confidence interval [CI] = 1.150–14.941; P = 0.030), size (OR = 1.297; 95% CI = 1.040–1.616; P = 0.021), heterogeneous signal intensity on T2W imaging (OR = 0.039; 95% CI = 0.002–0.765; P = 0.033), heterogeneous signal intensity on CE-T1W imaging (OR = 7.904; 95% CI = 1.064–58.706; P = 0.043), margin definitions on CE-T1W imaging (OR = 0.117; 95% CI = 0.020–0.683; P = 0.017), and septa (OR = 5.153; 95% CI = 1.125–23.614; P = 0.035) were demonstrated as independent predictors of the clinical factors and semantic features of MRI scans. Two radiologists estimated the areas under the curve (AUCs) as 0.586 (95% CI = 0.454–0.719) and 0.660 (95% CI = 0.533–0.788), the sensitivity as 0.655 and 0.691, and the specificity as 0.481 and 0.380 (Fig. 5), which were lower than those of the radiomics signatures and nomograms. The AUC of clinical model was 0.752 (95% CI = 0.645–0.858). The AUCs of the clinical MRI models (0.747, 0.804, 0.821, and 0.860 of T1W, T2W, CE-T1W, and combined MR imaging, respectively) were lower than those of the radiomics signatures in the training group (0.868, 0.962, 0.912, and 0.927, respectively) (Fig. 6).
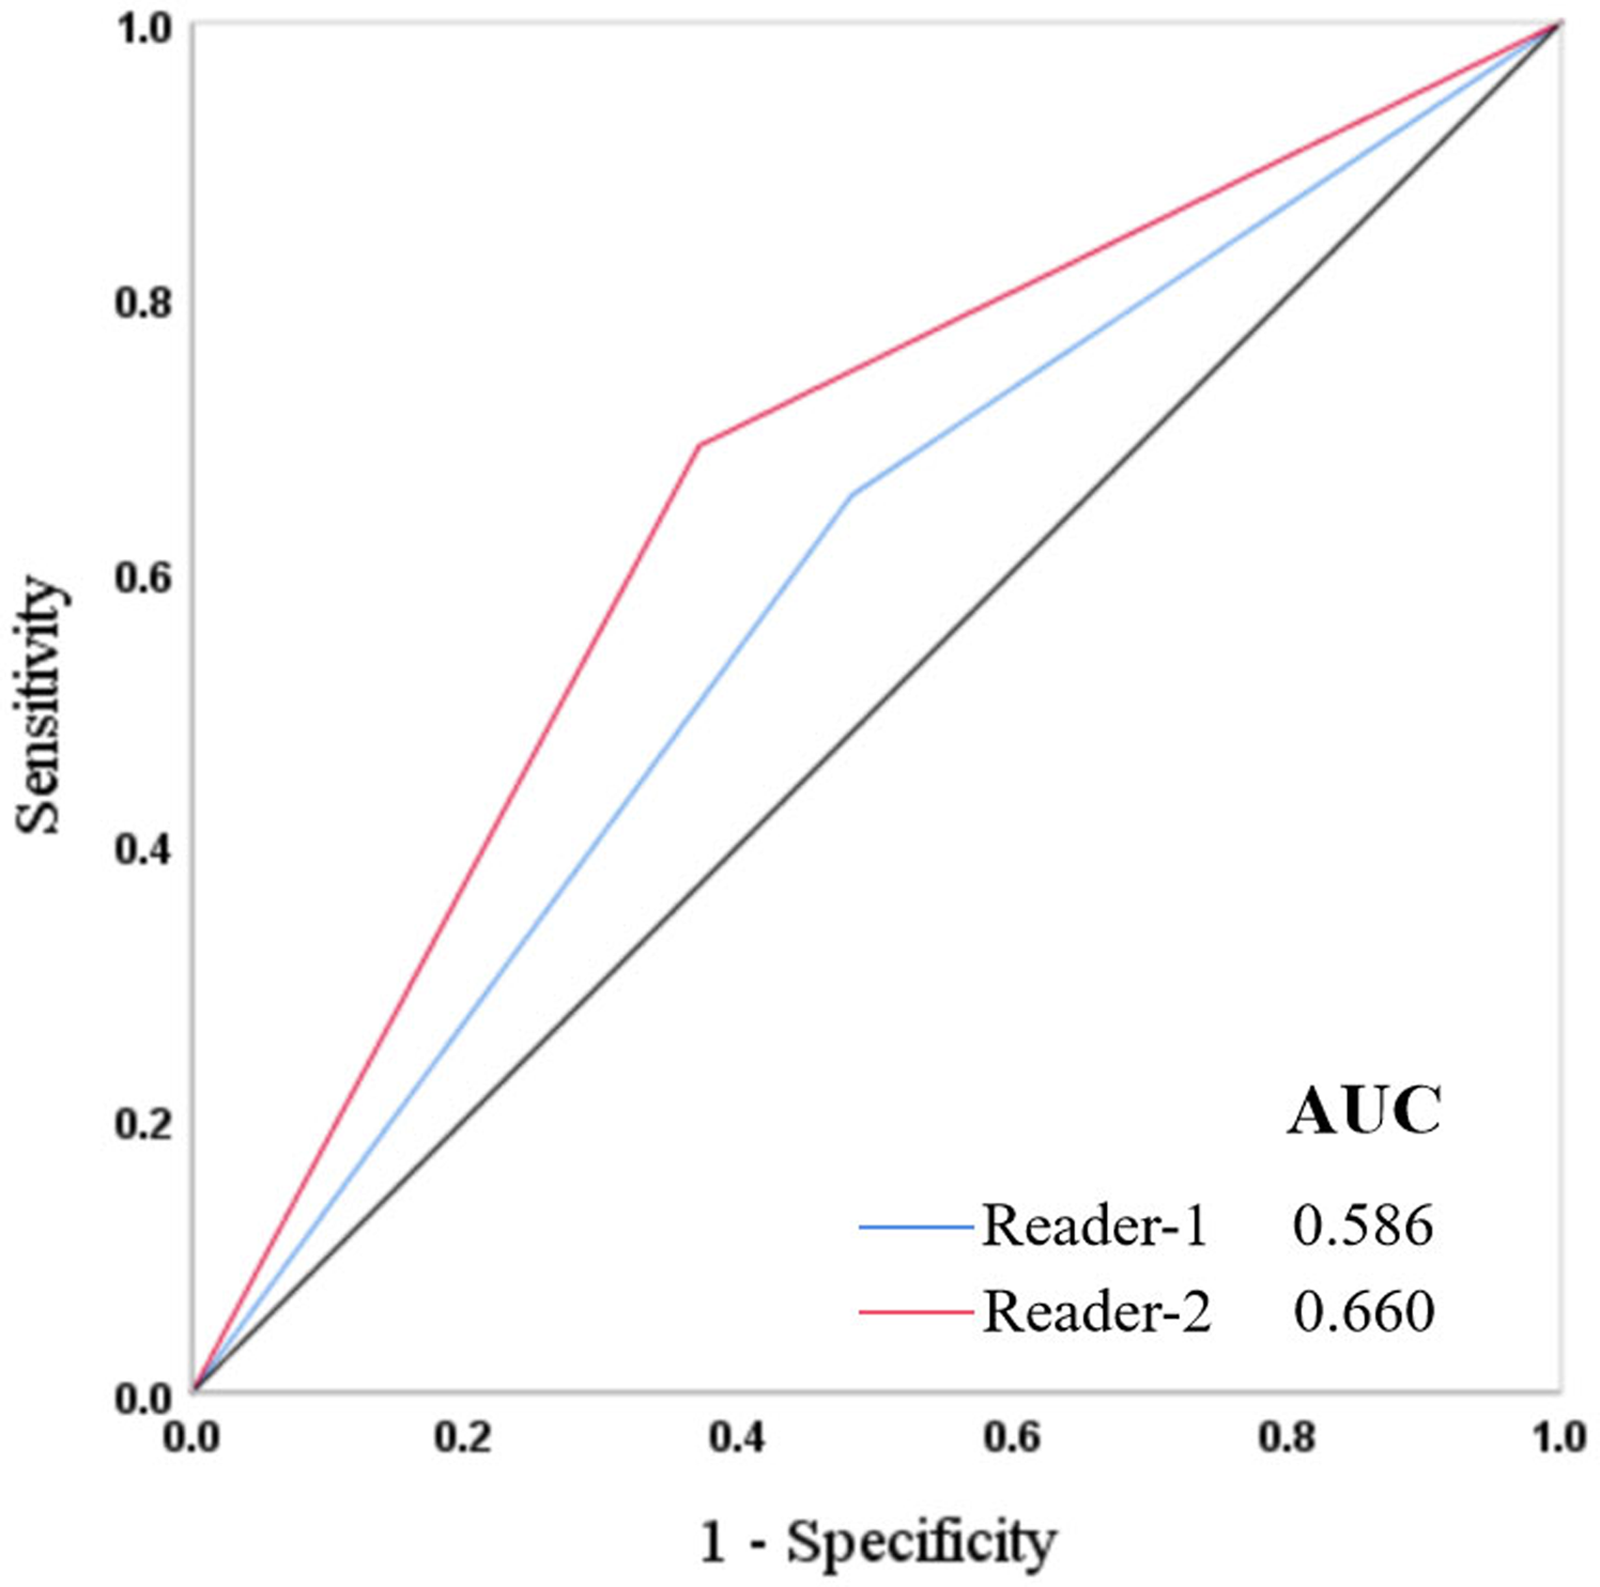
ROC curves of two musculoskeletal radiologists in differentiating NF from STS. The AUCs were 0.586 and 0.660. NF, nodular fasciitis; ROC, receiver operating characteristic; STS, soft tissue sarcoma.
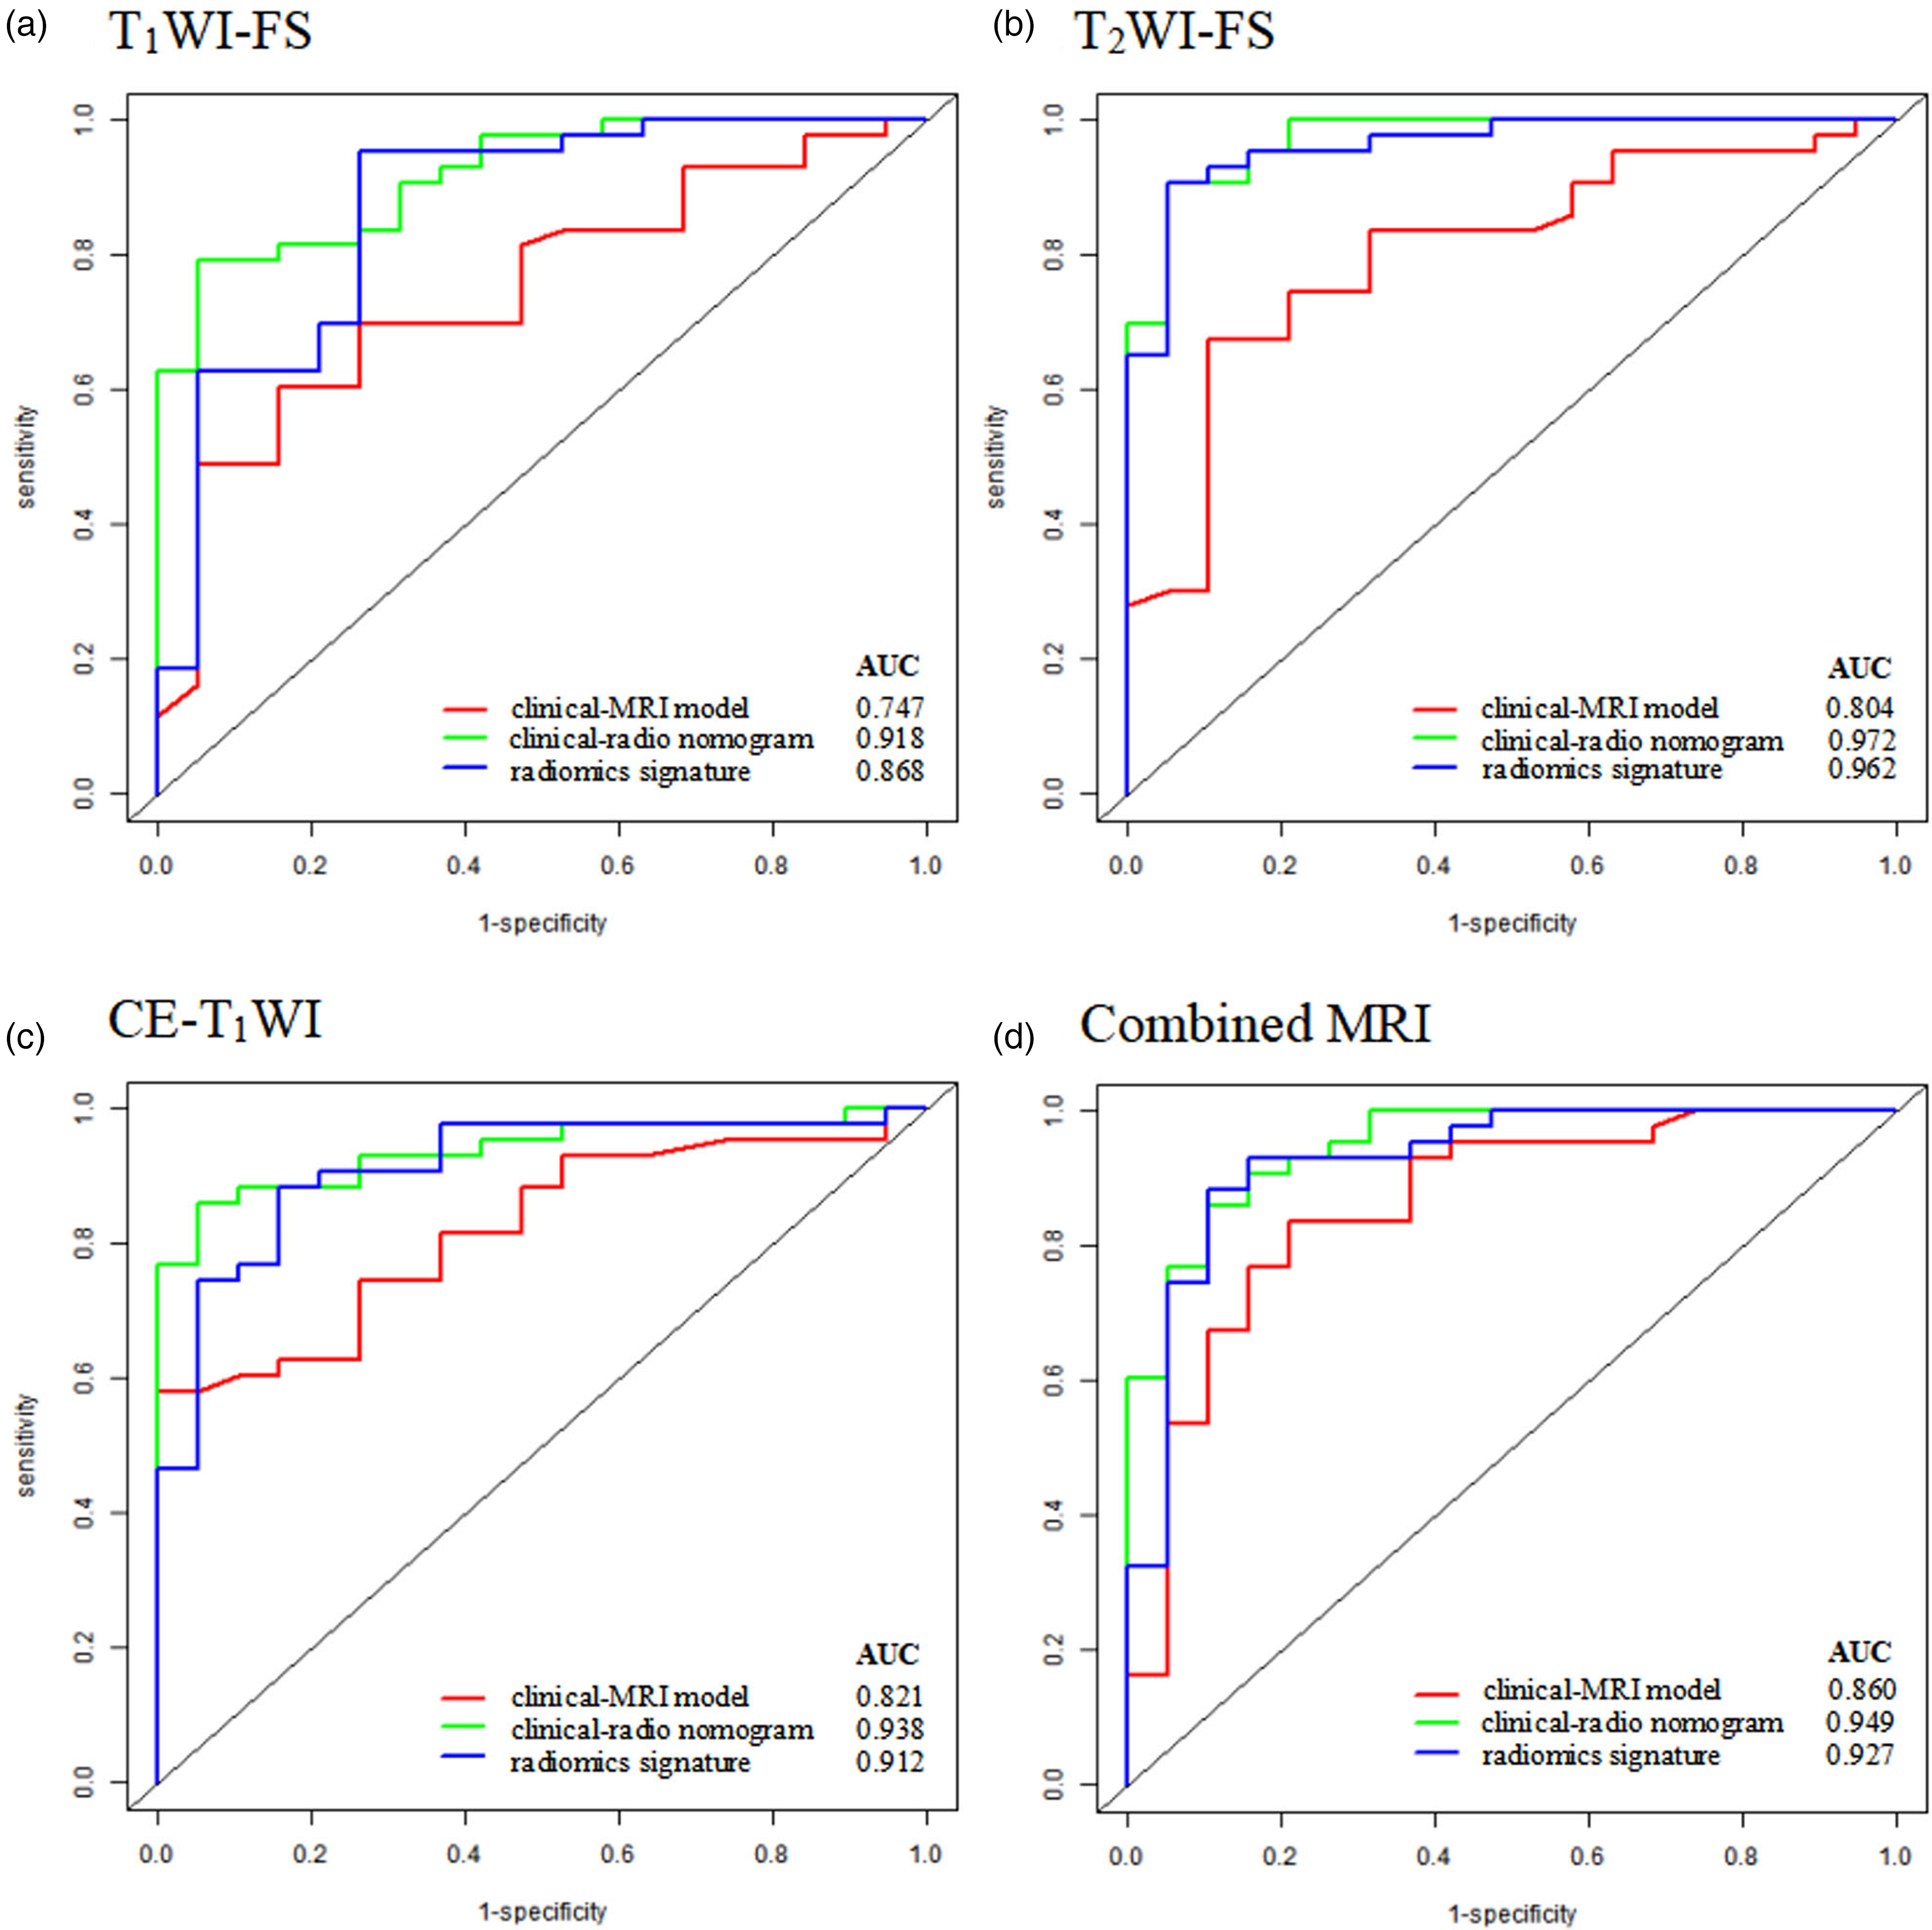
ROC curves of the training group for the clinical radiomics nomograms based on the combination of the clinical factors, semantic features of MRI scans, and radiomics signatures. The performance of the radiomics signatures based on T2W-FS and combined MRI was better than that based on T1W-FS and CE-T1W. The AUCs of the three clinical radiomics nomograms were higher than those of clinical MRI models. AUC, area under the curve; CE, contrast-enhanced; FS, fat-suppressed; MRI, magnetic resonance imaging; ROC, receiver operating characteristic; T1W/T2W, T1-/T2-weighted.
Extraction and selection of radiomics features
Based on a 7:3 ratio, 62 patients were assigned to the training group, while 23 patients were assigned to the validation group. The radiomics feature selection process was conducted separately for the three scans, and 1571 radiomics features were extracted from the three sequences (ICC > 0.75). Four, 12, and 10 stable radiomics features from T1W-FS, T2W-FS, and CE-T1W imaging were finally selected by LASSO regression (Fig. 7). The radiomics features of the MRI scans are presented in Tables S2–4 (Supplemental Materials).
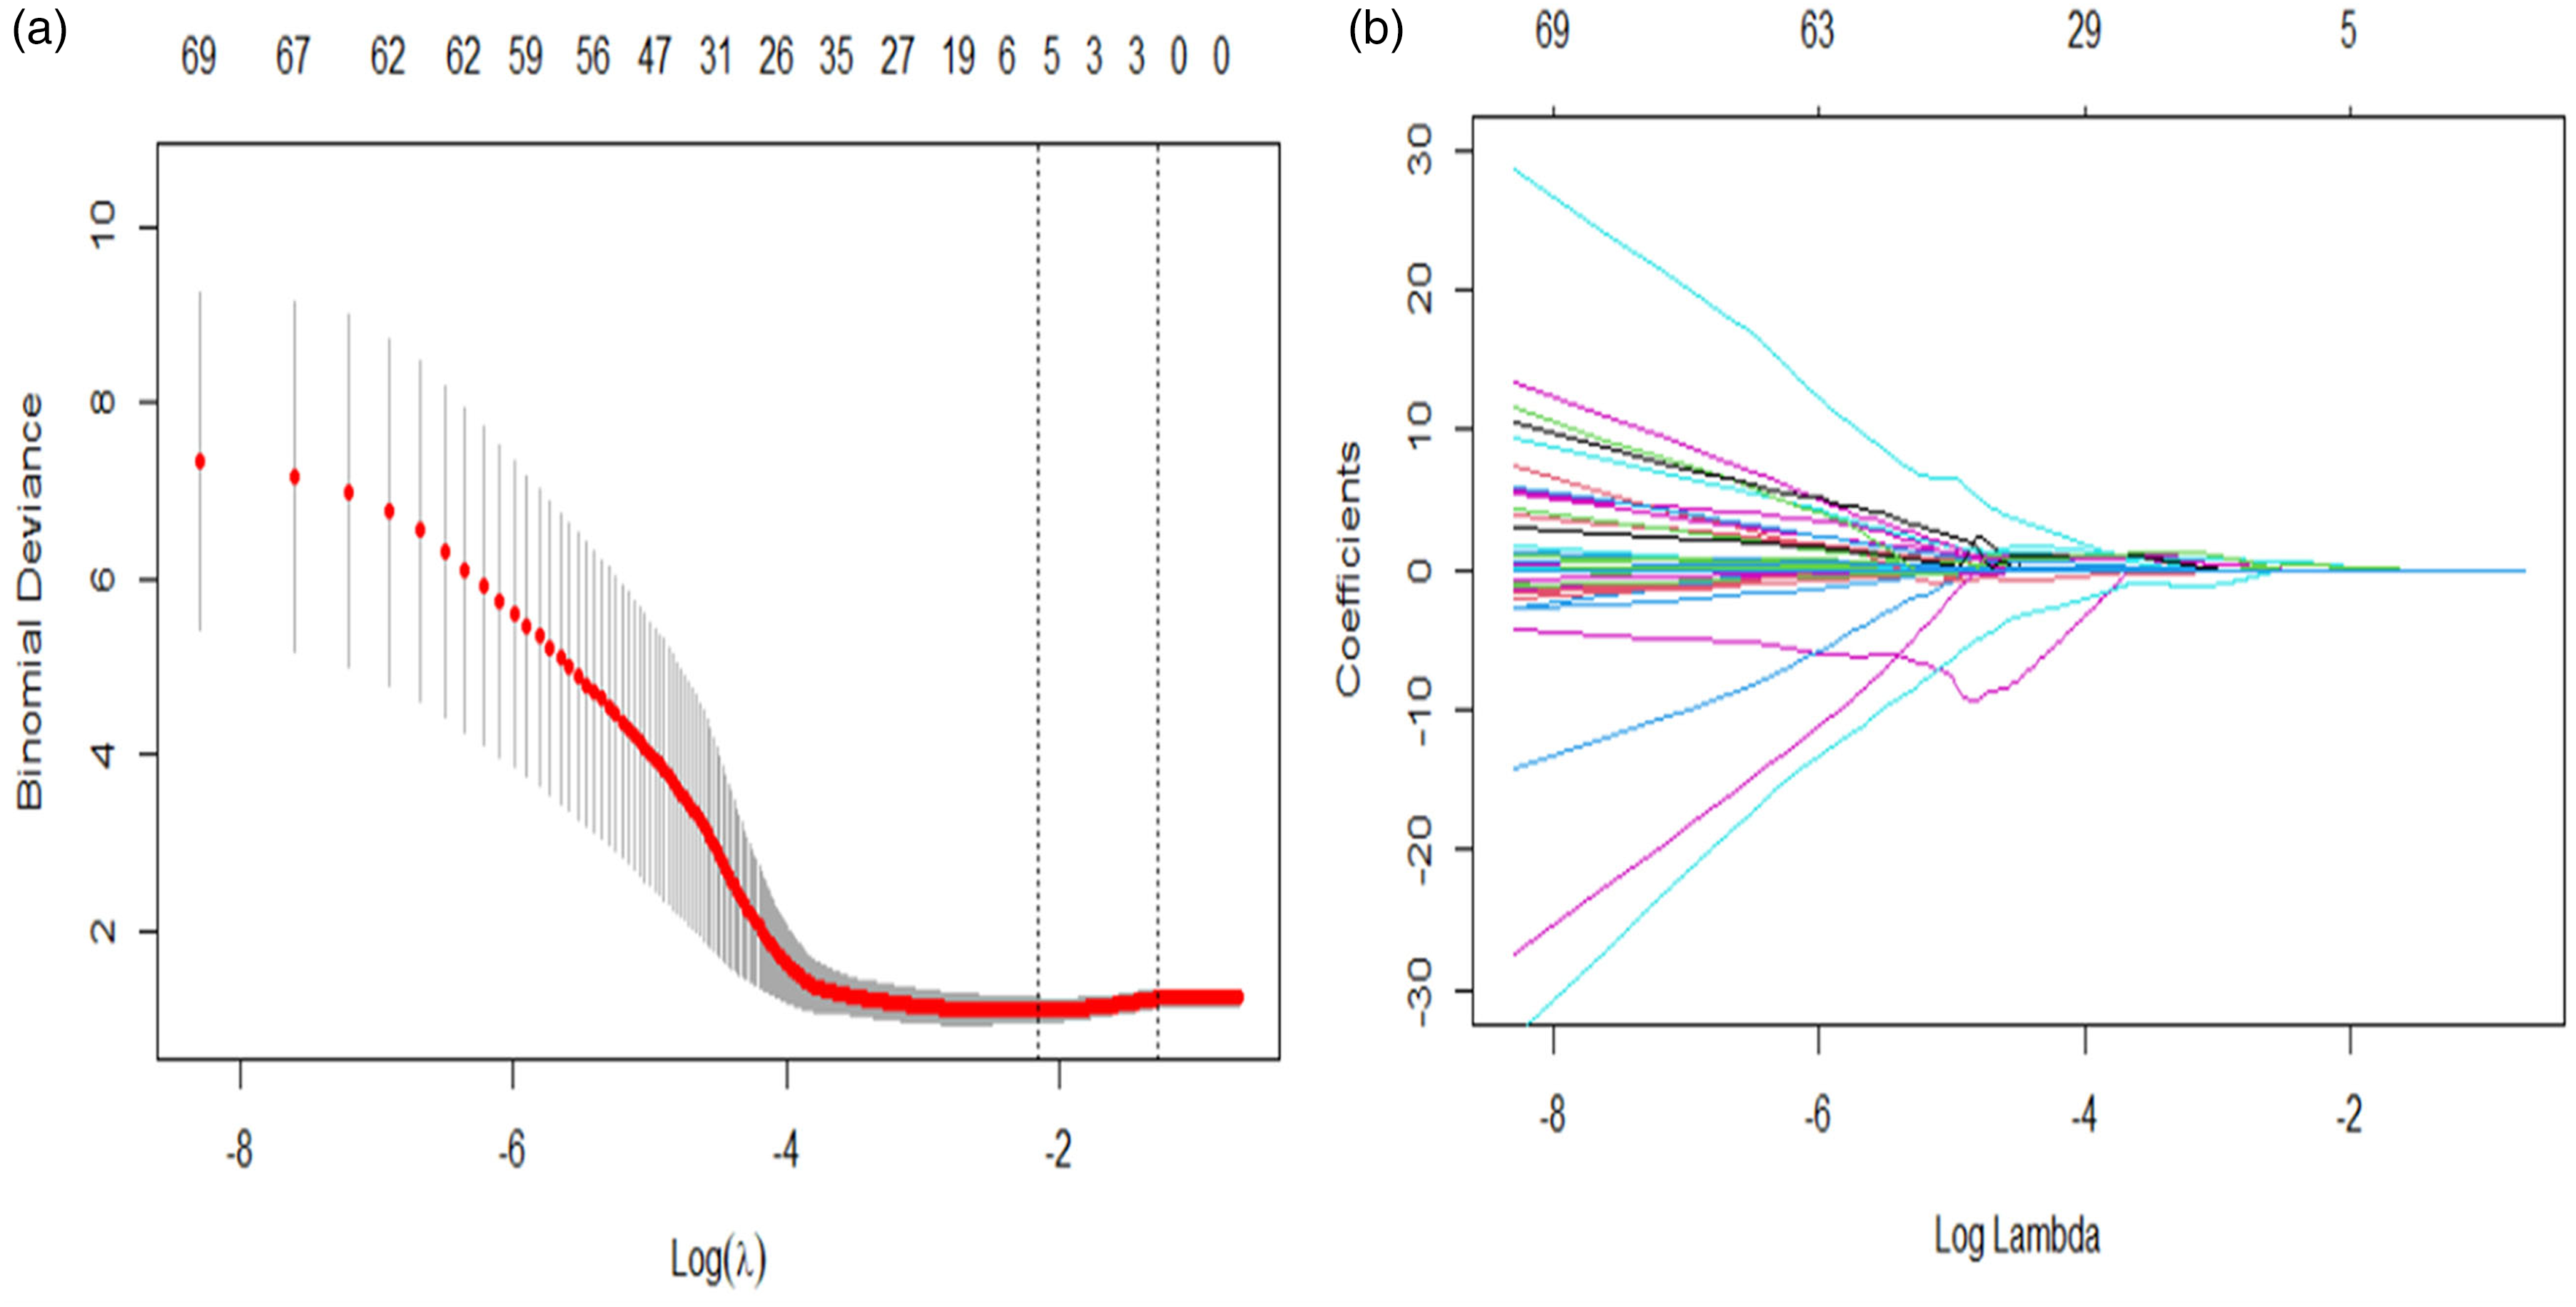
Radiomics feature selection using the LASSO regression algorithm. (a) The multinomial deviance was plotted vs log (λ). The red dots represent the value of the binomial deviance. The gray lines represent the SE. The vertical dotted lines represent the optimal values using minimum criteria and 1-SE criteria. “Lambda” is the tuning parameter. (b) LASSO coefficient profiles of the radiomics features. Each colored line represents the coefficient of the indicated feature.
Construction and evaluation of radiomics signatures
The radiomics signatures were constructed using rad-scores calculated according to the formula in the Supplementary Material (Tables S2–4).
In the analysis of rad-scores in the training (P < 0.001) and validation groups (P = 0.001, P = 0.002, P = 0.018 of T1W-FS, T2W-FS, and CE-T1W imaging, respectively), the STS group had significantly higher rad-scores than the nodular fasciitis group.
The predictive indicators (sensitivity, specificity, and AUC) of the three radiomics signatures are shown in Table 3. The radiomics signature based on T2W-FS imaging exhibited good performance in both the training (AUC = 0.962, 95% CI = 0.880–0.944) and validation (AUC = 0.916, 95% CI = 0.818–0.971) groups. Meanwhile, the AUC of the radiomics signature based on CE-T1W imaging was higher than that based on T1W imaging (AUC = 0.868, 95% CI = 0.758–0.940) in both the training and validation groups (AUC = 0.757, 95% CI = 0.63−0.857).
The diagnosis performance of three radiomics signatures in the training and validation groups.
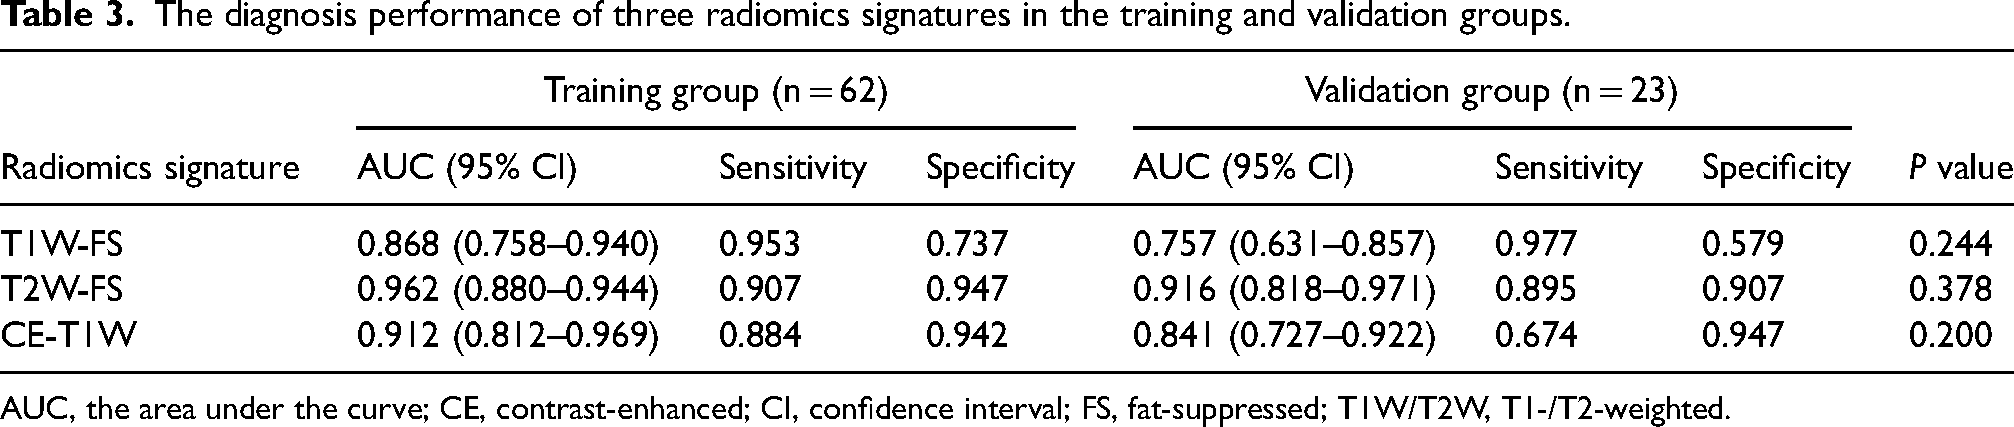
AUC, the area under the curve; CE, contrast-enhanced; CI, confidence interval; FS, fat-suppressed; T1W/T2W, T1-/T2-weighted.
Construction of the radiomics nomograms
The clinical radiomics nomograms, including radiomics signatures, tumor location, size, heterogeneous signal intensity on T2W-FS imaging, heterogeneous signal intensity on CE-T1W imaging, margin definitions on CE-T1W imaging, and septa, were constructed to differentiate nodular fasciitis from STS (Fig. 8). When combined with the clinical factors and semantic features of MRI scans, the clinical radiomics nomograms achieved a satisfactory diagnostic performance with AUCs of 0.918 (95% CI = 0.836–0.998), 0.972 (95% CI = 0.909–0.978), 0.938 (95% CI = 0.873–0.989), and 0.949 (95% CI = 0.878–1.000) for T1W-FS, T2W-FS, CE-T1W, and combined MR imaging, respectively (Fig. 6). The diagnostic performance of the clinical radiomics nomograms and radiomics signatures were higher than that of clinical MRI models (AUCs of 0.747, 0.804, 0.821, and 0.860 for the training group, respectively). No significant difference in the AUCs of the radiomics signatures between the training and validation groups were observed (DeLong test, P > 0.05 for each comparison).
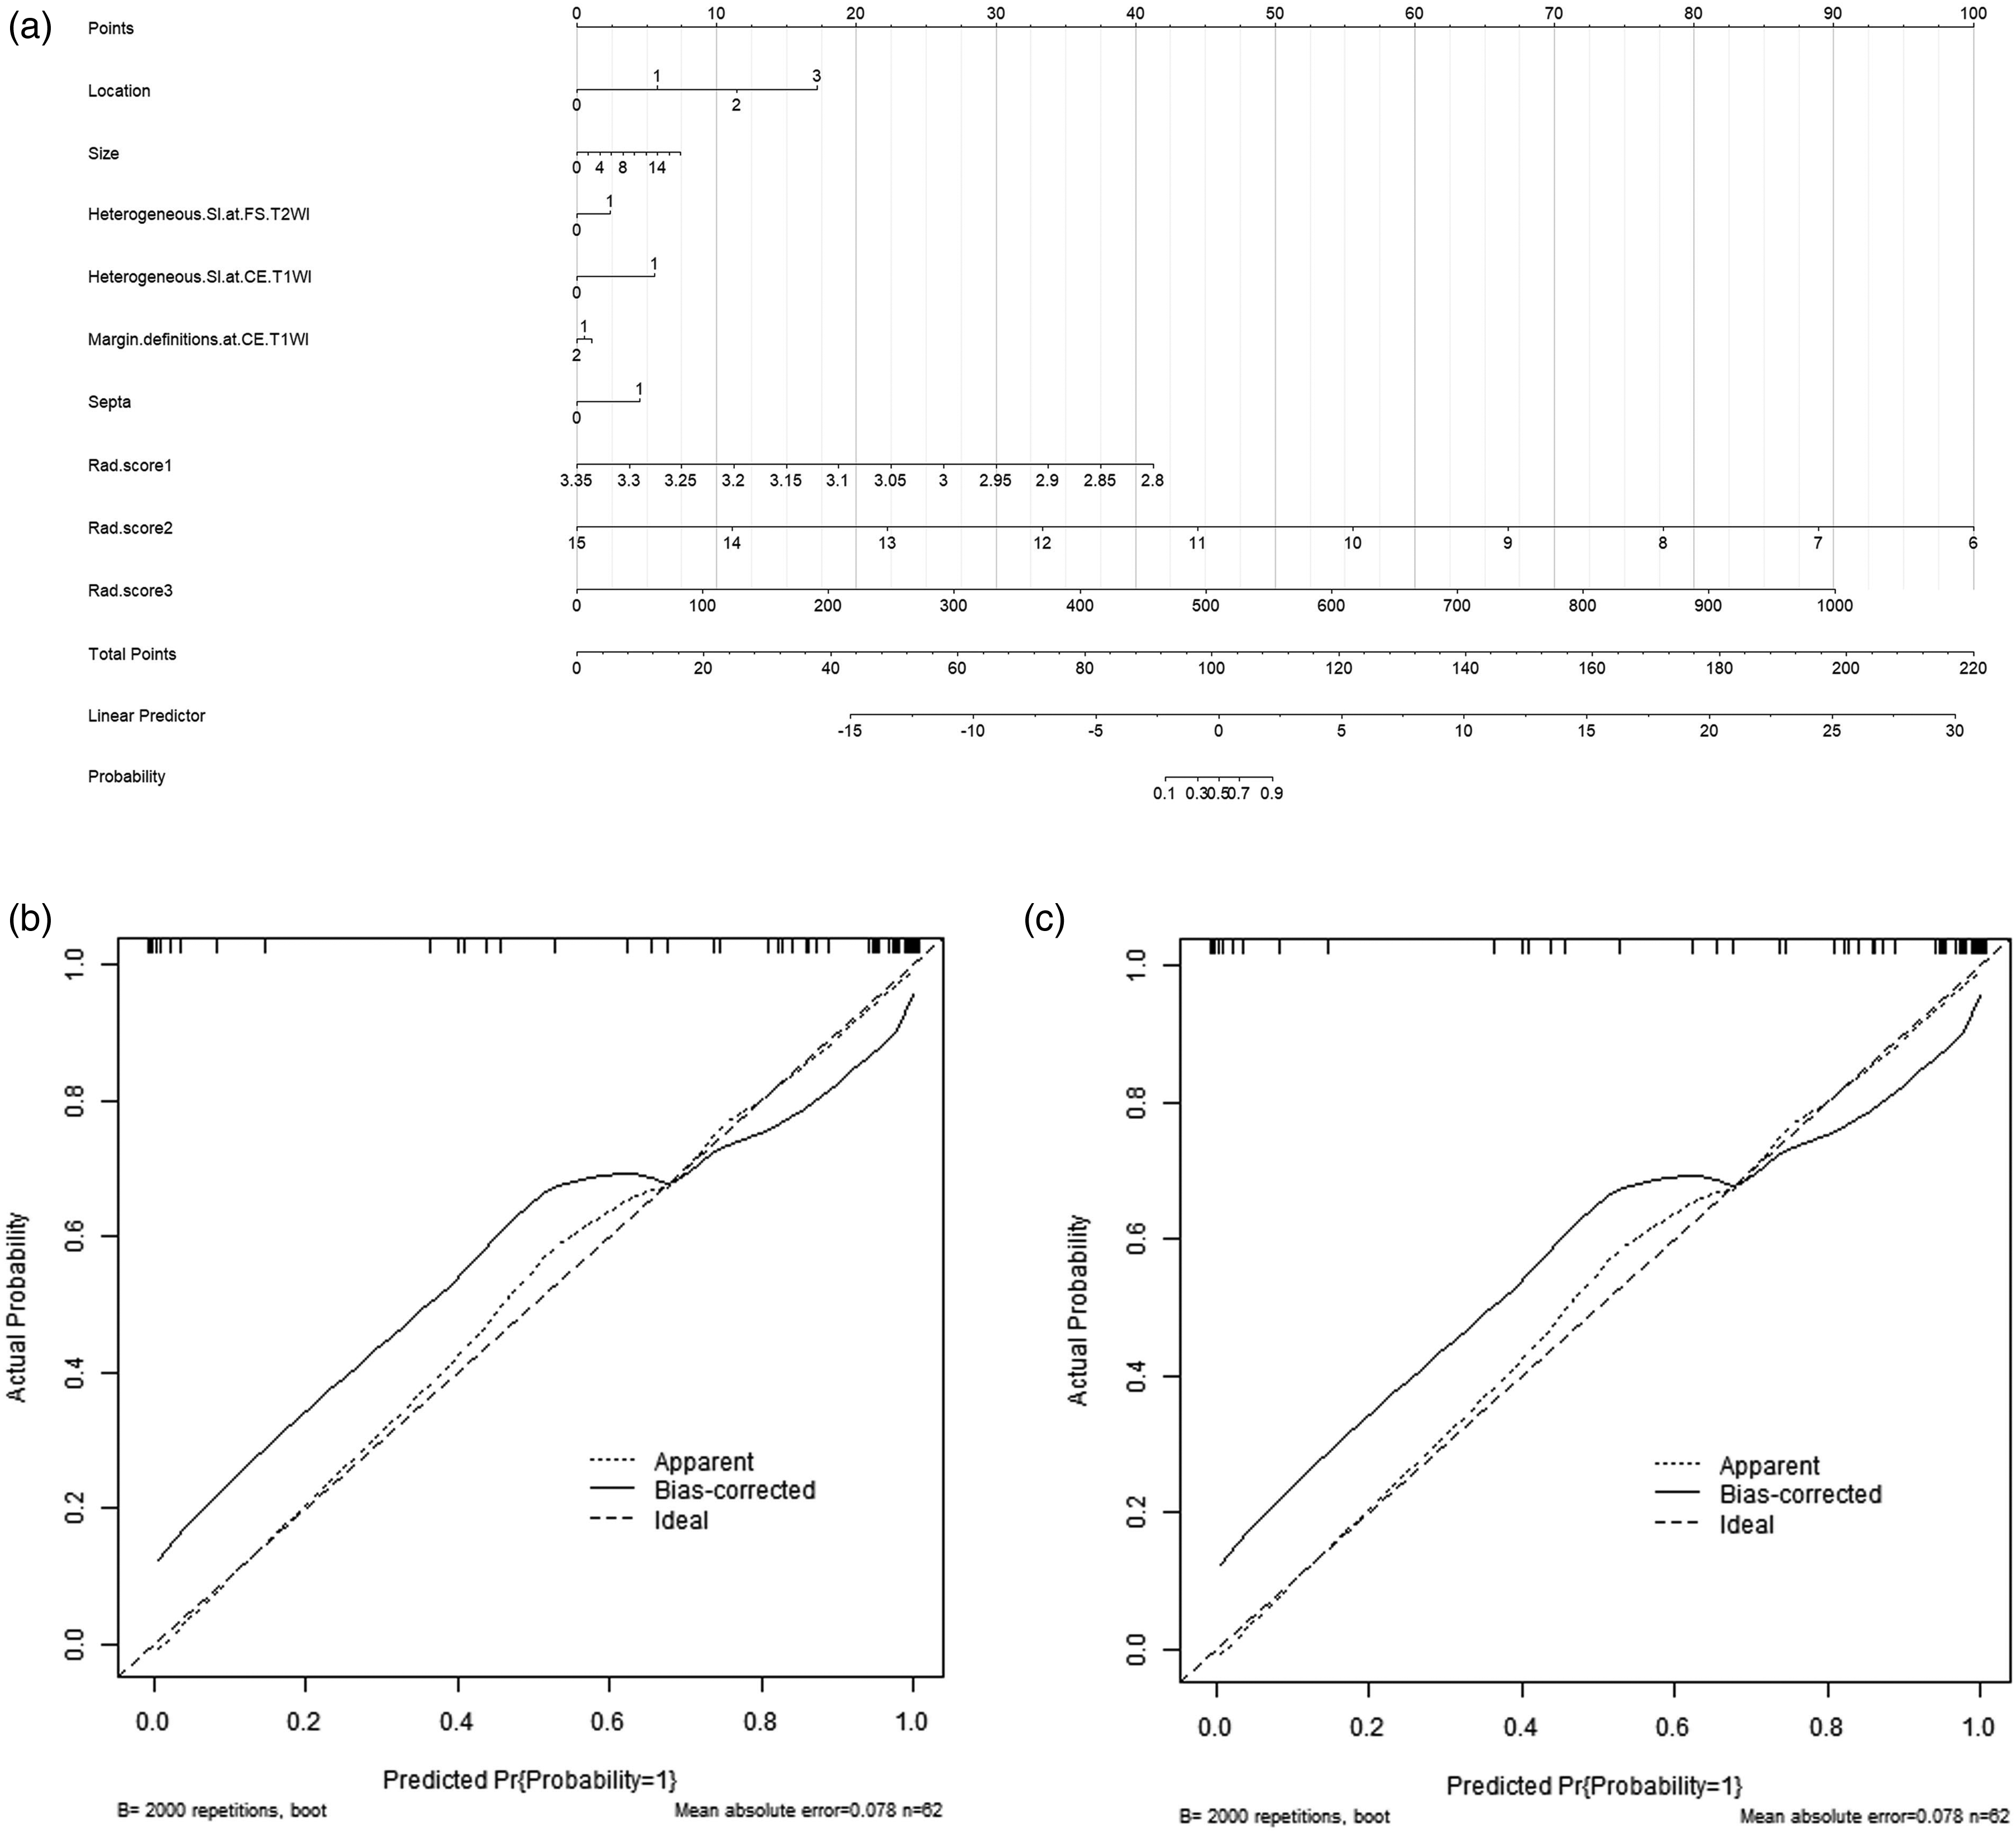
(a) Nomogram for differentiating NF from STS. The rad-score, tumor location, size, heterogeneous signal intensity on T2W-FS, heterogeneous signal intensity on CE-T1W, margin definitions on CE-T1W, and septa were used to construct the radiomics nomograms. The final total points were calculated by adding the scores of each point represented for each feature, and the corresponding prediction probability was obtained using the last scale. (b) Calibration curves of nomograms in the training group. The dotted lines represent an ideal prediction, and the black lines represent the predictive performance of the nomogram. The closer fit of the black line to the dotted line is indicative of a better prediction. (c) The ROC curve of the nomogram. The AUC was 0.949. AUC, area under the curve; CE, contrast-enhanced; FS, fat-suppressed; NF, nodular fasciitis; ROC, receiver operating characteristic; STS, soft tissue sarcoma; T1W/T2W, T1-/T2-weighted.
Calibration curves (bootstraps with 2000 resamples) were generated to evaluate the predictive accuracy of the three clinical radiomics nomograms. The calibration curve revealed good agreement between nomogram prediction and actual observation in both the training and validation groups (Fig. 8).
Discussion
Of the clinical factors, our results indicated that tumor location and size were the most critical predictive factors in the differentiation of nodular fasciitis from STS. Previous studies have indicated that the most common anatomical sites of nodular fasciitis were the upper arms, followed by the trunk and head–neck, and less often in the distal extremities (24,25). By contrast, STS is a heterogeneous group of mesenchymal neoplasms that may occur anywhere in the body (26), but most cases occur in the extremities (27). In this study, the most prominent site of nodular fasciitis was the upper extremities, while STS mainly occurred in the thighs. Nodular fasciitis commonly presents as small nodules, and approximately 87.5% of cases in the present series had nodules <4 cm in diameter (4,19). In this study, the largest diameter of lesions characteristic of STS (7.1 ± 3.8) was significantly larger than that of lesions characteristic of nodular fasciitis (4.2 ± 2.7), consistent with the findings of previous studies (4). Thus, tumors >4 cm in diameter and characteristic of nodular fasciitis should first be differentiated from other types of fibrous tumors and STS (28).
Several studies have used MRI or MRI combined with ultrasound to differentiate nodular fasciitis from STS; however, its interpretation potential is restricted (29,30). Nodular fasciitis is a lesion that originates from the fascia, and MRI can capture the linear extension of the adjacent fascia, which is rat-tail–shaped. However, when STS invades the adjacent fascia, it also shows a limited thickening of the fascia, which forms a “fascial tail sign.” The results of this study show that the “fascial tail sign” between nodular fasciitis and STS overlapped, and thus, the value of the “fascial tail sign” in the differentiation of the two types of soft tissue tumor was restricted. In this study, the four cases with nodular fasciitis showed a characteristic enhancement pattern, i.e. the “inverted target sign.” The center of a nodular fasciitis lesion is rich in extracellular matrix and filled with fluid, while the periphery is abundant in collagen fibers and capillaries, which may account for the marginal enhancement and facilitate the diagnosis of nodular fasciitis (6).
In this study, only 5 of the 27 cases with nodular fasciitis were initially diagnosed with the disease, 9 were diagnosed with other benign lesions, and 13 were diagnosed with various types of STS. Therefore, the rate of misdiagnosis of nodular fasciitis by radiologists was high, and the diagnostic efficacy was influenced by the diagnostic experience of the radiologists. The diagnostic efficacy of the more experienced radiologists was higher than that of the less experienced radiologists. Regardless, the accurate preoperative differentiation of nodular fasciitis from STS using conventional MRI lacked objectivity and quantitative indices.
Radiomic analysis involving clinical factors and imaging demonstrates good clinical value in a variety of diseases (31–35). By extracting the high-throughput quantitative features from MRI scans, radiomics allows the non-invasive interpretation of tumor heterogeneity and biological characteristics (22,36). In this study, 26 radiomics features played important roles in the differentiation of nodular fasciitis from STS. We observed that radiomics signatures based on T1W-FS, T2W-FS, and CE-T1W imaging included more texture-based features such as GLCM, GLRLM, GLSZM, and GLDM. The GLSZM features, particularly the ones measuring zones with small area low gray level emphasis (SALGLE), had the largest coefficients in the three scans. SALGLE measures the proportion of the joint distribution of the smaller size zones with low gray level values in the image. Our results indicated that the gray level distribution of STS MRI scans (higher values in GLSZM_SALGLE) was more heterogeneous than that of nodular fasciitis MRI scans. We hypothesized that the texture and higher-order features were more valuable in differentiating the two types of soft tissue tumor, and high-dimensional radiomics also showed a better ability to differentiate between the tumors (37,38).
The outcomes indicated that the performance of the radiomics signatures based on T2W-FS imaging and combined with MRI scans was superior to those based on T1W-FS and CE-T1W imaging. Previous studies have demonstrated that the different histological types of nodular fasciitis exhibit unique signal intensity features and MRI enhancement patterns (6,28,39). For instance, cellular lesions with remarkable cellularity, cytoplasmic volume, and vascularity show high signal intensity on T2W-FS imaging and homogeneous enhancement, while fibrous lesions show a reduced signal, with lower signal intensity at the periphery and higher signal intensity in the center on T2W-FS imaging and only peripheral enhancement. However, the nodular fasciitis mostly exhibited homogeneous isointense signals on T1W imaging compared with skeletal muscle, which complicated its differentiation from STS. Thus, the most significant texture-based features were extracted from T2W-FS and CE-T1W imaging, and they could reflect intra-tumoral heterogeneity with various grayscale values better than those extracted from T1W-FS imaging.
In this study, we developed a clinical radiomics nomogram to differentiate nodular fasciitis from STS. We not only structured the clinical radiomics nomograms based on the clinical factors and radiomics signatures but also constructed the clinical MRI nomograms based on the clinical factors and semantic features of MRI scans. The performance of the clinical radiomics nomograms was higher than that of the clinical MRI models. The diagnostic performance of the clinical radiomics nomograms was improved after combining the clinical factors with the radiomic signatures, which may further contribute to clinical diagnosis and treatment.
The present study has some limitations. First, this is a retrospective study, and thus, may be subject to selection bias. Second, this study included a limited number of patients due to the relatively low incidence of nodular fasciitis and STS. Therefore, overfitting may have affected our results. Third, different types of nodular fasciitis and STS were not examined, which need to be included in studies in the future.
In conclusion, this retrospective study presents radiomics nomograms based on the clinical factors and semantic features of MRI scans that may serve as a non-invasive tool to differentiate nodular fasciitis from STS before surgery and assist clinicians in creating a personalized treatment protocol.
Supplemental Material
sj-docx-1-acr-10.1177_02841851231188473 - Supplemental material for Development of clinical and magnetic resonance imaging-based radiomics nomograms for the differentiation of nodular fasciitis from soft tissue sarcoma
Supplemental material, sj-docx-1-acr-10.1177_02841851231188473 for Development of clinical and magnetic resonance imaging-based radiomics nomograms for the differentiation of nodular fasciitis from soft tissue sarcoma by Chunjie Wang, Zhengyang Zhang, Yanping Dou, Yajie Liu, Bo Chen, Qing Liu and Shaowu Wang in Acta Radiologica
Footnotes
Declaration of conflicting interests
The author(s) declared no potential conflicts of interest with respect to the research, authorship, and/or publication of this article.
Funding
The author(s) disclosed receipt of the following financial support for the research, authorship, and/or publication of this article: This work was supported by the National Natural Science Foundation of China (grant number 81771804).
Supplemental material
Supplemental material for this article is available online.
References
Supplementary Material
Please find the following supplemental material available below.
For Open Access articles published under a Creative Commons License, all supplemental material carries the same license as the article it is associated with.
For non-Open Access articles published, all supplemental material carries a non-exclusive license, and permission requests for re-use of supplemental material or any part of supplemental material shall be sent directly to the copyright owner as specified in the copyright notice associated with the article.