
Abstract
Background
The middle cerebral artery occlusion model (MCAo) is a commonly used animal model for cerebral ischemia studies but lacks accessible imaging techniques for the assessment of hemodynamic changes of the model.
Purpose
The study aims to explore the value of contrast-enhanced ultrasound (CEUS) in evaluating brain perfusion in the early stages after MCAo surgery.
Material and Methods
In total, 18 adult male Sprague-Dawley rats were subjected to right MCAo using an intraluminal filament model, and CEUS was performed at the three following timepoints: before (T0), immediately after (T1), and 6 h after permanent MCAo (T2). Twelve rats successfully completed the study, and their brains were removed and stained using 2, 3, 5-triphenyltetrazolium chloride (TTC). CEUS video images were visualized offline, and the time-intensity curves (TICs) were analyzed. Different cerebrovascular patterns and manifestations of the contrast enhancement in rat ischemic hemispheres were observed. Semi-quantitative parameters of TICs in ischemic areas (ROIi) and the surrounding normal- or hypo-perfused areas (ROIn) were calculated and compared between T0, T1, and T2, and also between ROIi and ROIn.
Results
A significant correlation was found between the lesion volume (%) determined by TTC and CEUS parameters (r = −0.691, P = 0.013 for peak intensity; r = −0.742, P = 0.006 for area under the curve) at T2. After the same occlusion, there were differences in contrast perfusion in each group.
Conclusion
This study suggests that CEUS could be an effective imaging tool for studying cerebral ischemia and perfusion in small animals as long as the transcranial acoustic window allows it.
Keywords
Introduction
The rat intraluminal suture model is currently the most commonly used animal model for cerebral ischemia studies (1–3). To date, inconsistencies in ischemic severity or lesion volume have greatly limited the potential utility of the model in preclinical studies. Numerous factors may affect the consistency of middle cerebral artery occlusion (MCAo), such as animal strain, surgery procedure, physiological variables, premature perfusion, subarachnoid hemorrhage, or inadvertent occlusion of other arteries, such as anterior choroidal artery (4–9). Individual differences of collateral compensation in different rats is another important reason (6,9–11). It is possible to address this issue using a larger sample size, which requires more resources.
As a monitoring tool, neuroimaging plays an important role in the preclinical study of neuroprotection and reperfusion of acute ischemic stroke at the early stages. An imaging method that can rapidly display whole ischemic areas would be useful to collect precise information and to ensure consistency between animals and study groups. Laser Doppler flowmetry is a useful method to verify the success of MCAo by displaying the decrease of cerebral blood flow in real-time in ischemic brain areas (12) and assessing cortical perfusion and collateral flow (13). However, this method is limited to image a small brain region where the probe is located and cannot provide information on structural and morphological changes in the entire ischemic region. Similarly, Laser Speckle Flowmetry can also be used to monitor MCAo modeling with high spatiotemporal resolution, but it is also limited to the cortical areas due to restricted penetration (14). Magnetic resonance imaging (MRI), computed tomography (CT), and positron emission tomography (PET) perfusion imaging have great values for the assessment of acute ischemic injuries and hemodynamic changes such as perfusion deficit, penumbra, damage of white matter, permeability of the blood–brain barrier, and blood oxygen level (3,15). However, these imaging methods are relatively expensive, time-consuming, technically complicated, and not widely available. And there are very few studies that explore applying this imaging technique in acute ischemic animal models. This is the main motivation of our present study.
Contrast-enhanced ultrasound (CEUS) is a real-time imaging technique for assessing perfusion changes in tissues and organs, including the liver, heart, kidney, muscle, and brain, both in clinical and preclinical studies (16–19). Compared with MRI, CT, and PET imaging, CEUS is more mobile, easier to use, faster in image acquisition, less expensive, and more accessible (20). More important, CEUS technology does not have the adverse reactions and renal toxicity of contrast media (21). However, the application of CEUS in animal stroke models is rarely reported. Therefore, the aim of the present study was to explore the value of CEUS in cerebral perfusion assessment in a rat cerebral ischemia model.
Material and Methods
Animals
All procedures performed in this study were in accordance with the ethical standards of the Animal Ethical Committee of West China Hospital (No. 2016037A).
A total of 18 adult male Sprague-Dawley rats (Dossy Experimental Animal Co. Ltd., Chengdu, PR China) weighing 260–290 g were used in this study. Rats were housed five per cage and kept in a 12-h alternating dark/light cycle environment at 22°C with unlimited water and food, but fasted overnight before the surgery.
Animals were anesthetized with 2.5% isoflurane in 30% oxygen-enriched air for skull-thinning and right MCAo (RMCAo) surgery. After the surgery, the rats were re-anesthetized using isoflurane (4% induction, 1–2% maintenance). Body temperature was monitored by a rectal probe and maintained at 36–37°C using a digitally controlled heating blanket. A 24-G catheter connected to a three-way stopcock was inserted into the tail vein for contrast injection. After the MCAo surgery, the rats were given 3 mL glucose solution (5%) by intra-peritoneal injection and housed one per cage until the last CEUS was performed. The rats were sacrificed at 6 h for histology examination.
Preparation of thinned skull imaging windows
In order to improve the ultrasound penetration, a thinned-skull surgery was performed for all animals using a protocol as previously described (22). To minimize the injury and shorten the surgery time, only the right side of the skull was thinned (23). Briefly, the scalp was shaved and cleaned; the skin was incised, and the periosteum was removed with a scalpel blade and detached from the bone on the right side of the skull. The frontoparietal bone was thinned to 50–80 µm over an area of 6 × 6 mm using a 2.3-mm round burr. To avoid overheating and swelling, the skull was continuously cooled with 0.9% saline during the grinding. Once the thinned-skull procedure was completed, CEUS was immediately performed before RMCAo surgery.
RMCAo surgery
The surgery was performed under a stereo microscope. The right middle cerebral artery (RMCA) of the rats was permanently occluded by an intraluminal filament, as previously described with a minor revision (24). Briefly, the right common carotid artery was exposed and ligated through a midline neck incision. After the right external carotid artery was isolated, ligated, and cut, the right internal carotid artery was isolated and ligated loosely to block the blood flow. A silicone-coated monofilament nylon suture (#34, A5; Beijing Cinontech Co. Ltd., Beijing, PR China) was used for RMCAo. The diameter of the filaments was 0.26 mm and the mean silicone-coated tip was 0.34 ± 0.02 mm. The filament was inserted through an incision of the right carotid artery into the right internal carotid artery until mild resistance was felt, indicating that the suture tip had reached the right anterior cerebral artery, occluding blood flow to the RMCA (18–22 mm beyond the carotid bifurcation). After the filament placement, the neck incision was closed and the loose suture around the right carotid artery with the inserted filament was tightened to prevent movement during the occlusion period.
CEUS imaging
All CEUS image data used for the analysis were obtained from the right hemisphere of the rat. We have compared the contrast effects of whole-brain and right hemisphere CEUS imaging (Fig. 1a) before MCAo and found no significant difference. The same CEUS scanning protocol was carried out in each rat at three timepoints: before RMCAo (T0); after suture insertion (T1, 5–15 min after operation); and 6 h after permanent RMCA occlusion (T2). During the CEUS examinations, rats were placed in a prone position with 1-cm-thick plastic foam placed under the neck, and with two forelegs naturally placed on both sides of the head, and the two hind legs stretched back naturally. CEUS imaging was conducted with a clinical ultrasound scanner (Philips iU22; Philips Healthcare, Andover, MA, USA) equipped with a L12-5 transducer. The transducer was fixed on a stereotaxic apparatus and positioned at 5.5 mm from the outer canthus of the rat with the aid of a stereotaxic frame and fine-tuning knob. B-mode imaging was first performed to optimize the imaging window, and then switched to contrast mode (pulse inversion technique) with the following parameters: MI = 0.1; TGC in maximal position; focus at 0.5–0.75 cm; gain 75%; and Chroma map 3. The ultrasound contrast agent (SonoVue; Bracco Suisse SA, Geneva, Switzerland) was injected as a bolus via the tail catheter at a dose of 0.15 mL and flushed with 0.3 mL of 0.9% saline solution. The timer of CEUS was set at the same time of the contrast agent injection and CEUS video recordings were stored for 30 s for quantitative analysis.
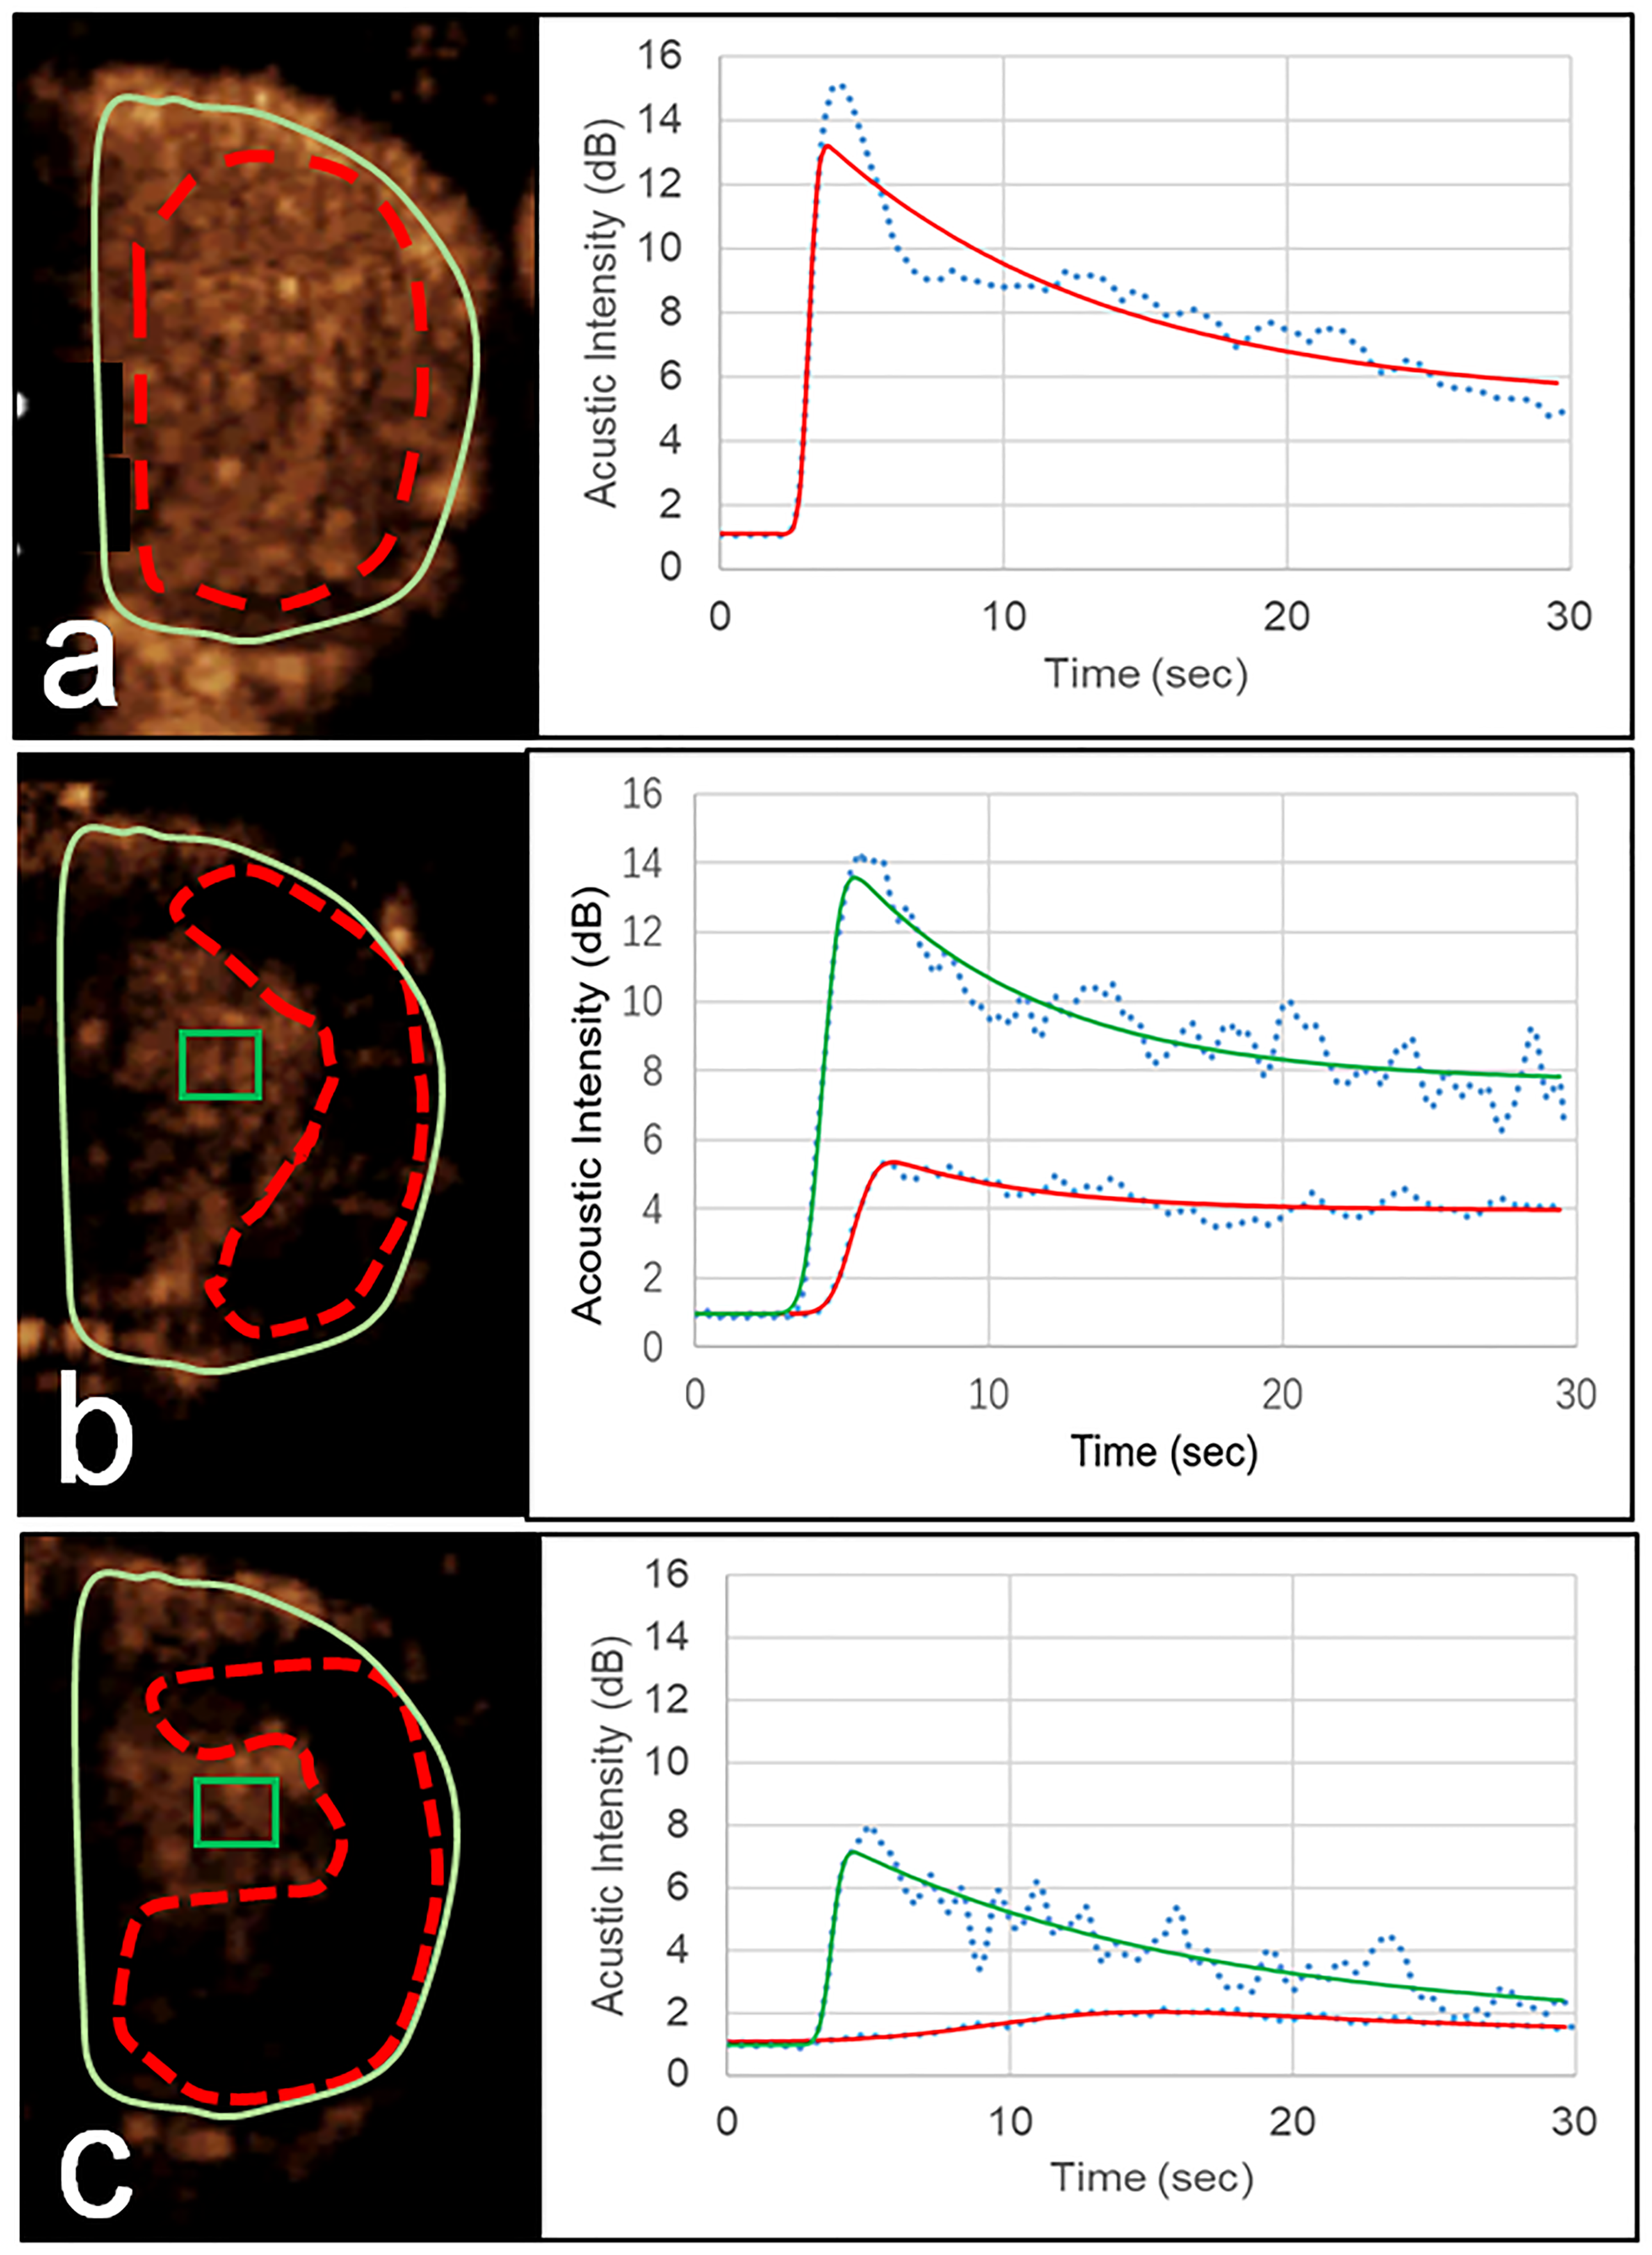
Left: CEUS images of rat right hemispheres at (a) T0, (b) T1, and (c) and T2. The ischemic areas (ROIi) are drawn in red dotted lines and the normal- or hypo-perfused areas (ROIn) in green rectangles. Right: corresponding TICs calculated within the ROIi and ROIn of the left CEUS images. CEUS, contrast-enhanced ultrasound; TIC, time-intensity curve.
Analysis of CEUS images
CEUS scanned images were examined in real-time to ensure the success of the MCAo surgery. The video recordings were reviewed offline. The whole process of contrast enhancement was observed carefully, noting the features of enhancement in the right hemisphere. The non-enhanced area of the rat’s right hemisphere was defined as the ischemic area and the remaining surrounding region was considered as the normal- or hypo-perfused area (25). Quantification of the contrast enhancement was performed using the software QLAB8.1 (Philips Healthcare, Andover, MA, USA), which allows manual drawing of the areas of interest (ROI) to generate the time-intensity curve (TIC) of the contrast enhancement. Before RMCA occlusion, one ROI0 was used for extracting contrast perfusion parameters of the TIC. After occlusion, two ROIs were drawn on contrast images of the right hemisphere: one for ischemic areas (ROIi, red dotted lines) and another for normal- or hypo-perfused areas (ROIn, green rectangles). All images for ROI drawing were obtained when the contrast enhancement reached a maximum (peak intensity [PI]). The lognormal function was used to fit the TIC to obtain the quantitative parameters. Similar to MRI or CT perfusion imaging of acute ischemic stroke, the three most relevant parameters were extracted from TIC quantification: time to peak (TTP); PI; and area under the curve (AUC) (19,25–27).
Calculation of lesion volume by 2,3,5-triphenyltetrazolium chloride (TTC) staining
At 6 h after the RMCAo surgery and after CEUS scanning, the rats were sacrificed using a lethal dose of anesthesia and their brains were removed and put into a −20°C freezer for 20 min. They were then sliced into six 2-mm coronal sections. The sections were stained in 1% TTC in the dark at 37°C for 30 min and then fixed in 10% formalin overnight for photography. The digital images were postprocessed to determine lesion volume using the Image J software (National Institutes of Health, Bethesda, MD, USA). The percentage of lesion volume was calculated using an edema-corrected formula: corrected lesion volume (%) = 100 × [contralateral hemisphere volume–(ipsilateral hemisphere volume–lesion volume)]/contralateral hemisphere volume (28).
Statistical analysis
SPSS Statistics for Windows version 22.0 (IBM Corp., Armonk, NY, USA) was used for statistical analysis. All values were expressed as mean ± standard deviation. Friedman's two-way analysis and Wilcoxon signed-rank test were used to compare the CEUS perfusion parameters between three and two timepoints, respectively. Spearman’s correlation test was used to assess the associations between the percentage of lesion volume determined by TTC and the different manifestations of the categorical variables of CEUS. Pearson’s correlation analysis was used to evaluate the associations between the lesion volume and CEUS parameters. Two-tailed P values <0.05 were considered statistically significant.
Results
Overview of the mice condition
A total of 18 Sprague-Dawley rats underwent the preparation of skull grinding. The mean preoperative weight of the rats was 269 ± 5 g (range = 260–282 g). Three rats died during anesthesia while two more died during or after the RMCAo surgery. One rat was excluded due to the presence of an abnormal ischemic area during TTC staining. The remaining 12 rats successfully completed the study protocol and were included in the statistical analysis. The prone position was the postural state of the mouse at the time of surgery (Fig. 2a). The whole brain of mice was observed by B-ultrasound and CEUS, respectively, and the results showed that CEUS images were significantly higher than B-mode images in the difference rate (Fig. 2b and c). The location of six mouse brain slices used for CEUS was presented in Fig. 2d. Color Doppler imaging (data not shown) and typical local white areas on TTC brain slices confirmed the success of the RMCAo of 12 rats (Fig. 2e). Based on the above brain sections, we analyzed CEUS from the right hemisphere brain sections of mice below.
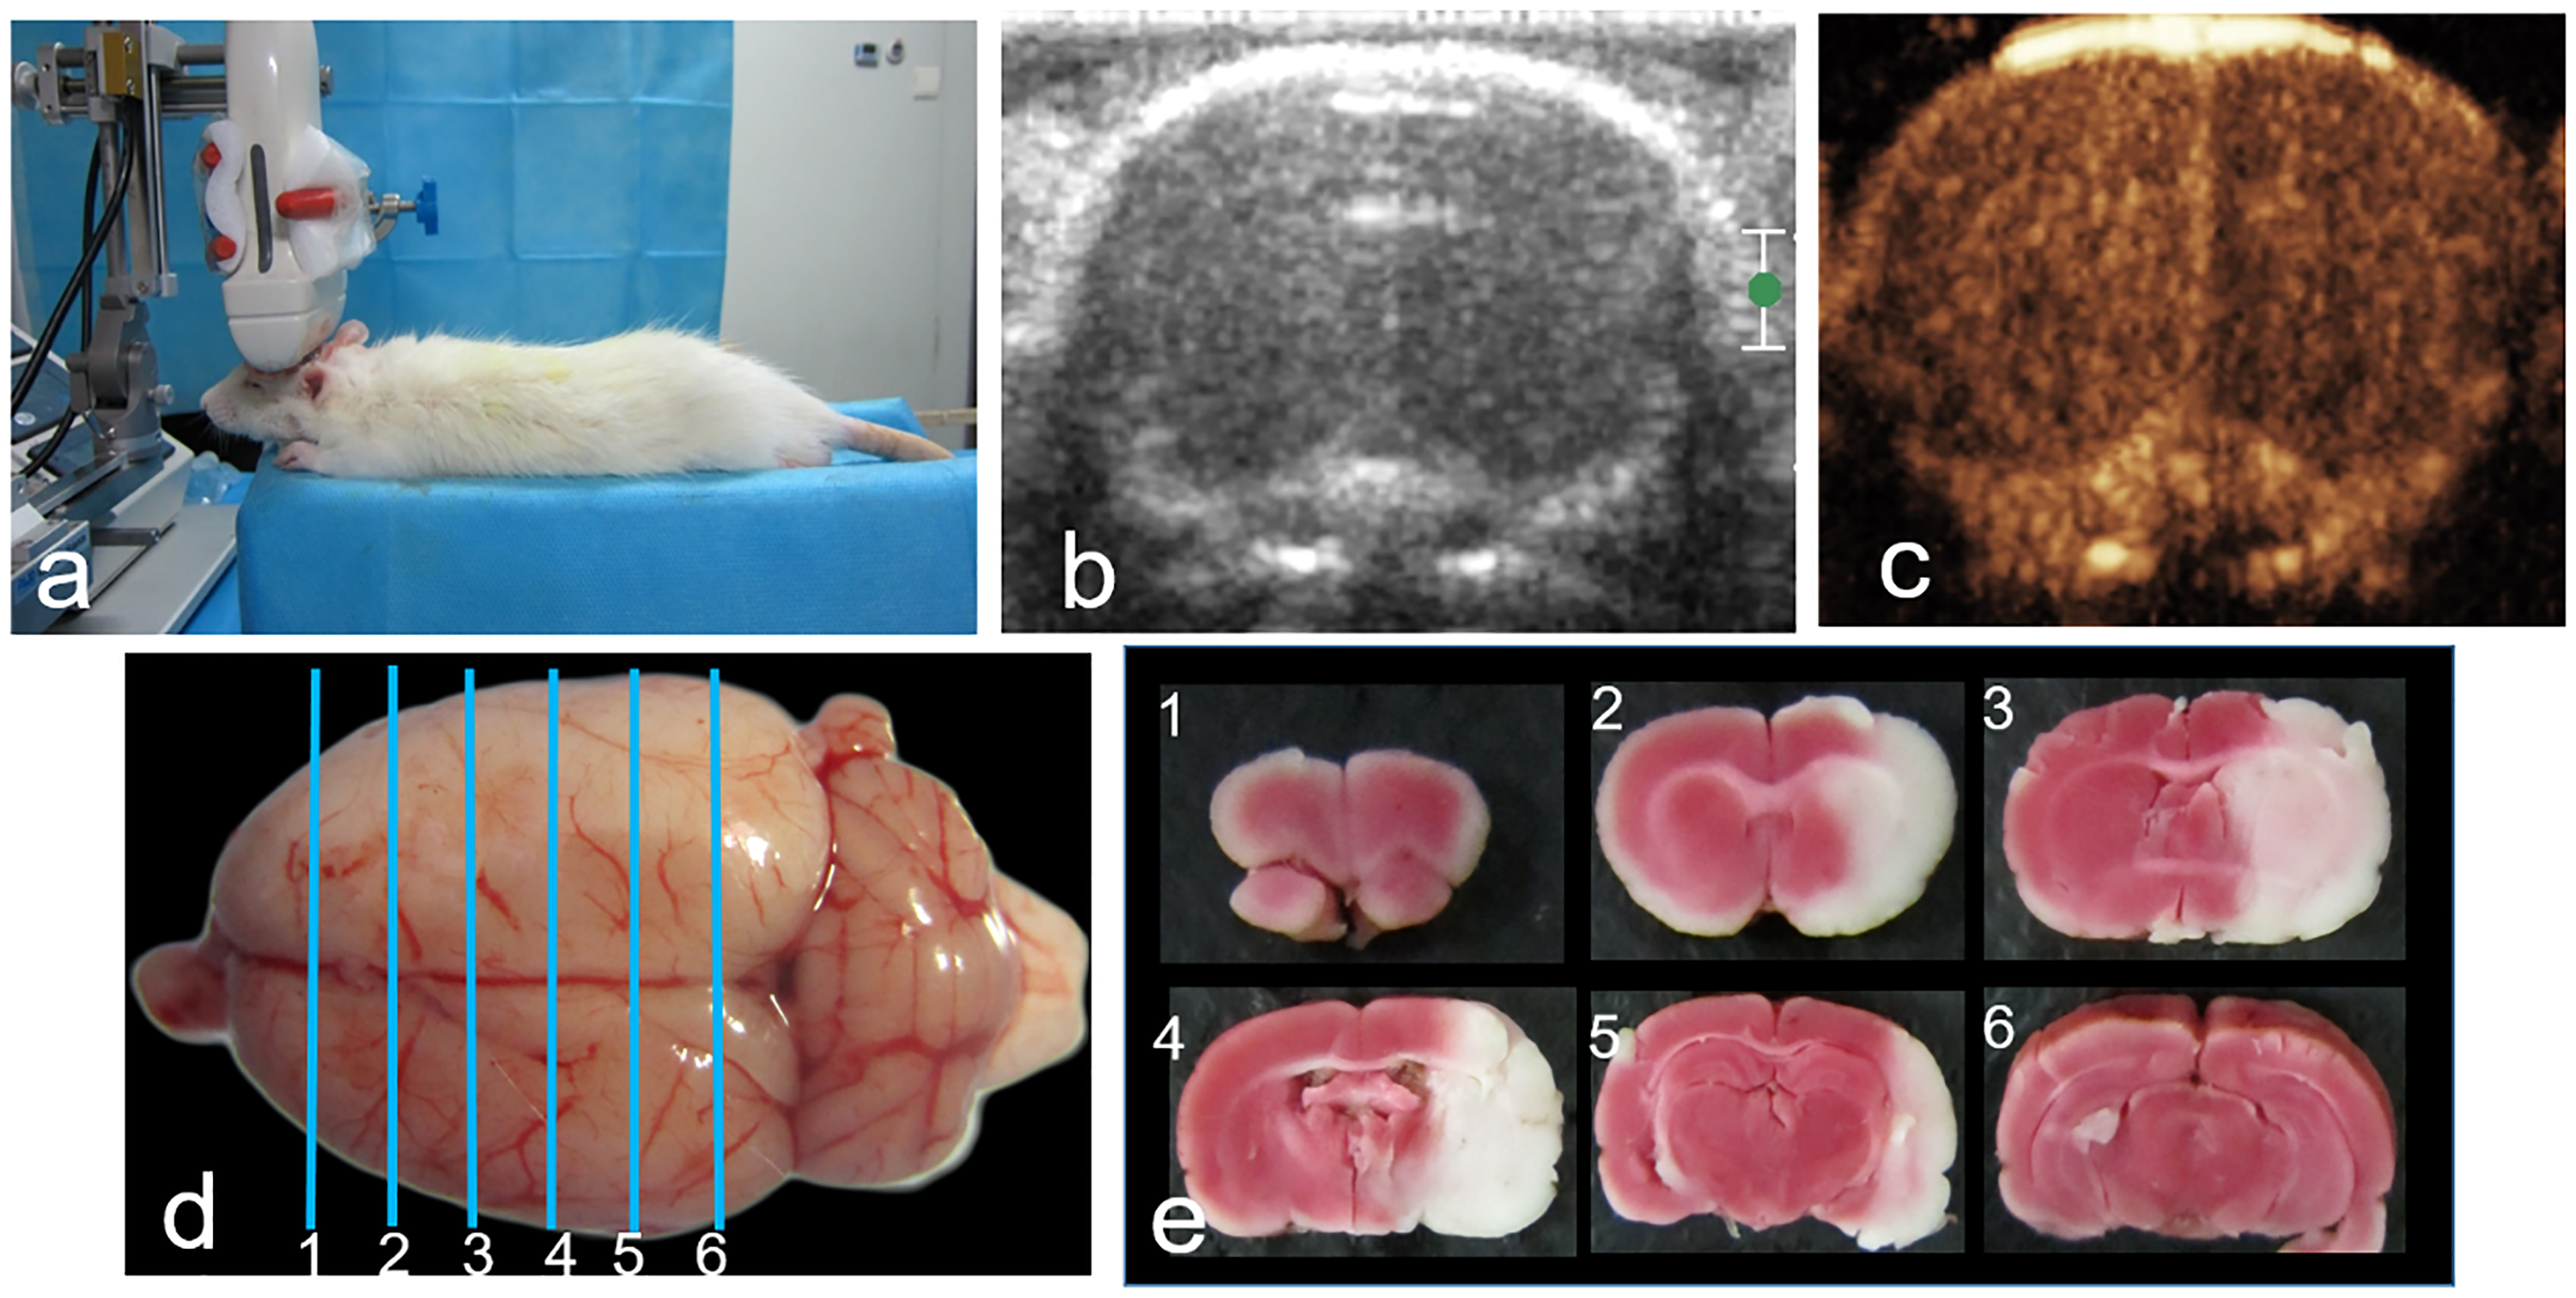
(a) Experimental setup showing the position of the ultrasound probe relative to the rat head for CEUS image acquisition. (b) Ultrasound B-mode image of a rat head before MCAo surgery. (c) CEUS image of the rat head as shown in (b). (d) Example of a rat brain cut into six slices for TTC staining and slices 2–3 corresponding to the scanning sections of CEUS. (e) Representative TTC-stained serial coronal sections (2 mm thick) showing the infarction of the right middle cerebral arterial territory 6 h after permanent occlusion. CEUS, contrast-enhanced ultrasound; MCAo, middle cerebral artery occlusion; TTC, 2, 3, 5-triphenyltetrazolium chloride.
Contrast-enhanced ultrasonography
Dynamic perfusion features revealed by CEUS
CEUS cine recordings of 30 s were taken for each rat at T0, T1, and T2. Cine recordings showed that at T0 (before RMCAo surgery), the contrast enhancement started 2–3 s after the bolus injection of the contrast agent and peaked at 4–5 s, with the whole right brain either homogeneously (11/12, 91.7%) (Fig. 1a, left) or mildly heterogeneously enhanced (1/12, 8.3%). The TIC rose sharply then decreased slowly and dropped to half maximum in about 20 s (Fig. 1a, right).
After the RMCAo surgery, at T1, the contrast enhancement in the right hemisphere became highly heterogeneous (Fig. 1b). The ischemic areas revealed at the peak enhancement were easily identifiable and similar to TTC-stained pictures (Fig. 1b and Fig. 3 vs. Fig. 2e). At T1, the ischemic areas appeared either in the cortex (2/12, 16.7%) (Fig. 3a) or in the cortex + striatum (10/12, 83.3%) (Fig. 3b). At T2, all ischemic areas were found in both the cortex and striatum.
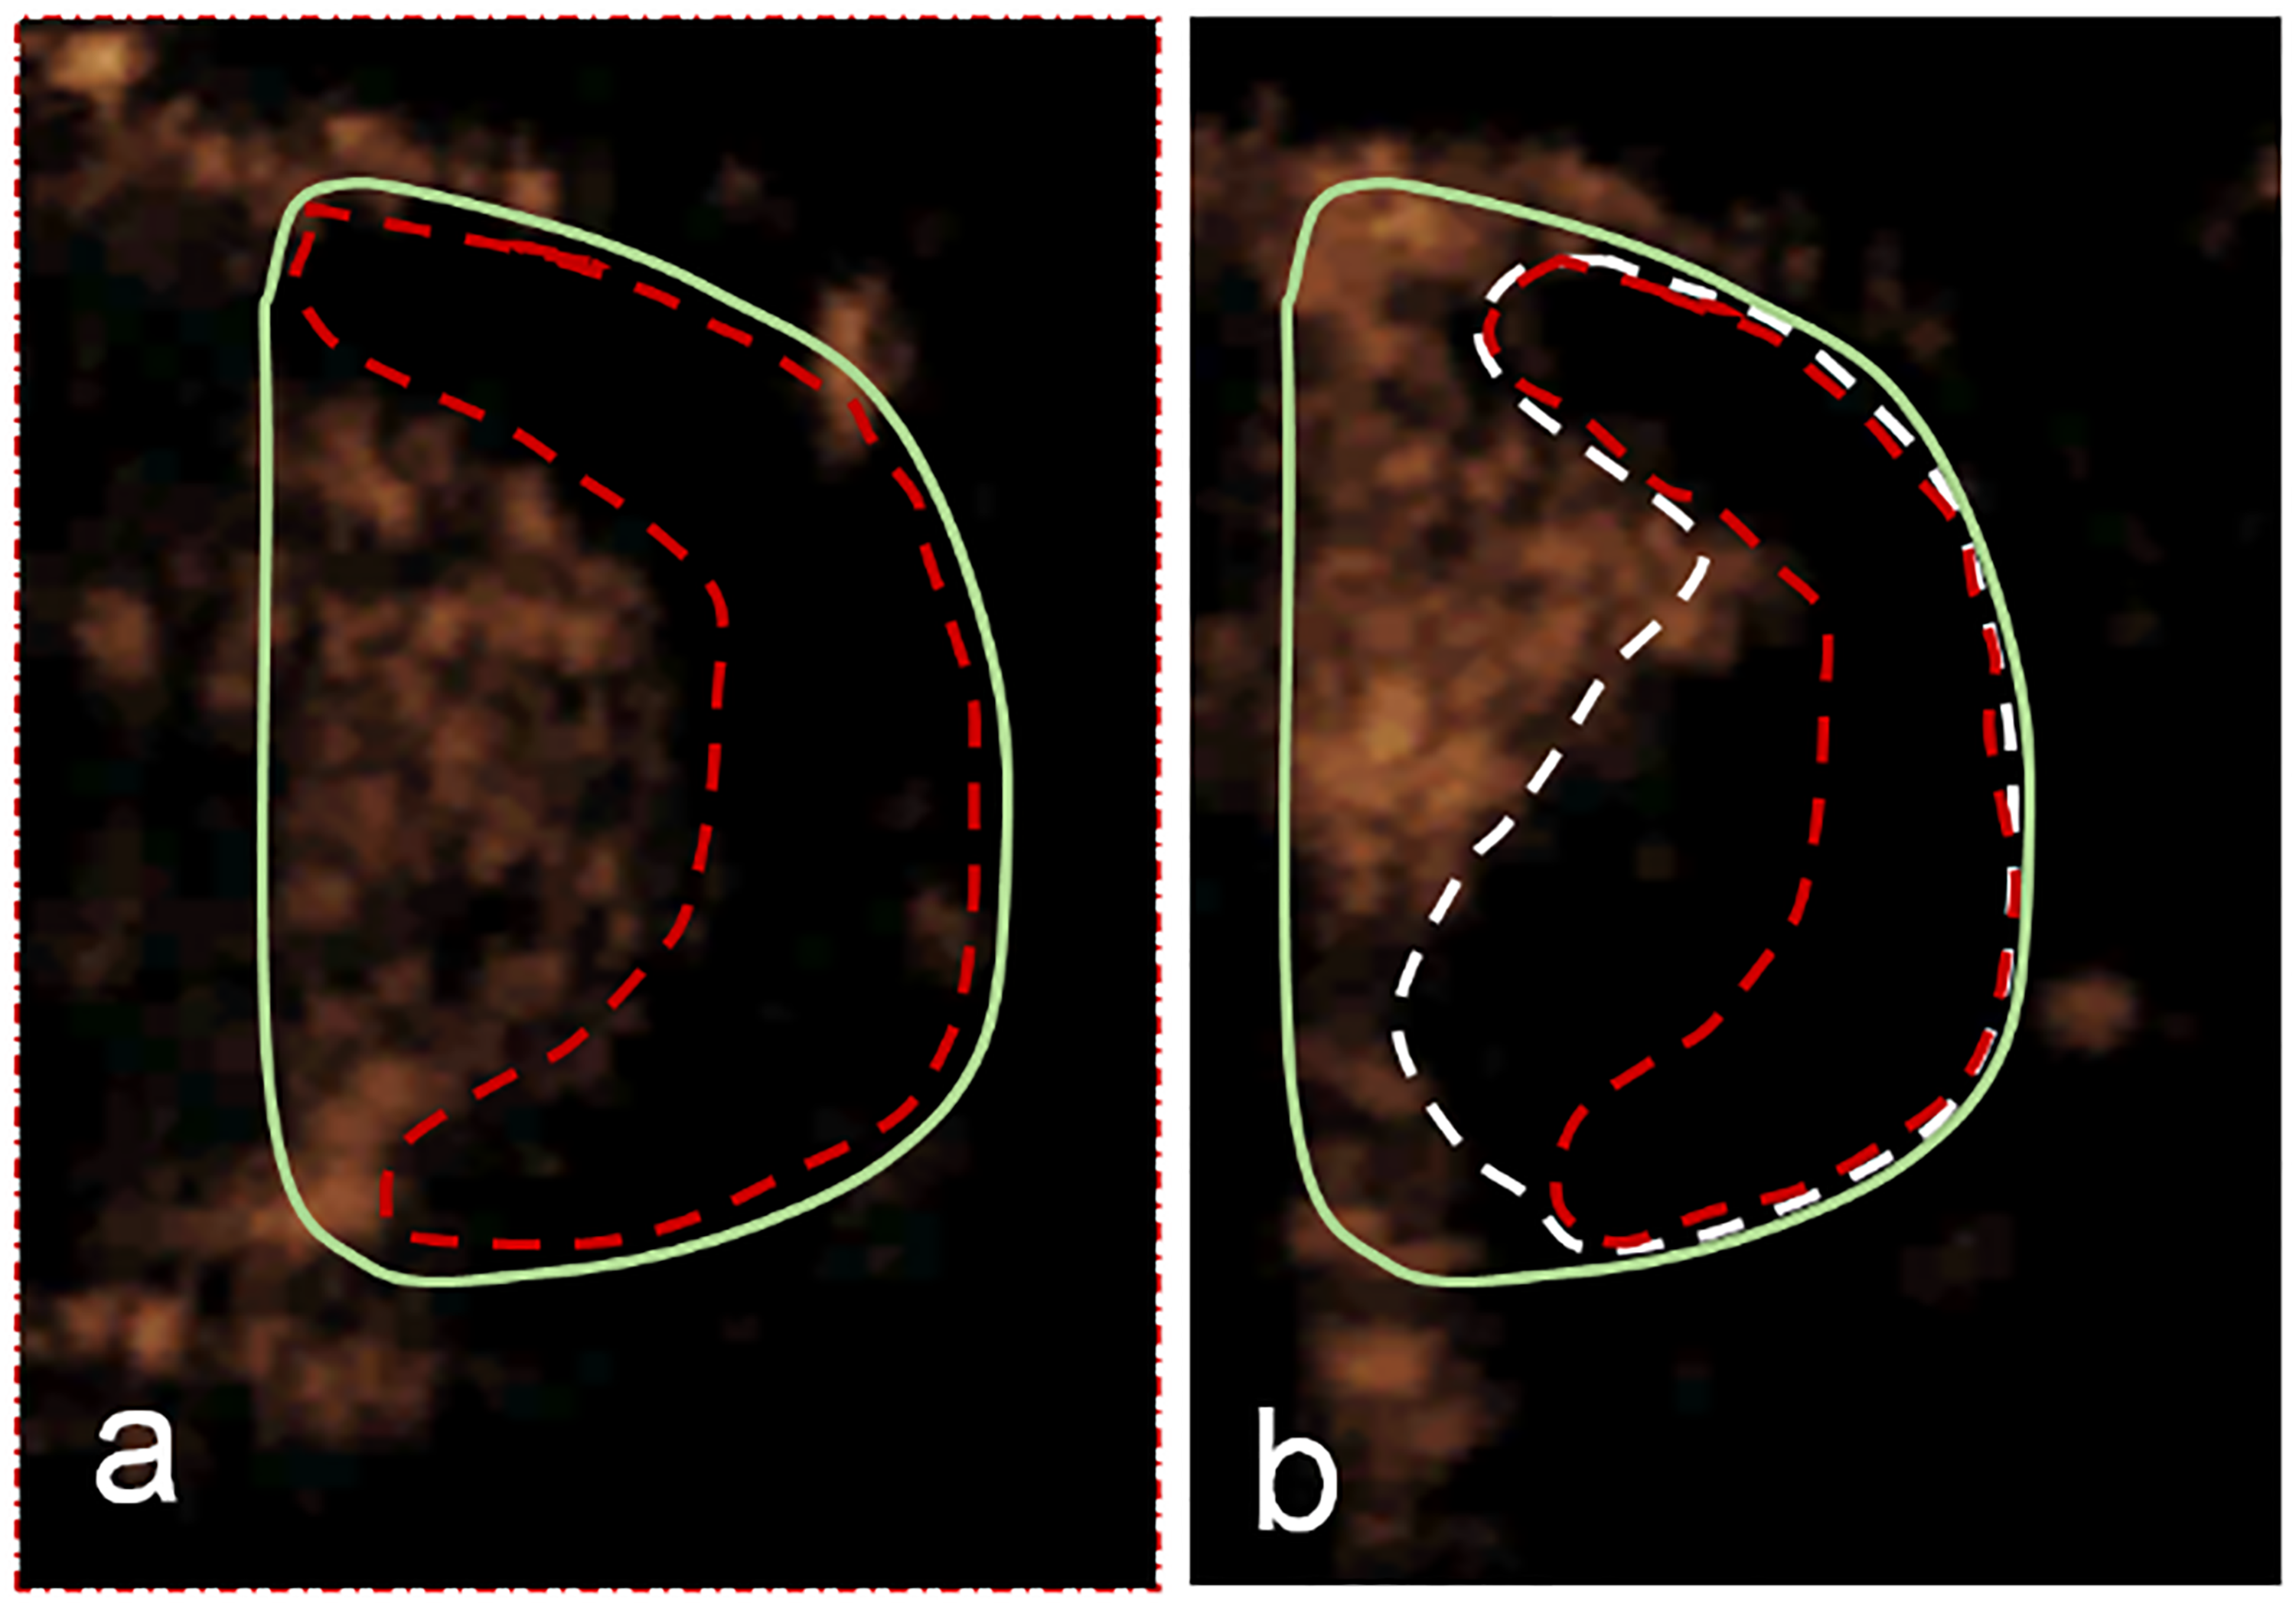
Illustration of two types of ischemic areas identified by CEUS imaging at T1 (5–15 min after RMCA occlusion) in two rats: (a) only cortical (red); (b) cortical + striate (white). CEUS, contrast-enhanced ultrasound; RMCA, right middle cerebral artery.
By carefully examining the video recordings of CEUS in the right hemisphere of each rat after the contrast agent injection, different perfusion features can be observed (see Table 1): (i) maximal contrast enhancement images captured at the peak enhancement (4–5 s); (ii) dynamic vascular patterns (DVP) observed during the washout phase (6–14 s); and (iii) delayed manifestation captured at about 15 s after contrast agent injection.
Characteristic features of the contrast enhancement in the rat right hemisphere after MCAo surgery.
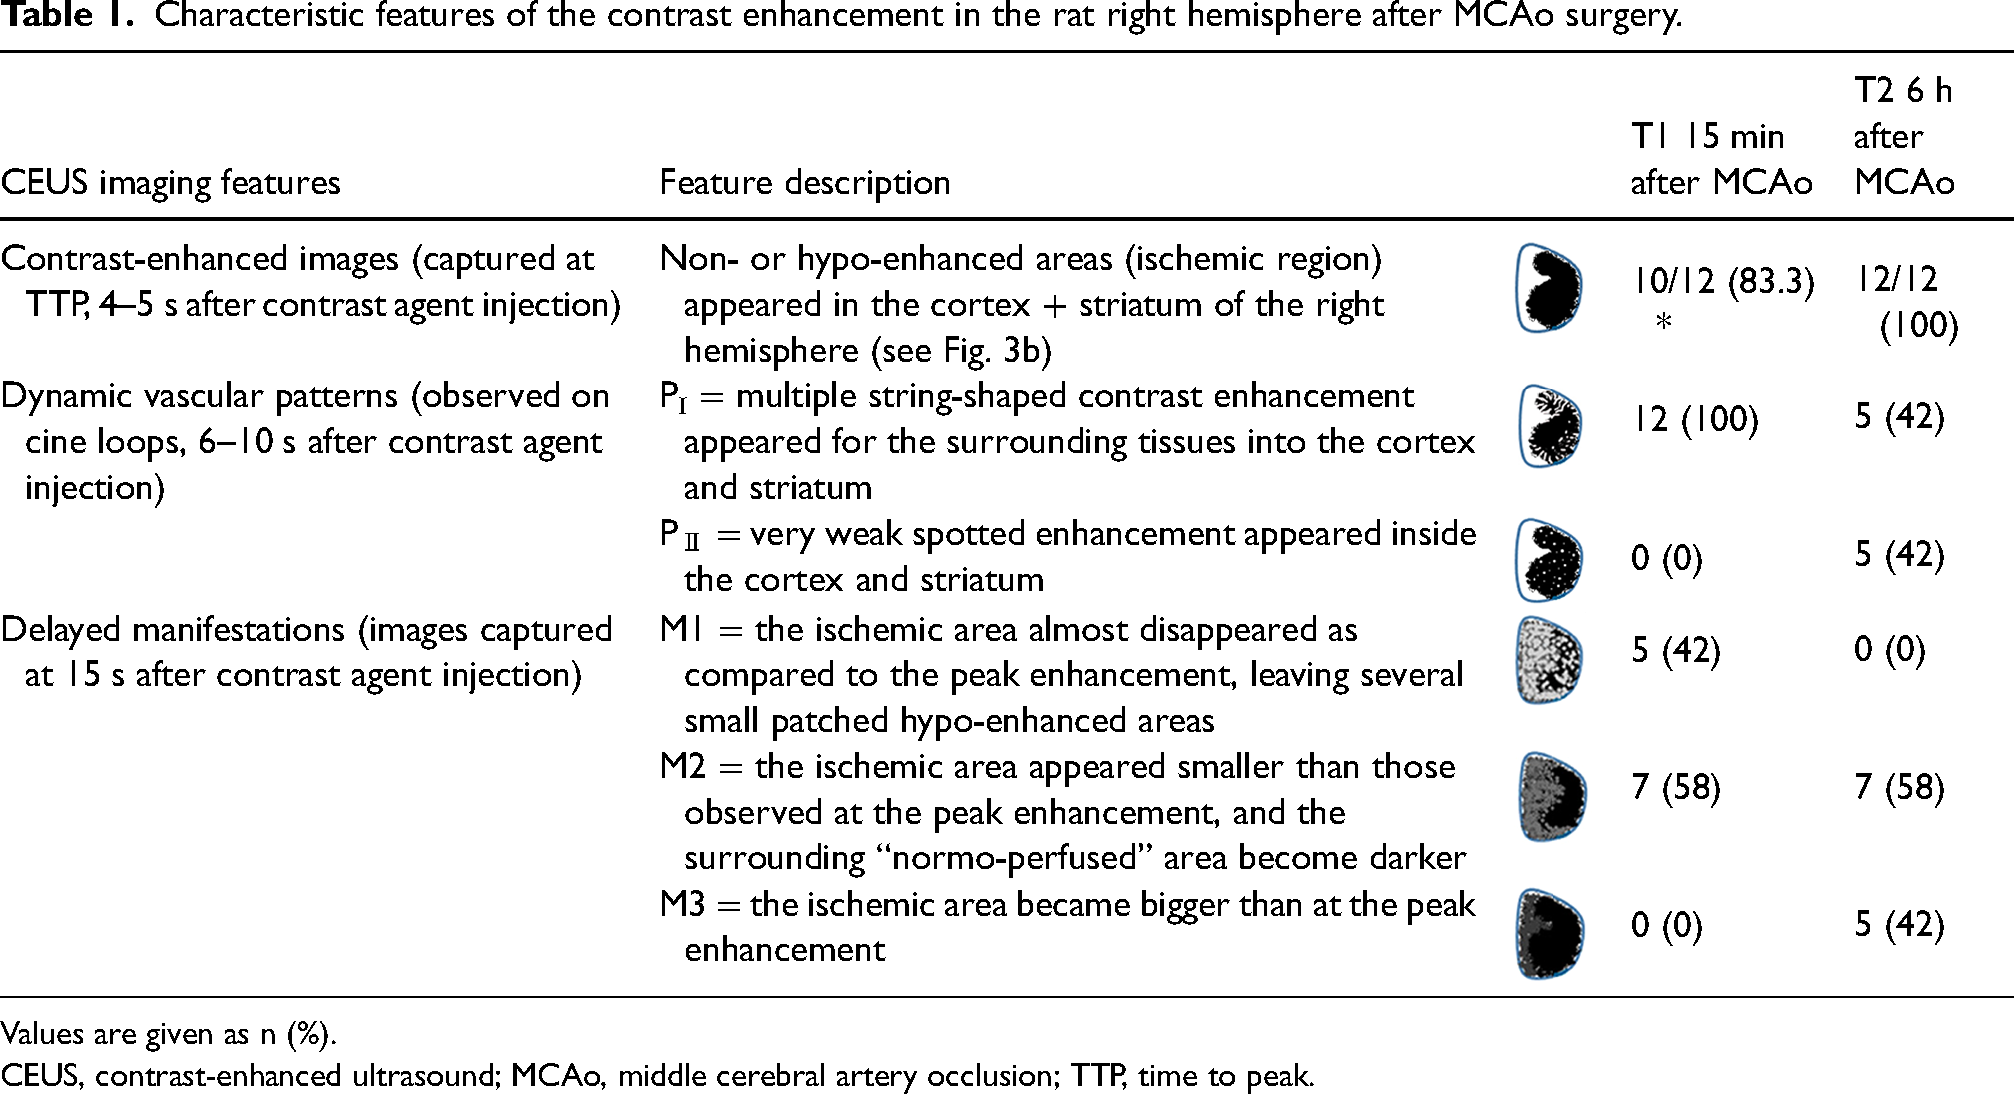
Values are given as n (%).
CEUS, contrast-enhanced ultrasound; MCAo, middle cerebral artery occlusion; TTP, time to peak.
After approximately 6 s after the contrast agent injection, two types of DVP could be identified on video recordings (Table 1): pattern I (PI) = multiple string-shaped enhancements appeared from the surrounding tissues into the cortex and striatum; and pattern II (PII) = very weak spotted enhancement appears in the cortex and striatum. PI could be seen in all rats at T1 but disappeared in more than half of the rats at T2. PII was seen only at T2.
Table 1 also shows that 15 s after the contrast injection, different “delayed manifestations” of the enhancement in the rats’ right hemispheres could be quite different from the ones captured at the peak enhancement (4–5 s after the contrast injection): M1 = the ischemic area almost disappeared, leaving several small hypo-enhanced areas in the right hemisphere; M2 = the ischemic area still existed but became smaller than that at 4–5 s; and M3 = the ischemic area became bigger than that at the peak enhancement. Differences in manifestations could be observed at both T1 and T2: the manifestation M1 was only found at T1; M2 was found in both T1 and T2; and M3 was exclusively found at T2 (Table 1).
Quantitative perfusion parameters of CEUS
Quantitative analysis of the TIC in the region of interest (ROI) showed that both shape and peak amplitude changed significantly after RMCAo surgery. At T0, the contrast intensity in ROI0 rose sharply and peaked at about 4–5 s and then decreased rapidly (Fig. 1a). Immediately after RMCAo surgery (T1), the intensity in ischemic ROIi (Fig. 1b, red dotted lines) rose slowly and reached a plateau at about 10 s without a sharp peak. The TIC of the normal- or hypo-perfused ROIn at T1 was similar to the TIC of ROI0 in shape but had a lower peak amplitude (Fig. 1b, green box). At T2, the curves of ROIi became very flat (Fig. 1c).
At T1, the parameter TTP in ROIi increased significantly and almost doubled compared to T0 (Fig. 4, left), while in ROIn there was no significant difference between T1 and T2. In “normal” or hypo-perfused areas (Fig. 4, right), the average values of TTP increased slightly (<1 s) from T0 to T1 and T2.
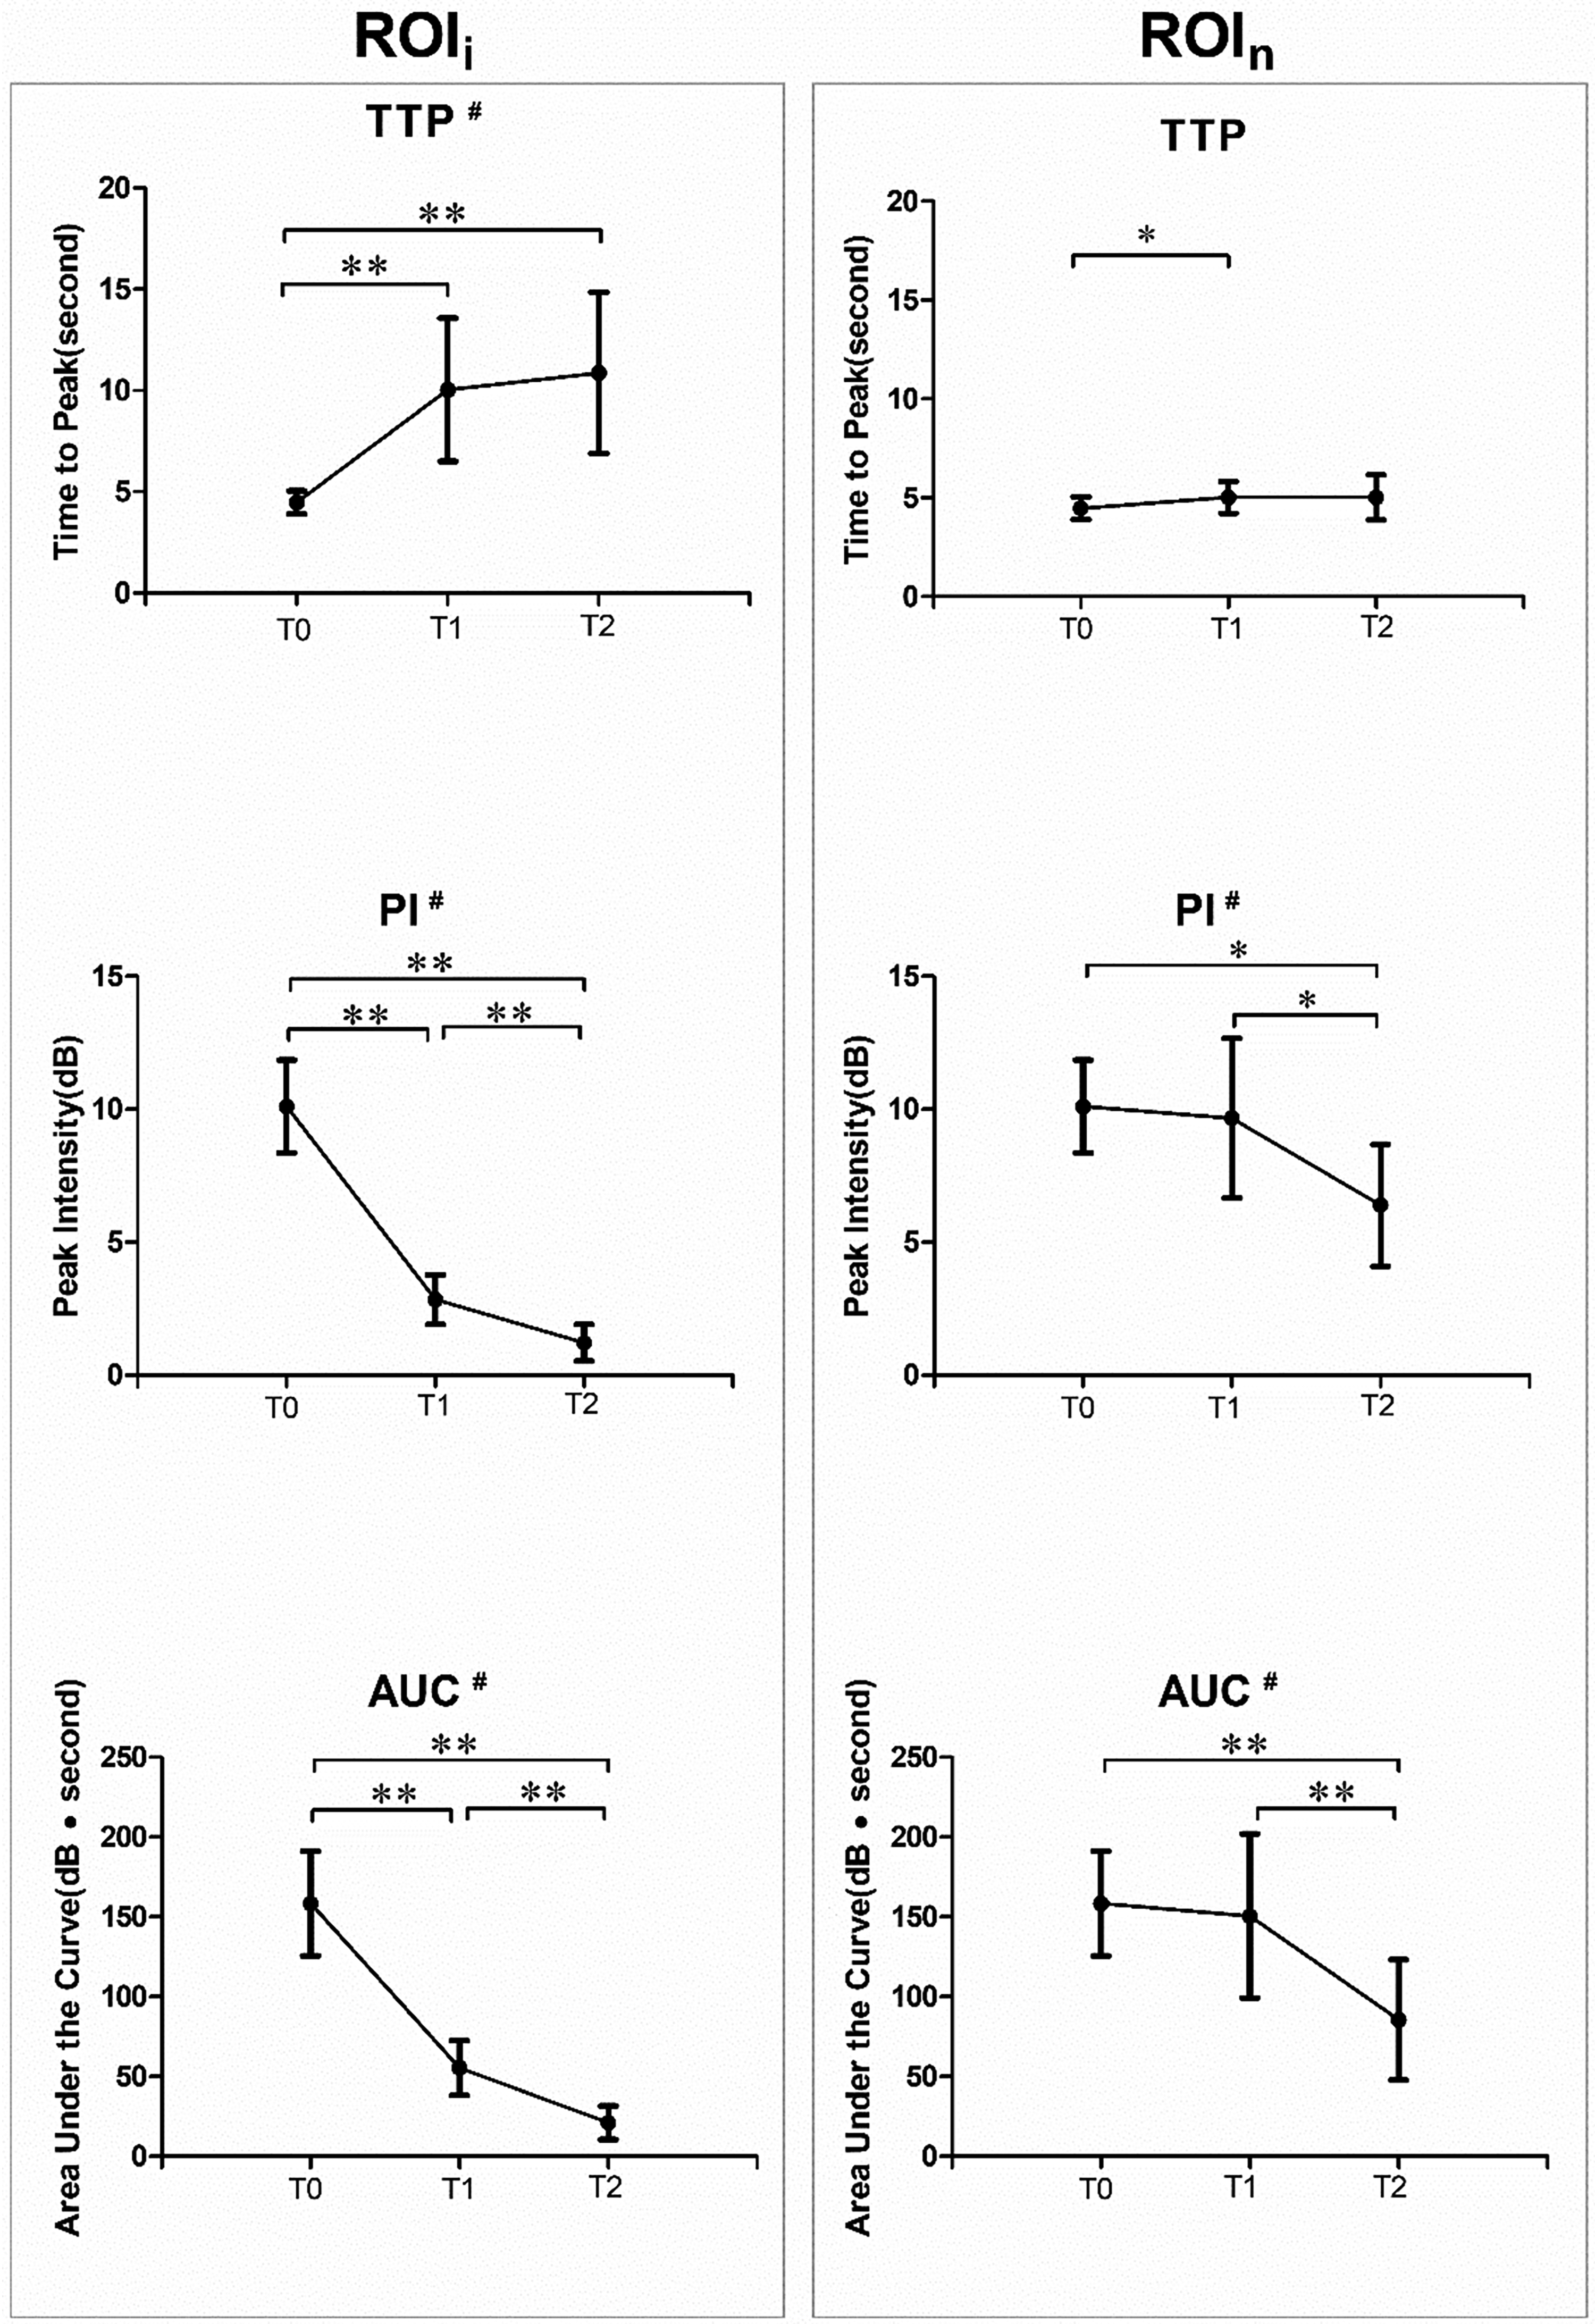
Contrast perfusion parameters (TTP, PI, and AUC) of time-intensity curves obtained at three timepoints (T0, before RMCAo; T1, immediately after RMCAo; and T2, 6 h after permanent RMCAo). Left: the parameters calculated from ischemic areas (ROIi); right: the parameters calculated from normal- or hypo-perfused areas (ROIn). #P < 0.05 using Friedman's two-way analysis; *P < 0.05 and **P < 0.01 using Wilcoxon’s signed-rank test between any two timepoints. AUC, area under the curve; PI, peak intensity; RMCAo, right middle cerebral artery occlusion; TTP, time to peak.
For the ischemic area ROIi, the PI and AUC decreased from T0 to T1 by more than 70% and 60%, respectively, and continued to decrease from T1 to T2 (P = 0.002) (Fig. 4, left). For the “normal” perfusion area ROIn, the changes of PI and AUC were not significant between T0 and T1, but significant between T1 and T2 (P = 0.017 for PI and P = 0.008 for AUC) (Fig. 4, right). The changes of the three perfusion parameters in the ROIn from T1 to T2 indicate a gradual deterioration of “normal-perfused” areas around the ischemic areas.
Lesion volume by TTC staining and correlation with CEUS
The mean percentages of the lesion volume determined by TTC staining at 6 h after RMCAo surgery were 24.0% ± 9.3% (range = 11.1%–39.1%), showing considerable variation (Fig. 5). Spearman's test indicates that the lesion volume is correlated with the delayed manifestations of CEUS with M1, M2, and M3 pooled categorical variables (r2 = 0.612, P = 0.034 for T1 and r2 = 0.759, P = 0.004 for T2). According to Pearson’s correlation analysis, the percentage of lesion volume is related to the perfusion parameters PI and AUC, but not for TTP (Fig. 5).

Pearson’s correlation between the percentage of lesion volume (determined by TTC) and PI, AUC, TTP of ROIi at T1 (left) and T2 (right). AUC, area under the curve; PI, peak intensity; ROIi, ischemic area; TTC, 2, 3, 5-triphenyltetrazolium chloride; TTP, time to peak.
Discussion
Known as non-invasive microcirculation angiography, CEUS can provide richer and more specific diagnostic information than conventional ultrasound and color Doppler ultrasound. Due to the advantages of a simple operation, good safety, and repeatable angiography, many studies have reported the use of CEUS in the detection of foci. In this study, the potential value of CEUS as an experimental neuroimaging tool was evaluated in an intraluminal suture model of stroke. Our results reveal that CEUS can depict relative changes of perfusion in ischemic and adjacent “normal-perfused” tissues (Figs. 1, 3, and 4). We also show that both qualitative (DVP, delayed manifestations) and semi-quantitative (PI and AUC) parameters of contrast enhancement correlate with the lesion volume determined by TTC staining (Fig. 5). During enhancement, the contrast pattern and manifestation between ischemic and normal-perfused areas changed over time, and were different in each rat, which may suggest a different collateral circulation status of the rats (Table 1). DVPs and delayed manifestations may also indicate a reversible local perfusion and heterogeneous progression of ischemia after MCAo.
In acute ischemic stroke, the severity of ischemia and collateral circulation status play a pivotal role in treatment option and clinical outcomes (29,30). When severe acute ischemia occurs, patients with poor collaterals may have large infarction and poor clinical outcomes. In contrast, patients with good collaterals may have less infarction and better outcomes (15,31). This may also apply to animals after the MCAo surgery.
CT angiography (CTA) is the mainstay imaging technique to assess the collateral status and clinical outcomes in patients in the early stages of ischemic stroke (31–33). However, CTA is not widely accessible for small animal studies. Our results (Table 1 and Fig. 5) suggest that CEUS could be a valuable imaging tool for the assessment of ischemic perfusion and collateral compensation in small animals. Lower values of PI and AUC in ischemic areas at T1 may suggest a poor collateral status of the rat, while higher values of PI and AUC may suggest good collaterals after ischemia. If this observation is confirmed, CEUS imaging may help to better stratify animals according to the degree of ischemia and infarction, and thus reduce variation of MCAo experiments. With a size between platelets and red blood cells (2–6 μm), microbubbles are the ideal contrast agent for studying cerebrovascular microcirculation (34). CEUS offers dynamic imaging and provides functional information in real time. This imaging technique has been used to evaluate cerebral perfusion in patients with acute brain injury (35), to monitor revascularization, and to quantify the extent of resection (36,37). Recently, CEUS has been proposed as an alternative to CT or MRI in critically ill neonates and infants in need of bedside imaging (38). Our study confirms that CEUS is a reliable imaging method for evaluating ischemic infarction models.
The present study has some limitations. First, the number of animals was small. A larger sample size is needed to confirm and fully explore the added value of CEUS in MCAo compared to CT and MRI. Second, only one 2D brain section was used for the evaluation of ischemic perfusion, while the scanning of multiple 2D sections would provide much more information on the ischemia and collateral vessels of each animal. CEUS with multiple scan sections and 4D imaging should be performed in future studies. Finally, other imaging methods such as contrast-enhanced CT and MRI are needed to confirm the “dynamic vascular pattern” and “delayed manifestations” observed in this study, and to verify the hypothesis of different collaterals of the rats after MCAo.
In conclusion, we show that CEUS is a useful tool for dynamically assessing cerebral vascular perfusion in living small animals. CEUS imaging has a higher penetration than optical imaging and can visualize the entire brain of small animals to assess brain perfusion in real time. It is more accessible than other neuroimaging techniques, such as CTA, MRI, and PET. Its potential value in animal ischemic models deserves further investigation.
Footnotes
Acknowledgements
Thanks to Mr Yan Feng for his patient help in the theoretical guidance and experimental operation of CEUS.
Authors' contribution
Declaration of conflicting interests
The authors declared no potential conflicts of interest with respect to the research, authorship, and/or publication of this article.
Funding
The authors disclosed receipt of the following financial support for the research, authorship, and/or publication of this article: This work was supported by the Project supported by National Natural Science Foundation of China (general program: 81571131).
Ethical statement
All procedures performed in this study were in accordance with the ethical standards of the Animal Ethical Committee of West China Hospital (No.2016037A).