
Abstract
Background
Cerebral infarction is one of the most common diseases. Diffusion tensor imaging (DTI) has been used to evaluate for crossed cerebellar diaschisis (CCD) to observe the expression of repulsive guidance molecule a (RGMa), the axonal regeneration as well as the effect on neural functional recovery in the middle cerebral artery occlusion (MCAO) rat model.
Purpose
To certify the expression pattern of RGMa in cerebral infarction and the mechanism of CCD to provide a new target for clinical therapy.
Material and Methods
Building the MCAO rat model, every 16 rats were randomly divided into one of six groups. The brain was scanned over the time points above and the rats were sacrificed for immunohistochemistry staining and reverse transcription polymerase chain reaction (RT-PCR) to assay the RGMa expression.
Results
The apparent diffusion coefficient (ADC) and fractional anisotropy (FA) value of MCAO rats declined and peaked at 12 h. The contralateral cerebellum had a lower parameter than the other side. The expression of RGMa kept climbing and achieved the maximum at 48 h (P < 0.05). The value of the protein in the cerebellum was higher (P < 0.05) compared with controls, especially the right cerebellum. The expression of RGMa was negative compared to the parameter of magnetic resonance imaging (MRI) and the axonal regeneration.
Conclusion
The MRI and pathology parameters after MACO had significant differences compared to the controls, as well as the bilateral cerebellum, which provided evidence of CCD. RGMa was related to the axonal regeneration in the injured brain.
Keywords
Introduction
Cerebral infarction is a serious manifestation of ischemic cerebrovascular disease (ICVD), one of the most common diseases affecting the central nervous system. Its high morbidity, mortality, and disability post a significant threat to human health and quality of life. Despite receiving standardized treatment, many patients experience various sequelae due to the disease’s potential to cause functional and pathophysiologic impairments in remote regions (e.g. bilateral cerebellum). This phenomenon is closely linked to the hypothesis of diaschisis, which may play a critical role in nervous function recovery. Therefore, finding effective ways to preserve and restore neural network function is essential for neurological rehabilitation after cerebral infarction.
Peripheral nerves are repairable, but peripheral nerve regeneration is limited after central nervous system (CNS) injury in adult mammals, which may be related to CNS nerve regeneration inhibitory proteins (1). Nogo-A, myelin associated glycoprotein (MAG) and oligodendrocytes myelin glycoprotein (OMGP) are the most representative (2). These proteins bind to the Nogo-66 receptor (NgR), activating the RhoA-Rho kinase signaling pathways, which inhibit the regeneration of nerves, axons, and synapses (3–9). RGMa (10) is a kind of axonal guidance molecule that may act as a novel inhibitor of axonal growth. It regulates the growth, proliferation, and differentiation of nerve cells, as well as the repair and regeneration of injured cells, through RhoA-Rho kinase signaling pathways independent of NgR. Studies have observed upregulation of RGMa after peripheral nerve and brain injuries in animal models, with functional improvements in both peripheral and central nervous systems when RGMa was neutralized using anti-RGMa antibodies (11).
Magnetic resonance diffusion tensor imaging (DTI) characterizes the three-dimensional (3D) distribution of water diffusion, which is highly anisotropic in white matter fibers owing to axonal length. By measuring the degree and direction of water diffusion, including fractional anisotropy (FA), volume (VR), relative anisotropy (RA), and so on, it can indirectly evaluate the integrity of white matter fibers in the brain. The changes of apparent diffusion coefficient (ADC) and FA after cerebral infarction can be shown. It is the only way to describe the white matter fiber in vivo non-invasively. The ipsilateral cerebral diaschisis is confirmed by measuring the FA value of regions of interest (ROIs) using DTI technology in patients with left thalamus infarction.
In this study, DTI technology is used to evaluate neurological rehabilitation after cerebral infarction in a rat model. The role of the RGMa in axon regeneration, synaptic plasticity, and cell apoptosis in the primary lesion and remote regions also are observed. The aim of the present study was to certify the importance of RGMa in cerebral infarction and the mechanism of crossed cerebellar diaschisis (CCD) and to find an effective target to the treatment of cerebral ischemia and CCD.
Material and Methods
Animal and experimental groups
Sprague-Dawley (SD) rats (weight range = 260–320 g; mean weight = 299.2 ± 8.6 g) were provided by the Experimental Animal Center of Henan Province. A total of 96 rats were randomly divided into one of the six groups as follows: control group = MCAO 12-h group, MCAO 24-h group, MCAO 48-h group, MCAO 7-day group, MCAO 10-day group; 16 rats were included in each group. The rats were scanned using magnetic resonance imaging (MRI) over the time points above and were sacrificed for immunohistochemistry staining and reverse transcription polymerase chain reaction (RT-PCR) after MRI scanning to assay the RGMa and RhoA expression in the left cortex, left infarction core, and bilateral cerebellum, respectively. The relationship between MRI parameters and molecular biological marker was analyzed to evaluate the CCD after cerebral infarction.
Throughout the experiments, the observers were blind to the experimental conditions.
Preparation of focal cerebral ischemia model
MCAO was performed by intraluminal nylon filament intrusion, following Longa's method (12). Briefly, after the rats were anesthetized with 3.5% chloral hydrate (350 mg/kg), a longitudinal midline incision was made in the neck; then, the left common carotid artery (CCA), external carotid artery (ECA), and internal carotid artery (ICA) were exposed. Superior thyroid and occipital arteries were cut off from ECA with an electric cautery, and the extremity of ECA was ligated with sutures. The branches between ECA and ICA were also coagulated. To prevent bleeding, microaneurysm clips were placed at both ICA and ECA. After making an incision in the distal portion of the ECA, a nylon filament suture with a paraffin wax-coated tip was inserted at the head of the ICA. To prevent bleeding, the ECA was ligated with a thread before removing the microaneurysm clip from the ICA. The suture in the ICA was advanced approximately 18–20 mm beyond the carotid bifurcation until slight resistance was felt.
Animals in the sham-operated group were treated similarly, except that the nylon filament was not advanced to the origin of the middle cerebral artery (MCA). Animals in other groups were induced to focal cerebral ischemia model according to the above procedure.
MRI scan
A Signa HDxt 3.0T MRI scanner (GE, Madison, WI, USA) and an eight-channel coil were used for scanning the rats. The parameters were as follows (Table 1): postprocessing and parameter statistics were dealt with in postprocessing workstation (GE, Madison, WI, USA). The DTI image was processed using Functool 5.4.07 software, with ROIs placed on the infarction core and bilateral cerebellum in both ADC and FA images.
Parameters of rat brain scan using magnetic resonance.
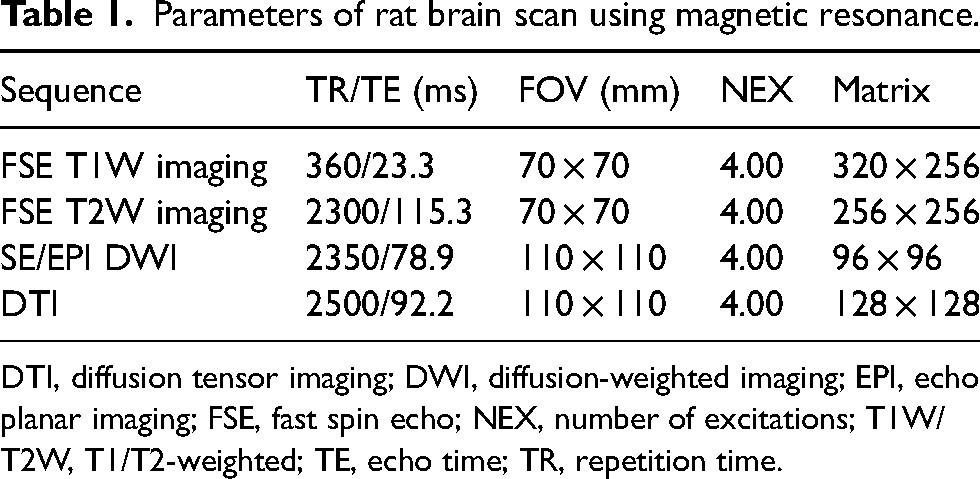
DTI, diffusion tensor imaging; DWI, diffusion-weighted imaging; EPI, echo planar imaging; FSE, fast spin echo; NEX, number of excitations; T1W/T2W, T1/T2-weighted; TE, echo time; TR, repetition time.
Sample collection
Animals were sacrificed after the MRI scan. After the brains were removed, the left cortex, left infarction core, and bilateral cerebellum were dissected and conserved in liquid nitrogen for detecting the expression of RGMa and RhoA mRNA and protein. To perform immunohistochemistry staining, other animals were perfused transcardially with 200 mL 0.9% saline followed by a perfusion with 250 mL 0.1 M phosphate buffer containing 4% paraformaldehyde. The brains were unloaded and post-fixed in 4% paraformaldehyde for 24 h, then imbedded in paraffin, coronally sectioned approximately 6–8μm.
RT-PCR analysis
RNA extraction and reverse transcription
Total RNA from the cortex, infarction core, and bilateral cerebellum was extracted in Trizol reagent (Takara, Bio-Technology) according to the manufacturer's instructions, and then dissolved in RNase-free water. For each sample, the integrity of RNA was verified by the detection of 18S and 28S bands after agarose–formaldehyde gel electrophoresis. The purity of total RNA was confirmed by optical density measurements at 260 and 280 nm. All samples of RNA were stored at −80°C before reverse transcription. Total RNA was reverse transcribed (RT) into cDNA with reverse transcriptase kit (Takara, Bio-Technology) according to the manufacturer's instructions. cDNA samples were stored at −20°C.
RT-PCR
RT-PCR was carried out to determine the levels of RGMa mRNA in each group. Primers were designed using the Prime Premier software according to Gene Bank sequences (NM_001107524.1 for RGMa). The primer sequences are sense 5′-GCTGGATGGATGGGTATGGG-3′, antisense 5′-GCCGCAGTGAGTGTAGTTGG-3′for RGMa (product size 228 bp) and sense 5-CAAGGTCATCCATGACAACTTTG-3′, antisense 5′-GTCCACCACCCTGTTGCTGTAG −3′for GAPDH (product size 496 bp). Each sample of PCR amplification mixture (20 μL of final volume) containing 2×PCR Mix 10 μL, cDNA 2 μL, sense 1 μL, antisense 1 μL, and DEPC H2O 6 μL. The samples were amplified at 94°C for 5 min (1 cycle), followed by 33 cycles of 94°C for 30 s, 60°C for 30 s, 72°C for 45 s, and a final elongation at 72°C for 5 min.
Gel electrophoresis
For each sample, the amplification product was electrophoresed on a 1.5% agarose gel (E-Gel; Invitrogen, Carlsbad, CA, USA). The gels were photographed under UV trans-illumination with the AlphaImager system and analyzed using quantity one software (Bio-Rad).
Immunohistochemistry
After paraffin sections were deparaffinated and rehydrated, antigen retrieval was performed in sodium citrate buffer heated to 92–98°C for 20 min. Endogenous peroxidase was inactivated by incubation with 3% hydrogen peroxide for 20 min. Non-specific binding sites were blocked by 10% normal goat serum for 30 min. Sections were incubated with primary antibody in PBS at 4°C overnight and the following antibodies were used: rabbit anti-RGMa (1:100, Abcam), anti-RhoA (1:100, Abcam), or mouse anti-neurofilament 200 (NF-200, 1:100, Abcam). Sections were rinsed in PBS and then incubated with goat anti-rabbit or goat anti-mouse IgG for 30 min followed by avidin–peroxidase complex solution containing avidinperoxidase conjugate for 30 min. Peroxide activity was developed by incubating the sections in a solution containing 50% 3,3_-diaminobenzidine (DAB) and 3% hydrogen peroxide in 0.1 M PBS. The sections were then dehydrated, cleared, and coverslipped. All procedures were similar except that PBS instead of primary antibody was used in negative control. For quantity analysis immunohistochemistry, RGMa expression was categorized into three groups: focal membrane; partial membrane; and circumferential membrane. The staining intensity was categorized into three groups: light yellow; deep yellow; and brown. For each case, a final score was counted by multiplying the expression and the intensity score. Similarly, the percentage of RhoA and NF-200 immunopositive cells was also categorized into three groups: group 1 = 1%–10%; group 2 = 11%–50%; and group 3 = >50%. The staining intensity was ranked into three groups: group 1 = light yellow; group 2 = deep yellow; and group 3 = brown. Each immunohistochemical NF-200 analysis was defined as a score which combined the ratio and intensity values.
TdT-mediated dUTP nick-end labeling (TUNEL)
The paraffin-coated brain tissue sections were heated at 65°C until the paraffin dissolved, dimethyl benzene dewaxing, hydration to distilled water and put into xylene Ⅰ, Ⅱ, Ⅲ for 10 min, anhydrous ethanol, 95% ethanol, 85% ethanol, 75% ethanol solution for 3 min. It was incubated for 10 min in the methanol solution of 3% hydrogen peroxide at room temperature, then with 10–20 μg/mL proteinase K incubated for 15 min at 37°C. TUNEL reaction mixture (25 μL) was added and incubated for 40 min at 37°C in 0.3% methanol solution for 20 min. The PBS method was used for closure with 20% sheep serum for 20 min, followed by the addition of POD for 30 min at 37°C. DAB chromogenic was used for 10 min, followed by hematoxylin and eosin (H&E) staining for 2 min, differentiation with 1% hydrochloric acid alcohol for 5 s, dehydration, and clearing.
The preparation of the positive control sample was as follows: after treating samples with proteinase K, 100 μL of DNase I reaction solution (200 U DNase I, 40 mM Tris-HCL at pH 7.9, 10 mM NaCl, 6 mM MgCl2, and 6 mM CaCl2) was added. The remaining steps were carried out as previously described.
The preparation of the negative control sample was as follows: the reagent 2 tag solution was used instead of TUNEL reaction mixture. The remaining steps were carried out as previously described.
Evaluation of TUNEL positive cells showed that the nuclei were brown. The cells retained their original form after H&E staining.
The counting of positive cells consisted of randomly selecting five fields under high magnification on the same section, and the mean number of positive cells was calculated.
Transmission electron microscope
Animals were sacrificed and their brains removed after perfusion with 0.25% glutaraldehyde + 4% paraformaldehyde fixed fluid infusion (10% paraformaldehyde 200 mL, 250 mL 0.2 mol/L phosphate buffer, 25% glutaraldehyde solution 5 mL, double evaporate water to add 500 mL). The brains were immersed in 2.5% glutaraldehyde + 2.5% paraformaldehyde fixed liquid (10% paraformaldehyde 20 mL and 50 mL 0.2 mol/L phosphate buffer, 25% glutaraldehyde solution 10 mL, double evaporate water to add 100 mL) and were quickly drawn into small pieces of approximately 1 mm3, and then put into 2.5% glutaraldehyde + 2% paraformaldehyde fixed liquid and stored at 4°C. The experiment was conducted at the Diagnostic Center of Electron Microscopy, Xìan Jiaotong University.
Statistical analysis
All data were presented as means ± standard deviation (SD). Statistical differences among different groups were assessed using one-way analysis of variance (ANOVA). The correlation between imaging and pathological analysis was calculated using Spearman’s correlation analysis. A P value <0.05 was considered statistically significant. The statistical analysis was performed using SPSS 16.0 for Windows.
Results
Imaging feature
The infarction area is clearly characterized by a high signal on DWI. Over time, the hyperintense area of the infarction gradually expanded, eventually involving the nearby cortex on the infarcted side (Fig. 1).
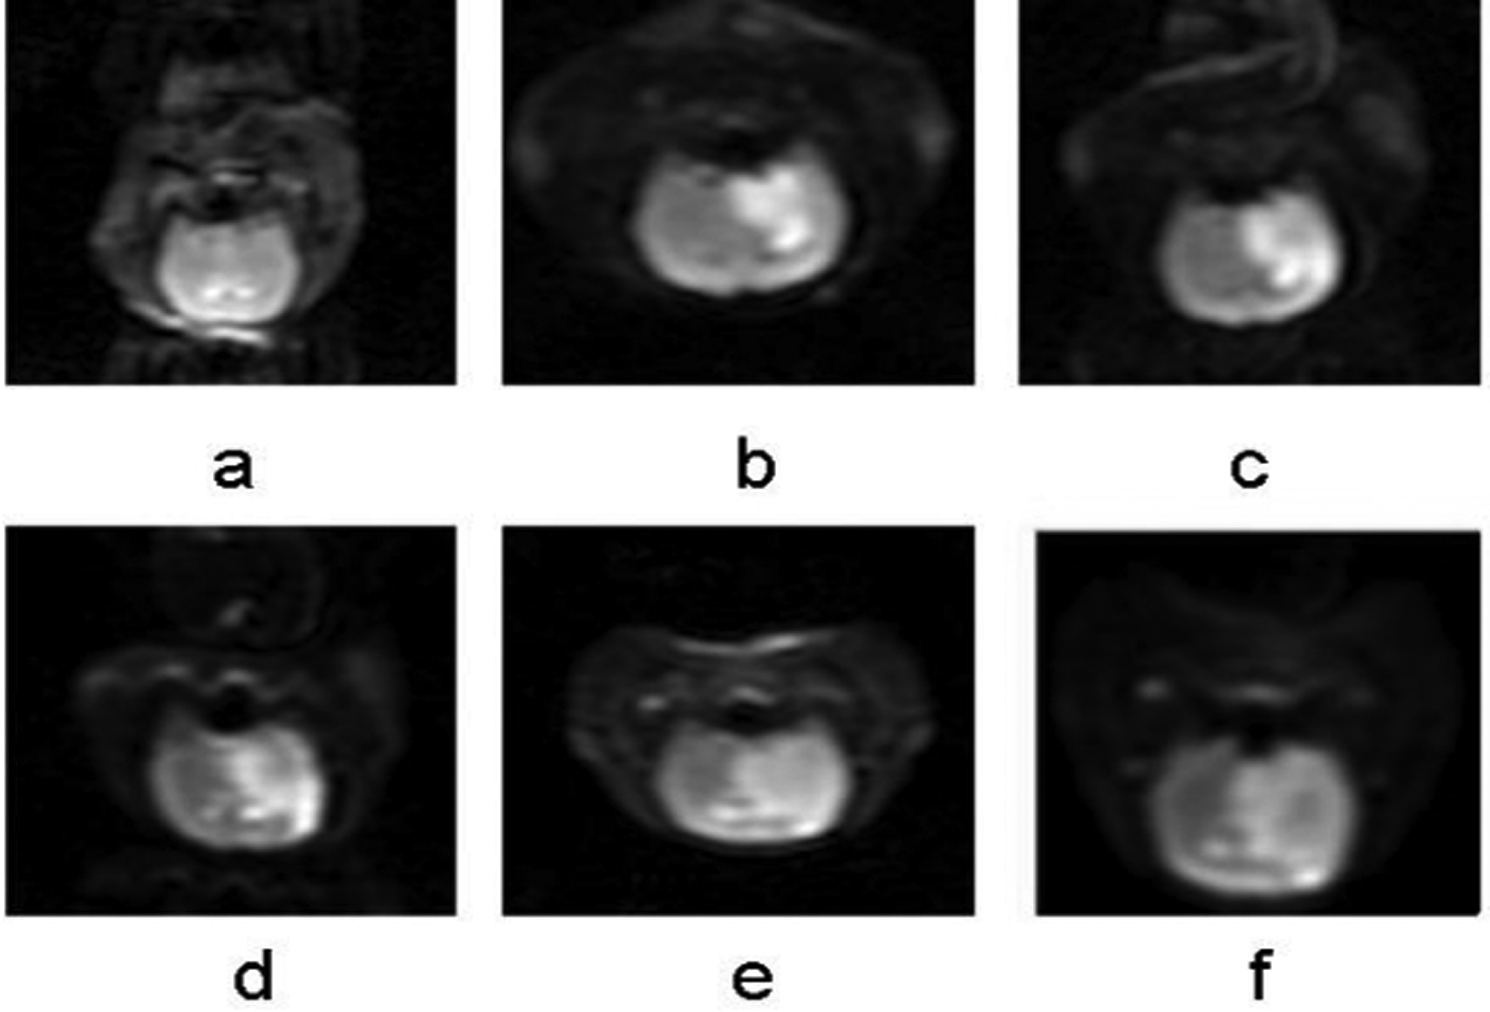
(a–f) DWI images of cerebral hemisphere respectively of controls (a) and 12 h, 24 h, 48 h, 7 days, and 10 days after cerebral infarction. With prolonged postoperative cerebral infarction, the high signal area of cerebral infarction core on the left basal ganglia on DWI figure gradually expanded, and the adjacent ipsilateral cortex was involved gradually over time, eventually extended to the entire left hemisphere. The center of the infarct signals became weaker gradually after 12 h. DWI, diffusion-weighted imaging.
ADC value
Compared with the control group, the ADC values in the infarction core and bilateral cerebellum of the 12-h, 24-h, 48-h, 7-day, and 10-day groups significantly decreased in a progressive manner (P < 0.05). The 12-h group had the lowest mean ADC value of 3.593 ± 0.417 in the left basal ganglia, 4.981 ± 0.914 in the right cerebellum, and 5.538 ± 0.922 in the left cerebellum. The ADC value picked up slightly over time in each group after cerebral infarction, but was still significantly lower than in the control group. The ADC values in the bilateral cerebellum showed a similar trend to those in the supratentorial brain tissue (P < 0.05), with the right cerebellum showing lower values compared to the left cerebellum (Table 2).
ADC values of cerebral infarction core region and bilateral cerebellum in each group (×10−4/mm2, mean ± SD, n = 72).
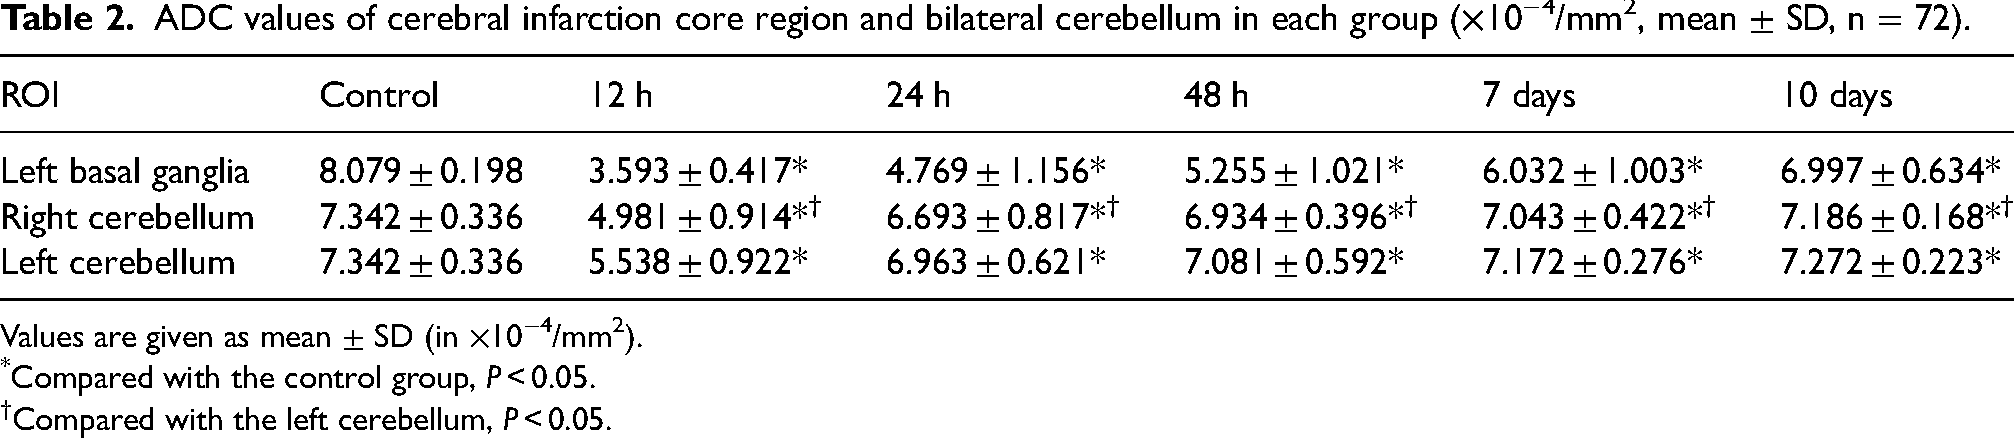
Values are given as mean ± SD (in ×10−4/mm2).
*Compared with the control group, P < 0.05.
Compared with the left cerebellum, P < 0.05.
FA value
Compared with control group, the FA value in the infarction core and bilateral cerebellum of the 12-h, 24-h, 48-h, 7-day, and 10-day groups significantly decreased in a progressive manner (P < 0.05). The 12-h group had the lowest mean FA value of 0.196 ± 0.018 in the left basal ganglia, 0.228 ± 0.073 in the right cerebellum, and 0.244 ± 0.033 in the left cerebellum. The FA values picked up slightly over time in each group after cerebral infarction, but were still significantly lower in the control group. The FA values in the bilateral cerebellum showed a similar trend to those in the supratentorial brain tissue (P < 0.05), with the right cerebellum showing lower values than the left cerebellum (Table 3).
FA values of cerebral infarction core region and bilateral cerebellum in each group (mean ± SD, n = 72).
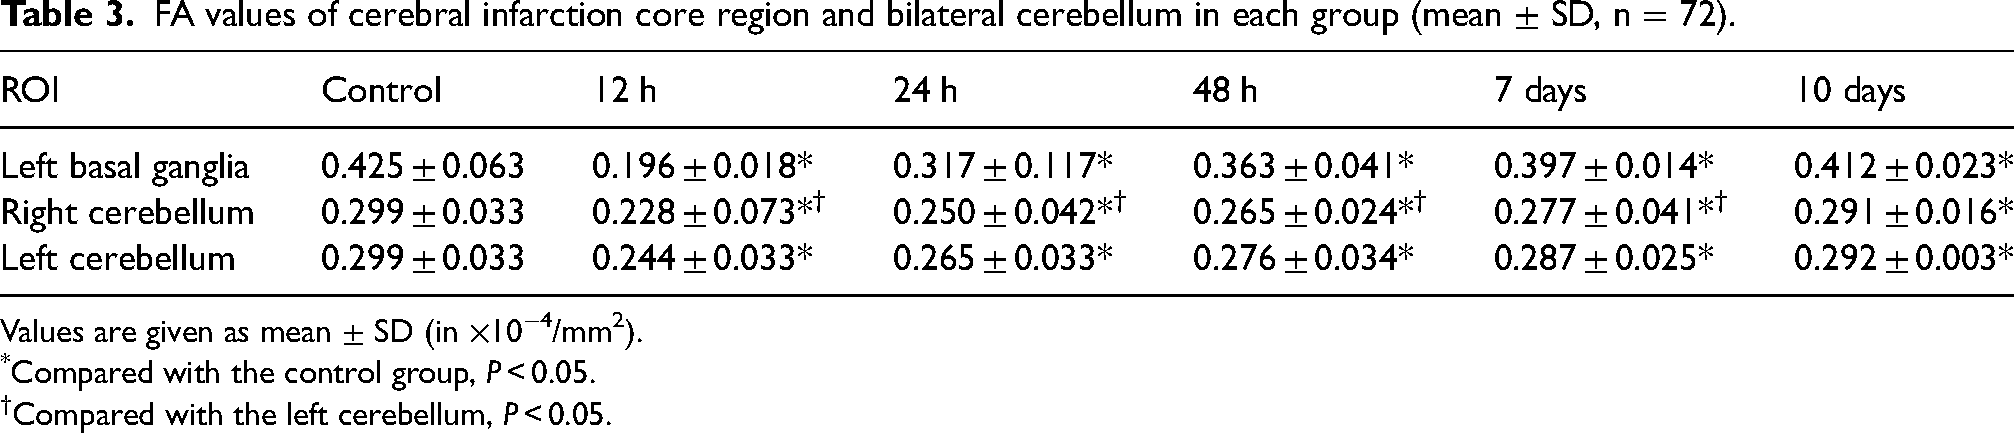
Values are given as mean ± SD (in ×10−4/mm2).
*Compared with the control group, P < 0.05.
Compared with the left cerebellum, P < 0.05.
RT-PCR analysis
The expression of RGMa mRNA
The expression of RGMa mRNA was detected as early as 12 h postoperatively, peaking at 48 h. The expression levels remained higher over time compared to the control group (P < 0.05). Similar trends were observed in the bilateral cerebellum, especially on the right side (P < 0.05). (Table 4, Fig. 2).
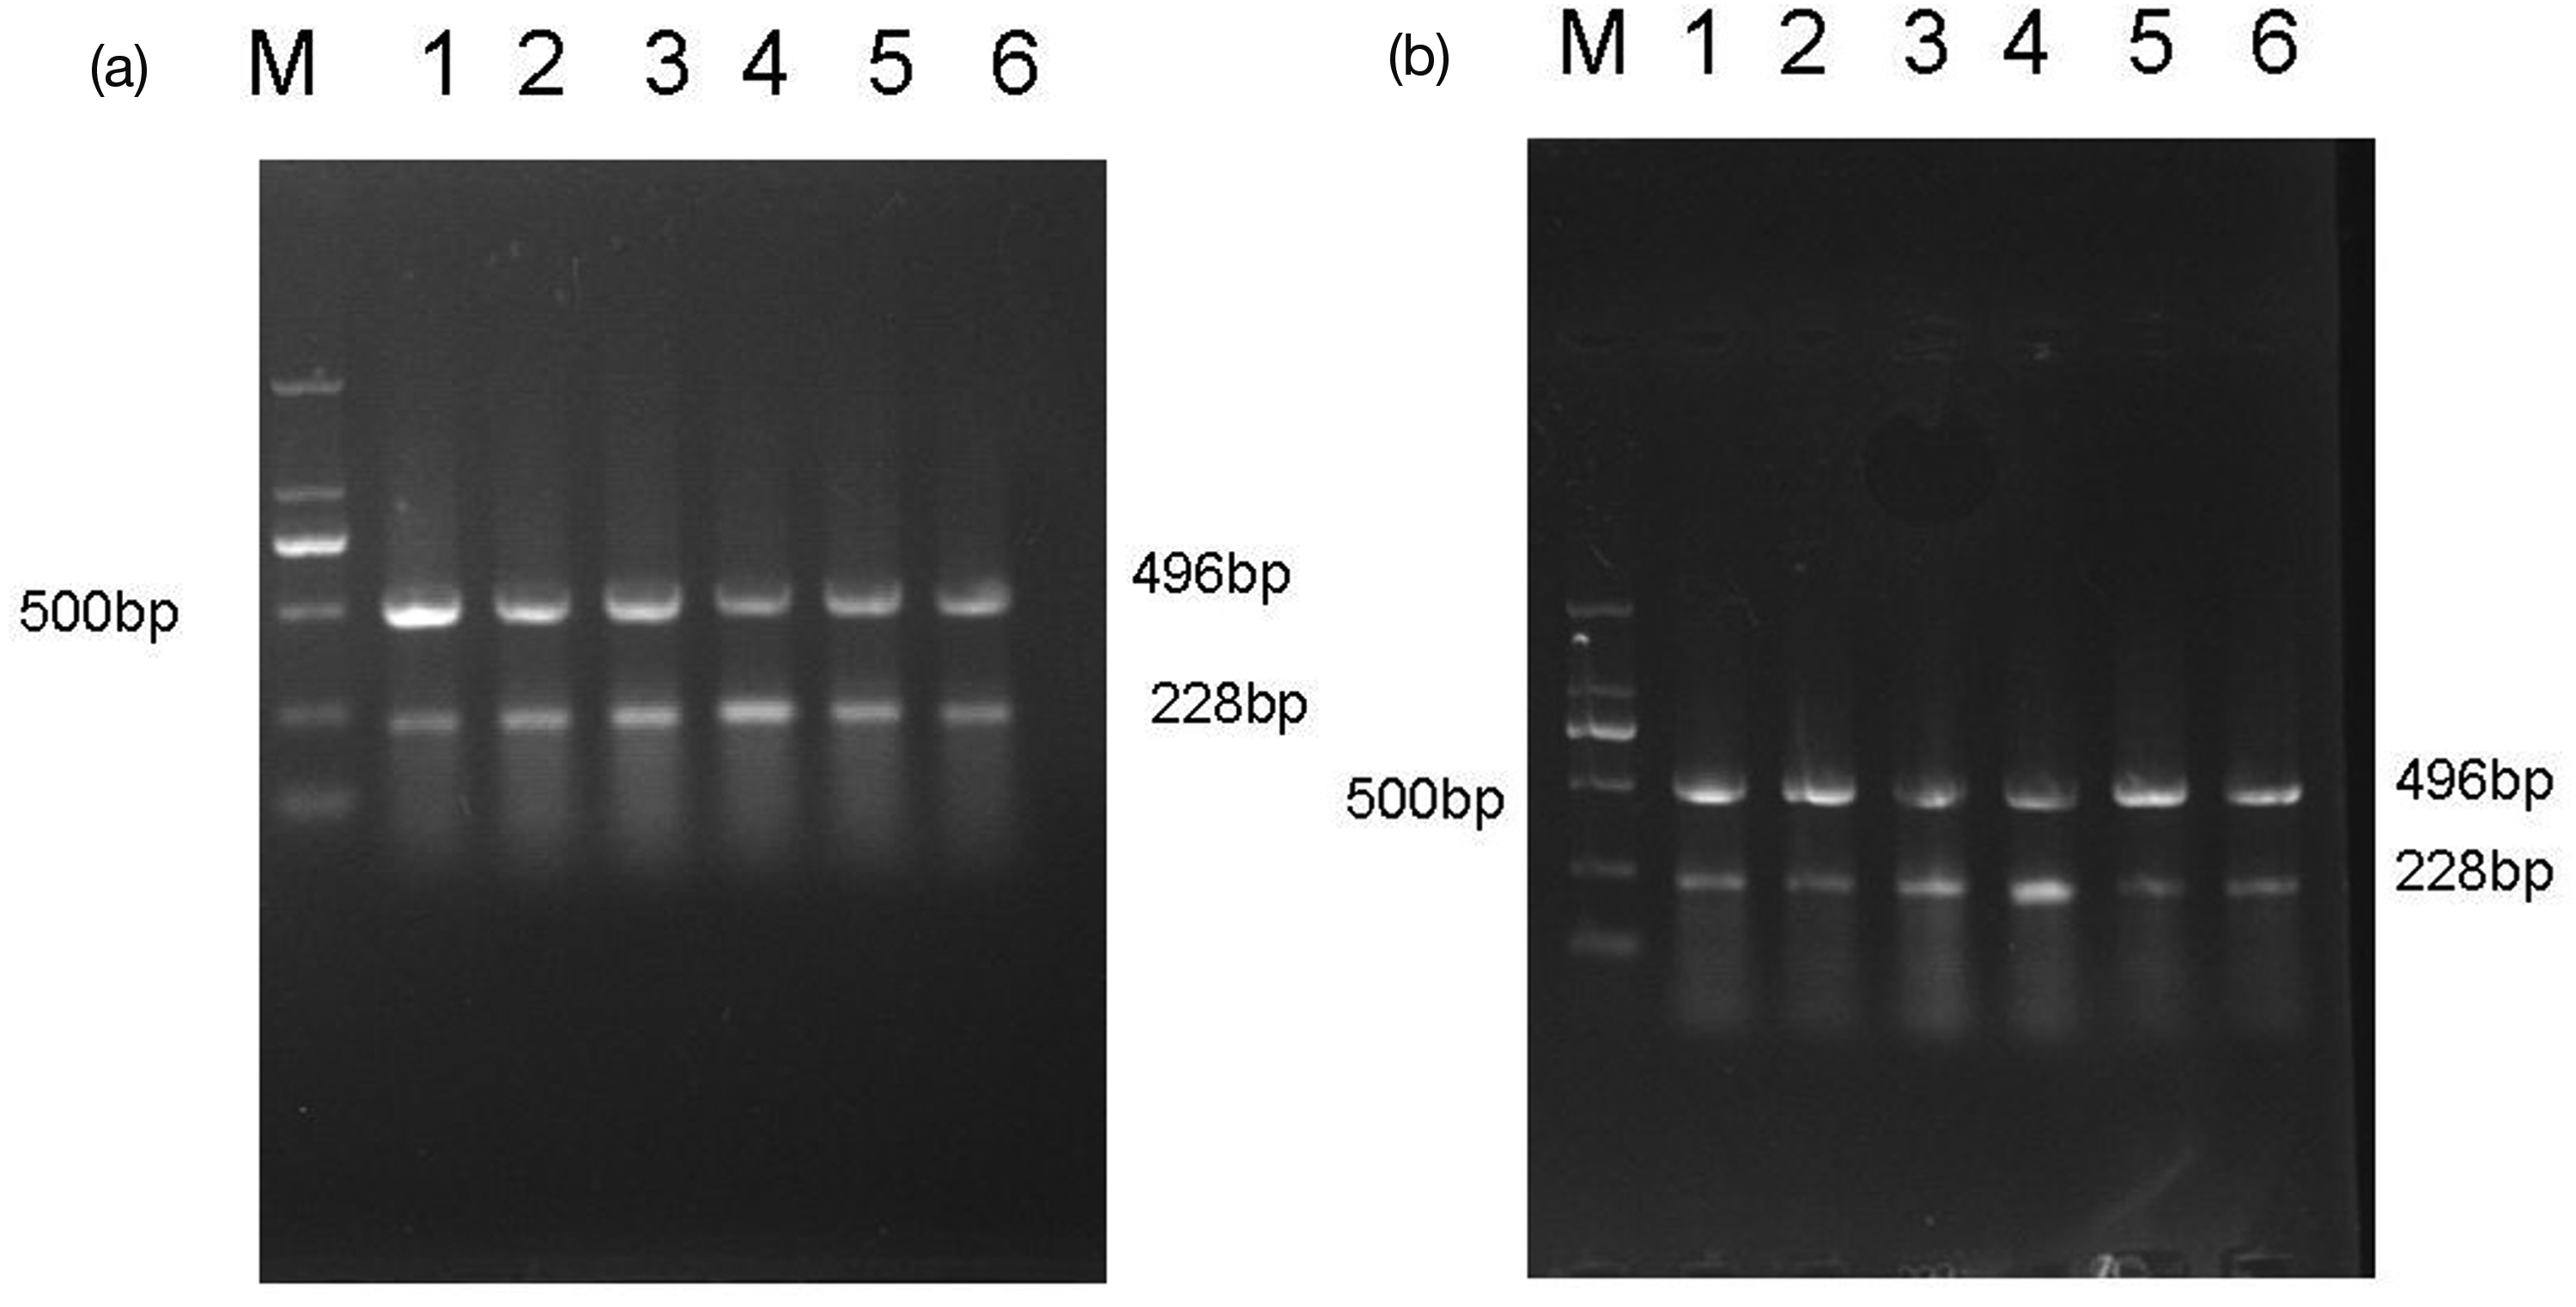
Expression of RGMa mRNA in (a) the left basal ganglia and (b) right cerebellum. Representative bands for every group as well as maker are shown (band M is maker, and bands 1–6 were the control group and 12-h, 24-h, 48-h, 7-day, and 10-day groups after cerebral infarction, respectively). 496 bp represented GAPDH and 228 bp represented RGMa. The highest level of expression was observed at 48 h group.
RGMa mRNA gray value of brain infarction core region and bilateral cerebellum in each group (mean ± SD, n = 72).
Values are given as mean ± SD (in ×10−4/mm2).
*Compared with the control group, P < 0.05.
Compared with the left cerebellum, P < 0.05.
Immunohistochemistry
The expression of RGMa protein
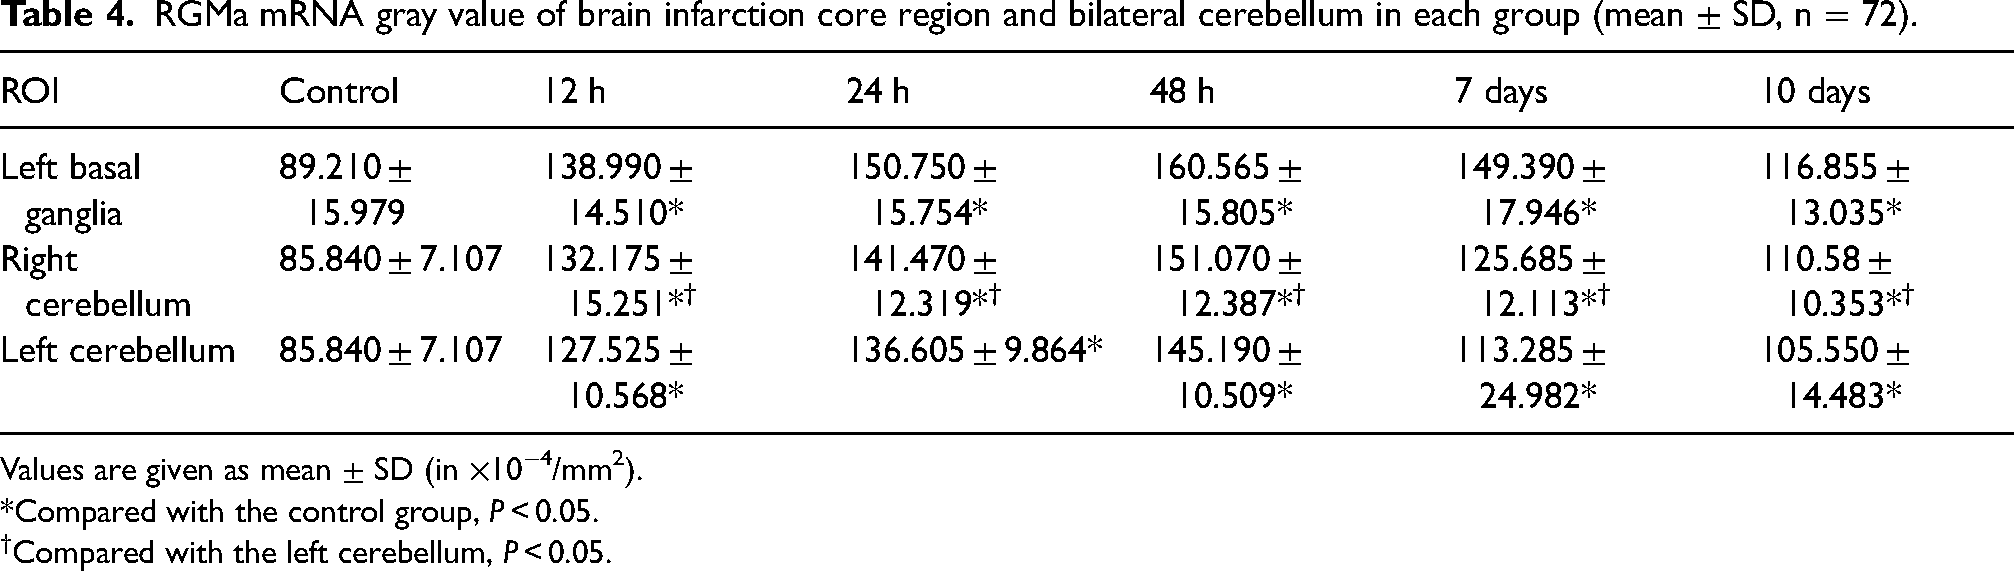
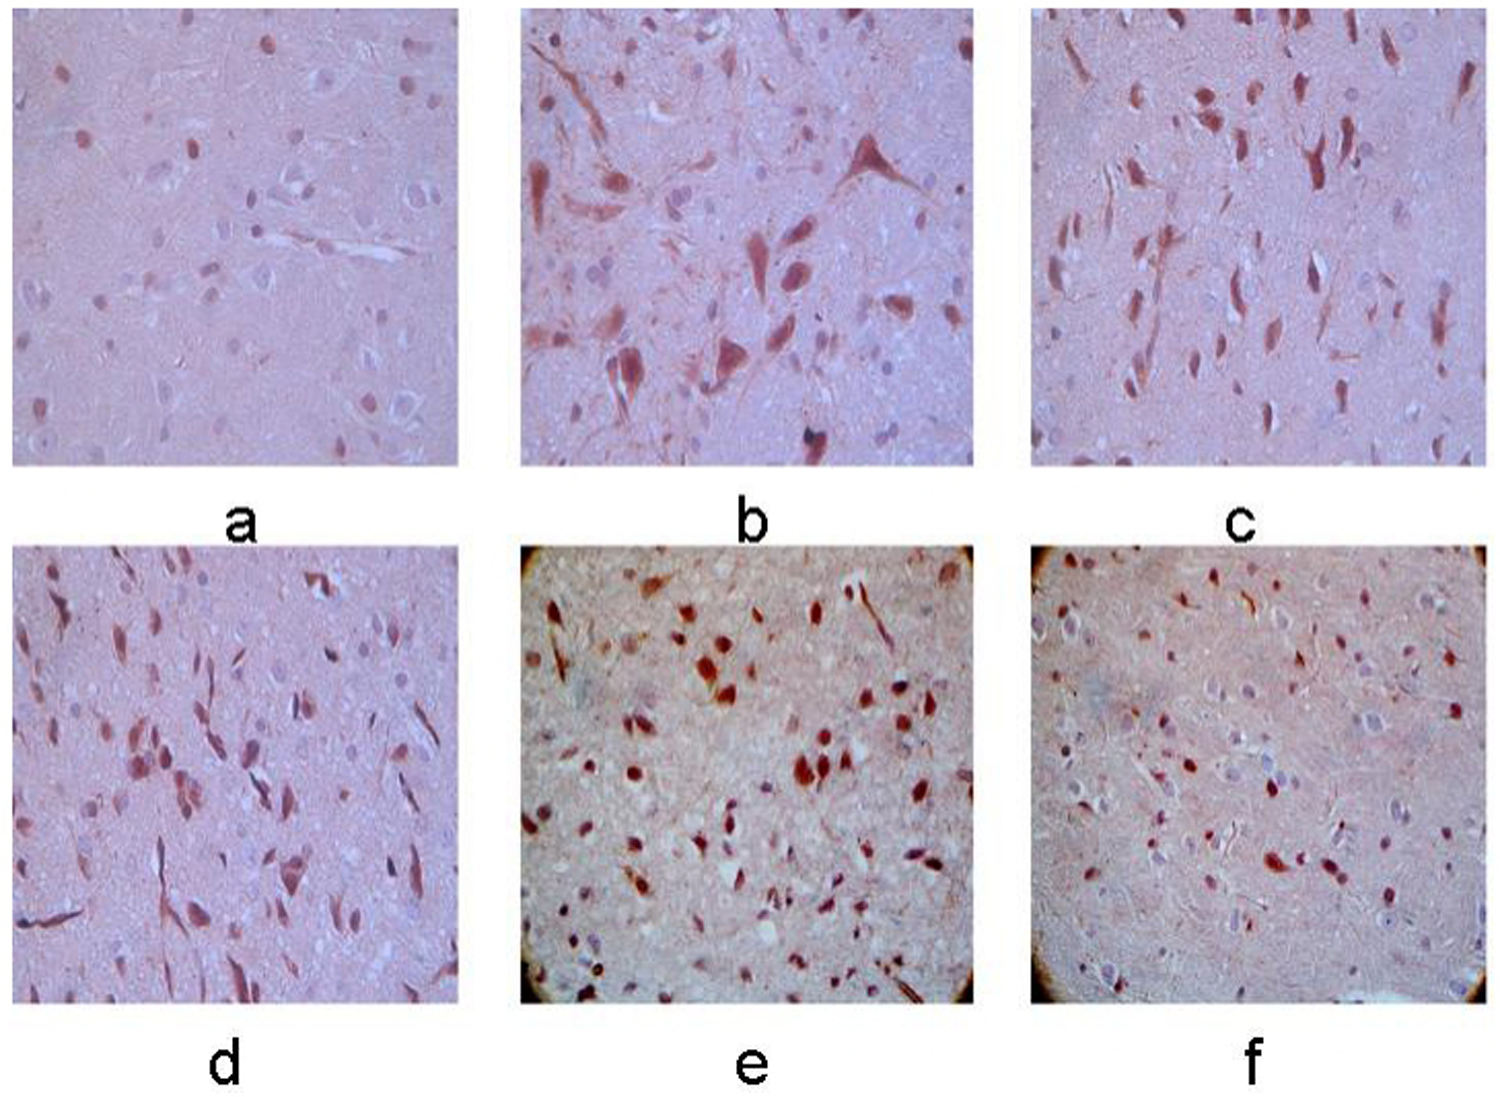
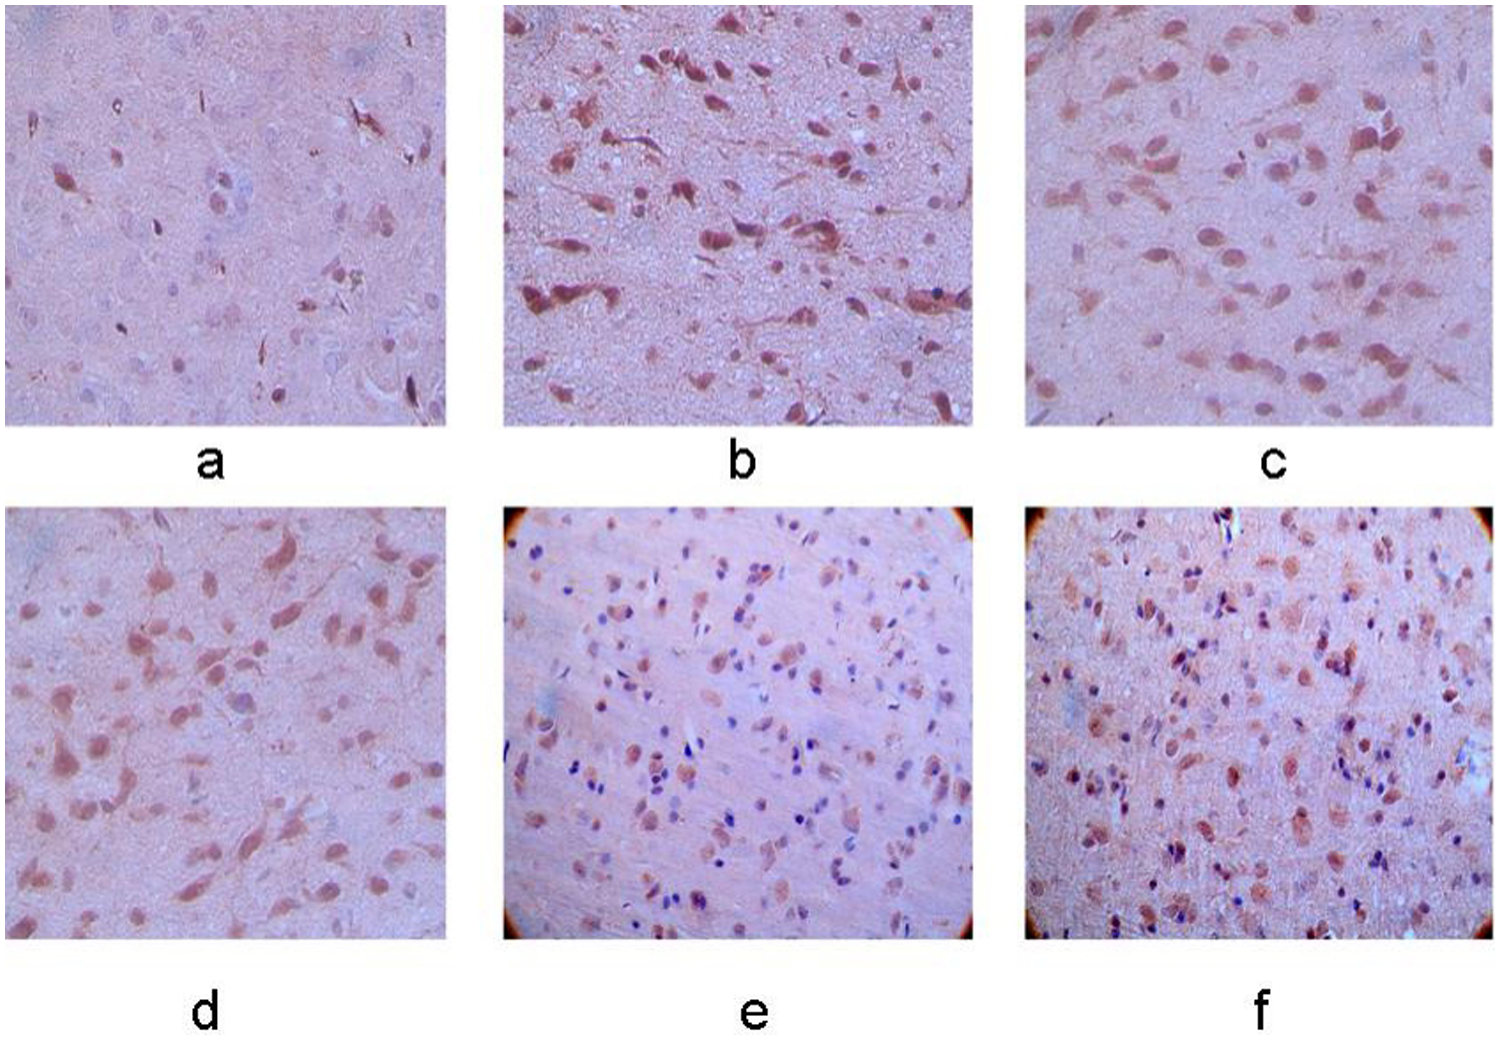
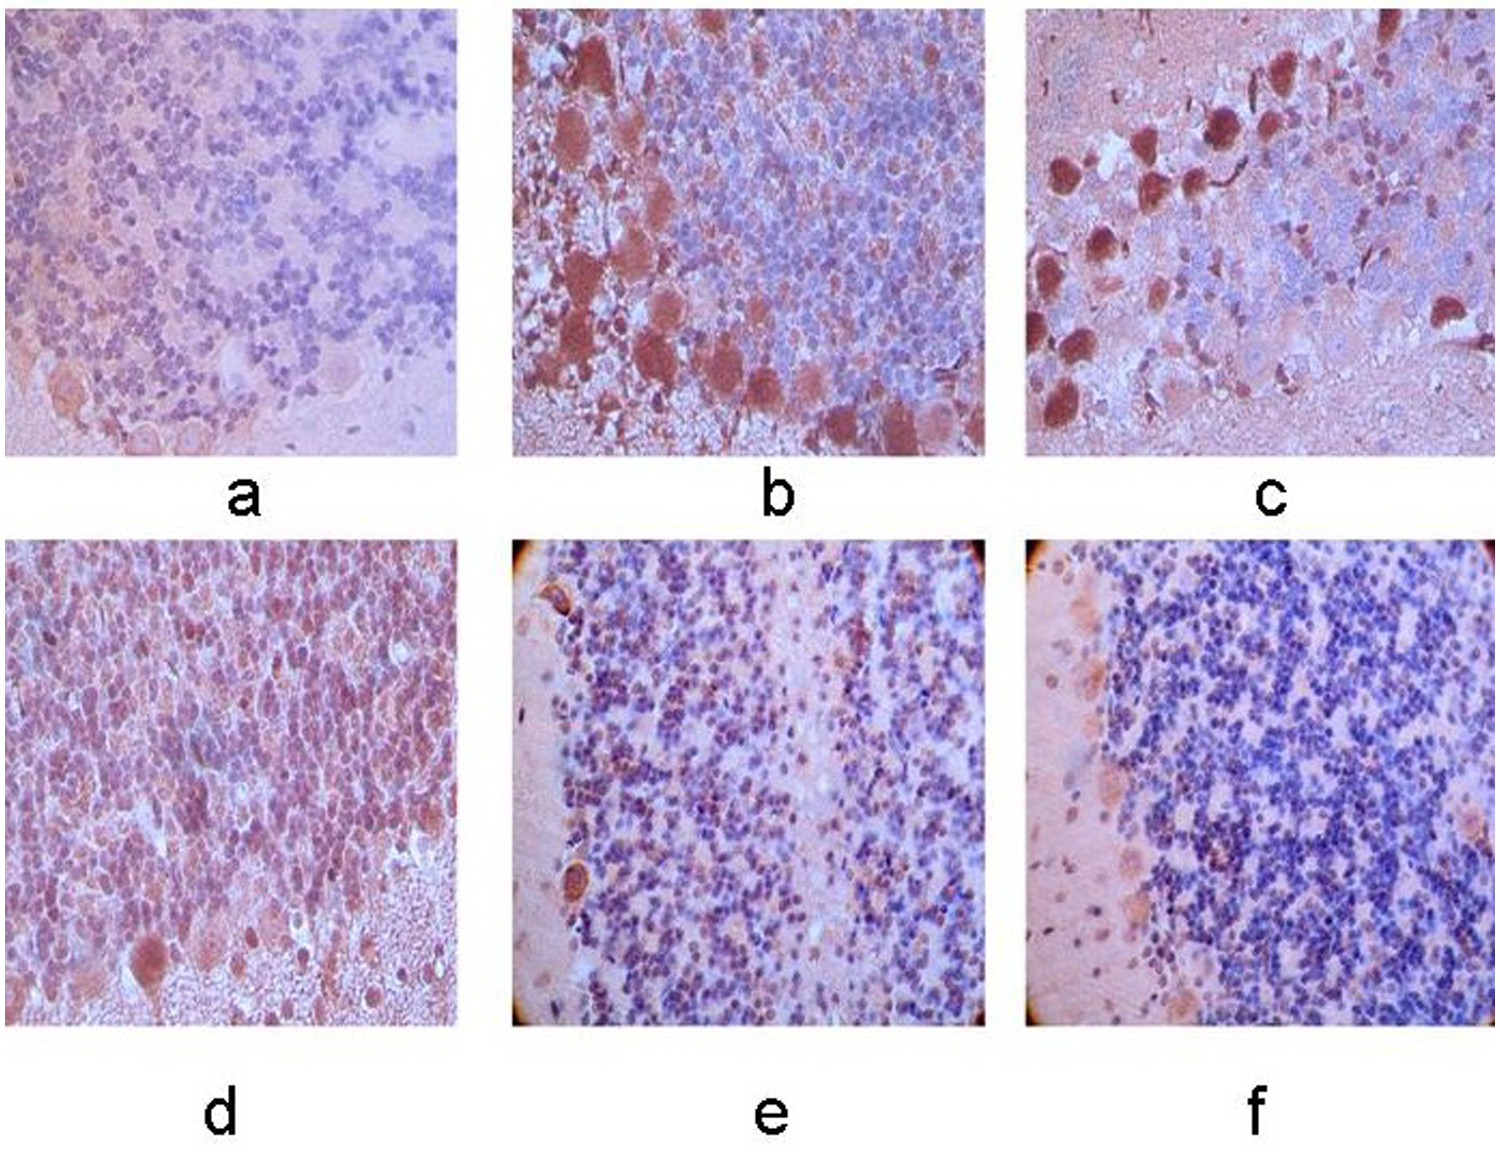
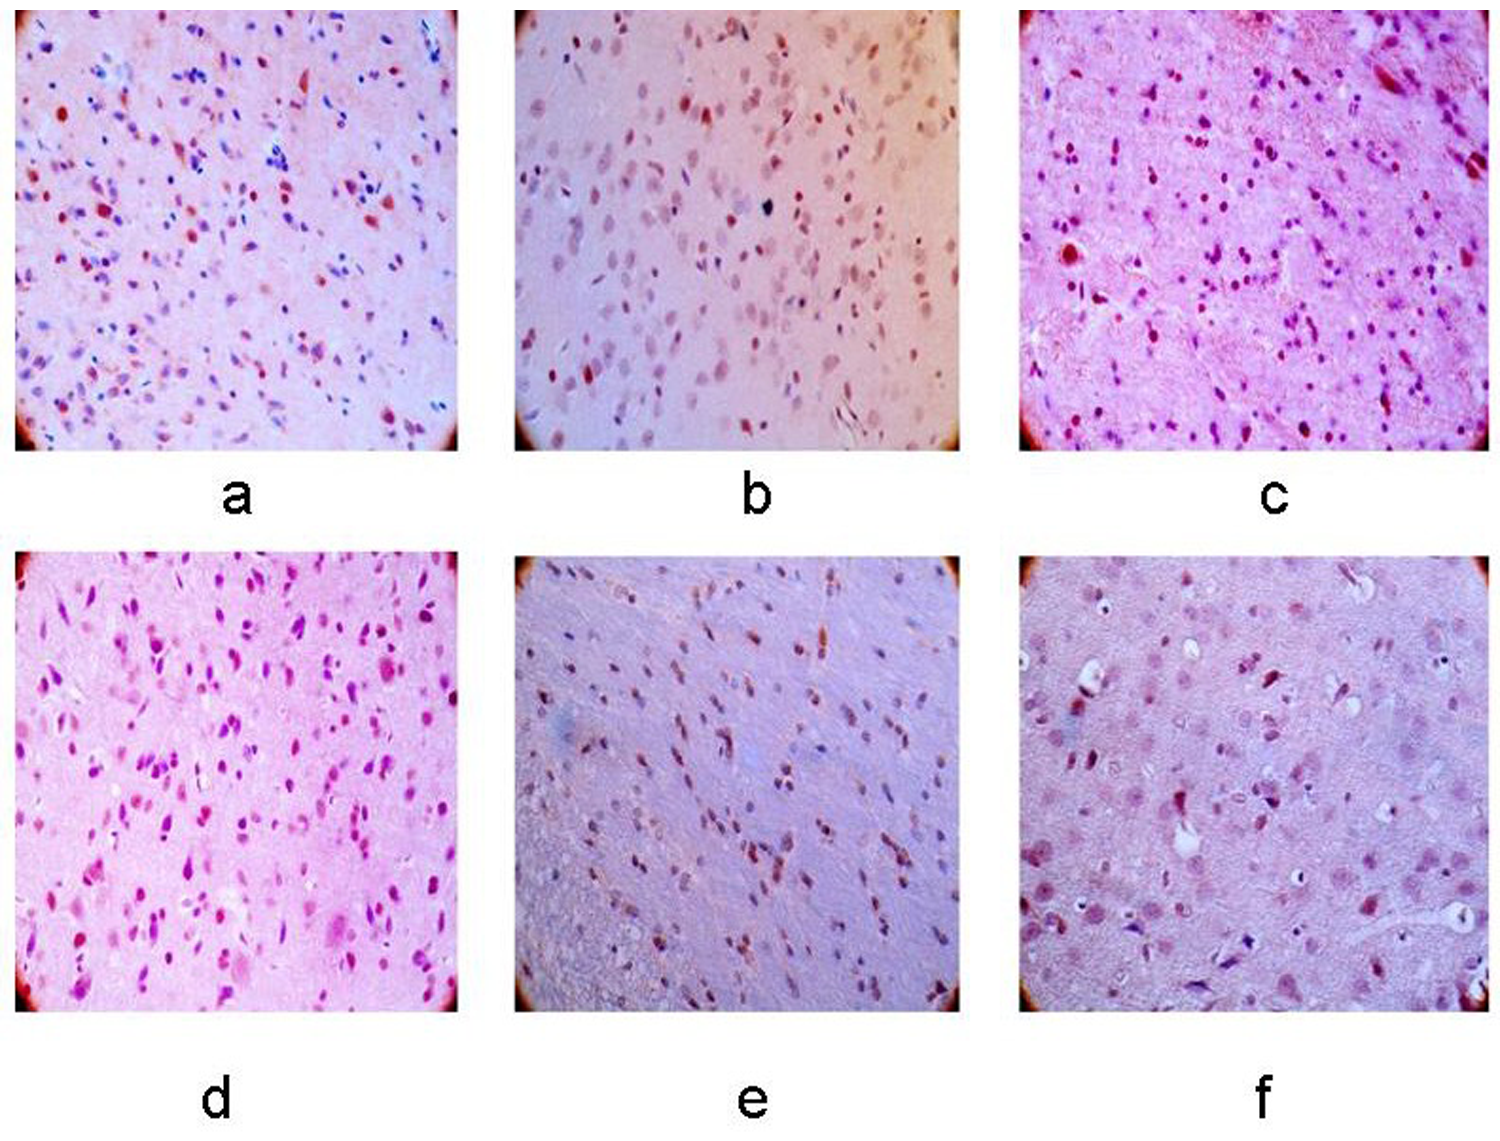
The RGMa immunoreactive cells exhibited tan staining in both the membrane and cytoplasm. Compared with control group, the RGMa immunoreactive cells were first observed at 12 h after ischemia, with a significant increase in RGMAa protein levels at 48 h after ischemia. After this peak, a slight decrease in RGMa expression was observed, but the levels remained higher than in the control group (P < 0.05). The expression of RGMa protein in the bilateral cerebellum was significantly elevated compared to the control group, with a stronger expression observed on the right side compared to the left (P < 0.05). (Figs. 3 and 4).
Expression of RGMa protein in left basal ganglia. (a–f) Control group, 12-h, 24-h, 48-h, 7-day, and 10-day groups after MCAO operation. The membrane and cytoplasm of RGMa immunoreactive cells were tan in color and the expression was increasingly stronger with the extending of ischemia (×400).
Expression of RGMa protein in the right cerebellum. (a–f) Control group, 12-h, 24-h, 48-h, 7-day, and 10-day groups after MCAO operation. The membrane and cytoplasm of RGMa immunoreactive cells were tan and the expression was increasingly stronger with the extending of ischemia. A higher level of positive cells was observed in the right cerebellum compared with the left side (×400).
The expression of RhoA protein
The RhoA immunoreactive cells were first observed at 12 h after ischemia, with a significant increase in RhoA protein levels at 48 h after ischemia. After this peak, a slight decrease was noted, but the levels of RhoA protein remained higher than those in the control group (P < 0.05). The expression of RhoA protein in the bilateral cerebellum was significantly elevated compared to the controls, with higher expression observed in the right cerebellum compared to the left (P < 0.05) (Fig. 5 and 6).
Expression of RhoA protein in the left basal ganglia. (a–f) Control group, 12-h, 24-h, 48-h, 7-day, and 10-day groups after MCAO operation. The membrane and cytoplasm of RhoA immunoreactive cells were tan and the expression was increasingly stronger with the extending of ischemia (×400).
Expression of RhoA protein in the right cerebellum. (a–f) Control group, 12-h, 24-h, 48-h, 7-day, and 10-day groups after MCAO operation. The membrane and cytoplasm of RhoA immunoreactive cells were tan and the expression was increasingly stronger with the extending of ischemia. A higher level of positive cells was observed in right cerebellum compared with the left side (×400).
Axonal growth presented by NF-200 immunohistochemistry
Axonal regeneration was assessed using NF-200 immunostaining (Figs. 7 and 8). In the control group, a large number of NF-200 immunoreactive cells were observed, with neurons maintaining their normal form and NF-200 positive fibers distributed evenly, orderly, and clearly. In contrast, the other groups after MCAO showed a significant reduction in NF-200 immunoreactive cells, particularly in the left cortex, left basal ganglia, and bilateral cerebellum. This decrease became more pronounced over time, with the 24-h group showing the most severe damage, characterized by irregular, disorderly axonal distribution and fragmented, disordered fiber morphology. The NF-200 protein expression remained significantly lower than the control group (P < 0.05). In addition, fewer NF-200 positive cells were detected in the right cerebellum compared to the left (P < 0.05).
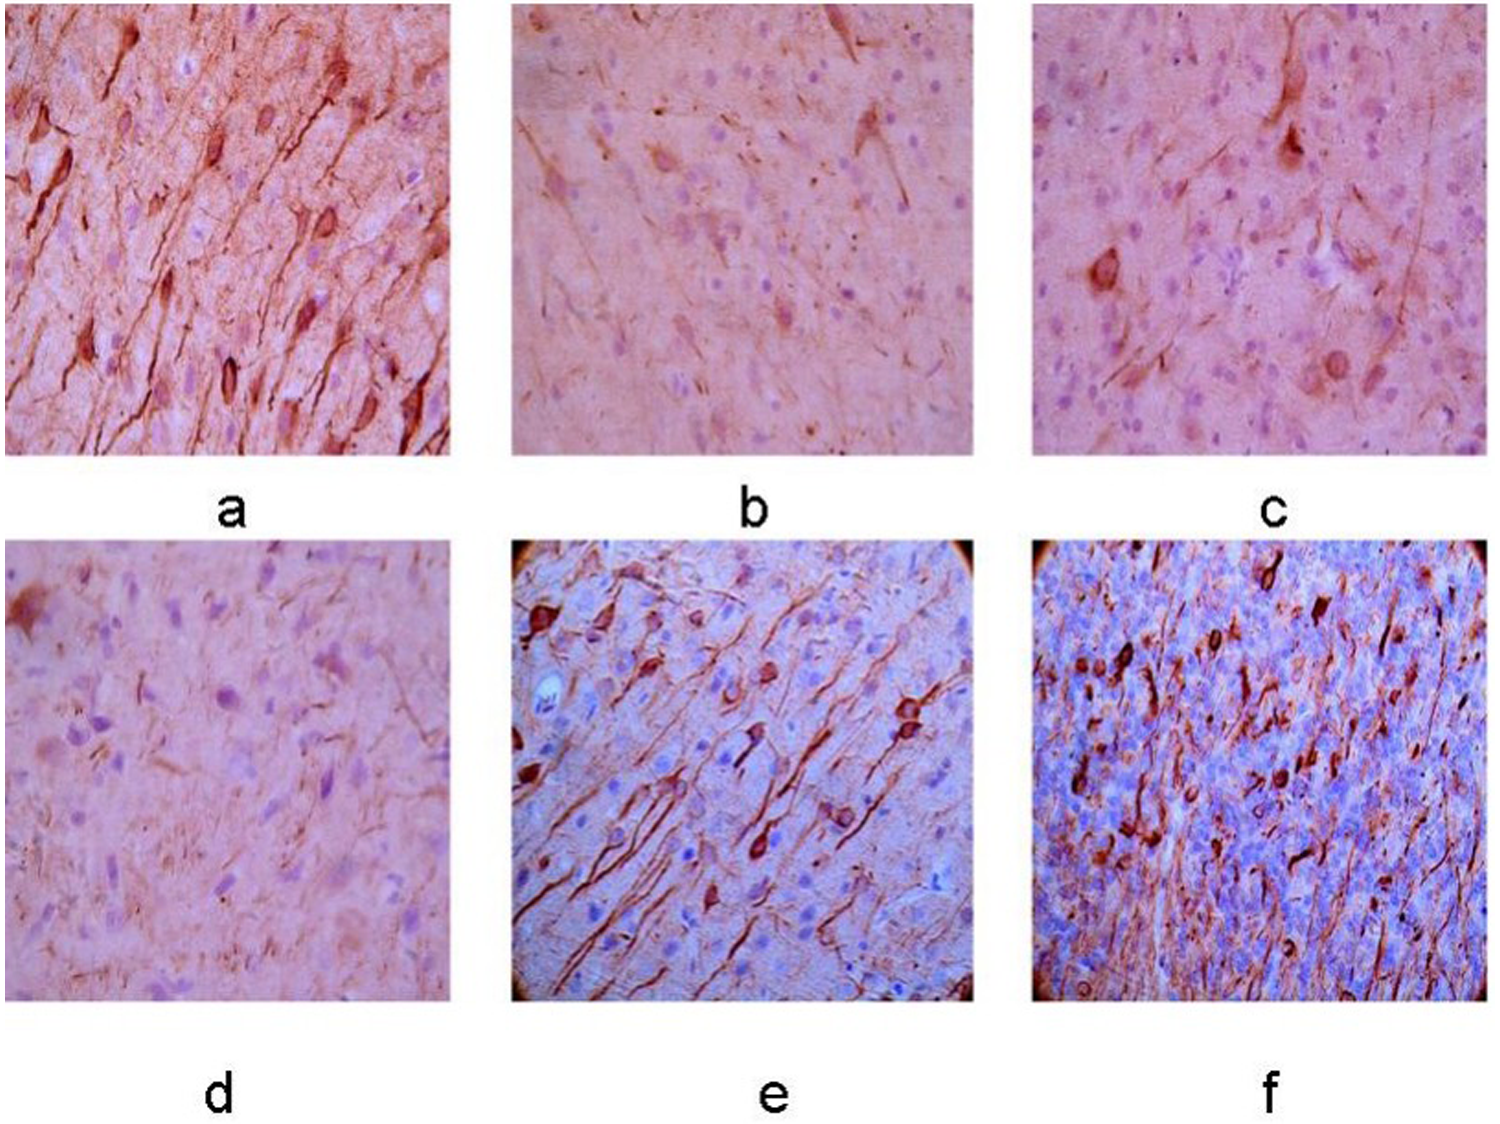
Expression of NF-200 protein in the left basal ganglia. (a–f) Control group, 12-h, 24-h, 48-h, 7-day, and 10-day groups after MCAO operation. The membrane and cytoplasm of NF-200 immunoreactive cells were tan and the expression was increasingly weaker with the extending of ischemia (×400).
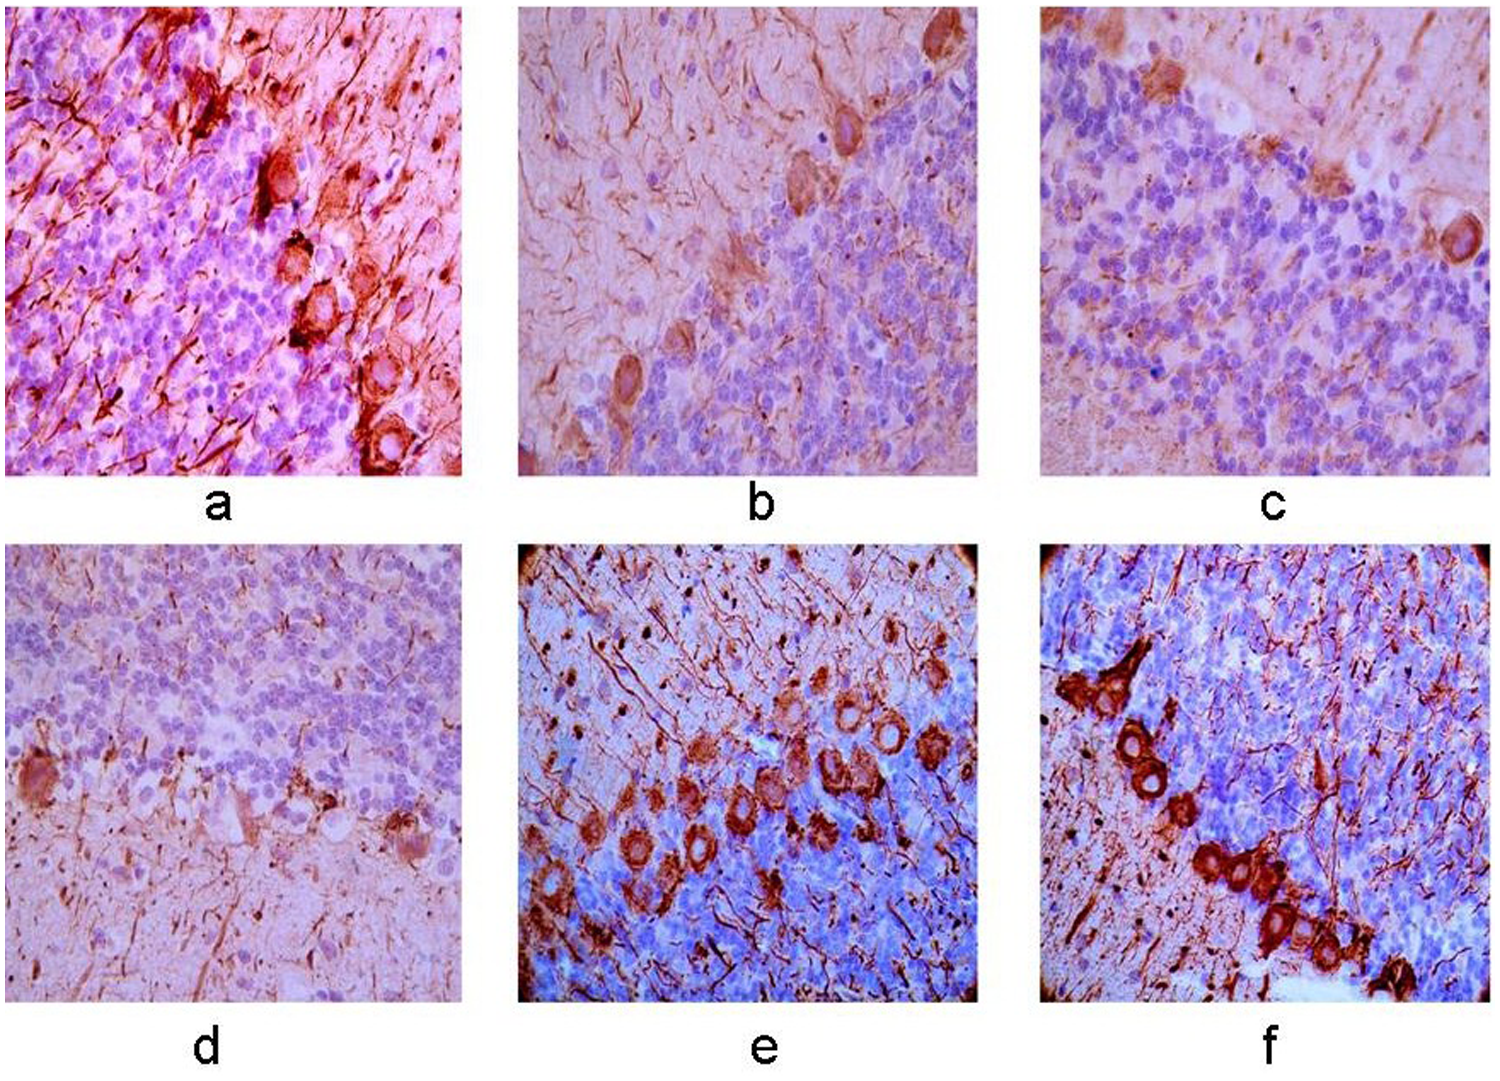
Expression of NF-200 protein in the right cerebellum. (a–f) Control group, 12-h, 24-h, 48-h, 7-day, and 10-day groups after MCAO operation. The membrane and cytoplasm of NF-200 immunoreactive cells were tan and the expression was increasingly weaker with the extending of ischemia and a lower level of positive cells was observed in right cerebellum compared with the left side (×400).
Spearman correlation analysis
According to the immunohistochemistry analysis, a significant positive correlation was observed between the expressions of RGMa and RhoA (r = 0.900, P = 0.037). In addition, RGMa and RhoA expression were significantly negatively correlated with axonal growth (r = −0.312, P = 0.004), ADC (r = -0.539, P < 0.01), and FA value (r = −0.520, P < 0.01).
TUNEL analysis
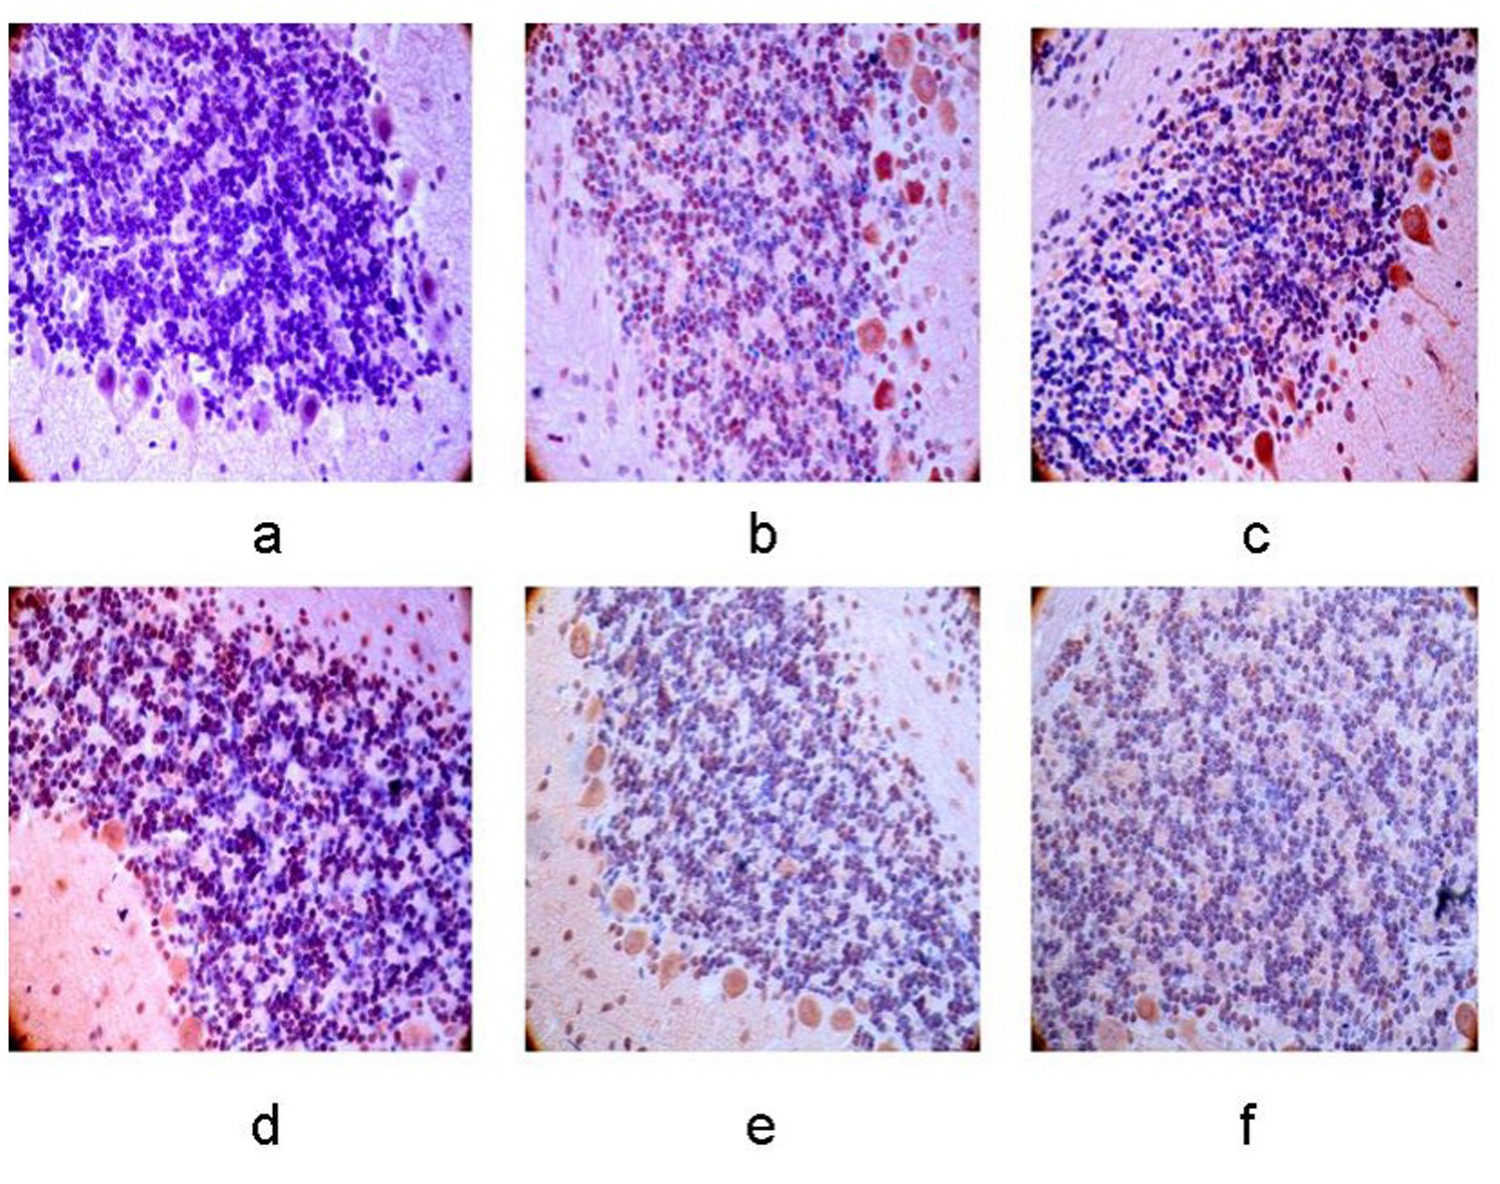
The number of apoptotic cells in the left basal ganglia and bilateral cerebellum gradually increased as ischemia progressed in the 12-h, 24-h, 48-h, 7-day, 10-day groups after cerebral infarction (P < 0.05), and the peak was observed in the 24-h group. A higher level of apoptotic cells was observed in the right cerebellum compared to the left side (P < 0.05) (Figs. 9 and 10).
Cell apoptosis in the left basal ganglia. (a–f) Control group, 12-h, 24-h, 48-h, 7-day, and 10-day groups after MCAO operation. The number of apoptosis cells was climbing with the extending of ischemia (×400).
Cell apoptosis in the right cerebellum. (a–f) Control group, 12-h, 24-h, 48-h, 7-day, and 10-day groups after MCAO operation. The number of apoptosis cells was climbing with the extending of ischemia, and a higher level of apoptosis cells was observed in the right cerebellum compared with the left side (×400).
Discussion
Ischemic cerebral infarction is one of the most common CNS diseases, and its high incidence, mortality, morbidity, and poor prognosis significantly impact the quality of life, drawing increasing attention. As related research has progressed, it has been found that not only the infarction area but also the ipsilateral and contralateral remote areas, including the cerebellum, may experience dysfunction and pathological changes after a stroke. This phenomenon is believed to be related to diaschisis (13).
Diaschisis refers to changes in the function of remote brain areas (such as the frontal lobe, thalamus, hypothalamus, and cerebellum) that result from the injury of the cerebral infarction focus connected by neural fibers. This concept was first proposed in 1914 by Swiss neurologist Von Monakow. Recently, advances in radiologic techniques, hemodynamics, and metabolism measurement technologies have significantly improved our understanding of the mechanisms of diaschisis, providing valuable insights for diagnosing and treating cerebral infarction. With the rapid development of imaging technologies, new methods and quantitative parameters, such as 131Xe, 123I-IMP labeled PET, SPECT, perfusion weighted imaging, and DTI, are increasingly being applied in clinical diagnosis and experimental research for cerebrovascular diseases (14).
We used DTI to continuously monitor the MCAO rat model in vivo. MR-DTI characterizes the 3D distribution of water diffusion, which is highly anisotropic in white matter fibers due to axonal length. By measuring the degree and direction of water diffusion, DTI can indirectly assess the integrity of brain white matter fibers. Changes in ADC and FA after cerebral infarction can be observed, aiding in the detection of tissue microstructure alterations. DTI provides quantitative information on the speed and direction of water molecule diffusion in the 3D space, allowing for detailed analysis of diffusion properties in each direction (15).
ADC and FA value were used as parameters for CCD. The ADC value reflects the diffusion speed and range of water molecules in MR-DWI but cannot distinguish the diffusion direction (12). It is positively correlated with the size and proliferation ability of free water molecules in tissue and indicates the overall diffusion rate of water within brain tissue, which is closely related to vasogenic edema, cytotoxic edema, and cellular structural integrity. Larger ADC values indicate more active diffusion movement of water molecules.
The FA value reflects the degree of water molecule diffusion anisotropy in brain tissue (10). It ranges from 0 to 1, with 0 representing the greatest degree of isotropic diffusion and 1 representing the greatest degree of anisotropic diffusion. A higher FA value indicates better axonal structure integrity, as water molecules move more efficiently along well-aligned fibers in white matter. In contrast, disordered white matter fiber tracts exhibit lower FA values due to irregular nerve fiber bundle arrangements caused by injury, resulting in reduced directional consistency and diffusion.
The DTI technique is commonly used to evaluate local parameter changes in supratentorial lesions due to cerebral infarction, but it is relatively uncommon for CCD evaluation. In our study, we measured ADC and FA values in the infarction core and bilateral cerebellum. We observed hyperintensity around the left infarction core on MRI, with the range increasing over time. Compared to the control group, the ADC and FA values were lowest in the MCAO 12-h group (P < 0.05). Although the ADC and FA values were higher in the other four groups, they remained lower than in the control group, likely due to permanent MCAO without reperfusion.
The ADC and FA values in the bilateral cerebellum followed the same trend as those in the supratentorial lesions, with more pronounced changes in the right cerebellum. This phenomenon can be explained by the cortical-ponto-cerebellar (CPC) hypothesis. The CPC circuit is the main nerve fiber pathway connecting the cerebral hemisphere to the contralateral cerebellum (16), transmitting signals from the cerebral cortex to the ipsilateral pons and then to the contralateral cerebellar cortex (17,18). After supratentorial brain injury, the nerve impulse is transmitted through crossed nerve fibers to the contralateral cerebellum. The observed changes in ADC and FA values therefore reflect neural function changes in the bilateral cerebellum after cerebral infarction, which also explains the CCD phenomenon.
According to current research, both FA and ADC values are reduced due to cytotoxic and vascular edema after cerebral infarction (19,20). In hypoxic-ischemic brain tissue, ATP synthesis is impaired, cerebral microcirculation is reduced, and Na + - K + -ATP enzyme activity declines. This leads to disfunction in the Na + - K + -ATP pump, allowing excessive Na+ and water to flow into the cells. Subsequently, large amounts of Ca2+ and Cl− also enter the cells. Over time, the cells exhibit increased permeability, the extracellular space becomes smaller, and water molecule diffusion is restricted, resulting in reduced FA and ADC values (21).
As the hypoxic-ischemic cells undergo necrosis and rupture, and vascular endothelial cells are damaged, vascular permeability increases, allowing large amounts of water to leak from the blood vessels into the extracellular space. This results in an expanded extracellular gap and a relative increase in free water, causing FA and ADC values to rise (22). As edema worsens, water molecules diffuse more rapidly, leading to a gradual increase in both FA and ADC values, which may approach normal levels, though still remaining lower than the baseline. False normalization may also occur in some cases (22).
After cerebral infarction, nerve cells in both the primary lesion and remote regions undergo apoptosis and necrosis (23). Apoptosis has been observed in the cerebellum in a transient unilateral cerebral ischemia rat model, suggesting the existence of CCD (24). In this study, apoptotic cells were found in the left cortex, infarction core, and bilateral cerebellum, with a gradual sustained increase, further confirming the CCD theory of cell apoptosis. The occurrence and severity of cell necrosis and apoptosis are influenced by various factors, such as nerve growth inhibition and nutrient deficiencies. Finding effective ways to alleviate secondary damage in remote regions after cerebral infarction holds significant clinical importance for neurological rehabilitation and reducing the occurrence of sequelae (25).
RGMa is a membrane-associated glycoprotein originally identified as an axon guidance molecule in the visual system (26). The RGM gene encodes three homologous protein products in vertebrates: RGMa and RGMb are mainly present in the developing and mature CNS, while RGMc is found in skeletal muscle (27). RGMa is expressed in the choroid plexus, cerebellar Purkinje fibers, perivascular regions, and brainstem neurons in rats, where it inhibits axon growth by activating the RhoA-Rho kinase pathway. This pathway mediates neural tube closure, repulsive axon guidance signals, and controls neuronal growth, proliferation, and differentiation (28). Schwab et al. reported that RGMa expression is elevated after ischemic cerebral injury, reaching its peak 1.5–2.5 days post-ischemia and remaining elevated for several months. Immunohistochemical staining revealed that RGMa-immunopositive cells were primarily located in the infarction core and peri-infarctional areas (11). In our study, we observed a similar phenomenon: the expression of RGMa and RhoA increased from 12 h and peaked at 48 h, maintaining a high level in the rats' cortex, basal ganglia, and cerebellum after ischemia.
Furthermore, compared with the control group, increased immunoreactivity for NF-200 was observed. Neurofilaments are cytoskeletal polymers that play a key role in promoting axonal growth, sustaining axonal caliber (29) and maintaining axoplasmic transport (30). Neurofilaments and their phosphorylation markers are considered indicators of axonal regeneration (22). Immunohistochemistry staining revealed higher levels of NF-200 expression in these areas, which showed a negative correlation with RGMa, suggesting that axonal regeneration was impaired in the ischemic area. These findings suggest that after ischemia, RGMa damages nerve fiber myelination and axonal growth by activating the RhoA-Rho kinase pathway, leading to abnormal water diffusion. This results in hyperintensity observed in DWI and DTI imaging, with decreased ADC and FA values. Subsequently, neural excitability transmission to the bilateral cerebellum is impaired due to the disruption of the CPC pathways, resulting in reduced nerve impulses. This leads to inhibition of metabolism and neural function in the cerebellum, especially in the crossed cerebellum. The combination of low ADC and FA values on MRI and high RGMa expression in pathophysiology explains the CCD phenomenon.
Previous experiments by our team also found that the ADC value rapidly reduced within 1 h after ischemia in the infarction core and bilateral cerebellum, with a subsequent increase in fluctuations after 3–9 h, although still lower than baseline. The decline in ADC and FA values, along with an increase in RGMa expression, was observed as early as 1 h after ischemia. Based on these findings, we suggest that not only supratentorial primary lesions but also the bilateral cerebellum exhibit corresponding changes within 1 h after acute cerebral infarction, as seen in both imaging and pathology. These changes showed a negative correlation with the primary lesion. The DTI technique may serve as a new non-invasive method to monitor the occurrence, progression, and prognosis of the CCD phenomenon. In addition, RGMa could be considered one of the pathology testing markers for the treatment of cerebral infarction and CCD.
In conclusion, compared with control group, the imaging parameters and pathological indexes in the bilateral cerebellum of MCAO rat models exhibited changes corresponding to supratentorial infarction core, particularly in in the crossed cerebellum. This suggests that RGMa plays a role in axonal regeneration and remodeling, contributing to the changes in ADC and FA values. The underlying mechanism of CCD could also be explained by the inhibition of the CPC pathway. This study offers a new approach for understanding and treating cerebral infarction while aiming to reduce the occurrence of CCD.
Footnotes
Acknowledgments
I would like to thank Zhengzhou University for funding my project and Dr Cheng for his support from the National Nature Fund. I would also like to thank Xiao Wang for extensive proofreading of the final manuscript.
Declaration of conflicting interests
The authors declared no potential conflicts of interest with respect to the research, authorship, and/or publication of this article.
Funding
The authors disclosed receipt of the following financial support for the research, authorship, and/or publication of this article: Henan Provincial Science and Technology Research Project (grant no. 242102310133).