
Abstract
Background
To find a more general imaging method for preliminary grading of infratentorial brain tumors.
Purpose
To investigate the value of non-contrast computed tomography (NCCT) attenuation of the solid part of a tumor (SP-T) in distinguishing high- and low-grade infratentorial tumors.
Material and Methods
This retrospective study included 196 patients with primary infratentorial tumors. A total of 56 patients also underwent magnetic resonance imaging (MRI) with diffusion-weighted imaging (DWI). CT attenuation of SP-T, caudate nucleus (normal gray matter), and centrum semiovale (normal white matter) were measured. CT attenuation ratios of SP-T to normal gray matter (RT−G) and normal white matter (RT−W) were calculated. Each parameter was compared, and the area under the receiver operating characteristic curve (AUC) was used to determine diagnostic efficacy. Diagnostic efficacy of apparent diffusion coefficient (ADC) value and CT-related parameters were compared in 56 patients with both NCCT and MRI with DWI.
Results
There were significant differences (P < 0.001) in mean CT attenuation of SP-T (35.32 ± 8.19 HU vs. 42.91 ± 5.56 HU), RT−G (0.95 ± 0.21 vs. 1.17 ± 0.15), and RT−W (1.37 ± 0.33 vs. 1.74 ± 0.30) between low- and high-grade infratentorial tumors. The AUCs for differentiating low-grade from high-grade tumors are 0.783, 0.819, and 0.797 for CT attenuation of SP-T, RT−G, and RT−W, respectively. For 56 patients with DWI, the AUCs for CT attenuation of SP-T, RT−G, RT−W, and ADC value were 0.833, 0.887, 0.850, and 0.910, respectively. All three CT-related parameters were not significantly different from the ADC value.
Conclusion
NCCT can distinguish low- and high-grade infratentorial tumors simply and conveniently and CT-related parameters show no significant difference compared to ADC value.
Keywords
Introduction
Brain and other central nervous system (CNS) tumors are among the most fatal cancers and account for substantial morbidity and mortality (1). Among them, lesions within the infratentorial region can readily precipitate severe conditions such as cerebellar tonsillar herniation and hydrocephalus (2). Unlike cancers of other systems, primary brain tumors are not staged but are classified according to the World Health Organization (WHO) Classification of Tumors of the CNS, which assigns a “grade” of 1–4 on the basis of their clinical behavior (3). This approach correlates the grade to an idealized clinical biological behavior, and there are evident differences in the prognoses between low-grade and high-grade infratentorial tumors (3). Enhancing the correlation between medical imaging and pathological diagnosis could aid in superior treatment selection, potentially increasing survival rates (4).
Numerous studies have suggested that magnetic resonance imaging (MRI) with diffusion-weighted imaging (DWI) may effectively distinguish the CNS WHO grade of infratentorial tumors by using the apparent diffusion coefficient (ADC) values (4–10). MRI is limited by its running time and intolerable noise. Moreover, MRI is not particularly accommodating for individuals susceptible to claustrophobia or physically restless children. Thus, there is a desperate need for other perhaps simpler imaging methods in clinical practice to help guide the subsequent management of emergency patients with infratentorial tumors.
Computed tomography (CT) is frequently the initial and exclusive imaging procedure required for diagnosis (11). Non-contrast computed tomography (NCCT) is the prevalent technique utilized for assessing infratentorial neoplasms, and concomitantly, it is the technique with the shortest examination duration (12). To the best of our knowledge, NCCT often has limited utility in distinguishing between high-grade and low-grade infratentorial tumors. If a correlation exists between NCCT attenuation and the CNS WHO grade of infratentorial tumors, NCCT could serve as an initial diagnostic tool for infratentorial tumors.
Material and Methods
Patients
This retrospective study was approved by the Ethics Committee. The procedures used in this study adhere to the tenets of the Declaration of Helsinki. The requirement for informed consent was waived due to the retrospective nature of the study. All data were fully anonymized.
The inclusion criteria for this study were as follows: (i) patients with surgical pathology reports and graded by molecular pathology (all reassessed according to the 2021 diagnostic criteria); (ii) patients with tumors in the infratentorial region; and (iii) patients who underwent NCCT 2 weeks before surgery. The exclusion criteria were as follows: (i) patients with metastasis or extracerebellar tumors; (ii) patients with a cross-section of the solid part of the tumor (SP-T) less than 50 mm2; and (iii) patients with poor image quality not allowing reliable measurement of infratentorial tumors. Eligible patients were collected between 1 June 2015 and 31 March 2024. Finally, 196 patients with infratentorial tumors were included, 56 of whom underwent both preoperative NCCT and MRI with DWI. A study flowchart is shown in Fig. 1.
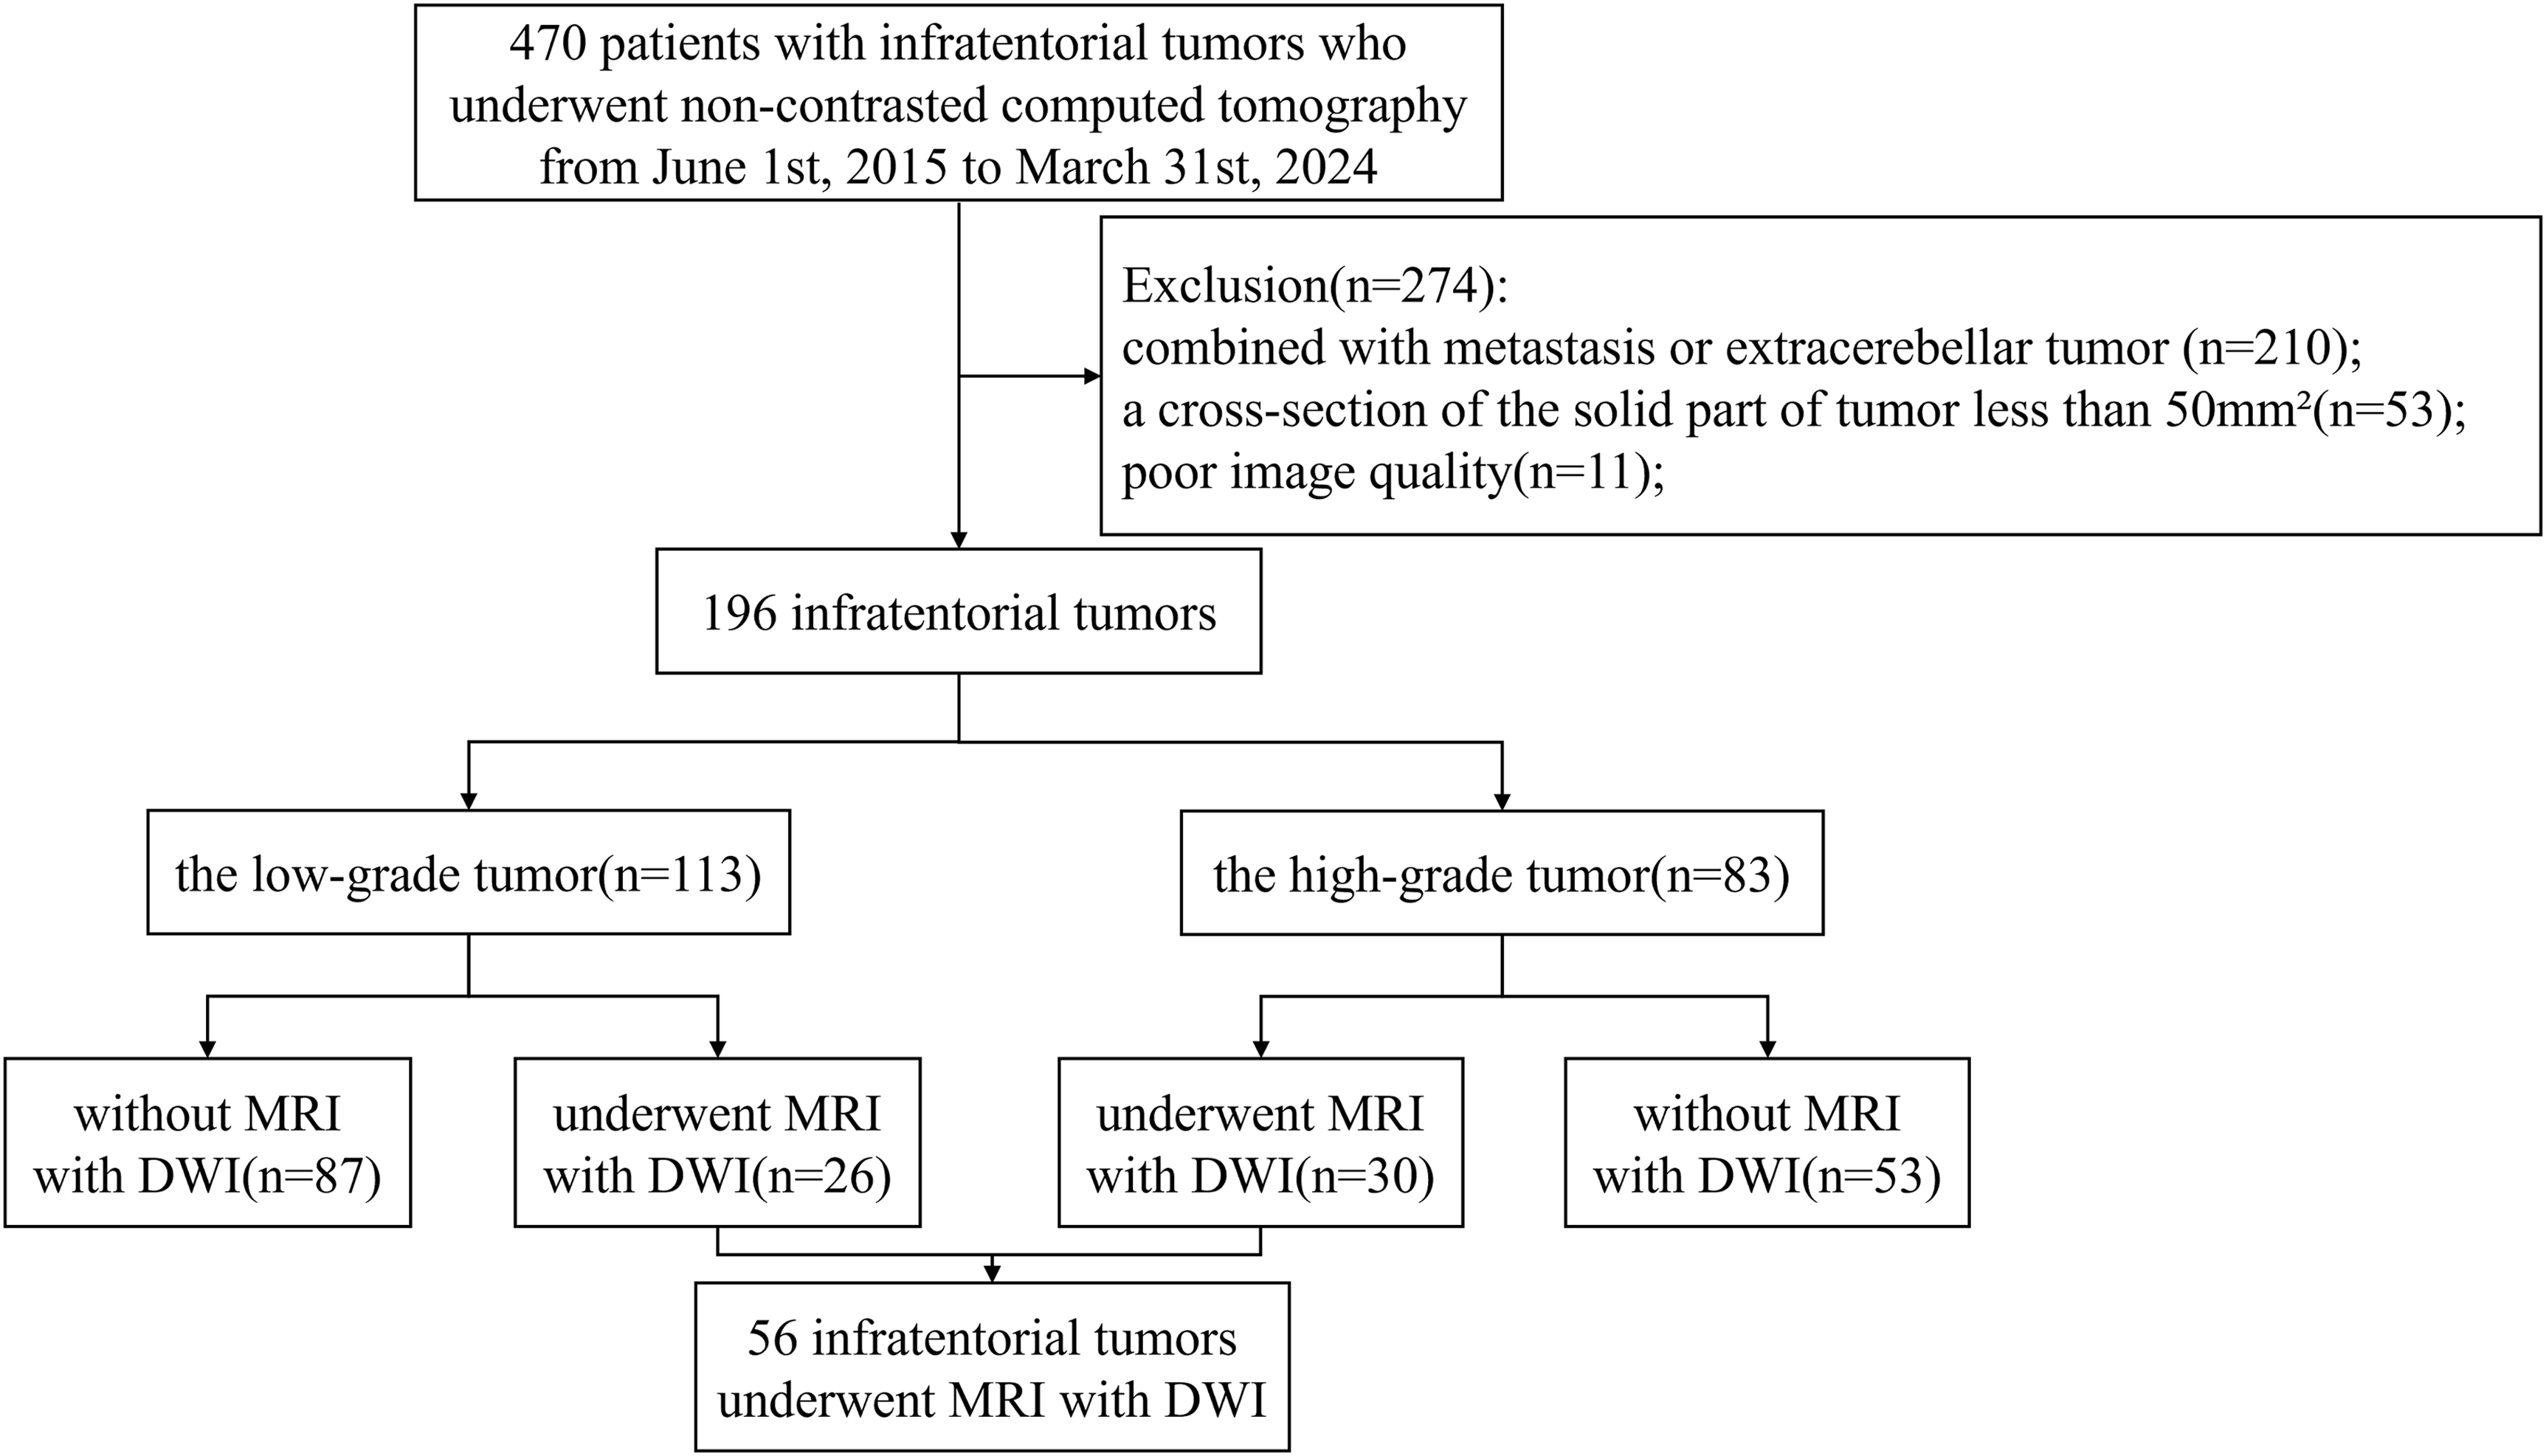
Study flowchart.
Scanning protocols
All patients underwent imaging with a non-contrast head CT scanner (including Aquilion 300, Aquilion ONE Genesis; Canon Medical System and SOMATOM Force; Siemens Healthineers). The scanning parameters were as follows: slice thickness = 5 mm; slice increment = 5 mm; pitch = 0.3; 120 kV; 320 mA; and collimation = 64 × 0.625 mm. The head was scanned from the foramen magnum to the end of the skull.
A total of 56 patients underwent imaging with 3.0 T MR scanners (including Ingenia CX and Achieva; Philips Medical Systems). DWI sequences were acquired via a DW single-shot echo‒planar sequence with diffusion gradients along the three standard X, Y, and Z directions and effective b-values of 0 and 1000 s/mm2. The scan parameters were as follows: TR = 4000 ms; TE = 88 ms; NSA = 2; field of view = 210 × 210 mm; sampling resolution = 1.4 × 1.4 × 5 mm3; slice thickness = 5 mm; and an intersection gap = 1 mm. ADC maps were automatically calculated via vendor-specific software on the MR scanners.
Measurement of CT attenuation
Image analysis was performed on a PACS workstation by two experienced neuroradiologists (with 15 and 10 years of experience) who were blinded to the tumor pathology. CT attenuation of the SP-T, caudate nucleus (normal gray matter), and centrum semiovale (normal white matter) was assessed via manually applied measurable regions of interest (ROIs). When each ROI was selected, it was attempted to avoid necrotic, hemorrhagic, and calcified areas. If the solid part was difficult to identify, the ROIs were outlined by CT-enhanced images. For all measurements, a round or ovoid ROI of at least 25 mm2 was applied and obtained from three consecutive slices, with the average of the measured values calculated. A consistency analysis was performed to assess the agreement between the measurements of the two physicians.
The CT attenuation ratios of the SP-T to normal gray matter (RT−G) were obtained by dividing the mean CT attenuation of the SP-T by that of the caudate nucleus. The CT attenuation ratios of the SP-T to normal white matter (RT−W) were derived by dividing the mean CT attenuation of the SP-T by the centrum semiovale.
Measurement of ADC value
The ADC values for 56 patients were obtained from the restricted diffusion area of the SP-T. The ROIs were at least 25 mm2 in size and were obtained from three consecutive slices, and the average of the measured values was calculated. If the SP-T was visible on fewer than three images, non-overlapping ROIs were drawn on the tumor so that each tumor was sampled from three sites.
Statistical analysis
The data were evaluated using SPSS version 26 (IBM Corp., Armonk, NY, USA). The inter-observer reproducibility of the CT attenuation was evaluated via the intraclass correlation coefficient (ICC). The levels of agreement were categorized as follows: >0.74 = excellent; 0.60–0.74 = good; 0.40–0.59 = fair; or <0.40 = poor). For comparisons between groups, the chi-square test or Fisher's exact test was used for enumeration data, the Kolmogorov‒Smirnov test was used to test whether the measurement data conformed to a normal distribution, and the independent samples t-test was used for normally distributed measurement data. Otherwise, the U-test was used. The receiver operating characteristic (ROC) curve with the area under the ROC curve (AUC) was used to evaluate the diagnostic performance of the CT attenuation of the SP-T, RT−G, RT−W, and ADC value in distinguishing between high-grade and low-grade infratentorial tumors, and the AUCs were compared via the DeLong method. Differences were considered statistically significant at P < 0.05.
Results
Patient characteristics
A total of 196 patients (79 female patients) were included in this study. The median age of patients with low-grade infratentorial tumors was 34 years (age range = 16–51 years), and that of patients with high-grade infratentorial tumors was 12 years (age range = 6–31). Pathology revealed gliomas (n = 58, 30%), medulloblastomas (n = 57, 29%), hemangioblastomas (n = 56, 28.5%), ependymomas (n = 56, 9%), cavernous hemangiomas (n = 2, 1%), mesenchymal tumors (n = 2, 1%), diffuse large B-cell lymphoma (n = 1, 0.5%), embryonal tumor with multilayered rosettes (n = 1, 0.5%), and atypical teratoid rhabdoid tumor (n = 1, 0.5%). The 58 gliomas included pilocytic astrocytomas (n = 44, 76%), WHO grade 2 diffuse astrocytomas (n = 4, 7%), WHO grade 4 diffuse astrocytomas (n = 4, 7%), glioblastomas (n = 6, 10%), and two IDH (+) cases in glioblastomas. The 18 ependymomas included WHO grade 2 ependymomas (n = 7, 39%) and anaplastic ependymomas (n = 11, 61%). Overall, 113 (58%) lesions were classified as low-grade and 83 (42%) lesions were classified as high-grade (Table 1).
Summary of the WHO grade, pathology, and CT attenuations of the SP-T, RT-G, and RT-W for low-grade and high-grade infratentorial tumors.
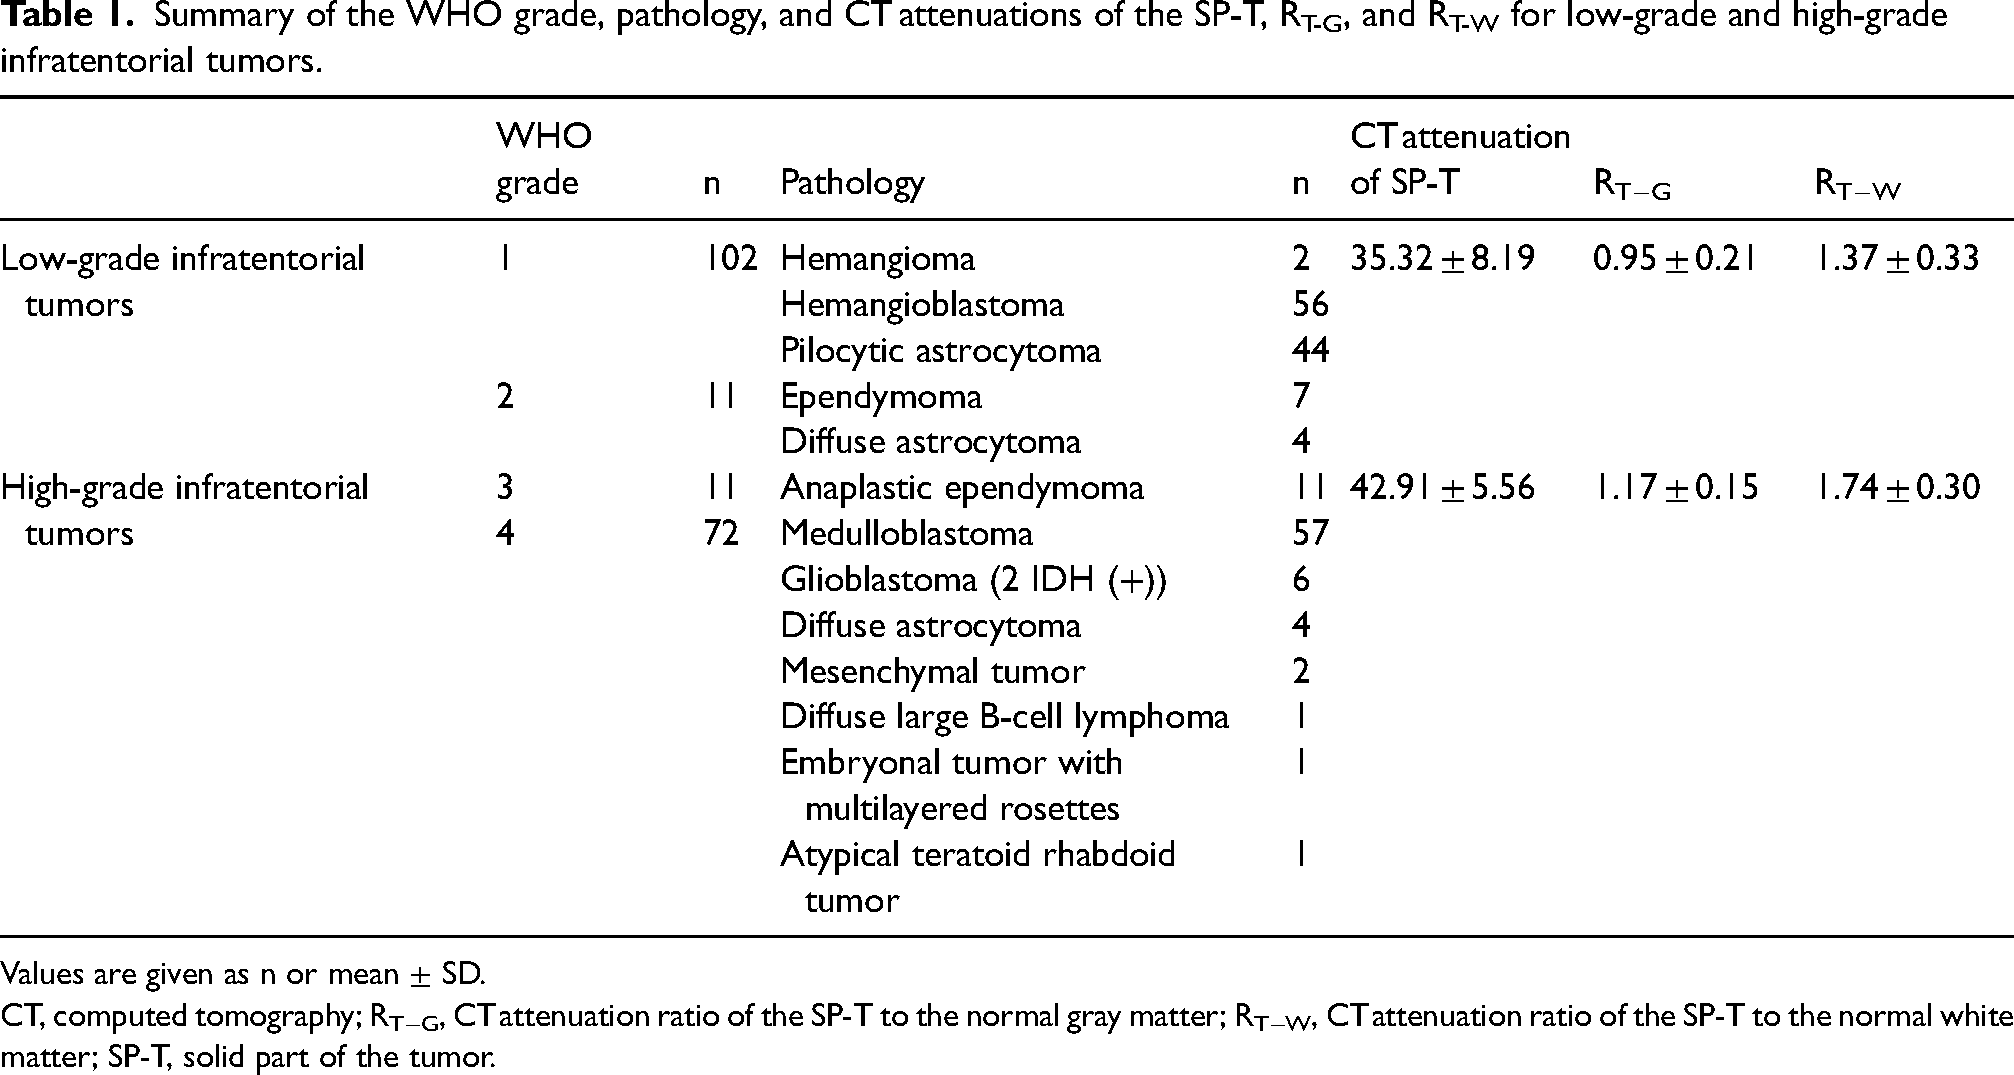
Values are given as n or mean ± SD.
CT, computed tomography; RT−G, CT attenuation ratio of the SP-T to the normal gray matter; RT−W, CT attenuation ratio of the SP-T to the normal white matter; SP-T, solid part of the tumor.
Among the 56 patients who underwent both preoperative NCCT and MRI with DWI, 26 (46%) lesions were classified as low-grade and 30 (54%) lesions were classified as high-grade.
Comparison of imaging parameters between low-grade and high-grade tumors
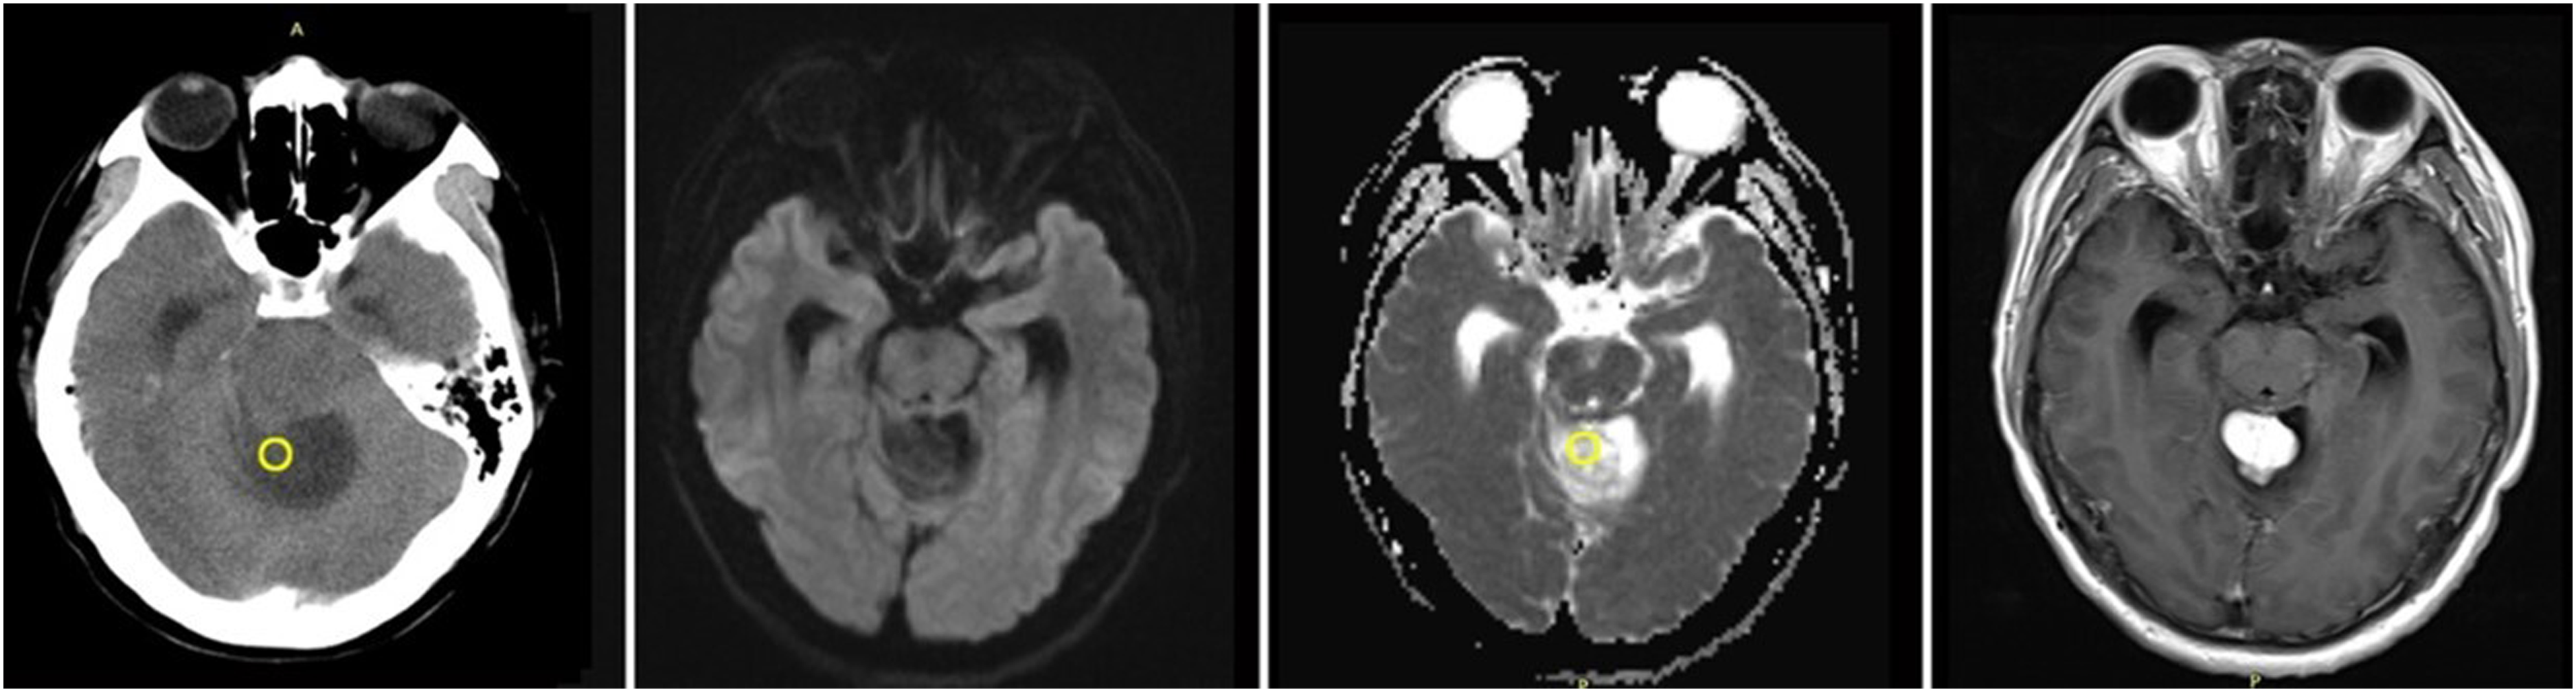
Compared with high-grade tumors, low-grade tumors had significantly lower CT attenuation rates of the SP-T (35.32 ± 8.19 HU vs. 42.91 ± 5.56 HU; P < 0.001), RT−G (0.95 ± 0.21 vs. 1.17 ± 0.15; P < 0.001), and RT−W (1.37 ± 0.33 vs. 1.74 ± 0.30; P < 0.001) (Figs. 2–5).
A 31-year-old man with glioblastoma. The CT attenuations of the solid part of the tumor (SP-T), CT attenuation ratios of the SP-T to normal gray matter (RT−G), CT attenuation ratios of the SP-T to normal white matter (RT−W), and ADC value are 43.60 HU, 1.24, 1.82, and 0.735 × 10⁻³ mm2/s, respectively. ADC, apparent diffusion coefficient; CT, computed tomography.
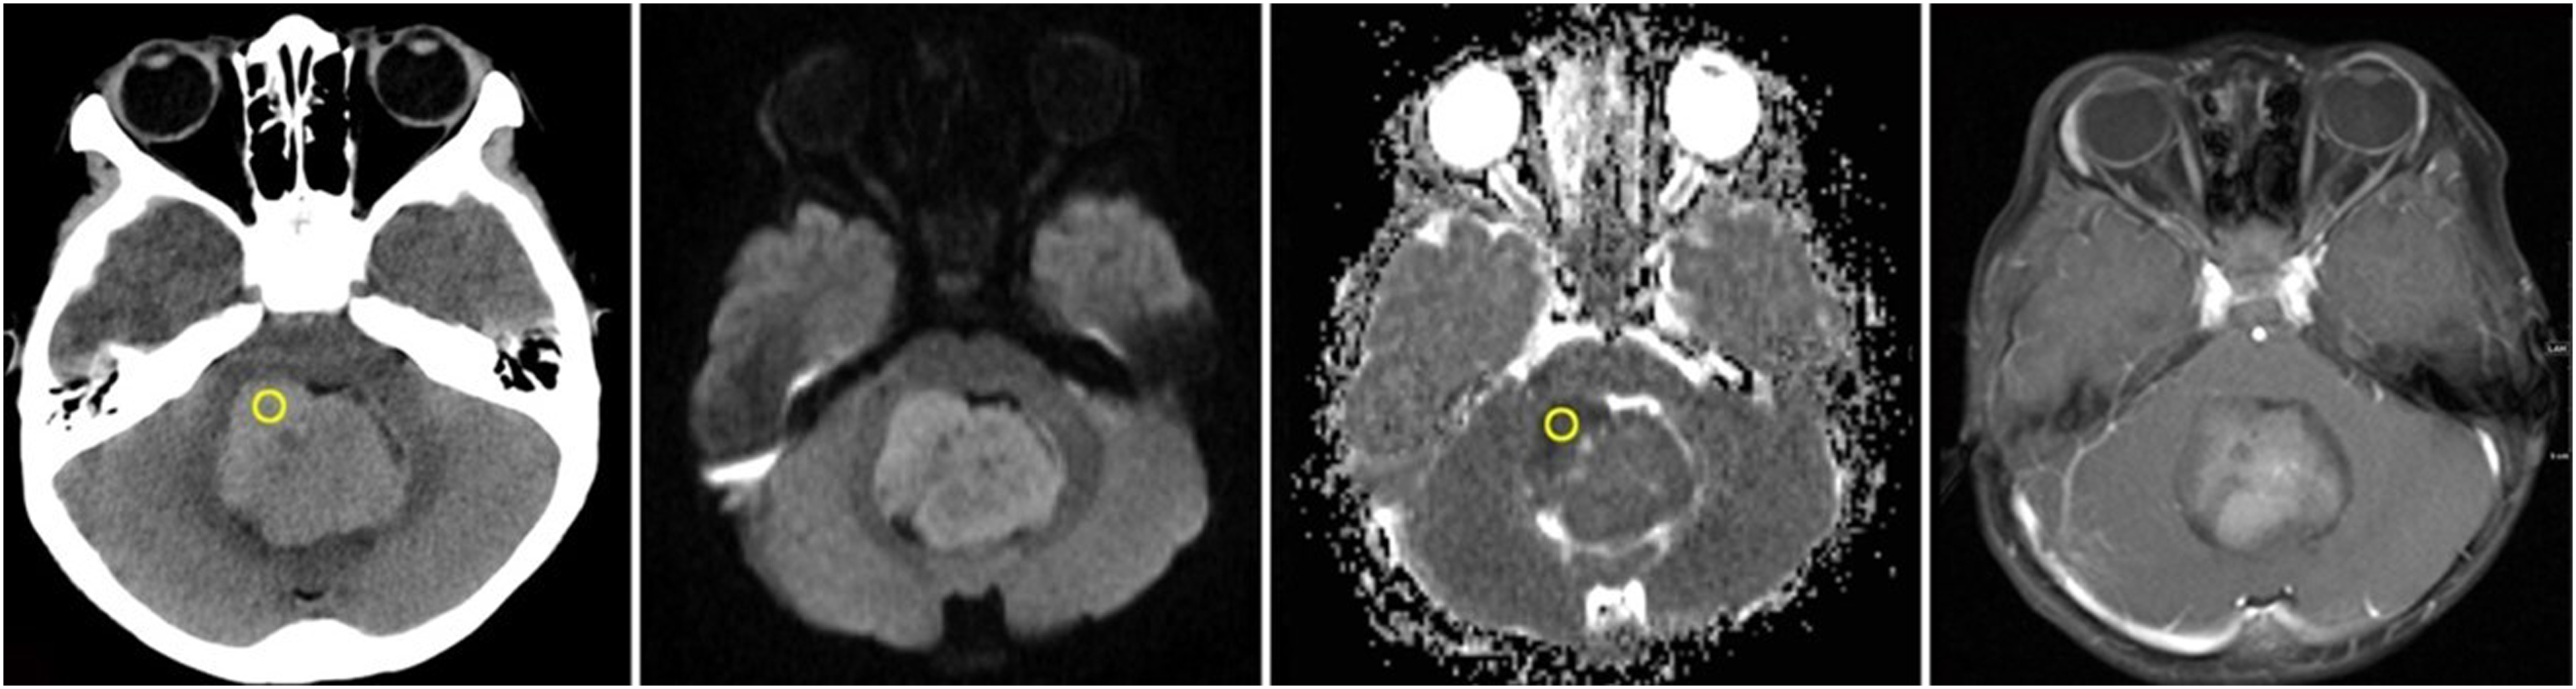
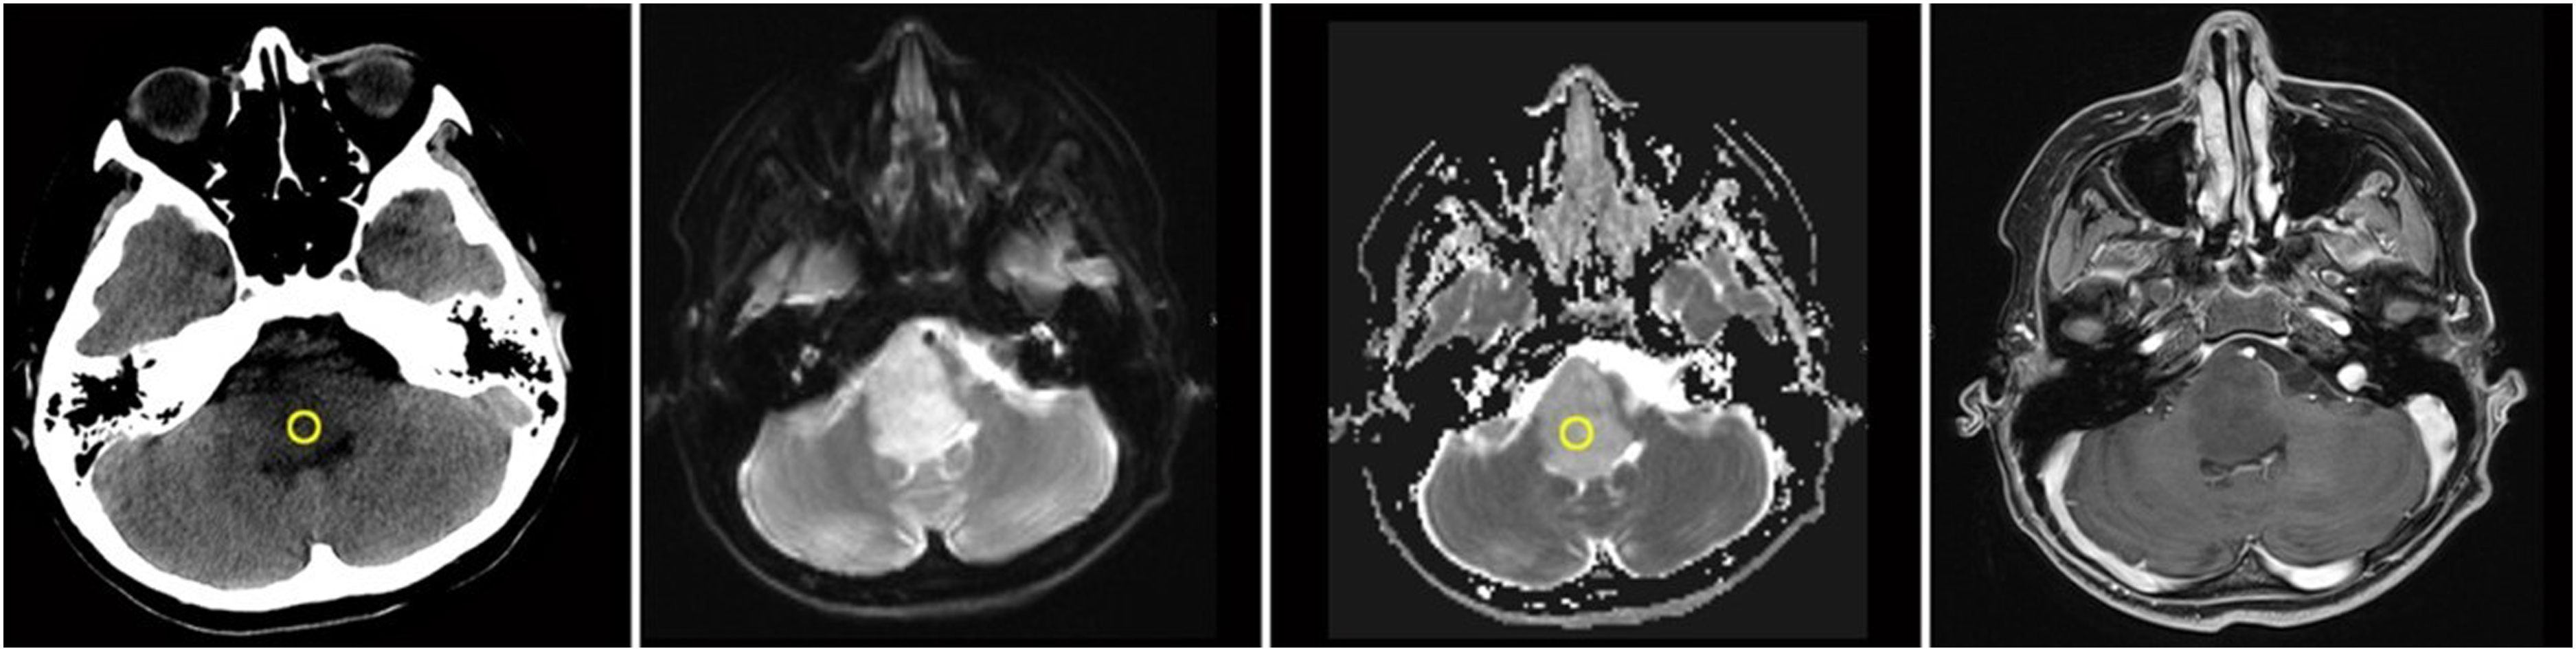
A 3-year-old boy with medulloblastoma. The CT attenuations of the solid part of the tumor (SP-T), CT attenuation ratios of the SP-T to normal gray matter (RT−G), CT attenuation ratios of the SP-T to normal white matter (RT−W), and ADC value are 46.50 HU, 1.35, 1.90, and 0.601 × 10⁻³ mm2/s, respectively. ADC, apparent diffusion coefficient; CT, computed tomography.
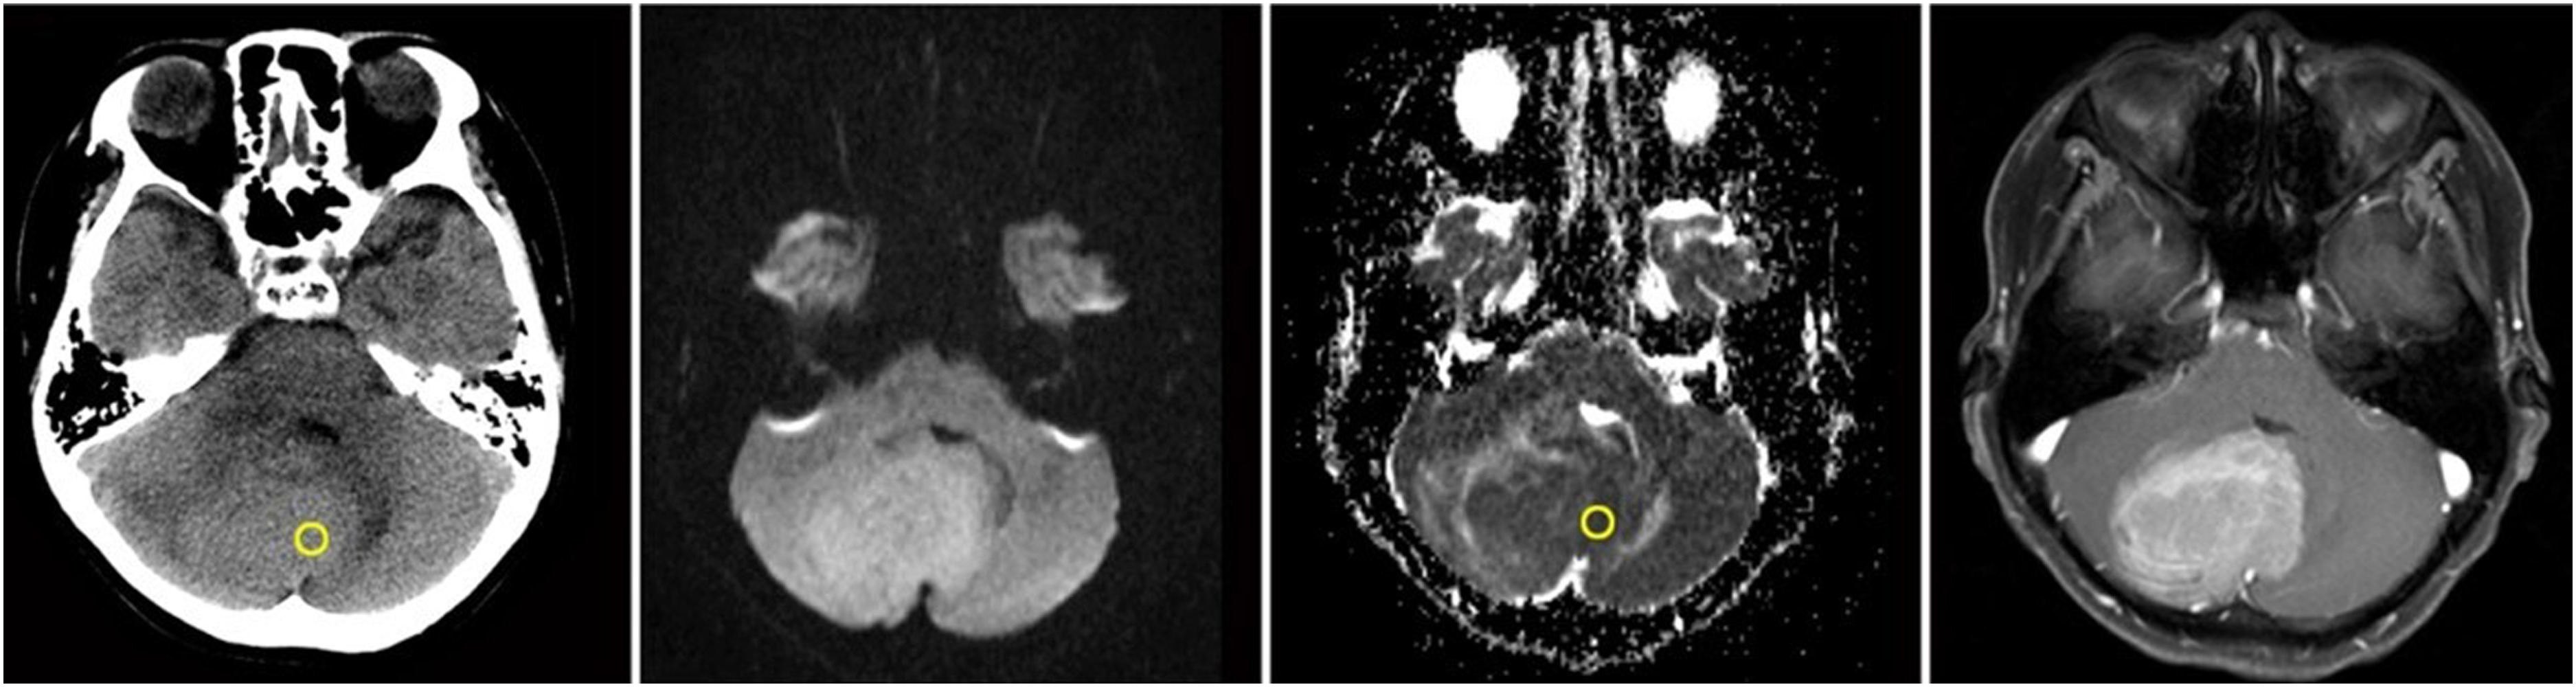
A 38-year-old woman with hemangioblastoma. The CT attenuations of the solid part of the tumor (SP-T), CT attenuation ratios of the SP-T to normal gray matter (RT−G), CT attenuation ratios of the SP-T to normal white matter (RT−W), and ADC value are 30.40 HU, 0.84, 1.16, and 1.694 × 10⁻³ mm2/s, respectively. ADC, apparent diffusion coefficient; CT, computed tomography.
A 12-year-old boy with pilocytic astrocytoma. The CT attenuations of the solid part of the tumor (SP-T), CT attenuation ratios of the SP-T to normal gray matter (RT−G), CT attenuation ratios of the SP-T to normal white matter (RT−W), and ADC value are 25.90 HU, 0.80, 1.12, and 1.411 × 10⁻³ mm2/s, respectively. ADC, apparent diffusion coefficient; CT, computed tomography.
Diagnostic performance
In the 196 patients who underwent preoperative NCCT for differentiating low-grade and high-grade infratentorial tumors, the AUCs of CT attenuation of the SP-T, RT−G, and RT−W were 0.783, 0.819, and 0.797, respectively. When the CT attenuation of the SP-T threshold was 38.60 HU, the sensitivity and specificity for diagnosing low- and high-grade infratentorial tumors were 0.845 and 0.664, respectively. When the RT−G threshold was 1.03, the sensitivity and specificity were 0.881 and 0.673, respectively. When the RT−W threshold was 1.62, the sensitivity and specificity were 0.643 and 0.814, respectively (Fig. 6, Table 2).
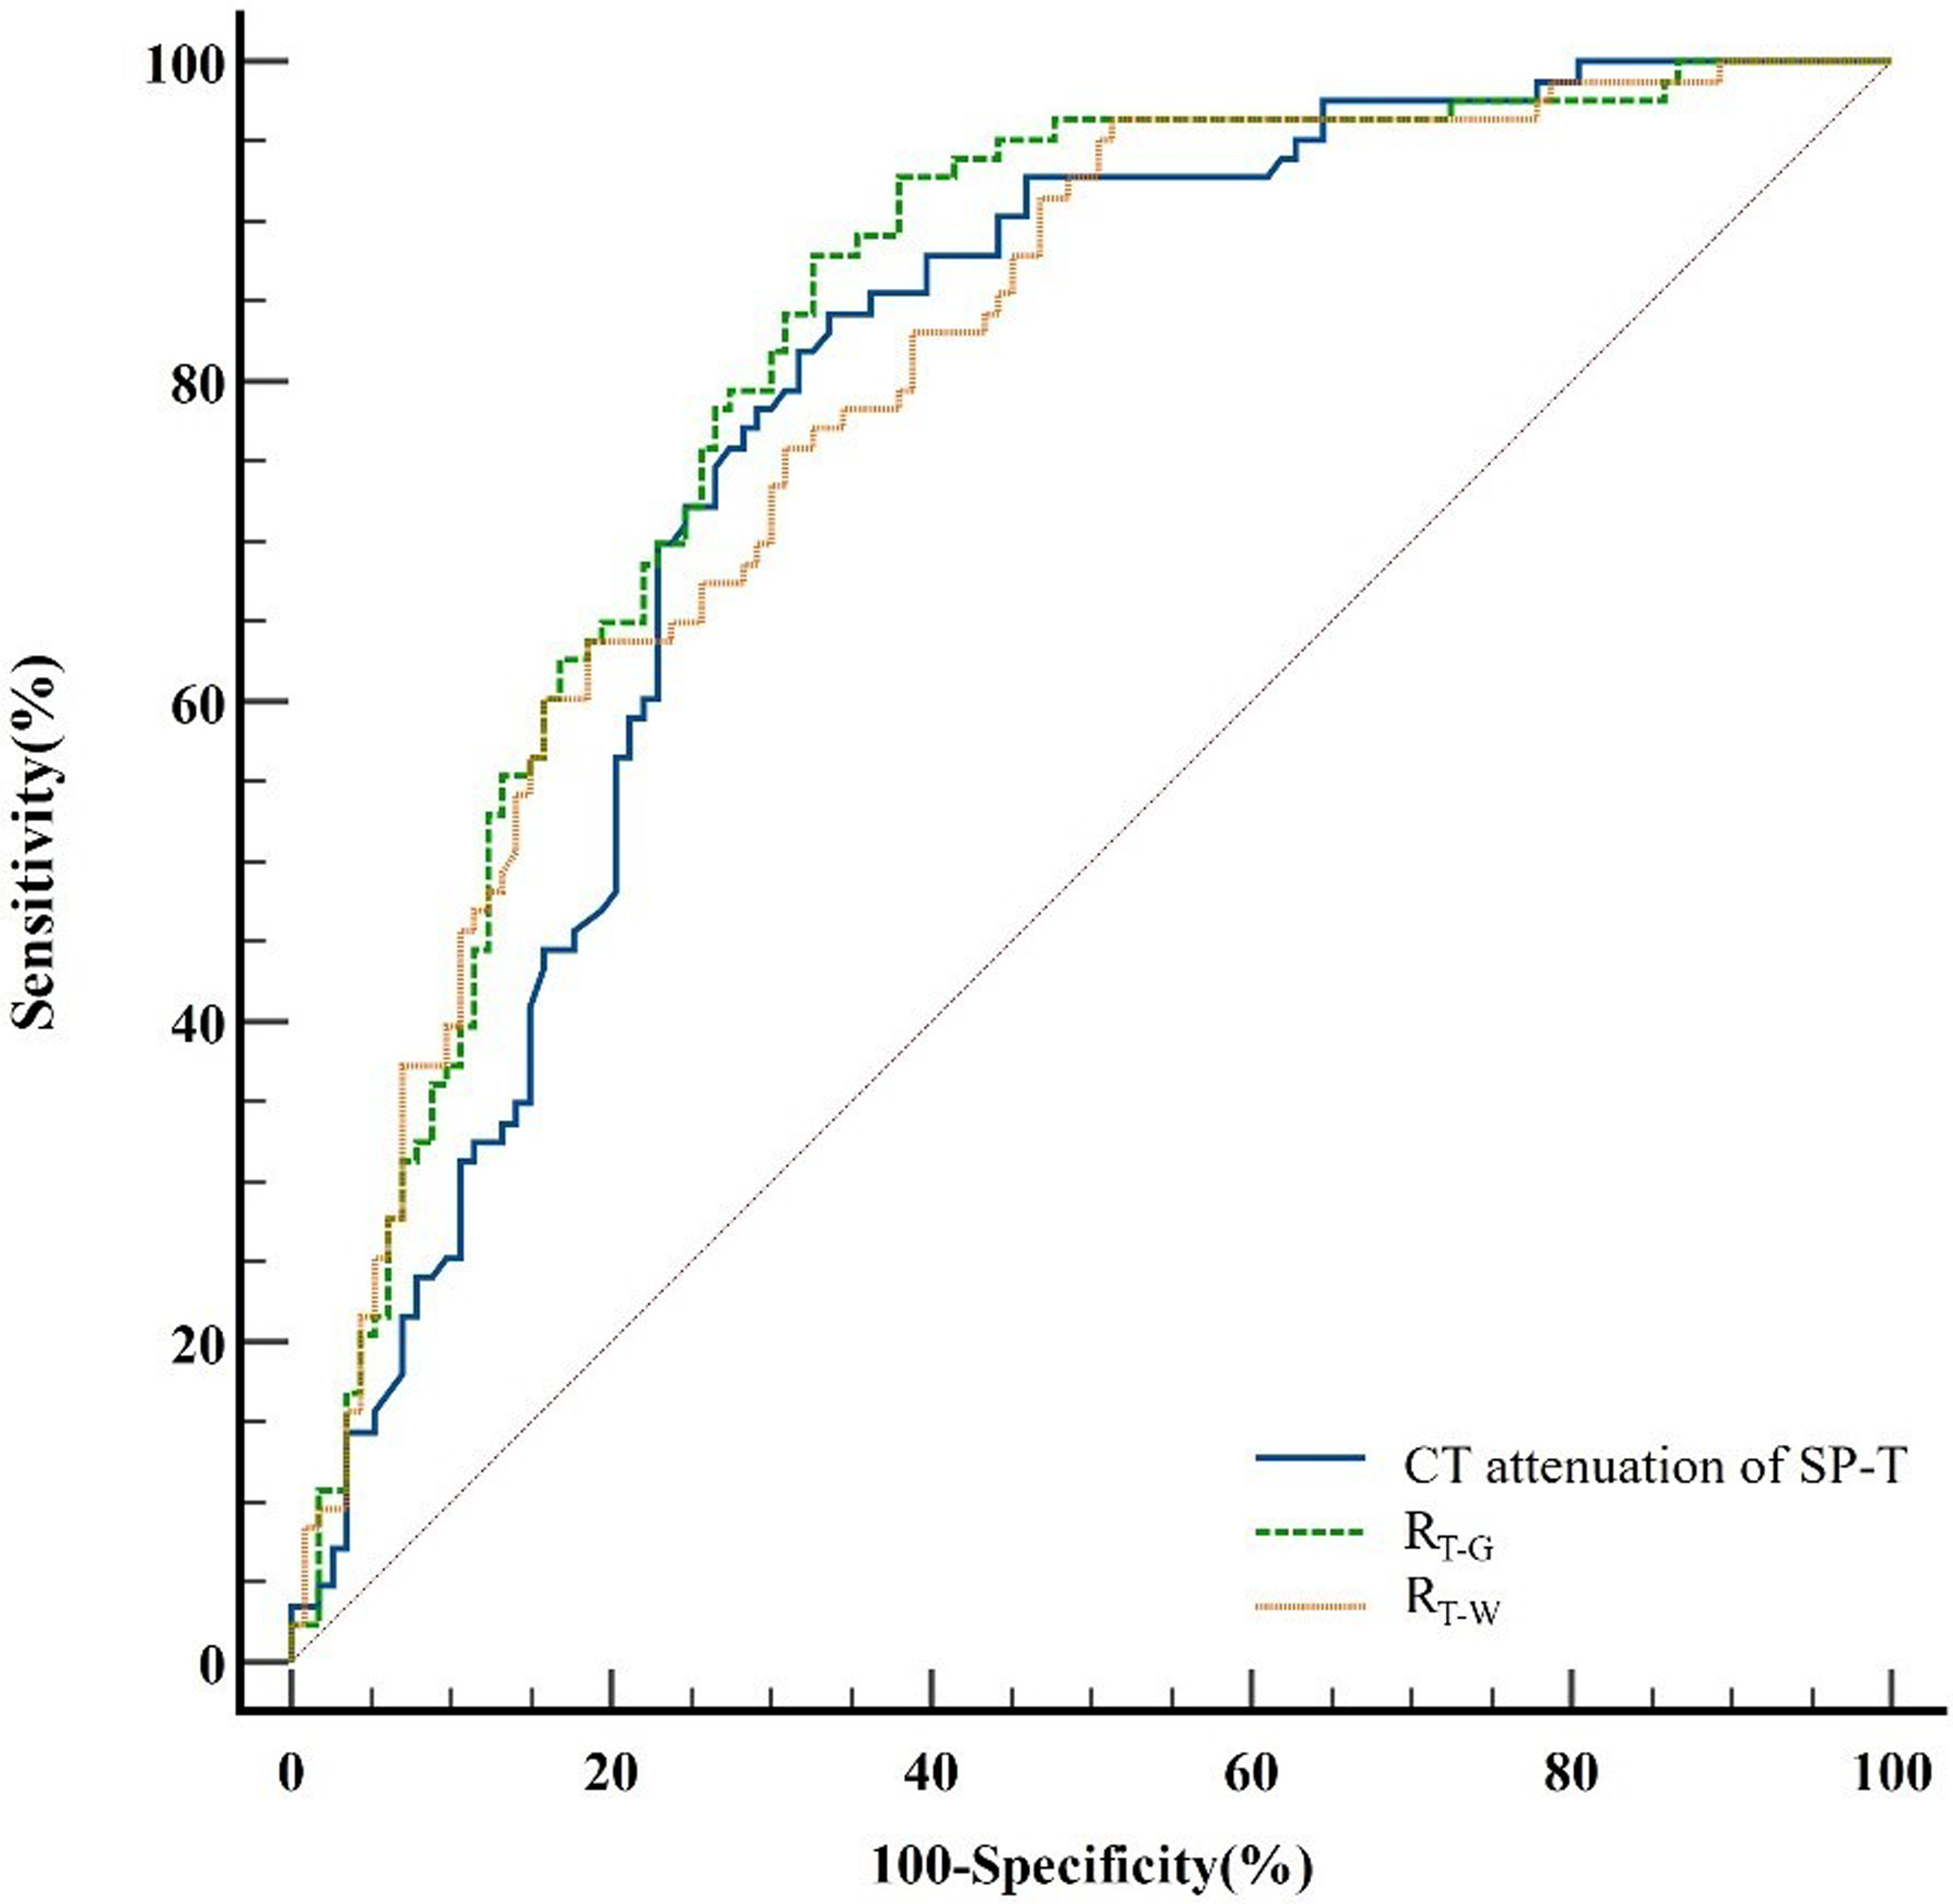
ROC curve analysis of the CT attenuation of the solid part of the tumor (SP-T), the CT attenuation ratio of the SP-T to normal gray matter (RT−G), and the CT attenuation ratio of the SP-T to normal white matter (RT−W) in distinguishing low-grade from high-grade infratentorial tumors. The AUCs were 0.783, 0.819, and 0.797, respectively. AUC, area under the ROC curve; CT, computed tomography; ROC, receiver operating characteristic.
Diagnostic performance in 196 patients who underwent preoperative CT to differentiate between low-grade and high-grade infratentorial tumors.
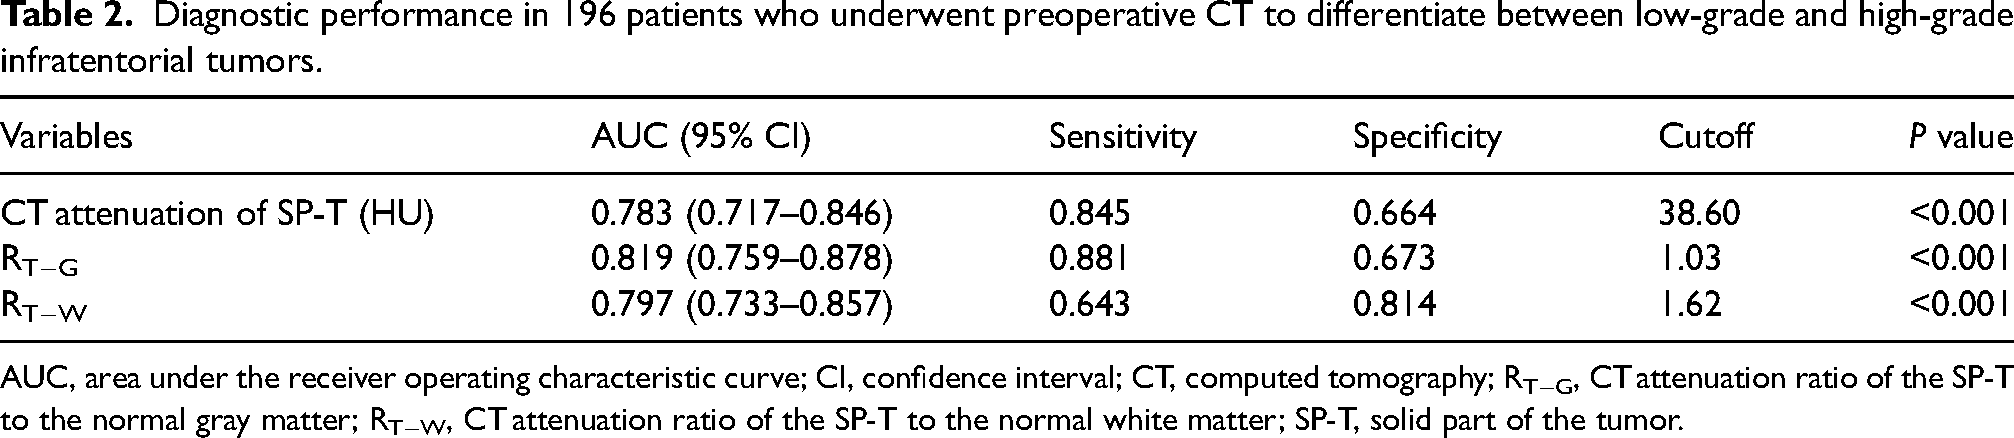
AUC, area under the receiver operating characteristic curve; CI, confidence interval; CT, computed tomography; RT−G, CT attenuation ratio of the SP-T to the normal gray matter; RT−W, CT attenuation ratio of the SP-T to the normal white matter; SP-T, solid part of the tumor.
In the 56 patients who underwent both preoperative NCCT and MRI with DWI, the AUCs of CT attenuation of the SP-T, RT−G, RT−W, and ADC value were 0.833, 0.887, 0.850, and 0.910, respectively. When the CT attenuation of the SP-T threshold was 38.00 HU, the sensitivity and specificity for diagnosing low-grade and high-grade infratentorial tumors were 0.900 and 0.731, respectively. When the RT−G threshold was 0.96, the sensitivity and specificity were 0.967 and 0.731, respectively. When the RT−W threshold was 1.55, the sensitivity and specificity were 0.800 and 0.811, respectively. When the ADC value threshold was 1.023 × 10⁻³ mm2/s, the sensitivity and specificity were 0.833 and 1.000, respectively. The AUC of the ADC value was not significantly different from that of the CT attenuation values of the SP-T, RT−G, and RT−W (P = 0.219, 0.632, and 0.267, respectively) (Fig. 7, Table 3).
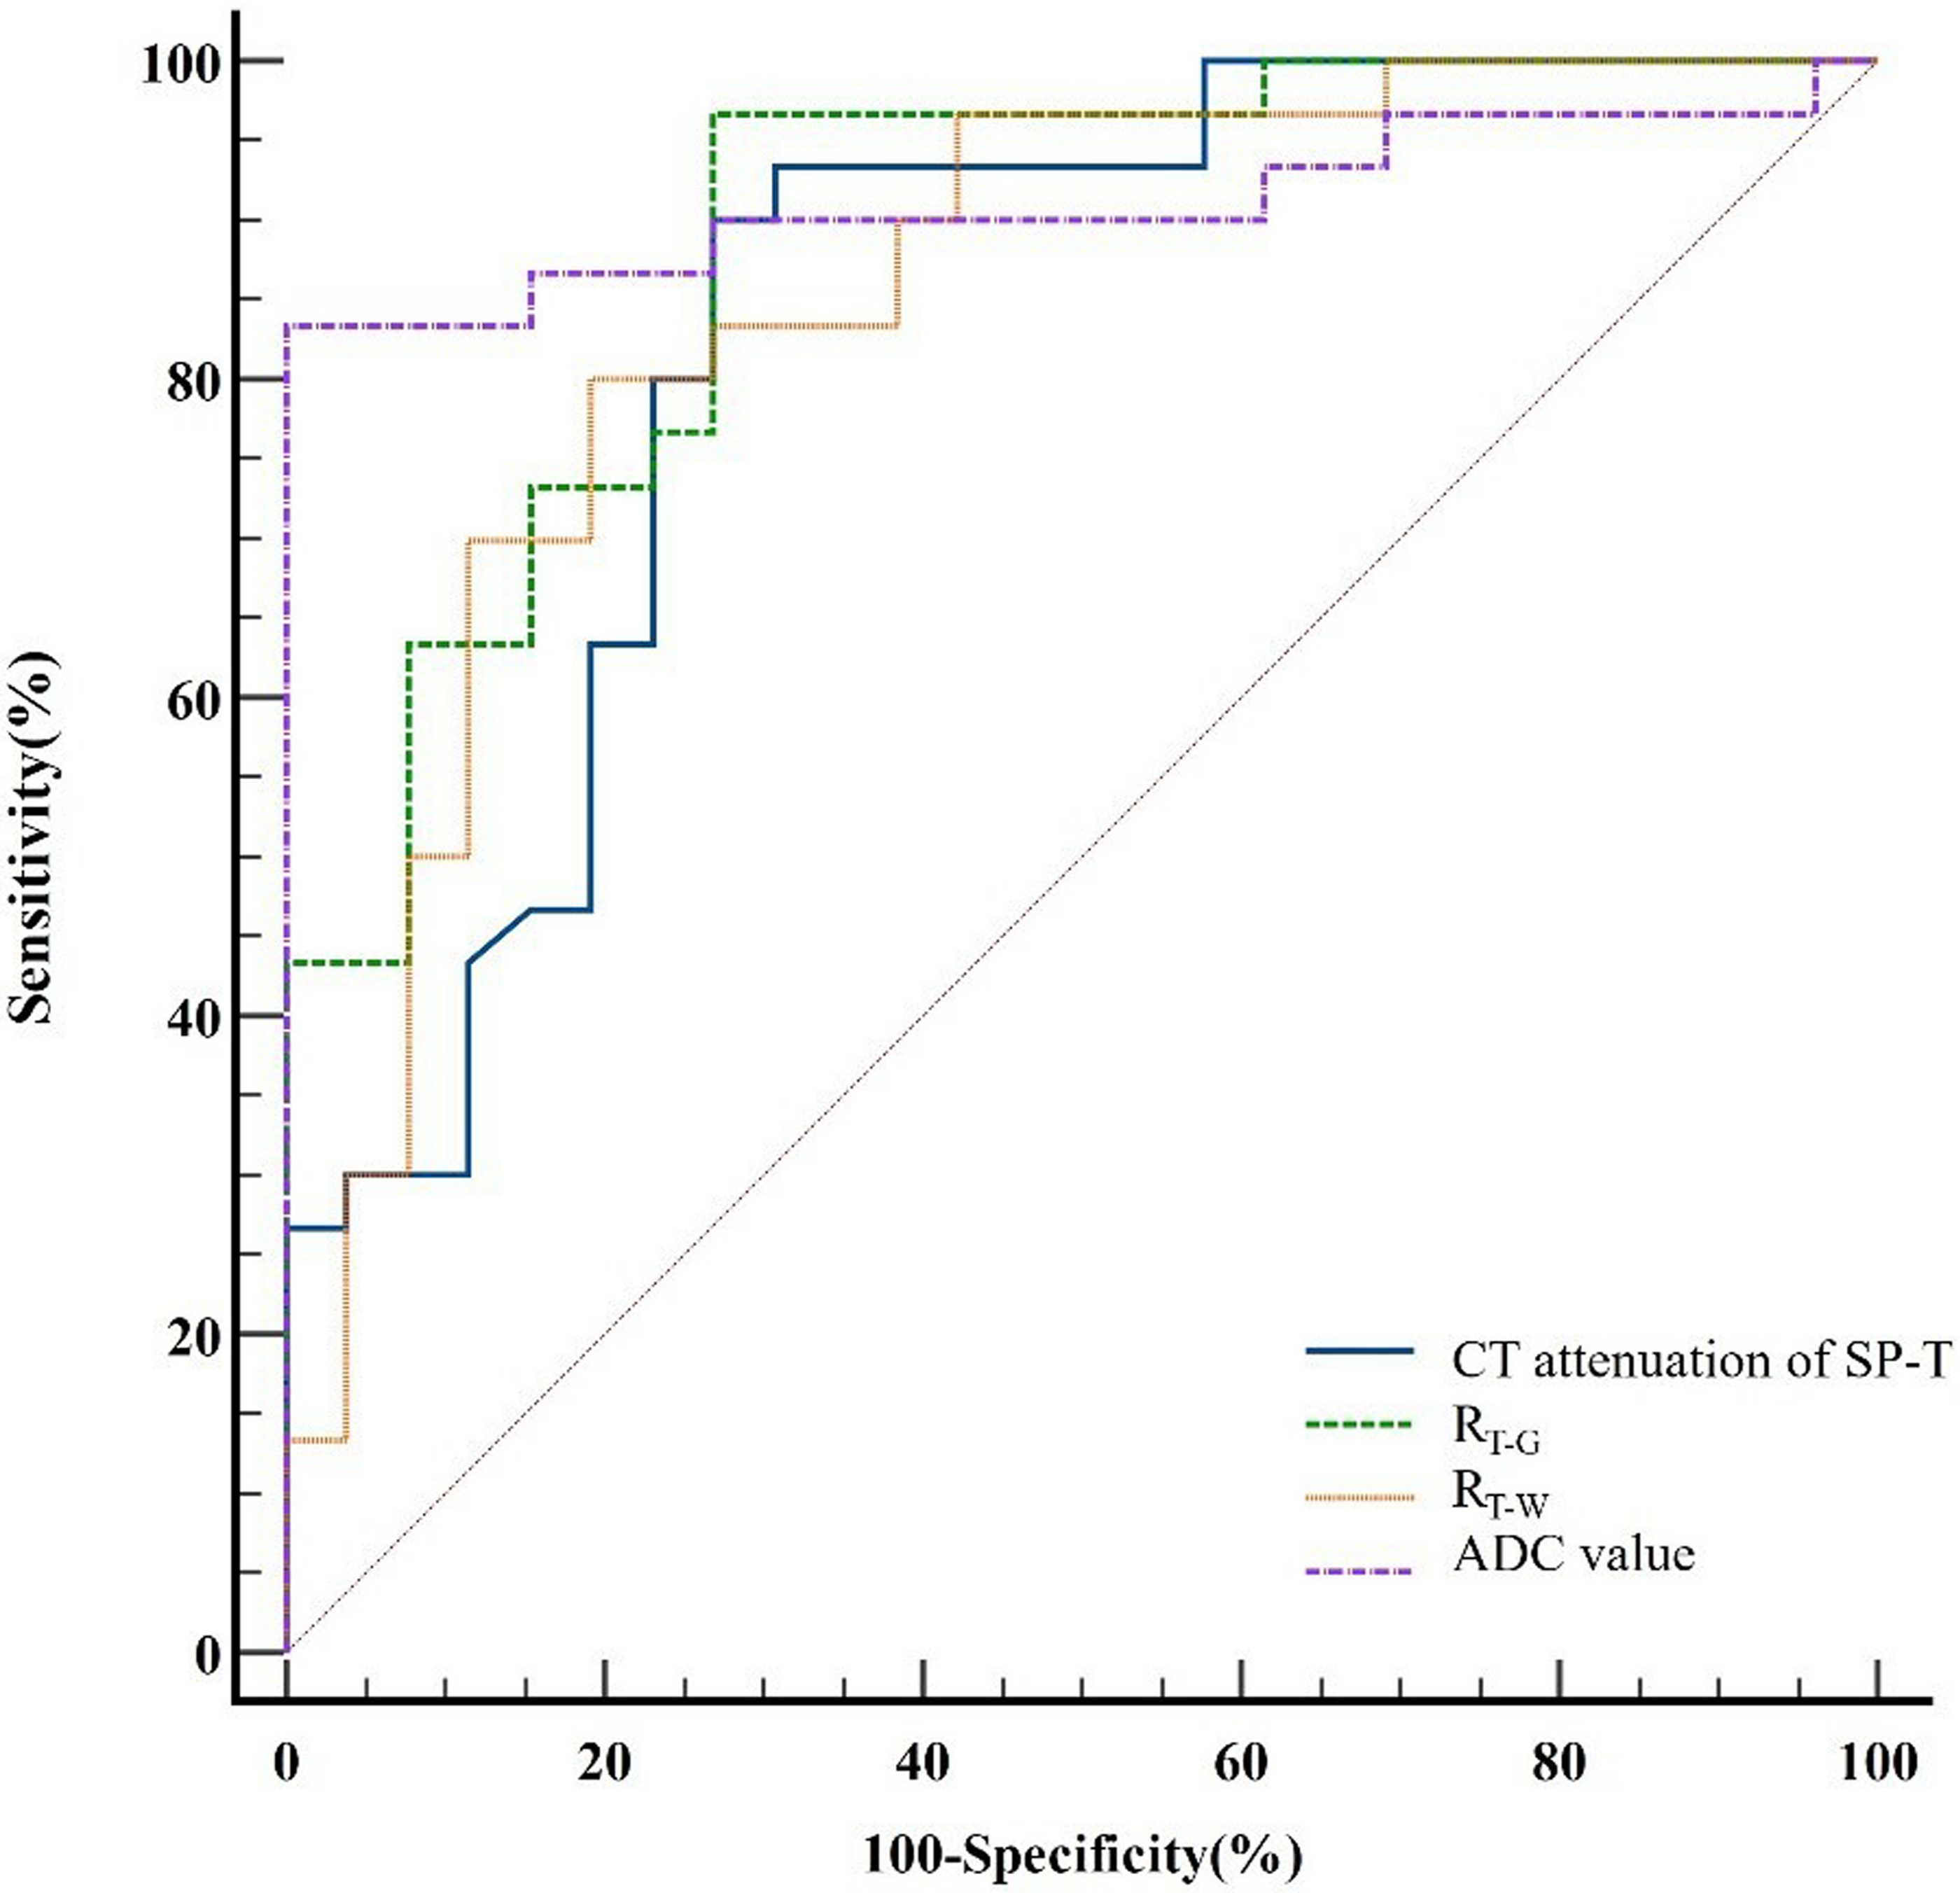
ROC curve analysis of the CT attenuation of the solid part of the tumor (SP-T), the CT attenuation ratio of the SP-T to normal gray matter (RT−G), the CT attenuation ratio of the SP-T to normal white matter (RT−W), and the ADC value for distinguishing low-grade from high-grade infratentorial tumors in the 56 patients who underwent both preoperative NCCT and MRI with DWI. The AUC of the ADC value (0.910) was not significantly different from that of the CT attenuation values of the SP-T (0.833), RT−G (0.887), and RT−W (0.850). AUC, area under the ROC curve; ADC, apparent diffusion coefficient; CT, computed tomography; DWI, diffusion-weighted imaging; MRI, magnetic resonance imaging; NCCT, non-contrast CT; ROC, receiver operating characteristic.
Diagnostic performance in 56 patients who underwent preoperative CT and MRI with DWI to differentiate between low-grade and high-grade infratentorial tumors.
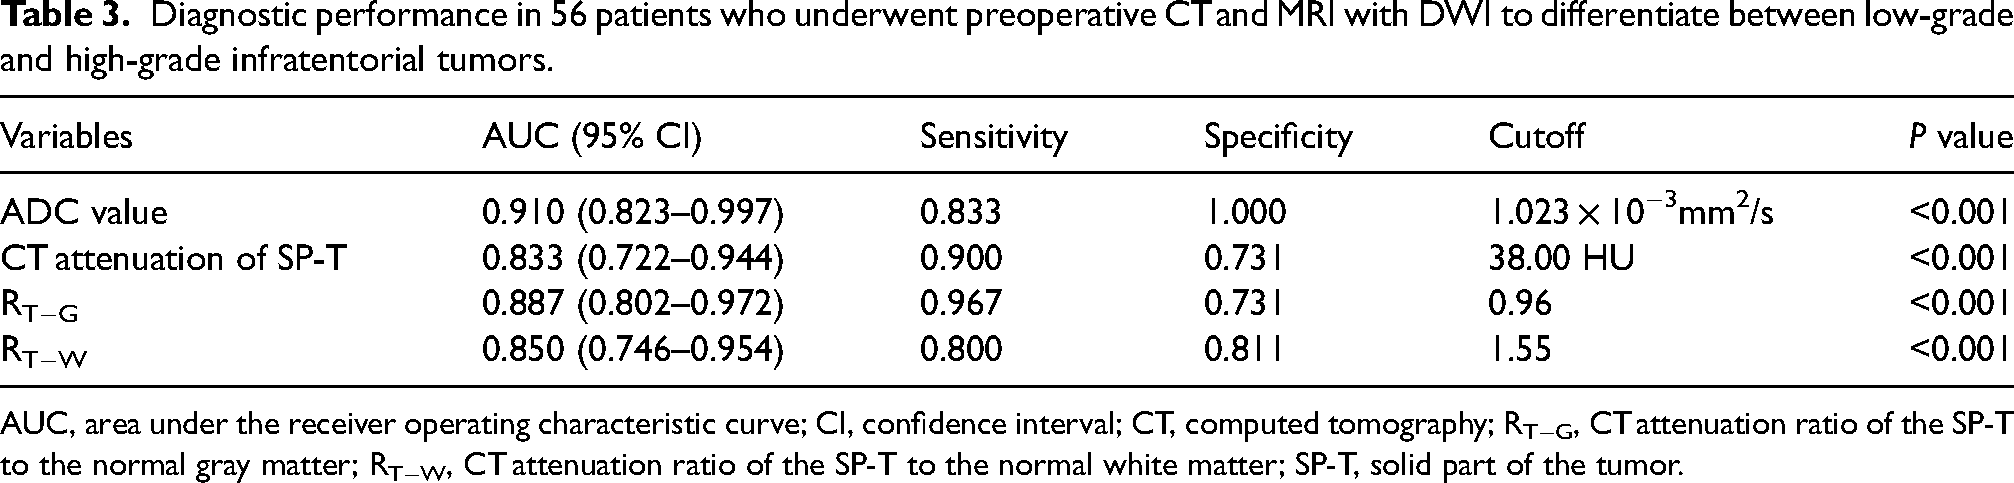
AUC, area under the receiver operating characteristic curve; CI, confidence interval; CT, computed tomography; RT−G, CT attenuation ratio of the SP-T to the normal gray matter; RT−W, CT attenuation ratio of the SP-T to the normal white matter; SP-T, solid part of the tumor.
Inter-observer agreement
Inter-observer agreement was excellent for the CT attenuation of the SP-T (ICC = 0.983, 95% confidence interval [CI] = 0.978–0.987), the CT attenuation of the caudate nucleus (ICC = 0.945, 95% CI = 0.927–0.958), and the CT attenuation of the centrum semiovale (ICC = 0.932, 95% CI = 0.911–0.948).
Discussion
It is widely recognized that the tumor grade is important for the prognosis of the disease and the choice of treatment strategy (13).
MRI currently stands as the go-to method for assessing brain tumor patients, offering precise data on the initial diagnosis, ongoing therapy, and potential growth (14,15). Among patients with infratentorial tumors, the CNS WHO grade in medical imaging is largely based on the ADC value using MRI with DWI (4–10,16–21). However, there is a significant probability that a patient will undergo an NCCT examination in the emergency department or during a physical examination (11). CT serves as an optional and convenient imaging modality when MRI is contraindicated or unsuitable, such as for patients who are susceptible to claustrophobia or physically restless children. Chakrabarti et al. demonstrated that dual energy computed tomography electron density measurements in cerebral gliomas are predictive of preoperative differentiation of low-grade gliomas from high-grade gliomas (22). The diagnostic efficacy (AUC = 0.85) was similar to that of this study, but its subjects were only gliomas, and the measurements required postprocessing. Ahmad et al. revealed that perfusion CT can also distinguish low-grade gliomas from high-grade gliomas (23). However, the study was also only for gliomas, and the use of contrast injection involves the risk of complications, while enhanced scans add additional costs and radiation doses.
This study revealed that low-grade infratentorial tumors presented significantly lower mean CT attenuation (35.32 ± 8.19 HU) of the SP-T than did high-grade infratentorial tumors (42.91 ± 5.56 HU), and the AUC value of the CT attenuation of the SP-T was 0.783, which means that CT attenuation on NCCT enables the differentiation of low-grade and high-grade infratentorial tumors with relatively high diagnostic performance. For more precise results, reference is made to studies by Kiani et al. and Tanoue et al. using CT attenuation of the caudate nucleus and centrum semiovale as calibration values (24,25). The AUC values of RT−G and RT−W were 0.819 and 0.797, respectively. Judging by these three evaluation indicators, the diagnostic performance of RT−G clearly eclipses that of the other indicators.
Korgün et al. demonstrated that high-grade tumors are characterized by high cellularity, a low extracellular space, and a large nuclear area with a high nuclear-to-cytoplasmic ratio, which results in a lower ADC value (5). Recent investigations have shown that the increase in CT attenuation in vascular density is due to cellular agglomeration within the vessel (26–29). Riedel et al. revealed that NCCT may demonstrate a hyperdense middle cerebral artery sign as a highly specific marker of thrombotic vascular occlusion (26). Moreover, a high hematocrit can cause vascular hyperdensities resembling thrombi (26,27). Our study demonstrated that there were no statistically significant differences between the AUCs of the ADC value and CT-related parameters. Therefore, CT attenuation may have a positive correlation with cellularity. This may explain why the CT attenuations of the cavernous hemangiomas in our study were relatively high, making them challenging to distinguish from high-grade infratentorial tumors.
Our simple NCCT ratio approach provides quantitative data and therefore might be useful in clinical practice to assist clinicians in evaluating NCCT imaging in patients with infratentorial tumors to gain more useful information. In this study, nearly all categories of original infratentorial tumors were included and a considerable number of patients were evaluated. Although the absolute numbers of some of the tumor types (lymphomas, embryonal tumors with multilayered rosettes, and Atypical teratoid rhabdoid tumor (ATRTs) were rather small, their incidence and epidemiology match. The benefits of a concise execution time, modest costs, high spatial resolution, and comprehensive application of NCCT have been fully leveraged, and NCCT has been tapped for additional auxiliary diagnostic value. Given the ability of NCCT to differentiate low-grade from high-grade infratentorial tumors, clinicians are empowered to enhance patient management strategies such as determining applicable MR functional sequences including DWI and MR spectroscopy, scheduling surgical procedures at the right time, and so on (30).
The present study has some limitations. First, this approach is not suitable for infratentorial tumors with few solid components or pure cystic infratentorial tumors because an ideal ROI may be difficult to identify. Second, there are certain errors in the diagnosis of tumors rich in blood vessels and sinuses and some extracerebellar tumors without typical features such as those with hyperostosis of the underlying bone, a cerebral spinal fluid cleft around the tumor, and an enhanced dural tail (31,32). Finally, this was a single-center retrospective study, and not all the patients in our study underwent both preoperative NCCT and MRI with DWI.
In conclusion, CT attenuation of the SP-T, RT−G. and RT−W could help differentiate high-grade and low-grade infratentorial tumors with high diagnostic performance when the SP-T is easy to identify. Moreover, the diagnostic performance of the CT-related parameters was not significantly different from that of the ADC value. NCCT is a simple and convenient method for identifying low-grade and high-grade infratentorial tumors, which facilitates the streamlined selection of MRI sequences and represents a substantial advantage for patients.
Footnotes
Acknowledgments
We gratefully acknowledge the technical support provided by Rulin Xu (from Canon Medical Systems) and Huanhuan Su (from Department of Radiology, Guangdong Second Provincial General Hospital) throughout this study.
Declaration of conflicting interests
The authors declared no potential conflicts of interest with respect to the research, authorship, and/or publication of this article.
Funding
The authors disclosed receipt of the following financial support for the research, authorship, and/or publication of this article: This work was supported by Natural Science Foundation of Guangdong Province (Guangdong Basic and Applied Basic Research Foundation, No. 2024A1515012098).