
Abstract
Background
Differentiating small hepatic metastases from hemangiomas can be challenging on visual assessment.
Purpose
To evaluate the diagnostic performance of magnetic resonance imaging (MRI) radiomics models based on T2-weighted (T2W) imaging in differentiating small hepatic metastases from hemangiomas.
Material and Methods
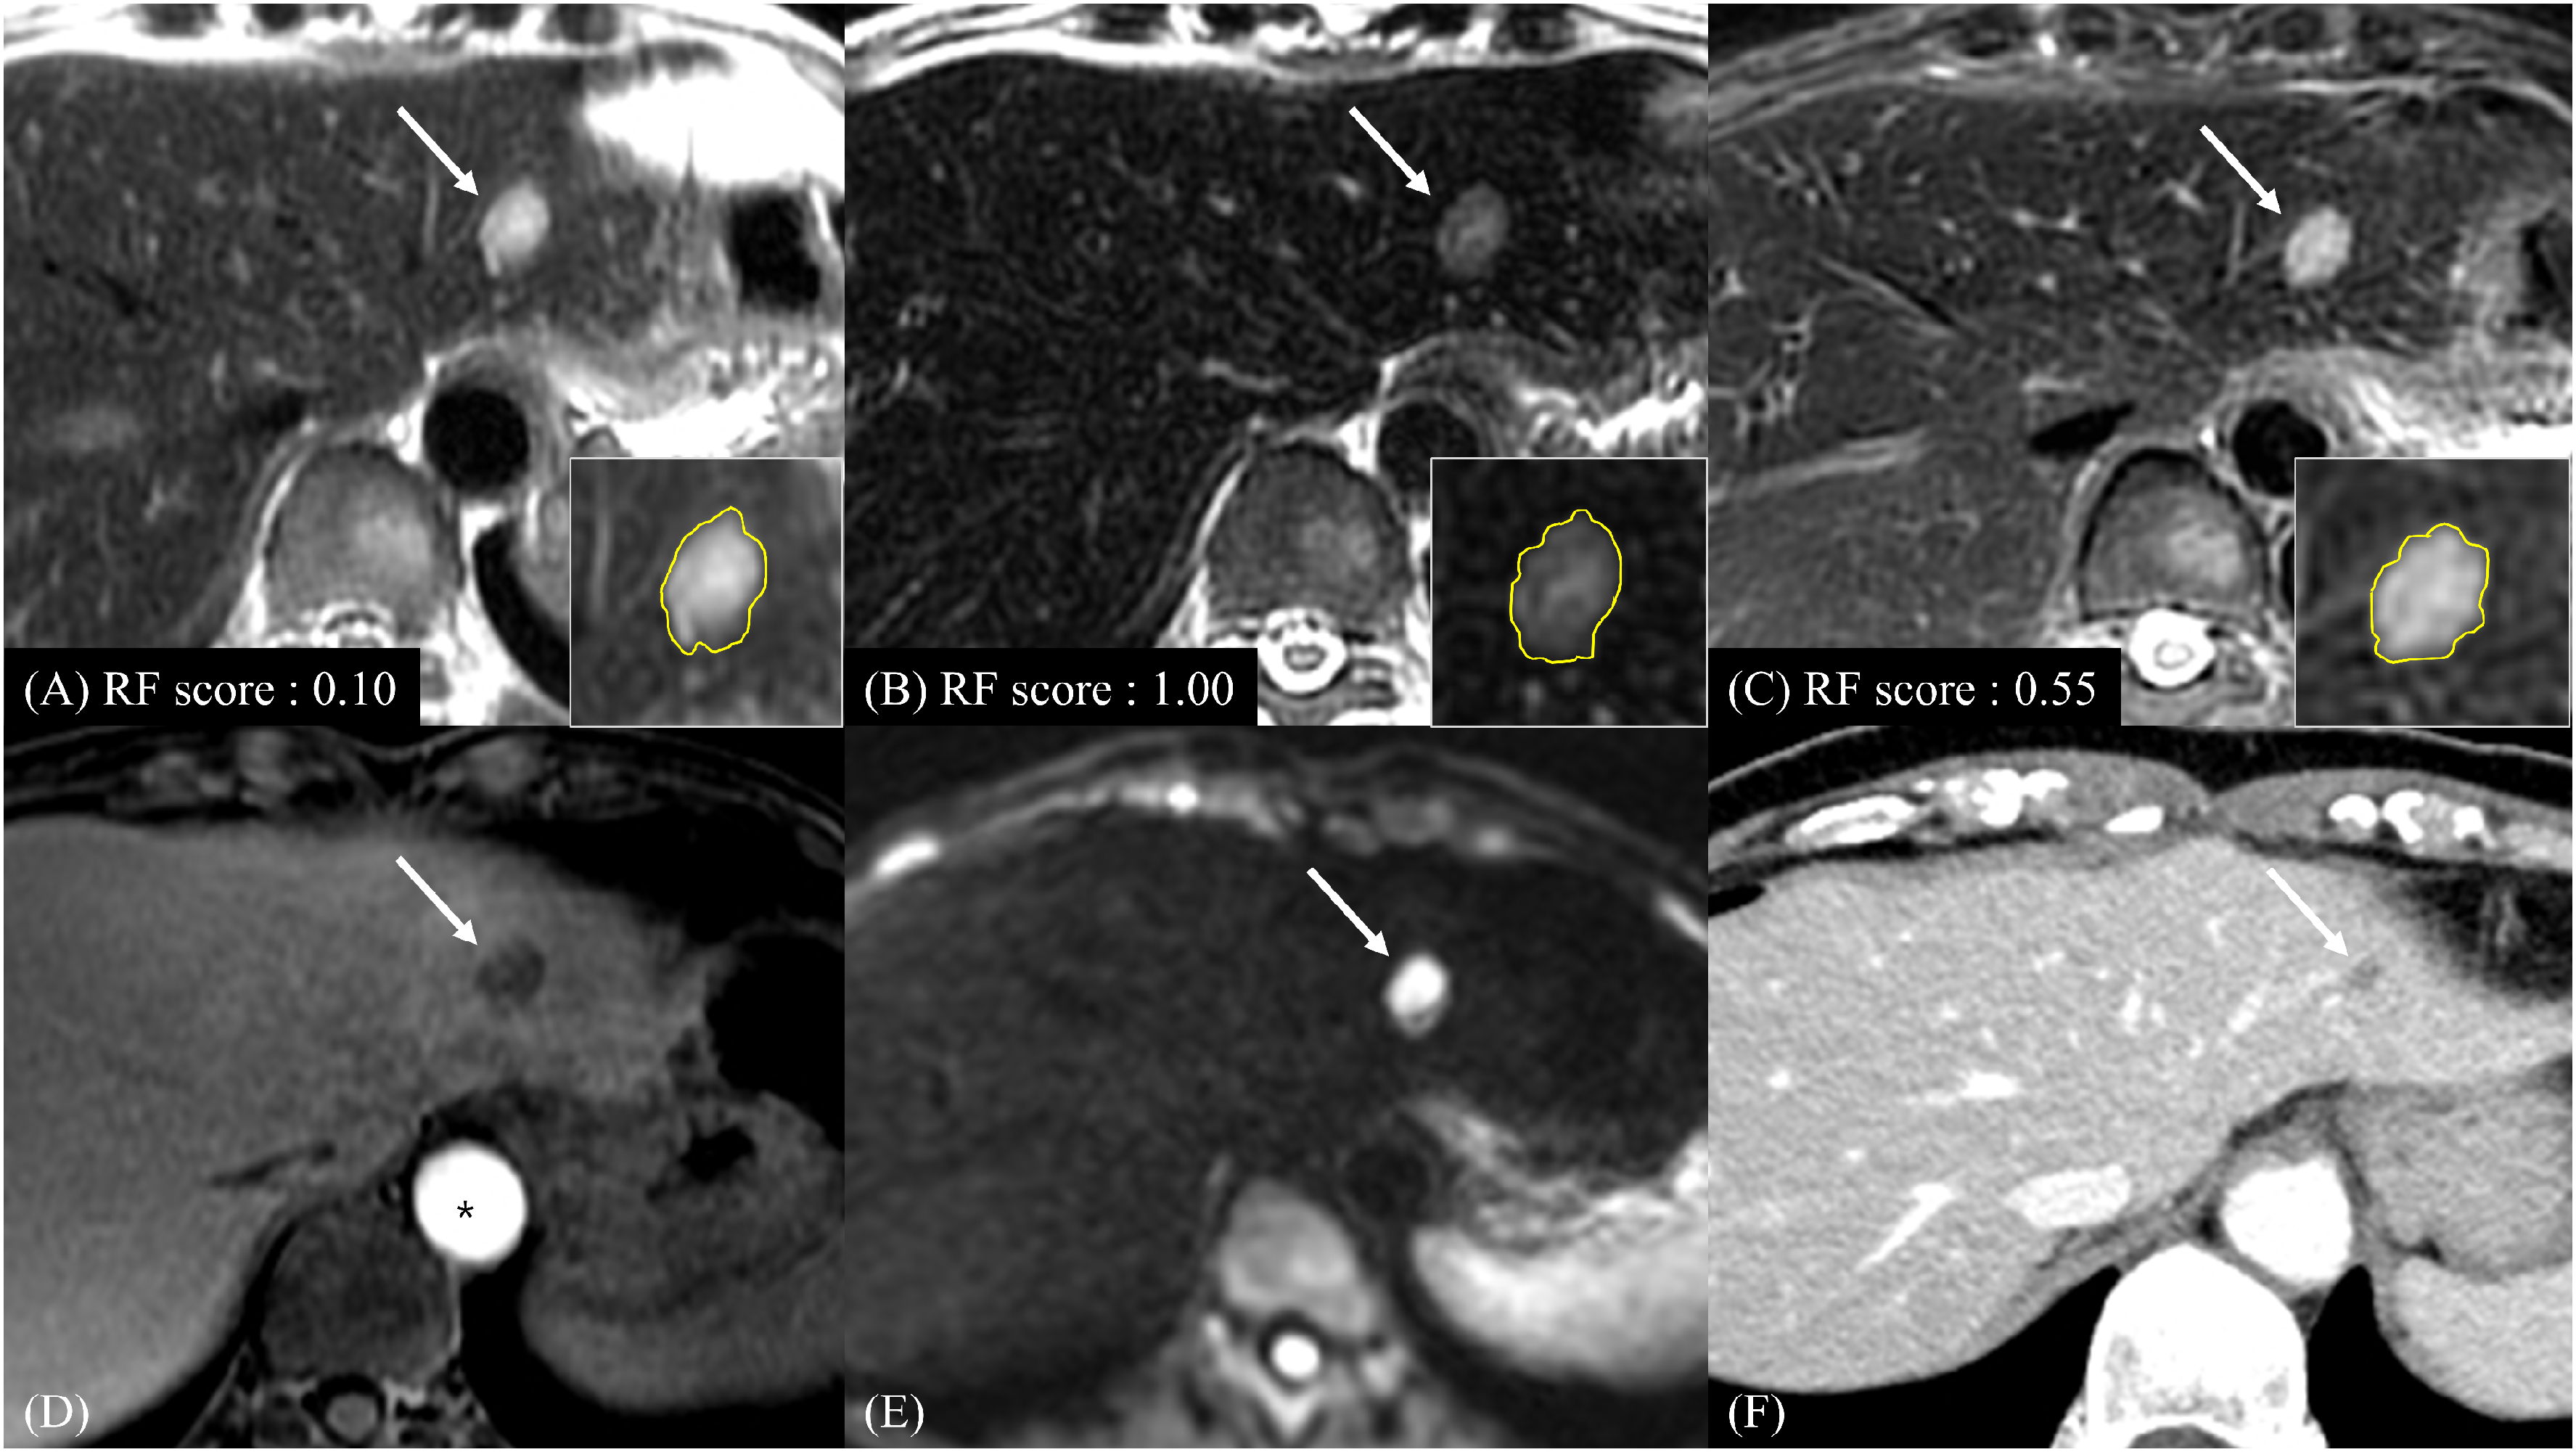
This retrospective study included patients with small (≤2 cm) hepatic metastases from colorectal cancer or hemangiomas who underwent liver MRI between August 2018 and January 2024. Datasets were divided into training, internal, and external validation sets based on MRI scanner type. Manual segmentation was performed on conventional T2W, heavily T2W, and fat-suppressed (FS)-T2W imaging. Random forest models were developed using 10-fold cross-validation on 10 selected radiomics features. AUCs were calculated to evaluate model performance. Before segmentation, each hepatic lesion in the validation sets was categorized into metastasis, hemangioma, or indeterminate lesion according to visual assessment on T2W imaging by two radiologists in consensus.
Results
A total of 285 patients (148 men; mean age=55.8 ± 12.5 years) were included: training (140 patients: 151 metastases, 155 hemangiomas), internal (86 patients: 87 metastases, 80 hemangiomas), and external (59 patients: 37 metastases, 69 hemangiomas) validation sets. AUCs for conventional/heavily/FS-T2W imaging were 0.976/0.972/0.946 (training), 0.979/0.991/0.989 (internal validation), and 0.969/0.976/0.809 (external validation), respectively. Among visually indeterminate lesions, 6/7 lesions in the internal validation set and 5/8 lesions in the external validation set were correctly classified using radiomics scores.
Conclusion
Radiomics models based on T2W imaging exhibit excellent performance in differentiating small hepatic metastases from hemangiomas and may contribute to the correct classification of visually indeterminate hepatic lesions.
Introduction
Accurate detection and characterization of hepatic focal lesions are critical for optimal treatment planning. Since surgical resection of metastatic lesions can improve overall survival (1,2), early identification of hepatic metastases provides an opportunity for curative resection and helps avoid unnecessary surgery. The size and number of hepatic metastases significantly influence the therapeutic approach (3). Thus, it is crucial to differentiate hepatic metastases from other benign lesions with high confidence.
Currently, liver magnetic resonance imaging (MRI) is widely used and regarded as a reliable imaging modality for the diagnostic workup of hepatic metastases, owing to its high soft-tissue resolution and capability for multiparametric imaging (4,5). On liver MRI, hepatic metastases typically exhibit moderate signal intensity on T2-weighted (T2W) imaging, diffusion restriction, and rim enhancement on contrast-enhanced images (5). In addition to diffusion-weighted imaging (DWI), the use of hepatocyte-specific contrast agents enhances the diagnostic performance of liver MRI for detecting hepatic metastases, especially small lesions (6–11). Nevertheless, the most clinically relevant challenge in hepatic metastasis evaluation may involve detecting small lesions and accurately characterizing them.
Radiomics is an emerging and valuable tool that involves the extraction and analysis of numerous quantitative features from conventional medical images such as computed tomography (CT) and MRI (12–14). These quantifiable datasets are subsequently analyzed using machine learning algorithms to derive information associated with disease diagnosis, prognosis, and treatment response (14–16). Several recent studies have applied MRI-based radiomics to the evaluation of hepatic metastases, using features derived from a variety of MRI sequences (17–22). Among various machine learning classifiers, random forest (RF) algorithms have demonstrated robustness and interpretability. In addition, they can handle high-dimensional, heterogeneous radiomic data and capture interactions between features without prior specifications (23–25). Although recent deep learning and transformer-based approaches have shown promise in radiomics, they often lack interpretability and generally require large datasets (26,27).
In liver MRI, T2W imaging is a fundamental sequence for characterizing hepatic lesions. It plays a key role in distinguishing solid lesions from fluid-filled lesions such as hemangiomas and cysts (28). Furthermore, advanced T2W imaging techniques—such as heavily T2W and fat-suppressed T2W (FS-T2W) imaging—have been developed and incorporated into routine liver MRI protocols (4,29). For small lesions, which are often challenging to differentiate, integrating information from multiple T2W imaging sequences can improve lesion characterization and enhance diagnostic confidence.
Therefore, the aim of the present study was to develop and validate MRI radiomics models using RF algorithm based on three T2W imaging sequences—conventional T2W, heavily T2W, and FS-T2W imaging—and to evaluate their diagnostic performance to differentiate small (≤ 2 cm) hepatic metastases from hemangiomas, including an assessment of their potential utility in visually indeterminate cases.
Material and Methods
This retrospective, single-center study was approved by the Institutional Review Board of Konkuk University Medical Center (2024-02-047), and the requirement for informed consent was waived.
The software package used in the study was provided by Siemens Healthineers. No employees from the company were involved in data collection or processing, aside from providing technical information about the software. The authors (S.P. and M.H.Y.
Patient selection
Between August 2018 and January 2024, 5537 gadoxetic acid–enhanced liver MRI examinations were performed in 2647 patients for liver evaluation at our institution. An experienced radiologist (M.H.Y., with 15 years of experience in abdominal imaging) searched the radiology database and identified eligible patients and hepatic lesions. The size and location of each lesion were assessed based on the hepatobiliary phase images. Either small (≤ 2 cm) hepatic metastases or small (≤ 2 cm) hemangiomas were consecutively included in this study based on the following inclusion criteria: (i) de novo hepatic metastases from colorectal cancer or hemangiomas measuring 5–20 mm in size were collected; (ii) lesions that were clearly delineated on all three T2W imaging sequences were included to allow lesion segmentation; and (iii) up to five lesions per patient were included, prioritizing malignant over benign lesions and selecting discrete smaller lesions. The exclusion criteria were as follows: (i) hepatic metastases originating from non-colorectal or double primary malignancies (175 exams from 159 patients); (ii) hepatic metastases treated before gadoxetic acid–enhanced liver MRI (347 exams from 148 patients); (iii) indeterminate diagnoses (26 exams from 26 patients), including 16 exams with suspected metastases without predefined diagnostic evidence (as described in the supplementary material) and 10 exams with suspected hemangiomas that lacked consensus-based diagnosis; (iv) poor image quality (18 exams from 17 patients); and (v) redundant lesions (108 exams from 48 patients), excluded to ensure non-overlapping validation and training sets (Fig. 1). A total of 285 patients with 579 lesions (275 metastases and 304 hemangiomas) were ultimately included.
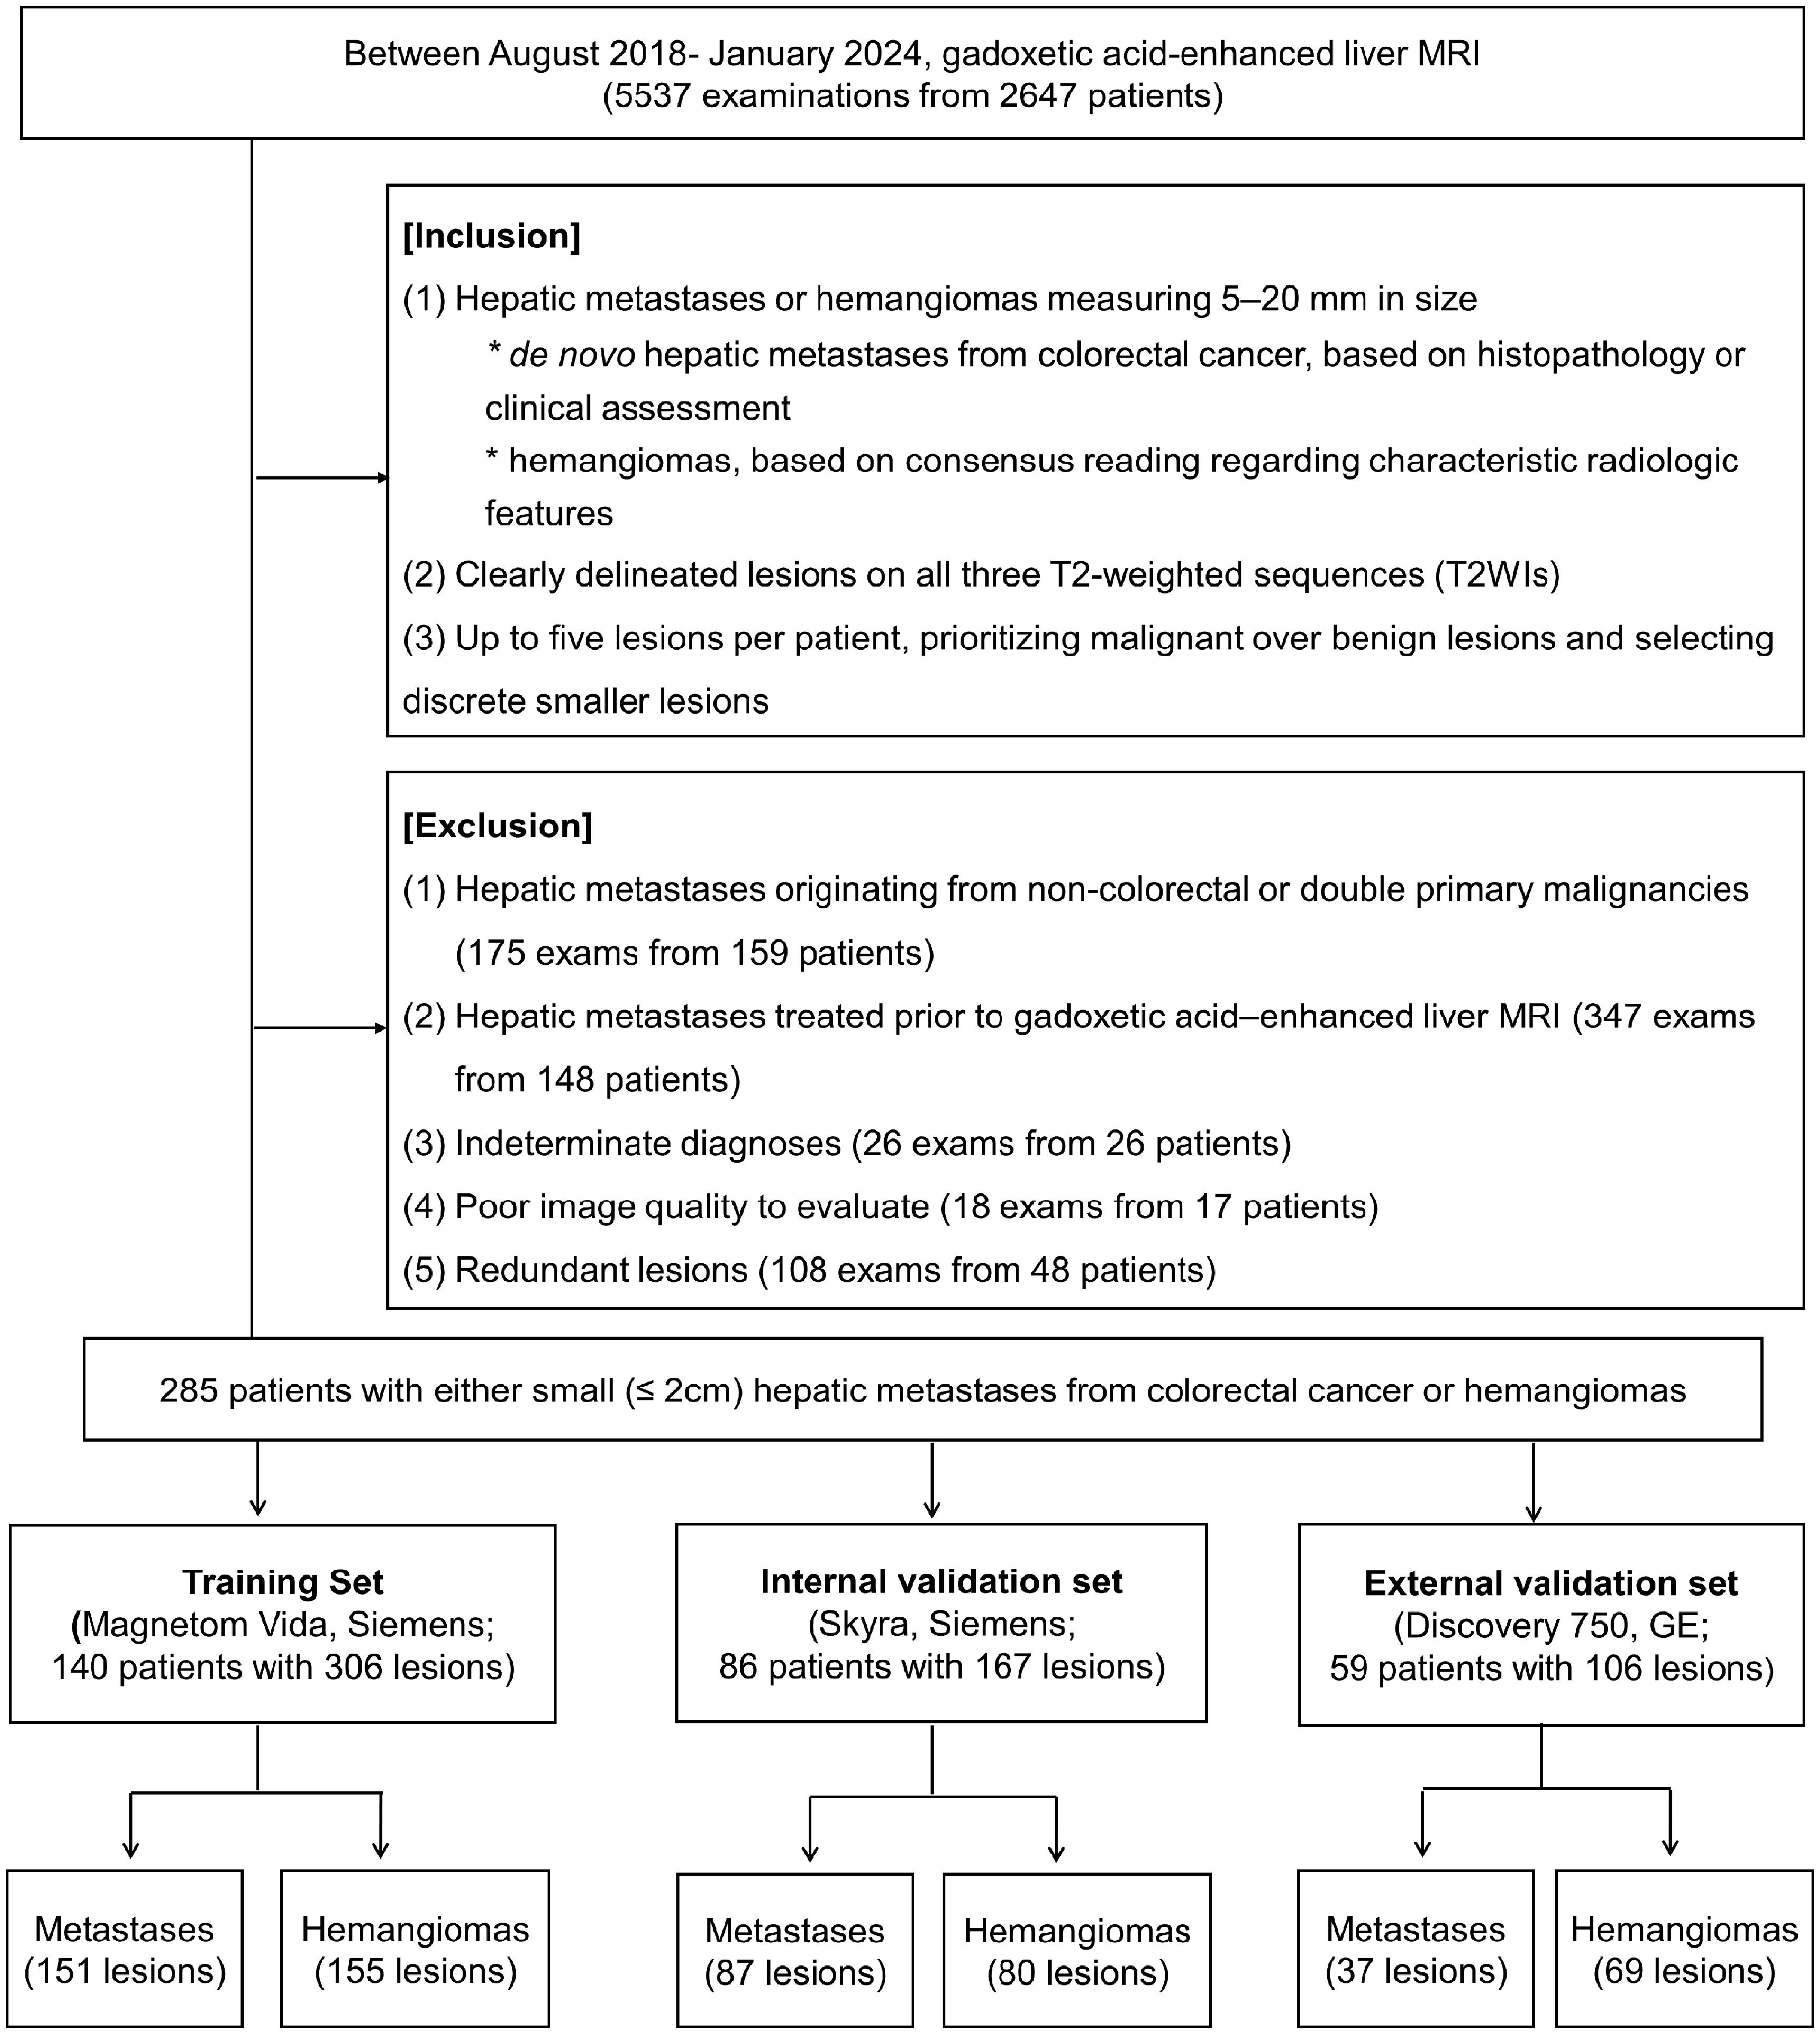
Patient flow chart.
The diagnostic criteria for hepatic metastases and hemangiomas are detailed in Appendix A in the supplementary material.
Image acquisition
The scan parameters for conventional T2W, heavily T2W, and FS-T2W imaging sequences across scanners are summarized in Table 1. Specifically, FS-T2W imaging was acquired using the spectral attenuated inversion recovery (SPAIR) technique on Siemens scanners and the chemical shift selective saturation (CHESS) technique on the GE scanner.
Scan parameters of three different T2W imaging sequences.
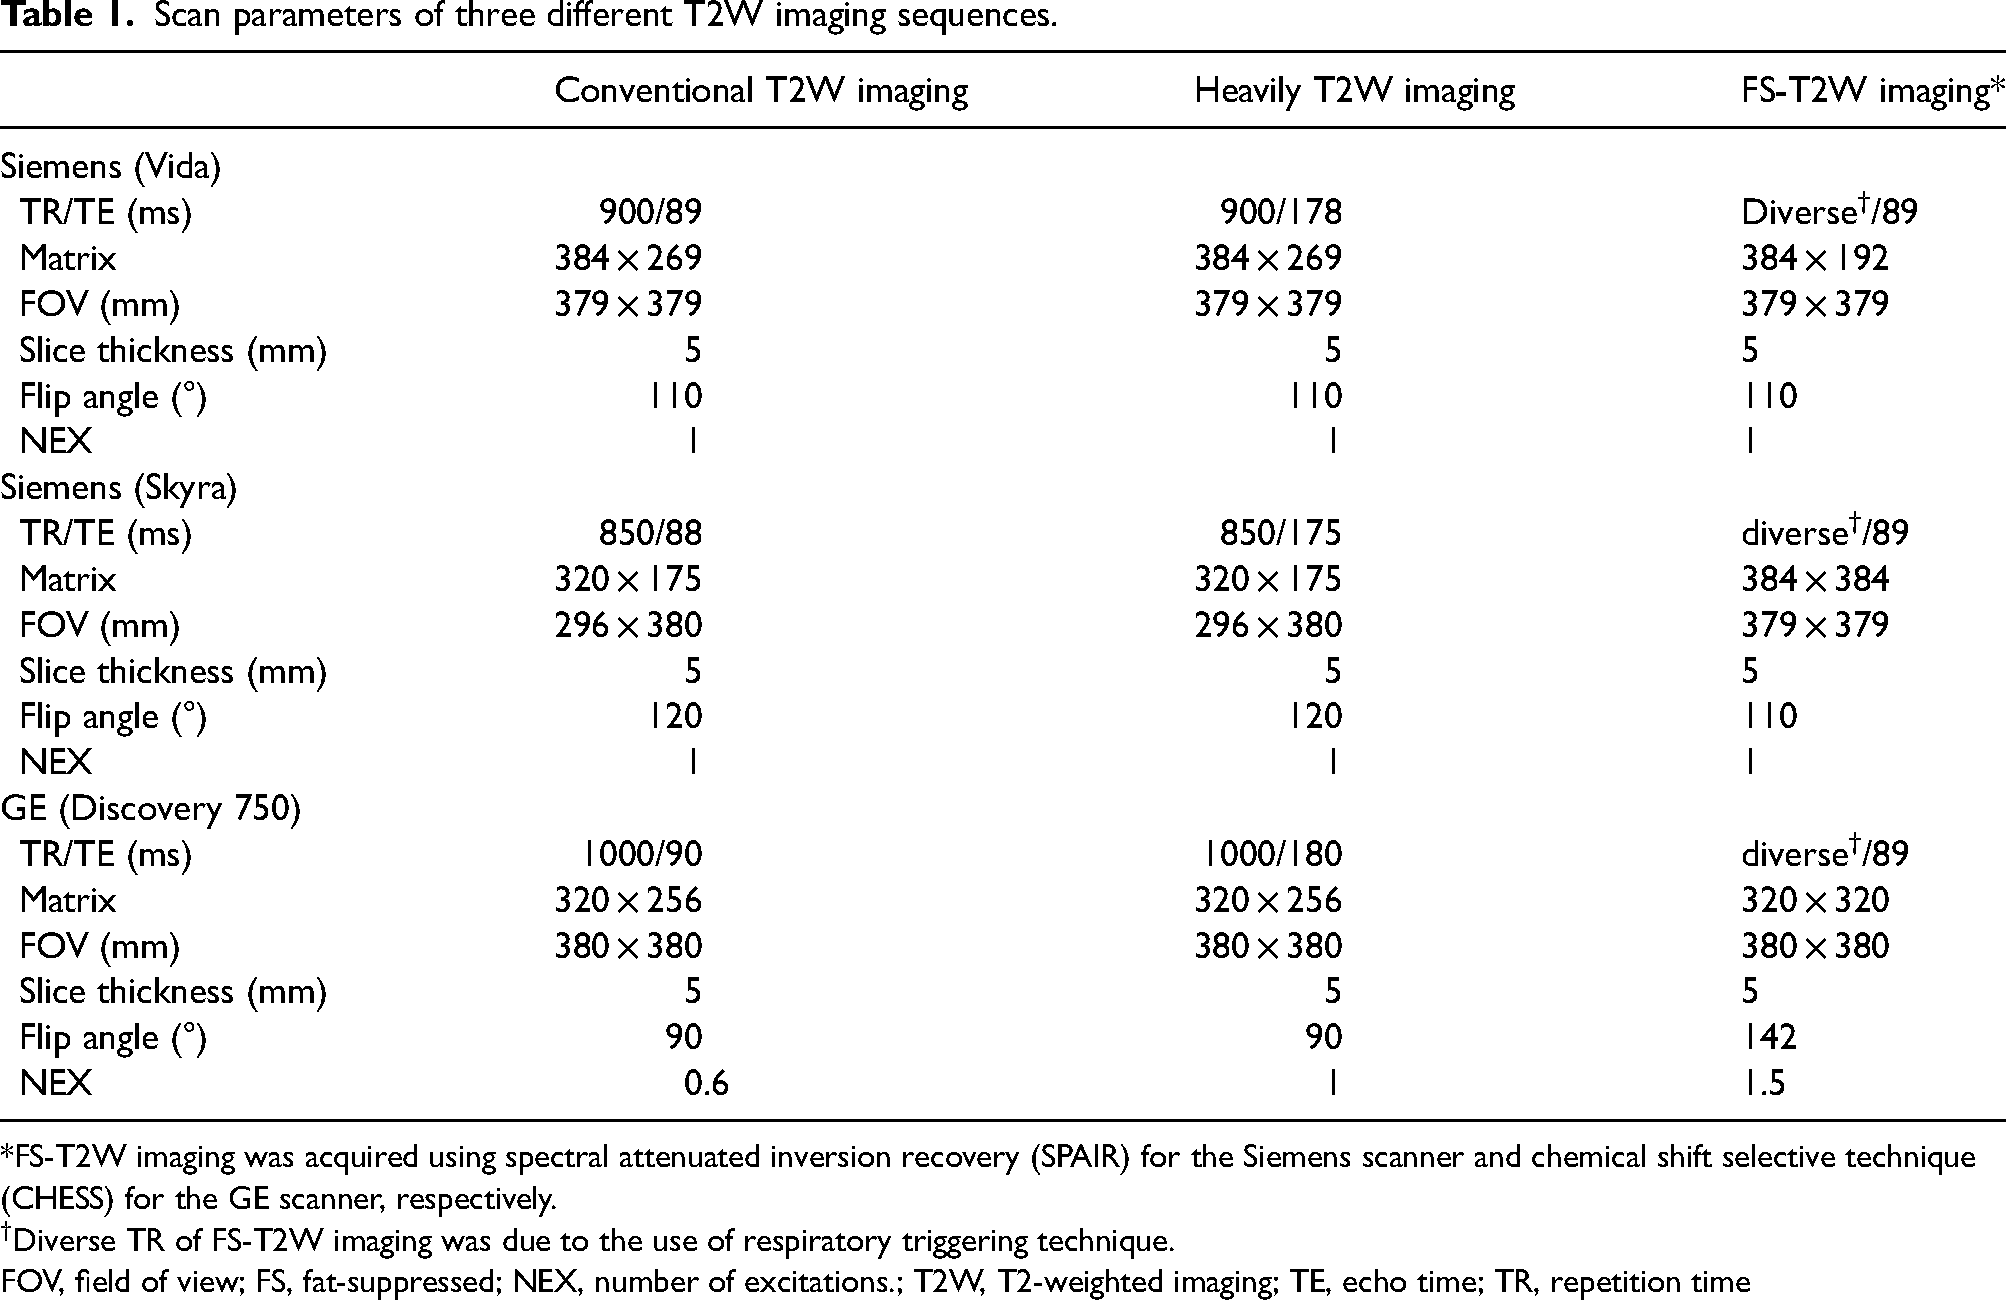
*FS-T2W imaging was acquired using spectral attenuated inversion recovery (SPAIR) for the Siemens scanner and chemical shift selective technique (CHESS) for the GE scanner, respectively.
Diverse TR of FS-T2W imaging was due to the use of respiratory triggering technique.
FOV, field of view; FS, fat-suppressed; NEX, number of excitations.; T2W, T2-weighted imaging; TE, echo time; TR, repetition time
Additional scan protocols are provided in Appendix B in the supplementary material.
Development and testing of the radiomics model
Lesion segmentation
Axial conventional T2W, heavily T2W, and FS-T2W images were retrieved for each subject and loaded into a dedicated software package (syngo.via Frontier, version 1.4.1; Siemens Healthineers) for segmentation. A radiologist (S.P., with 5 years of experience in abdominal imaging), who was not involved in patient selection and was blinded to the lesion diagnosis, manually outlined the hepatic lesion on the image displaying the largest lesion diameter for each sequence. The hepatobiliary phase image was used as a reference, with each lesion marked accordingly.
Radiomics feature extraction
The syngo.via Frontier software was used for radiomics processing (30). This platform was developed based on the PyRadiomics library (version 3.0.1; https://github.com/Radiomics/pyradiomics) and the scikit-learn machine learning library (https://scikit-learn.org/stable/modules/generated/sklearn.ensemble.RandomForestClassifier.html) (31). MRI scans were resampled to a spatial resolution of 1 × 1 × 1 mm3 using linear interpolation and discretized with a bin width of 25 signal intensity units. A total of 854 radiomics features were extracted, including 110 original features and 744 wavelet-filtered features.
Feature selection and radiomics model development
In the training set, radiomics features were reduced to 10 using the classic minimum redundancy maximum relevance algorithm based on the R2 difference method (32). The algorithm selects features that are highly relevant to the target classes while minimizing redundancy. From the 10 selected features, multivariate models were constructed, and subsequent RF models were developed by selecting the subset that yielded the maximum R2. Ten-fold cross-validation was performed, incorporating repeated iterations of feature selection and model development for each subset. The detailed parameters of the RF model are provided in Appendix C in the supplementary material. The average area under the receiver operating characteristic (ROC) curve (AUC) was calculated at a probability threshold of 0.5 to evaluate model performance in the training set, with scores >0.5 indicating metastasis and ≤0.5 indicating hemangioma. The trained RF model was then applied to the internal and external validation sets.
Two radiologists (S.P. and M.H.Y., described above) assigned visual malignancy ratings for each sequence on a 5-point scale (0.0, 0.25, 0.5, 0.75, and 1.0) by consensus after a 3-month washout period, blinded to the reference standard. The ratings were used as comparative benchmarks for the radiomics models.
Evaluation of radiomics models in visually indeterminate lesions
Before lesion segmentation, two radiologists (S.P. and M.H.Y., described above), who were unaware of the final diagnosis, categorized each hepatic lesion in the validation sets into three categories—hemangioma, metastasis, or indeterminate—based solely on the lesion's imaging appearance on three T2W imaging sequences, in consensus. One radiologist (M.H.Y.
Statistical analysis
Differences in demographic data among the training, internal validation, and external validation sets were assessed using the independent t-test for continuous variables and the chi-square test for categorical variables. A P value < 0.05 was considered statistically significant. The AUC, sensitivity, specificity, and accuracy of the RF models were calculated using a cutoff value of 0.5. Comparisons of AUC values from ROC curves were performed using MedCalc (version 19.0; MedCalc Software) with the DeLong method (33). Diagnostic performance was compared using McNemar’s test. For multiple comparisons among the three T2W imaging sequences, a Bonferroni-corrected P value <0.017 (0.05/3) was considered statistically significant. Decision curve analysis was conducted in R (version 4.5.1) with treat-all and treat-none as reference strategies (34).
Sample size estimation
The required sample size was estimated to be 112 lesions, including 39 positive lesions, to verify the adequacy of the external validation cohort using a post-hoc power analysis (details provided in Appendix D in the supplementary material). The external validation cohort consisted of 106 lesions, including 37 positive cases, suggesting nearly sufficient statistical power.
Results
Patient demographics and lesion characteristics
A total of 285 patients (148 men; mean age = 55.8 ± 12.5 years) with small (≤ 2 cm) hepatic metastases (275 lesions) from colorectal cancer and hemangiomas (304 lesions) were included in the study. According to the MRI scanner used, patients were assigned to the training set (140 patients; 151 hepatic metastases, 155 hemangiomas), internal validation set (86 patients; 87 hepatic metastases, 80 hemangiomas), and external validation set (59 patients; 37 hepatic metastases, 69 hemangiomas). Clinical demographics and lesion characteristics for the training, internal, and external validation sets are summarized in Table 2.
Patient demographics and lesion characteristics.
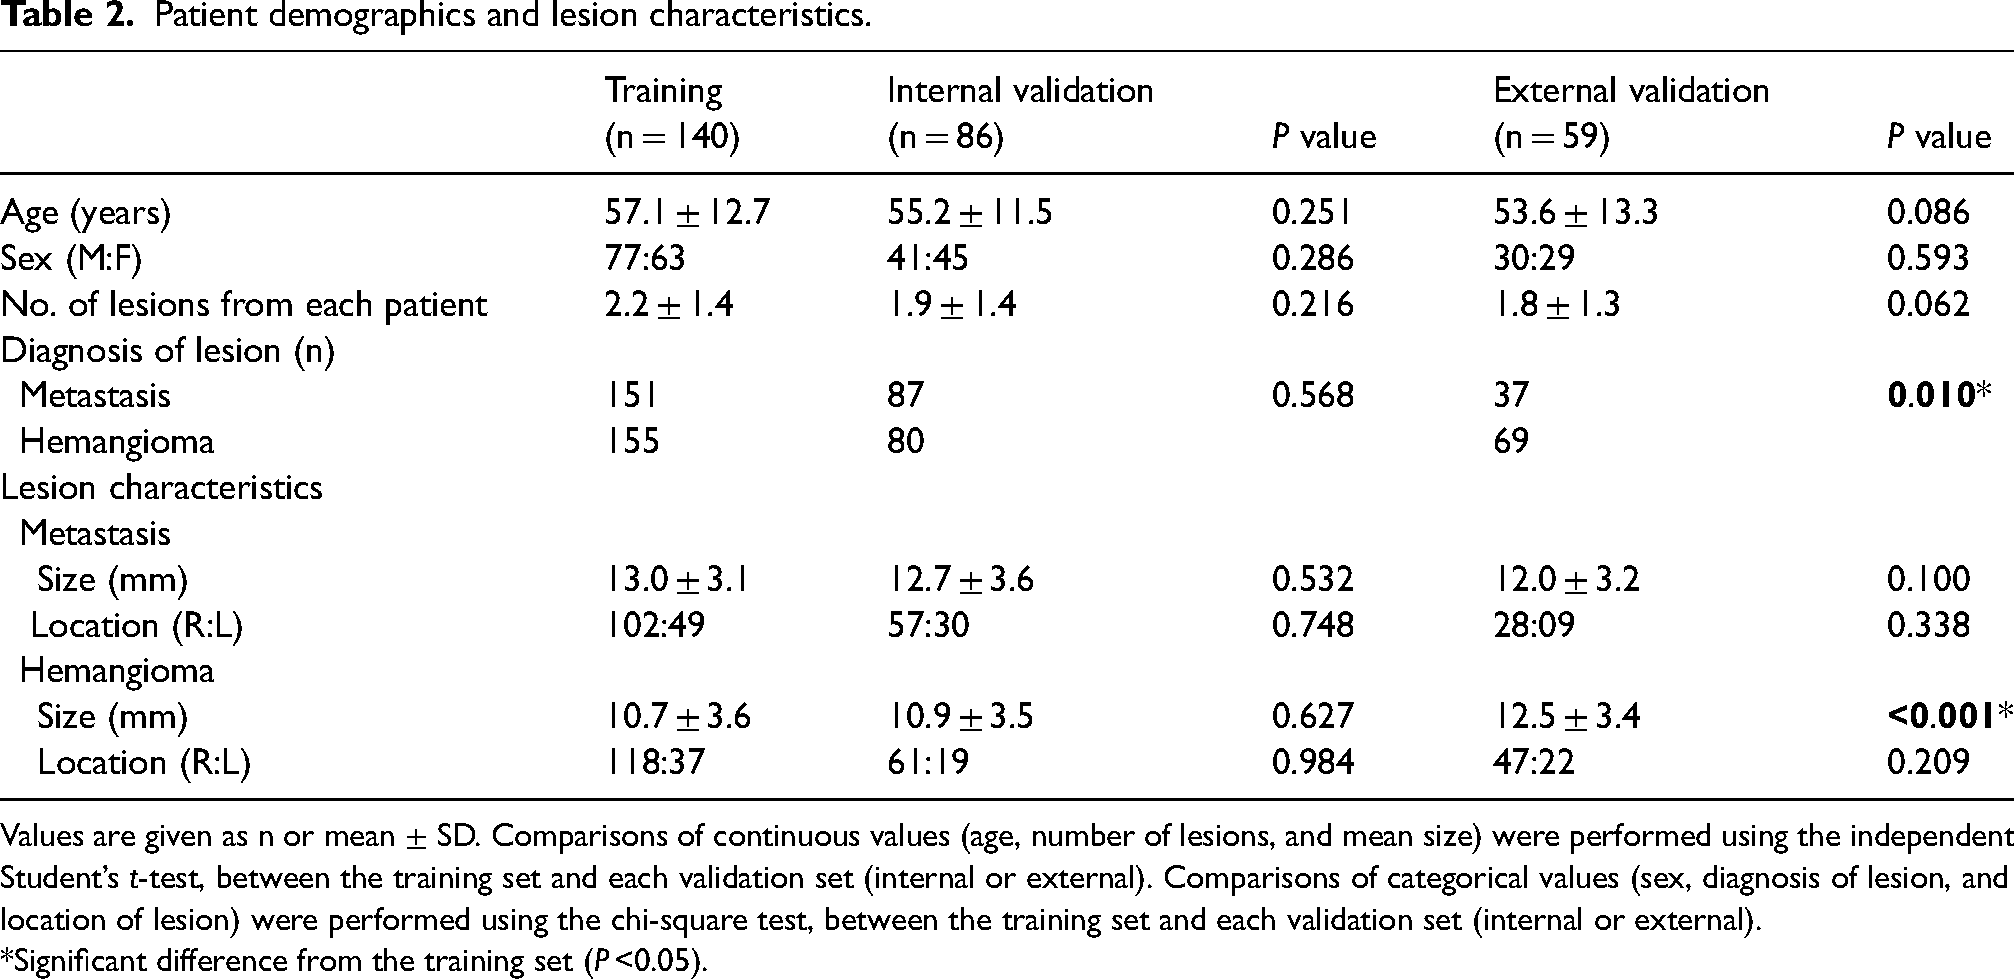
Values are given as n or mean ± SD. Comparisons of continuous values (age, number of lesions, and mean size) were performed using the independent Student’s t-test, between the training set and each validation set (internal or external). Comparisons of categorical values (sex, diagnosis of lesion, and location of lesion) were performed using the chi-square test, between the training set and each validation set (internal or external).
*Significant difference from the training set (P <0.05).
Development and validation of radiomics model
A total of 854 radiomics features were extracted from each of the conventional T2W, heavily T2W, and FS-T2W imaging sequences. The 10 most relevant features selected from the training set included eight original features and two wavelet-based features for conventional T2W images, and two original features and eight wavelet-based features for both heavily T2W and FS-T2W imaging. A heatmap of these radiomics features demonstrated differences between hepatic metastases and hemangiomas (Fig. 2 and Table S1 in the supplementary material).
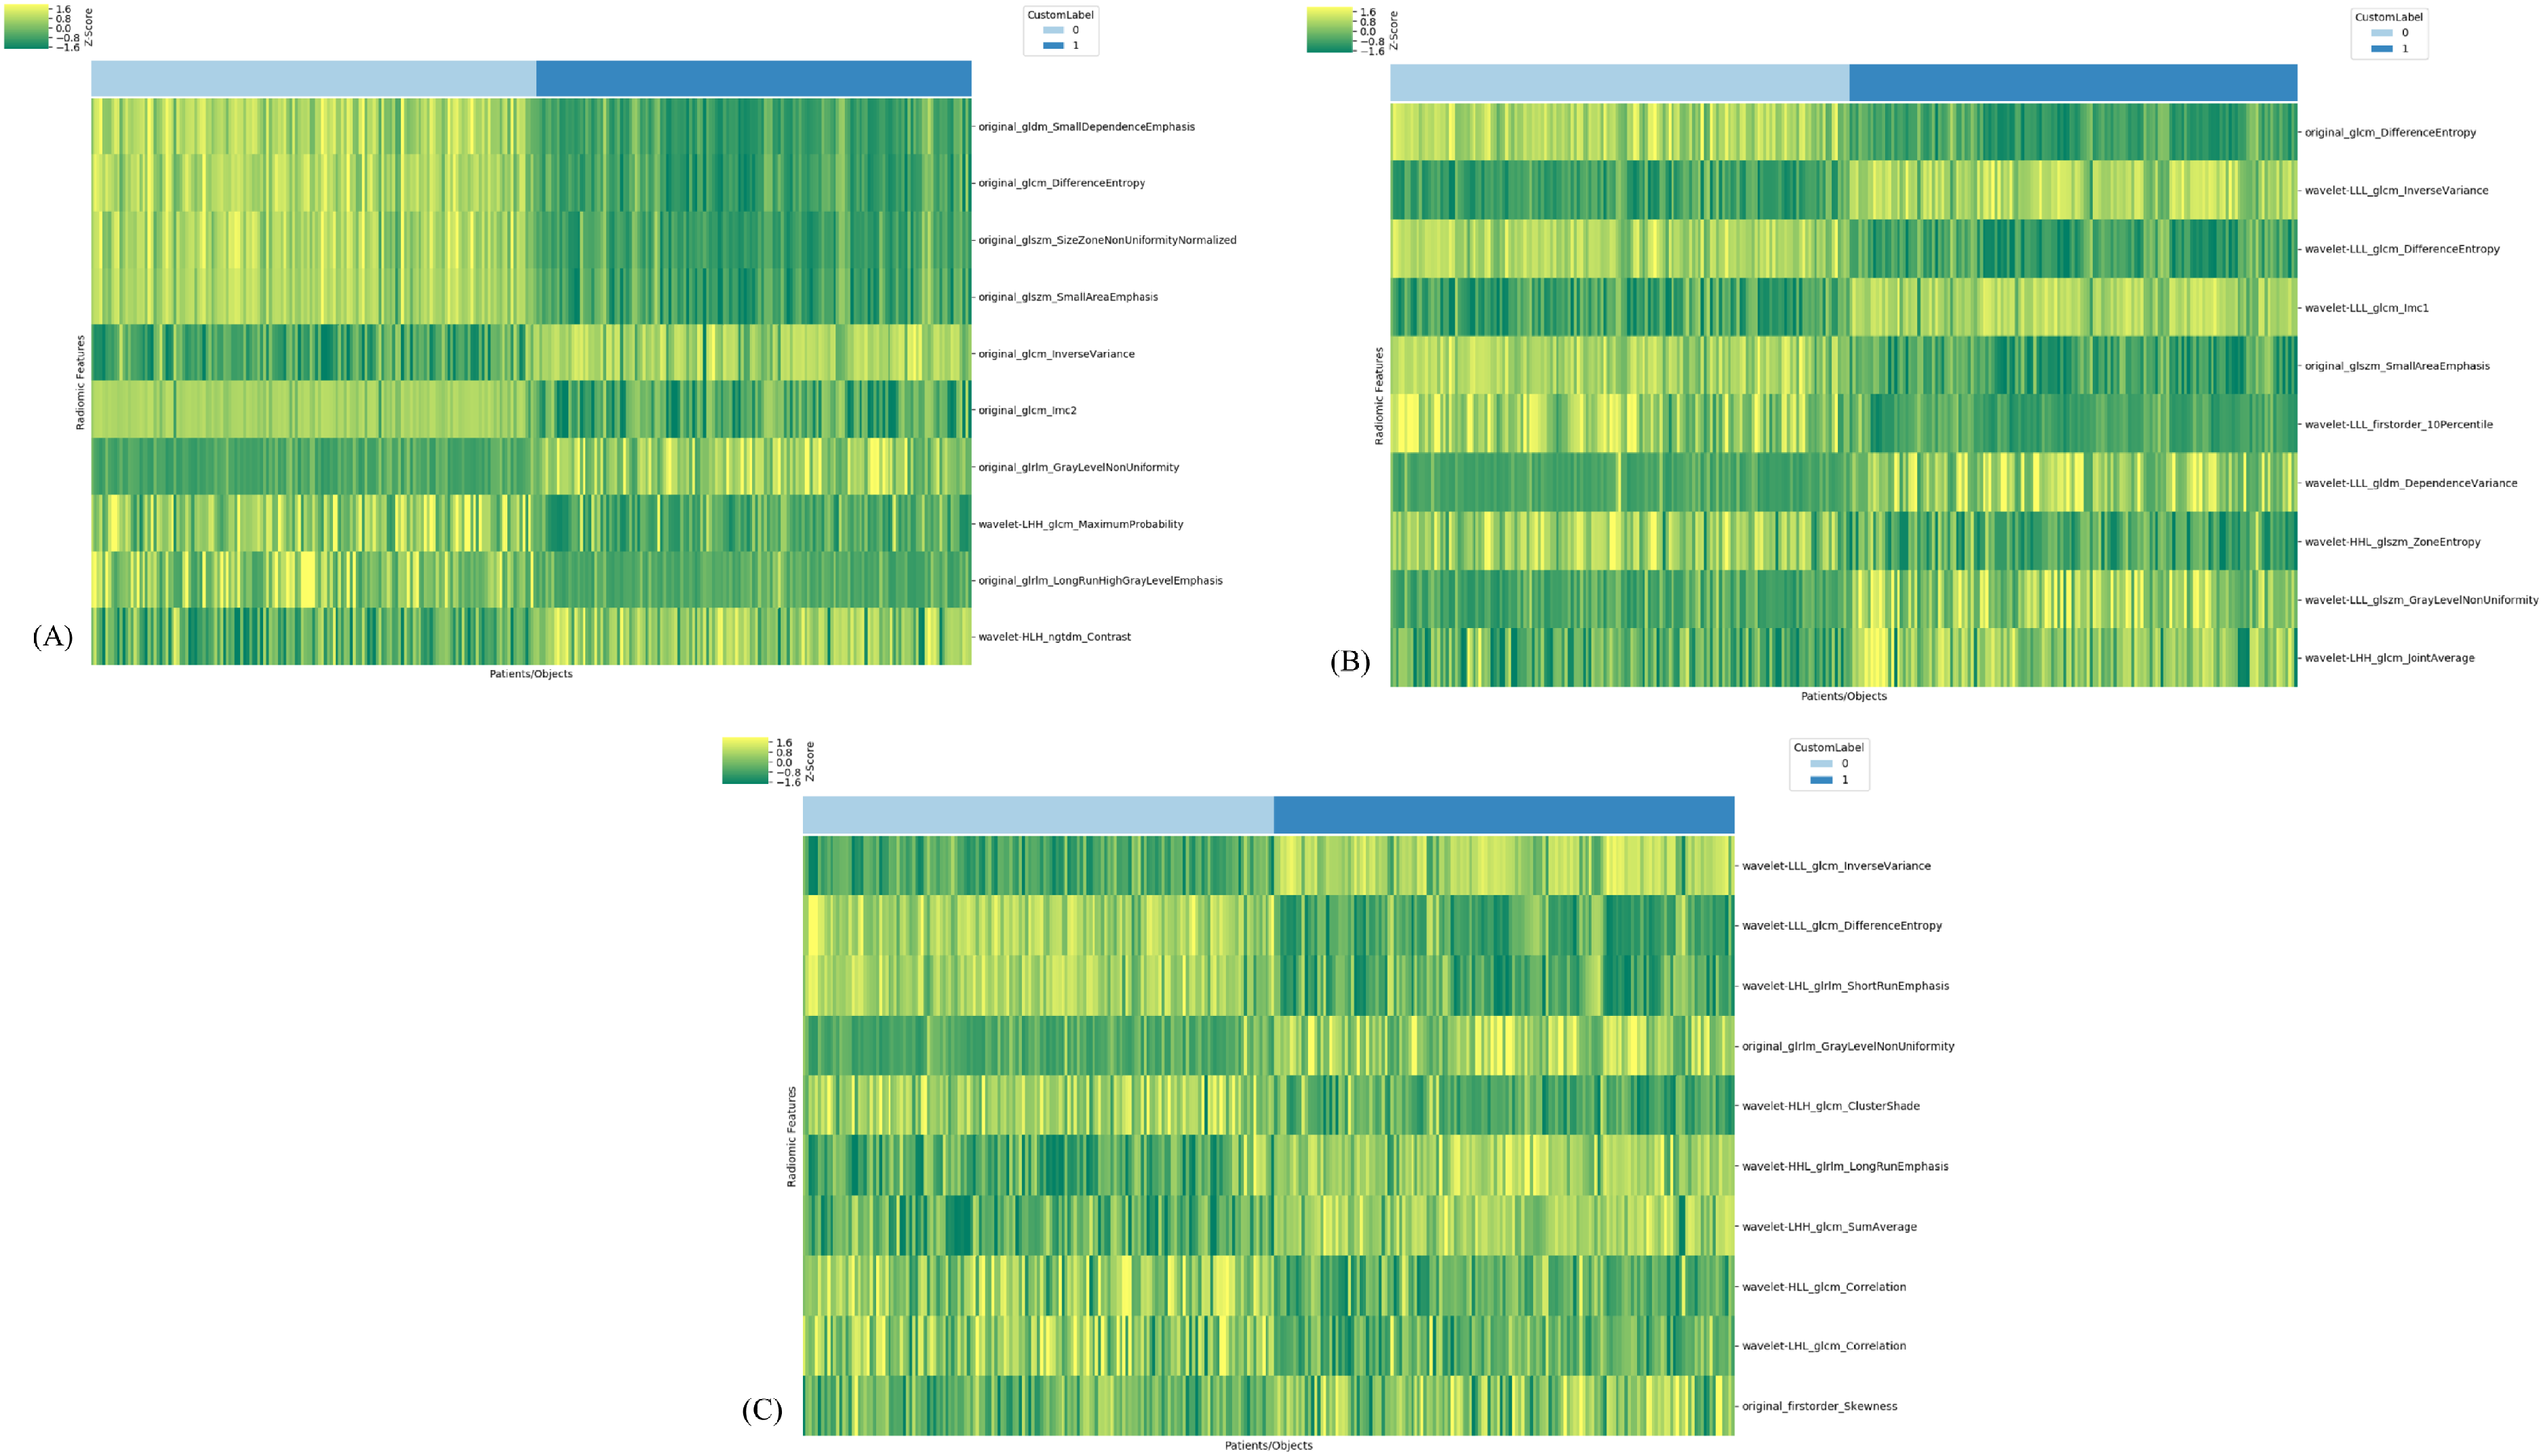
Heatmaps of the 10 most relevant radiomics features for differentiating hepatic metastases from hemangiomas. Heatmaps are shown for (a) conventional T2W imaging, (b) heavily T2W imaging, and (c) FS-T2W imaging. For wavelet feature, H indicates a high-pass filter and L indicates a low-pass filter, yielding eight decompositions per level. These represent all possible combinations of applying either a high- or low-pass filter along each of the three spatial dimensions (X, Y, and Z axes). Detailed numerical values for each feature are provided in Table 1 in the supplementary material. FS, fat-suppressed; GLCM, gray-level co-occurrence matrix; GLDM, gray-level dependence matrix; GLRLM, gray-level run length matrix; GLSZM, gray-level size zone matrix; H, high-pass filter; IMC, informational measure of correlation; L, low-pass filter; NGTDM, neighboring gray tone difference matrix for wavelet feature labels; T2W, T2-weighted.
The diagnostic performance of the RF models based on the three T2W imaging sequences in the training, internal, and external validation sets is summarized in Table 3 and Fig. 3. Except for the FS–T2W imaging sequence in the external validation set, the RF model demonstrated comparable diagnostic performance to that of the radiologists’ visual assessment in both the internal and external validation sets.
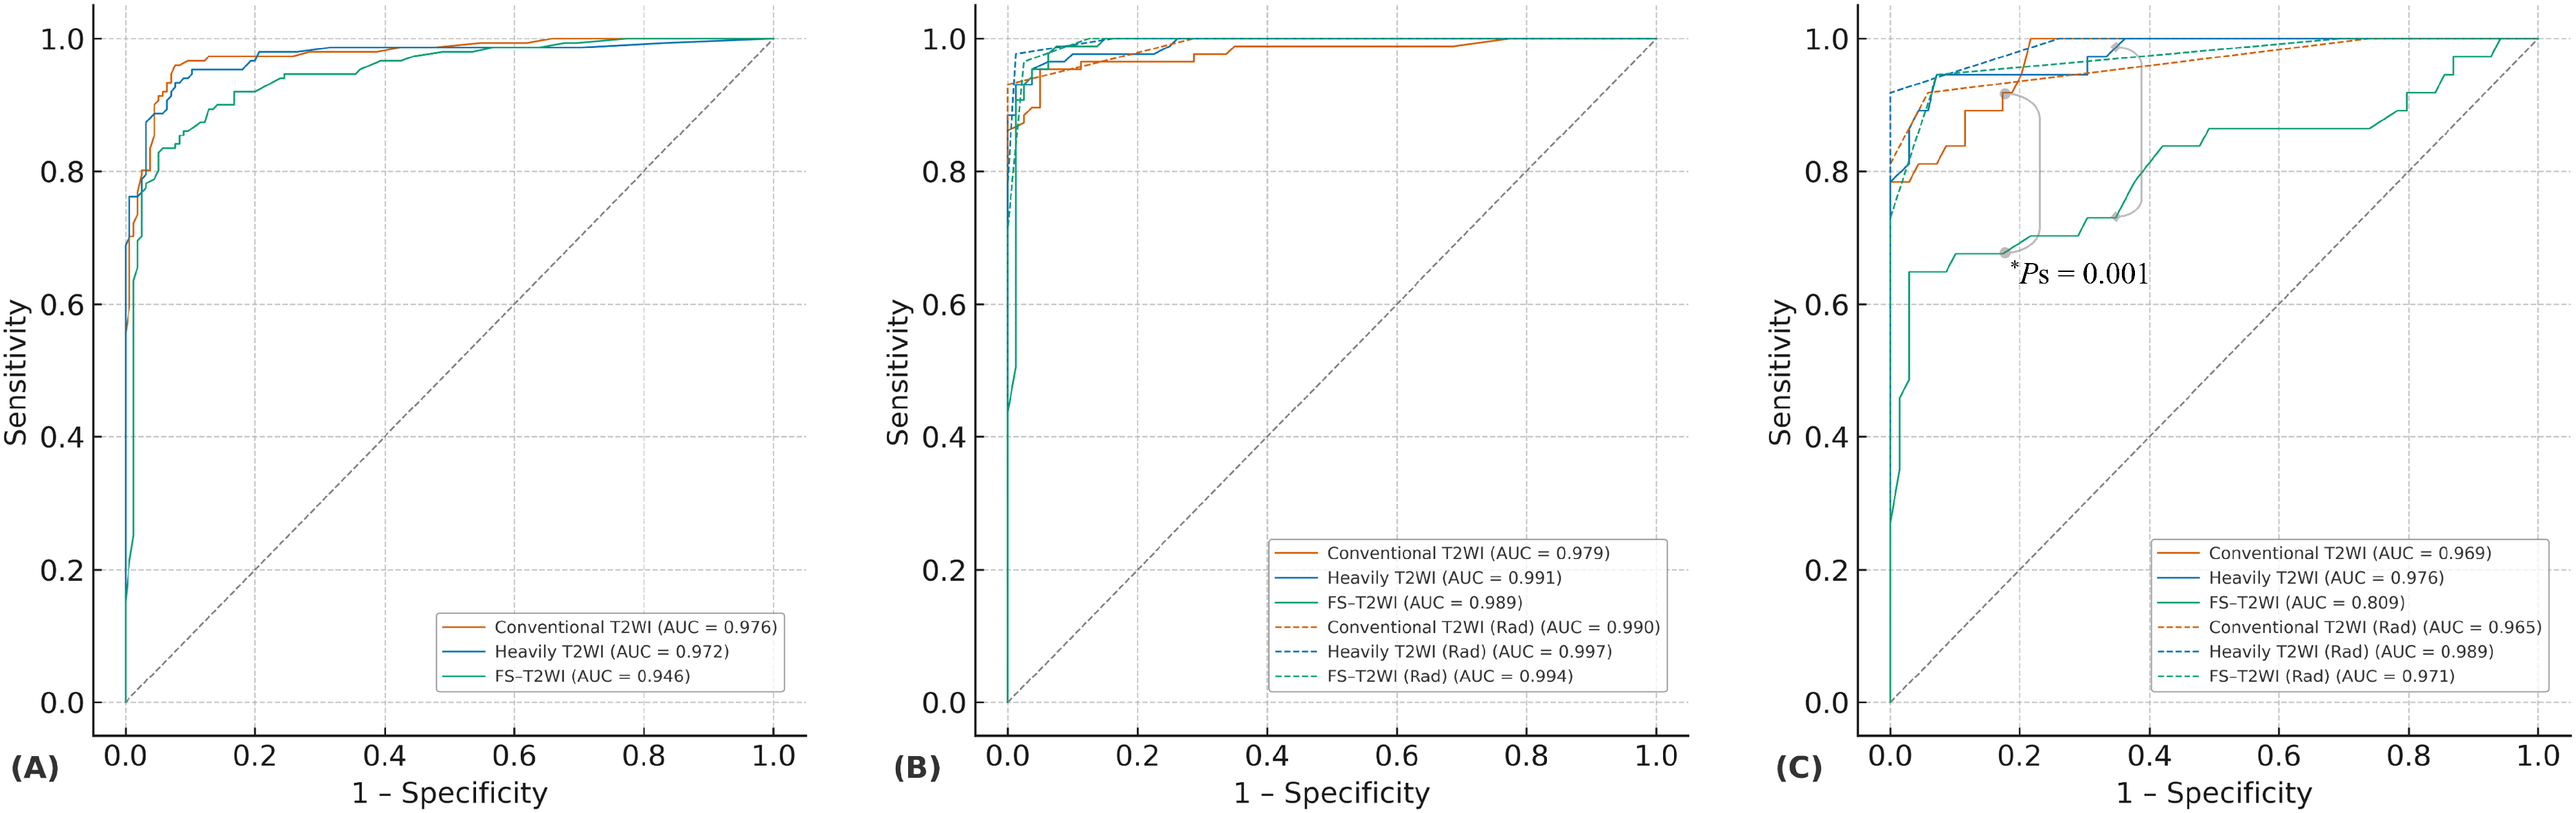
Diagnostic performance of radiomics models using three T2W imaging sequences. ROC curves illustrate the performance of the radiomics-based RF model using each T2W imaging sequence for differentiating small hepatic metastases from hemangiomas in the (a) training set, (b) internal validation set, and (c) external validation set. The AUC did not significantly differ among the three T2W imaging sequences in the training set (AUCs: conventional T2W imaging, 0.976; heavily T2W imaging, 0.972; FS-T2W imaging, 0.946; P >0.017 [Bonferroni-corrected threshold: 0.05/3] for all) or in the internal validation set (AUCs: conventional T2W imaging, 0.979; heavily T2W imaging, 0.991; FS-T2W imaging, 0.989; P >0.017 for all). However, in the external validation set, the AUC of the RF model using FS-T2W imaging (0.809) was significantly lower than that of conventional T2W imaging (0.969) and heavily T2W imaging (0.976) (P = 0.001 for both comparisons with FS-T2W imaging). Dashed lines in panels (b) and (c) indicate the radiologists’ visual assessment results. The radiomics model demonstrated diagnostic performance comparable to that of the radiologists overall; however, in the external validation set, the radiologists clearly outperformed the RF model based on FS-T2W imaging. AUC, area under the ROC curve; FS, fat-suppressed; RF, random forest; ROC, receiver operating characteristic; T2W, T2-weighted.
Diagnostic performance of MR radiomics models with three different T2W imaging sequences.
Values are given as % (number of lesions) (95% CI). P values for AUCs were obtained using DeLong’s method and P values for sensitivity, specificity, and accuracy were obtained using McNemar’s test.
*P values obtained from comparisons of conventional T2W imaging vs. heavily T2W imaging.
P values obtained from comparisons of conventional T2W imaging vs. FS-T2W imaging.
P values obtained from comparisons of heavily T2W imaging vs. FS-TW imaging.
P values indicate a significant difference (P <0.017 [0.05/3]).
AUC, area under the ROC curve; FS, fat-suppressed; MR, magnetic resonance; T2W, T2-weighted.
Training set
The average AUCs of the RF model from 10-fold cross-validation were 0.976 (95% confidence interval [CI] = 0.952–0.990), 0.972 (95% CI = 0.947–0.988), and 0.946 (95% CI = 0.914–0.968) for conventional T2W, heavily T2W, and FS-T2W imaging, respectively. The sensitivity, specificity, and accuracy for conventional T2W imaging were 92.1%, 93.5%, and 92.8%, respectively. For heavily T2W imaging, the values were 90.7%, 93.5%, and 92.2%, and for FS-T2W imaging, they were 84.8%, 91.6%, and 88.2%, respectively. There were no statistically significant differences in AUC, sensitivity, specificity, or accuracy among the radiomics models based on the three T2W imaging sequences (P >0.017 for all).
Internal validation set
The AUCs of the trained RF model using conventional T2W, heavily T2W, and FS-T2W imaging were 0.979 (95% CI = 0.945–0.995), 0.991 (95% CI = 0.962–0.999), and 0.989 (95% CI = 0.959–0.999), respectively. The sensitivity, specificity, and accuracy for conventional T2W imaging were 88.5%, 97.5%, and 92.8%, respectively. For heavily T2W imaging, the values were 88.5%, 100%, and 94.0%, and for FS-T2W imaging, they were 93.1%, 97.5%, and 95.2%, respectively. No statistically significant differences in AUC, sensitivity, specificity, or accuracy were observed among the three T2W-based RF models (P >0.017 for all). Fig. 4 shows a representative case of hepatic metastasis and hemangioma.
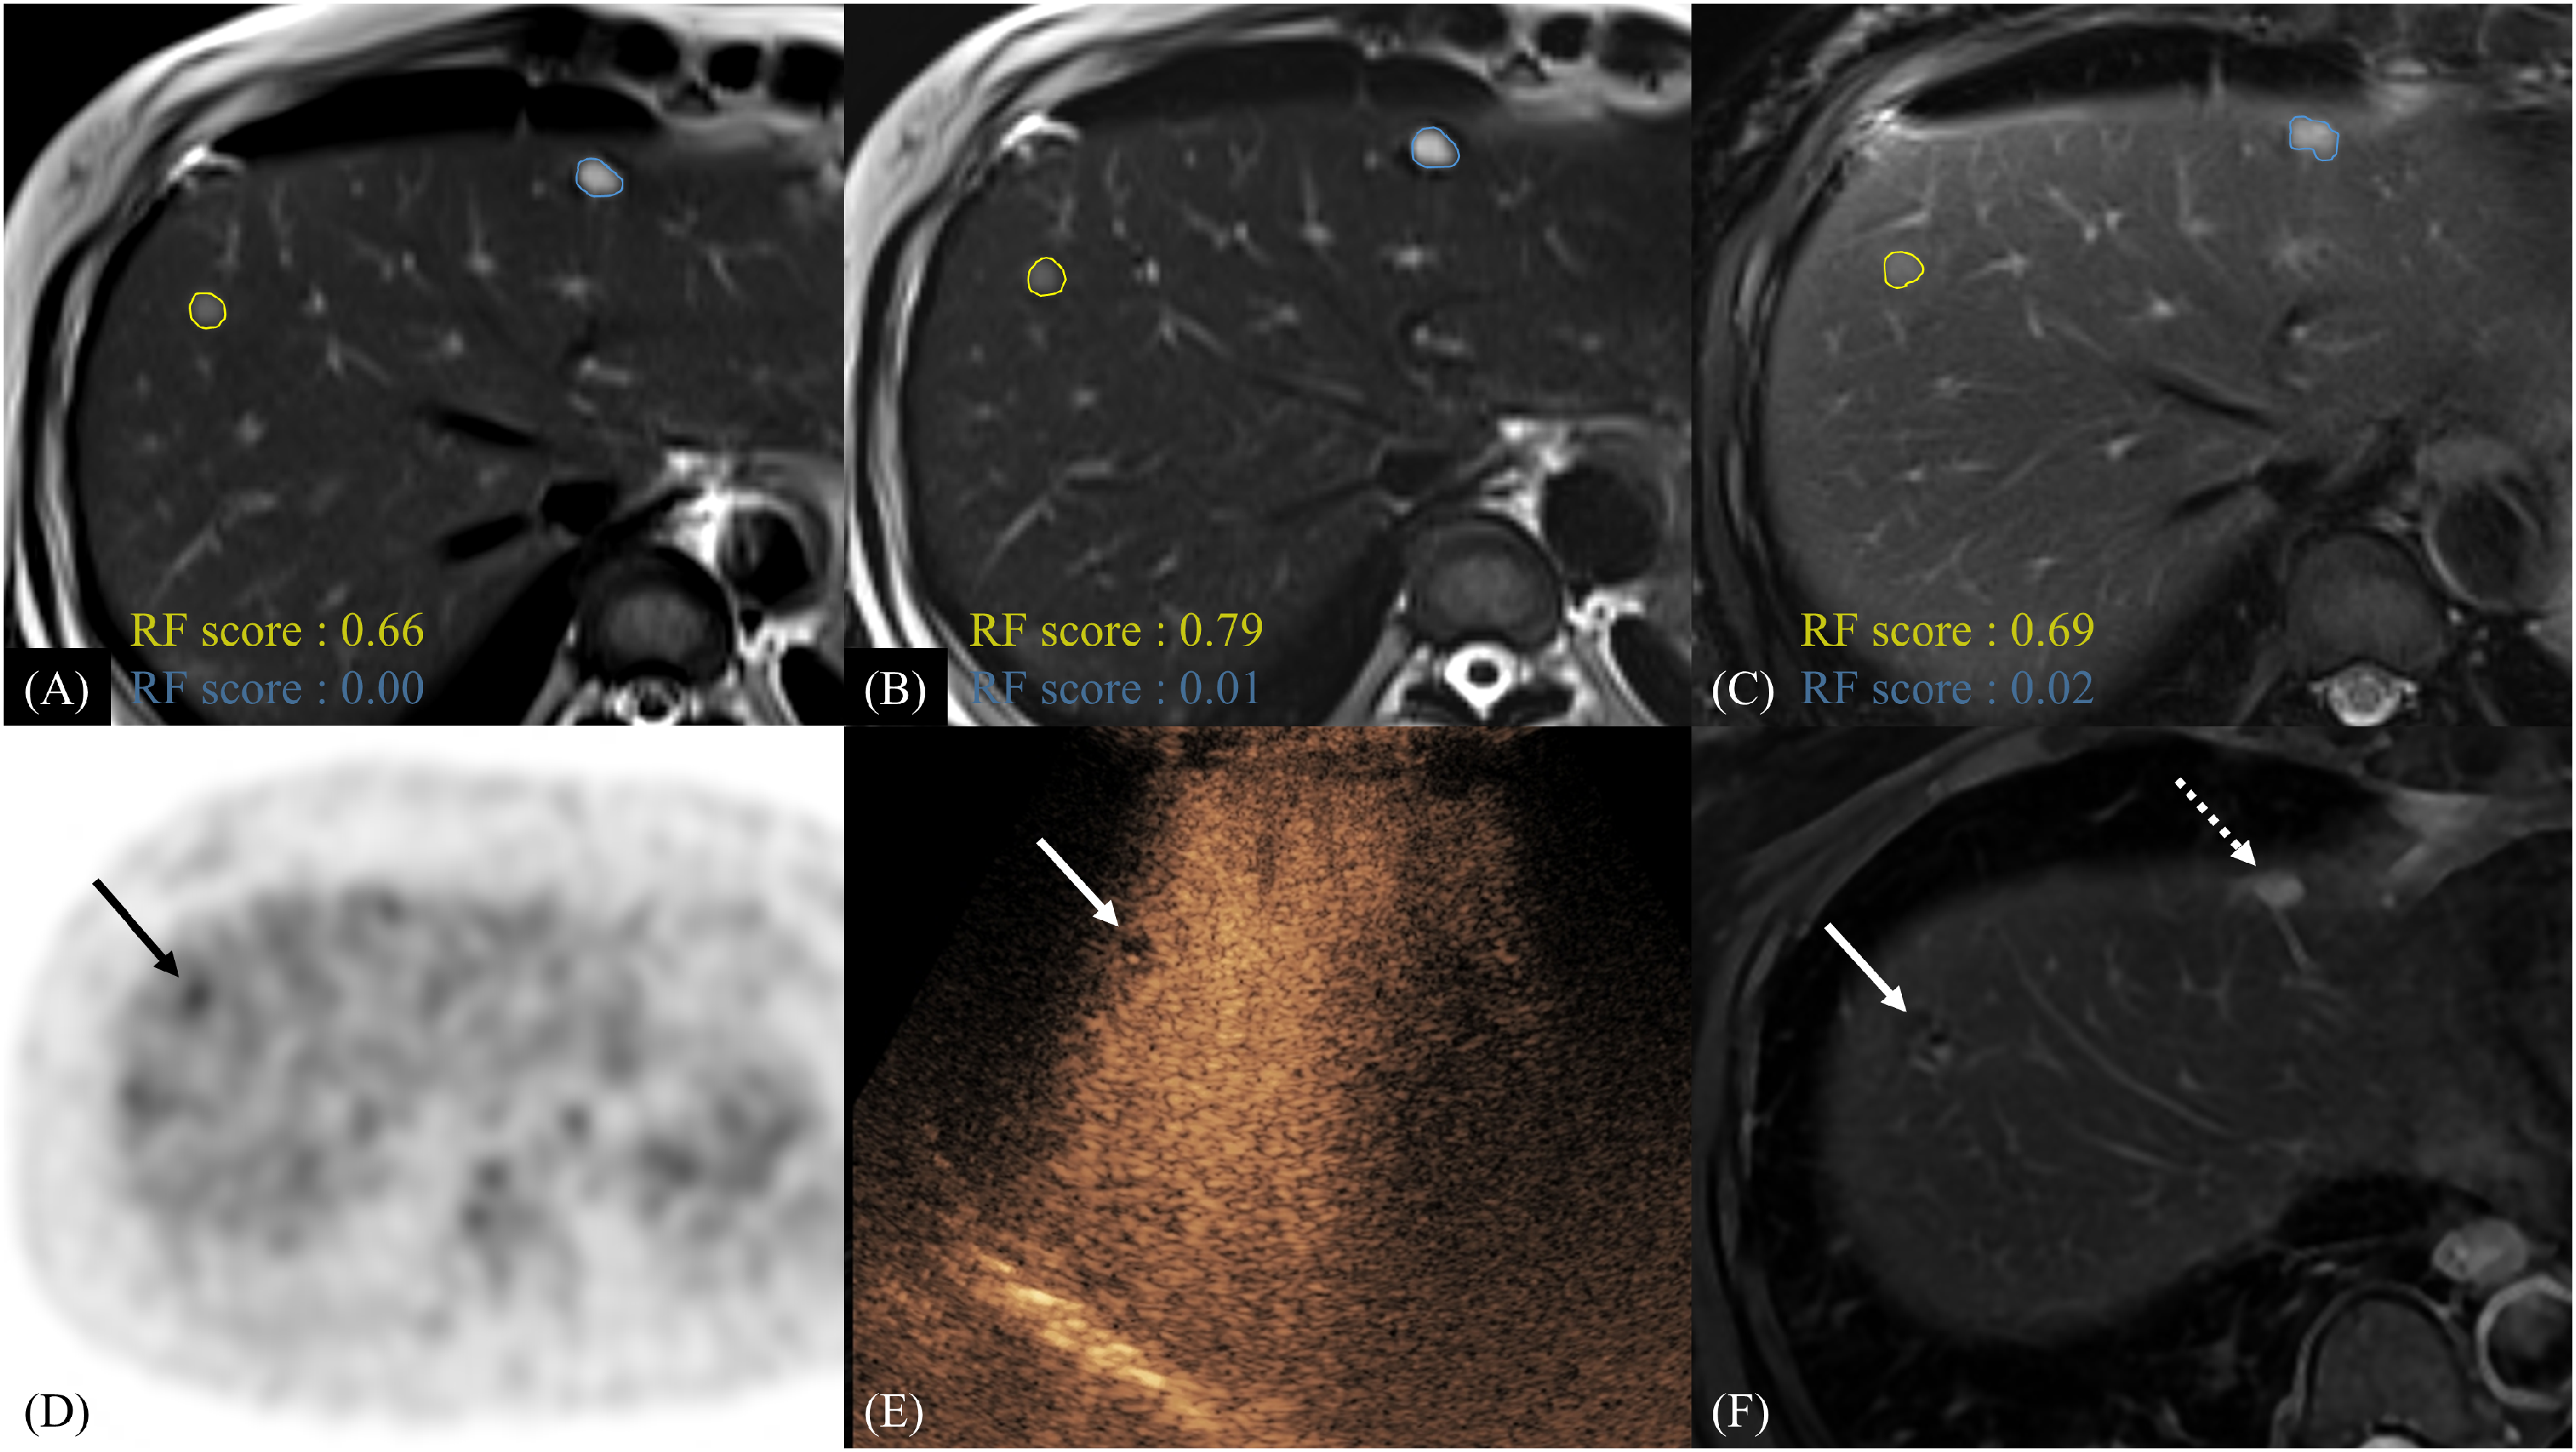
A 6-mm hepatic metastasis in the right hepatic lobe and a 9-mm hemangioma in the left hepatic lobe of a 45-year-old female patient. (a–c) The yellow solid lines and blue solid lines indicate the manually segmented hepatic metastasis and hemangioma, respectively. All three T2W imaging-based RF models accurately predicted hepatic metastasis and hemangioma. (a) For the right liver lesion, the RF model based on conventional T2W imaging yielded a score of 0.66; (b) the model based on heavily T2W imaging yielded a score of 0.79; and (c) the model based on FS-T2W imaging yielded a score of 0.69. (d) The lesion demonstrated mild hypermetabolic activity (black arrow) on 18F-fluorodeoxyglucose PET-CT, suggestive of hepatic metastasis. (e) Contrast-enhanced ultrasound with Sonazoid revealed a Kupffer phase defect (white arrow), and the lesion was subsequently treated with radiofrequency ablation. (f) No recurrence was observed around the ablation site (white solid arrow) during the 30-month follow-up period. For the left liver lesion, all three T2W imaging-based RF models correctly predicted hemangioma with high confidence: a radiomics scores of 0.00, 0.01, and 0.02 for panels (a)–(c), respectively. The hemangioma remained stable in size during follow-up (f, dashed arrow). FS, fat-suppressed; PET-CT, positron emission tomography-computed tomography; RF, random forest; T2W, T2-weighted.
External validation set
The AUC of the trained RF model using FS-T2W imaging (0.809, 95% CI = 0.721–0.879) was significantly lower than that of conventional T2W imaging (0.969, 95% CI = 0.916–0.993; P = 0.001) and heavily T2W imaging (0.976, 95% CI = 0.926–0.996; P = 0.001) in the external validation set (Fig. 3). The sensitivity of the RF model using heavily T2W imaging (89.2%) was significantly higher than that of conventional T2W imaging (62.2%; P = 0.006) and FS-T2W imaging (40.5%; P <0.001). The accuracy of the RF model using heavily T2W imaging (93.4%) was also significantly higher than that of FS-T2W imaging (78.3%; P = 0.002). There were no statistically significant differences in specificity among the RF models (P >0.017 for all).
Decision curve analysis
Decision curve analysis (Fig. 5) demonstrated that the radiomics models based on T2W imaging sequences provided higher net benefits than the treat-all or treat-none strategies across most clinically relevant threshold probabilities (0.2–0.7) in both internal and external validation cohorts.
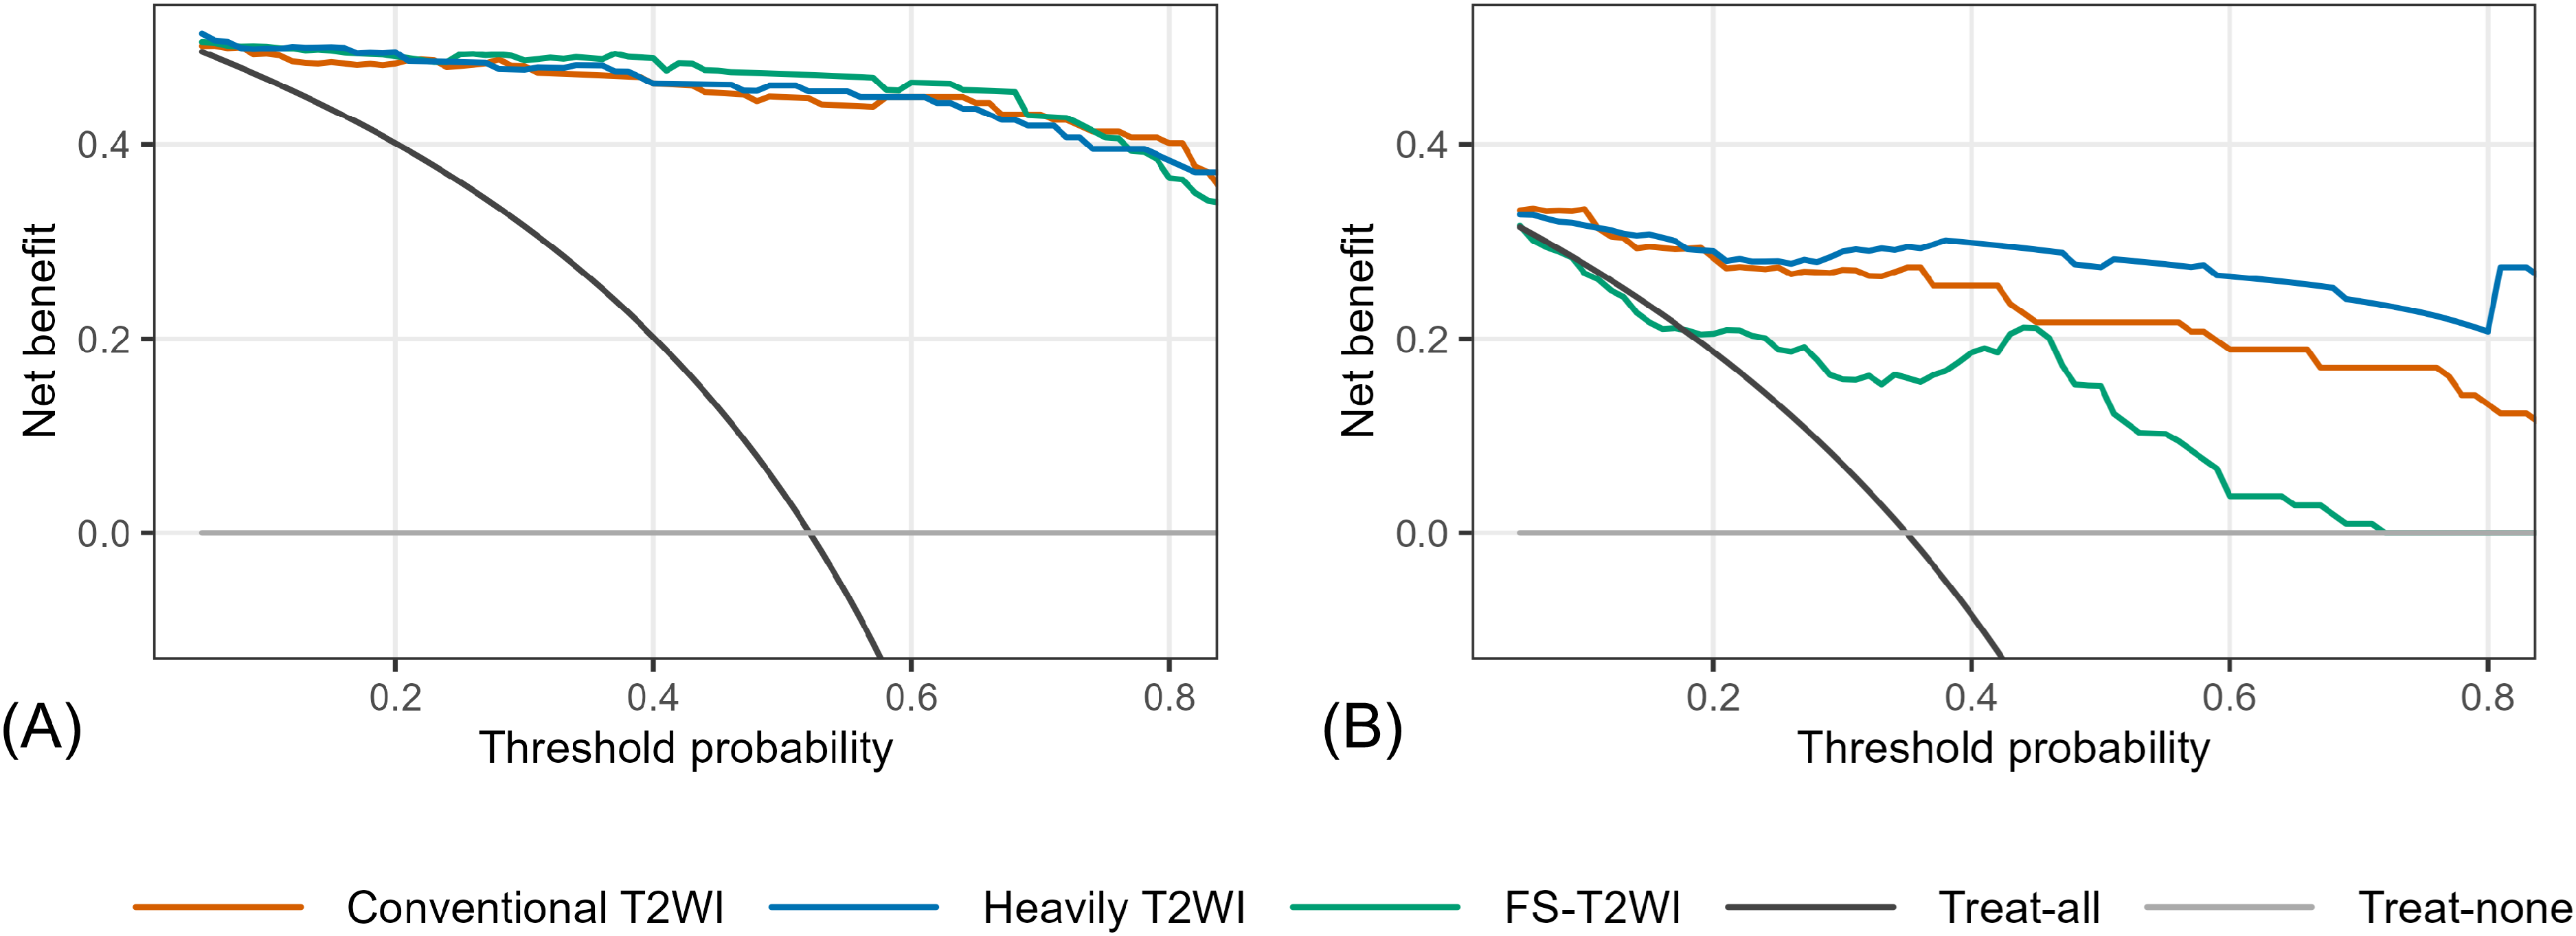
Decision curve analysis for (a) internal and (b) external validation sets showing the net benefit of radiomics models derived from T2W imaging sequences. The net benefit of each model (conventional T2W imaging, heavily T2W imaging, and FS-T2W imaging) is plotted across threshold probabilities of 0.05–0.95 (step 0.01). The “treat-all” and “treat-none” strategies are shown as references. Decision curve analysis demonstrated that the radiomics models based on T2W imaging sequences provided higher net benefits than the treat-all or treat-none strategies across most clinically relevant threshold probabilities (0.2–0.7). The heavily T2W imaging-based model yielded the highest net benefit across most threshold probabilities in the external validation cohorts. FS, fat-suppressed; T2W, T2-weighted.
Radiomics-based classification of visually indeterminate lesions
Radiomics scores for visually indeterminate lesions are summarized in Table 4.
Radiomics scores for visually indeterminate hepatic lesions.
A radiomics score cutoff of 0.5 was applied, with scores >0.5 indicating metastasis and ≤0.5 indicating hemangioma. Bold values indicate correct classification of visually indeterminate lesions according to their diagnosis.
FS, fat-suppressed; T2W, T2-weighted.
Internal validation set
Seven metastases were categorized as visually indeterminate. Among them, six lesions were correctly classified using radiomics score, while one lesion was misclassified by all three T2W-based models.
External validation set
Seven metastases and one hemangioma were considered indeterminate lesions. Of these, four metastases and one hemangioma were correctly classified based on radiomics scores (Figs. 6 and 7). Notably, only the RF model based on heavily T2W imaging correctly identified other three metastases.
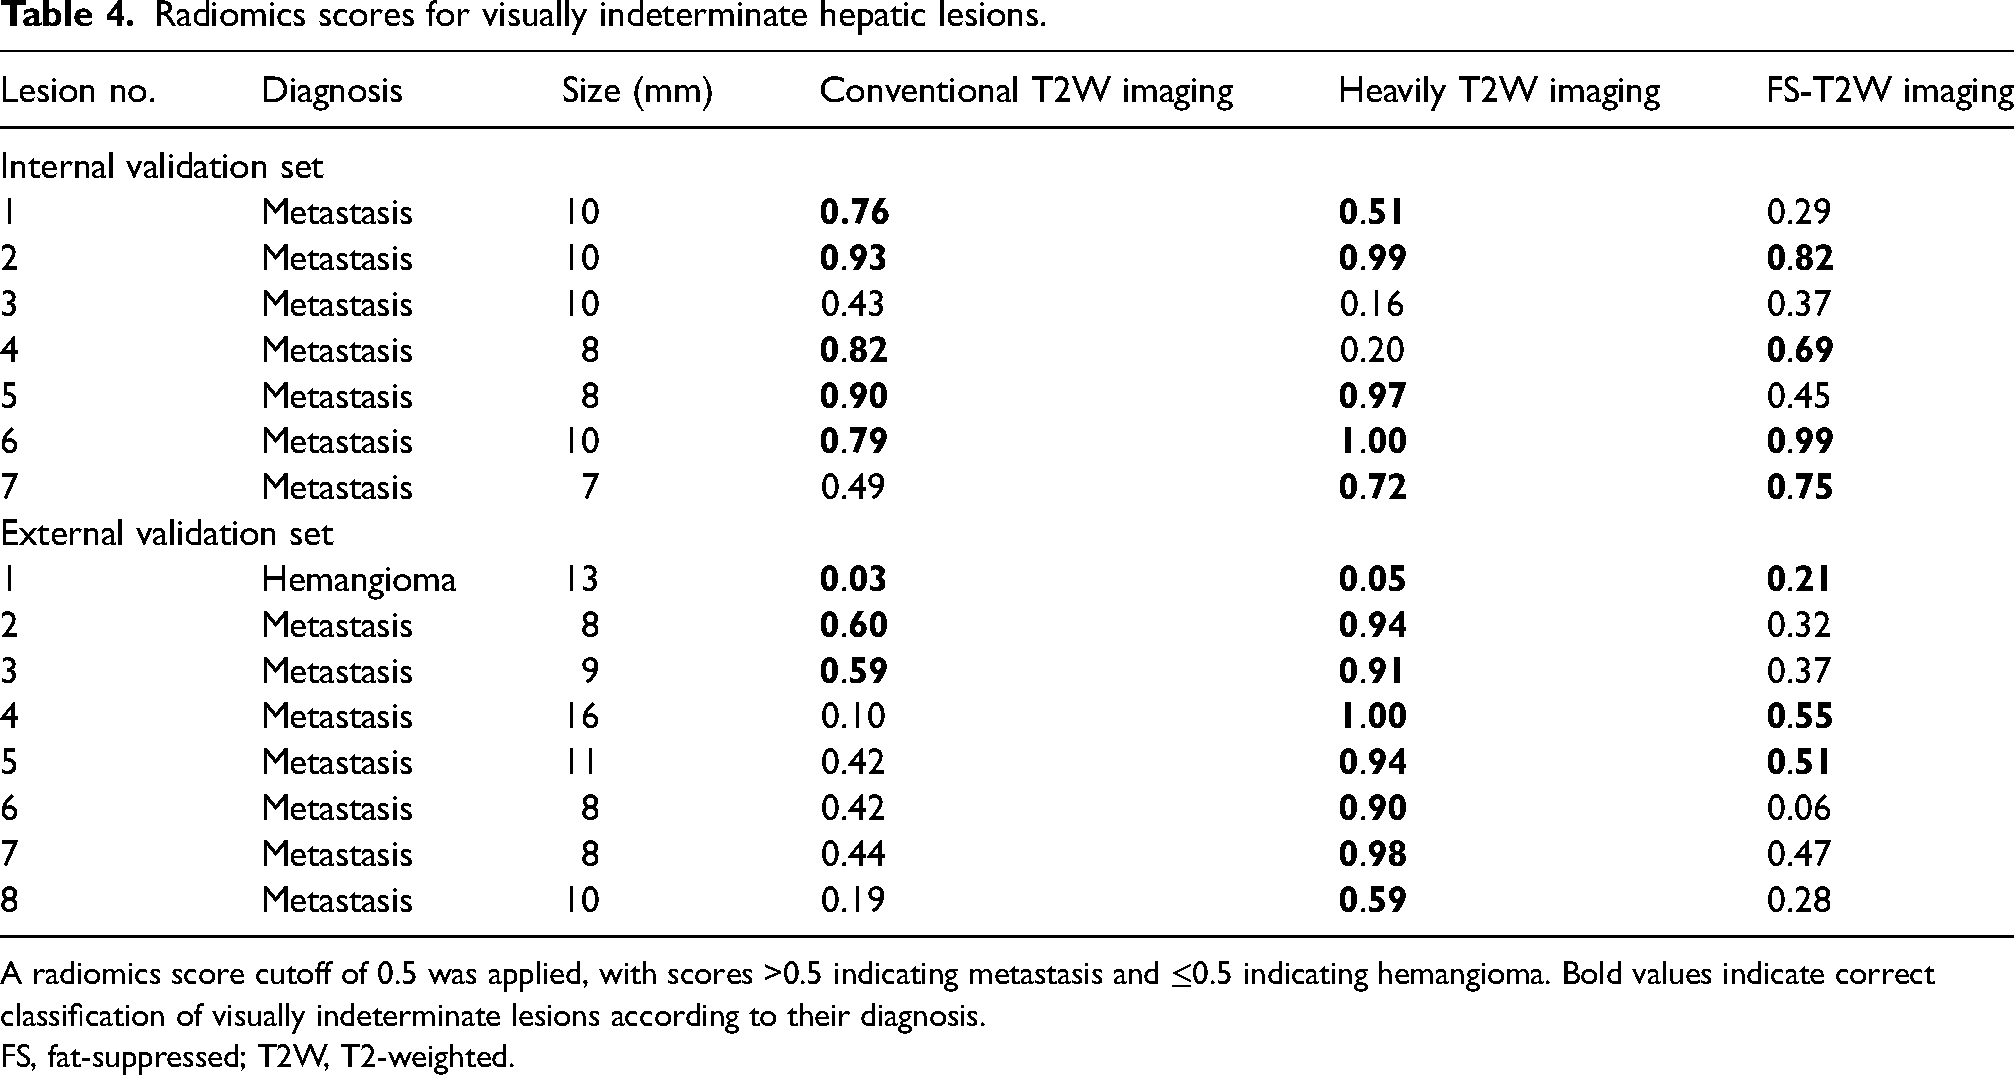
A 13-mm hepatic hemangioma in the left hepatic lobe of a 42-year-old male patient. (a–c) A small lesion in the left liver lobe shows high signal intensity on all T2W imaging, but signal intensity is similar to that of hepatic metastasis and not high enough compared to typical hemangioma on visual assessment. However, all three T2W imaging-based RF models predicted benignity with high confidence: (a) the conventional T2W imaging model yielded a score of 0.03; (b) the heavily T2W imaging model yielded 0.05; and (c) the FS-T2W imaging model yielded 0.21. (d) On the contrast-enhanced arterial phase sequence, the lesion demonstrated peripheral enhancement (arrow). (e) The transitional phase image showed pseudo-washout of the lesion (arrow). (f) On the portal venous phase of follow-up CT, the lesion exhibited homogeneous enhancement similar to that of adjacent hepatic vein (arrow), which is considered a typical imaging feature of hemangioma. The lesion remained stable in size over a 5-year follow-up period. Yellow lines in panels (a–c) indicate the region of interest used for segmentation, in the lower right corner of each panel, a cropped zoomed-in image. CT, computed tomography; FS, fat-suppressed; RF, random forest; T2W, T2-weighted.
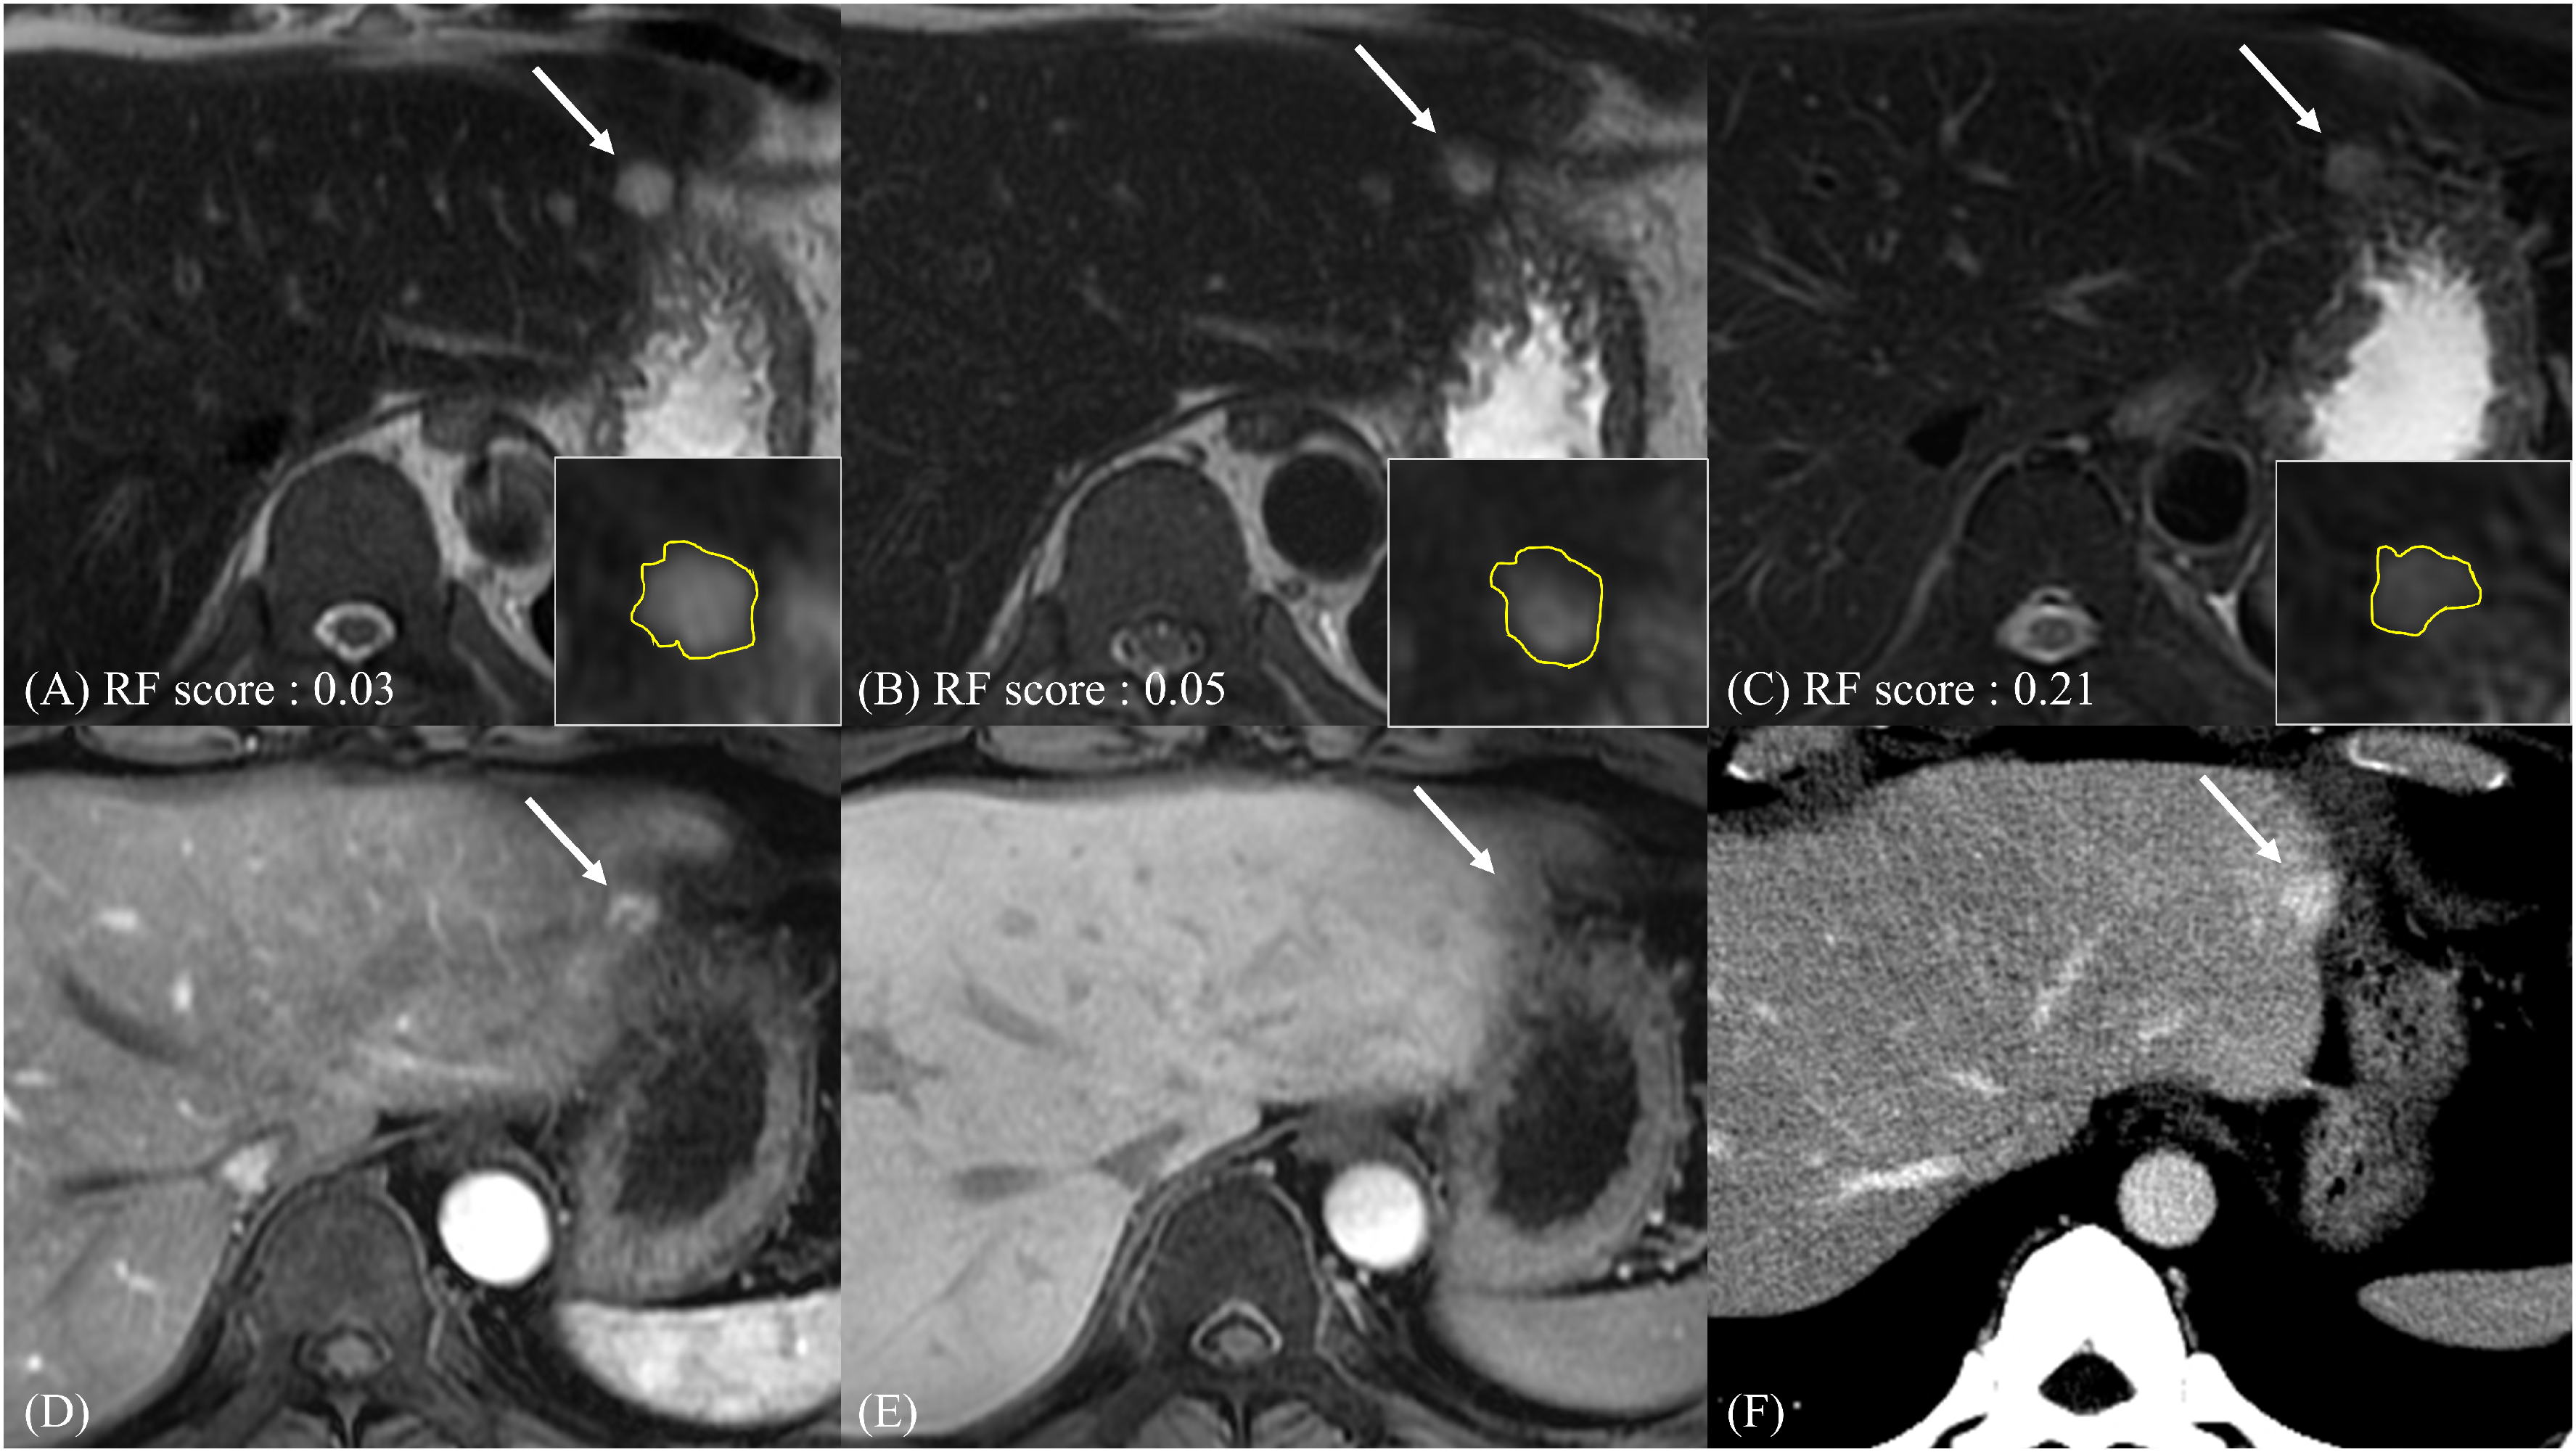
A 16-mm hepatic metastasis in the left hepatic lobe of a 47-year-old female patient. (a–c) A hepatic metastasis in the left liver lobe demonstrates high signal intensity on T2W imaging, and notably, the signal pattern mimics that of a hemangioma on (a) conventional T2W imaging and (c) FS-T2W imaging, potentially leading to diagnostic confusion. The RF models based on (a) conventional T2W imaging yielded a score of 0.10 and failed to predict malignancy. (b, c) The RF model based on heavily T2W imaging and FS-T2W imaging correctly predicted hepatic metastasis with scores of 1.00 (b) and 0.55 (c). respectively. (d) Suspicious nodular enhancement is seen within the lesion on the transitional phase but accurate assessment of the lesion's enhancement pattern was limited due to motion artifacts. (e) However, the lesion demonstrates diffusion restriction on diffusion-weighted imaging (arrow). (f) After 1 year of chemotherapy, the lesion decreased in size (arrow). (a–c) Yellow lines indicate the region of interest used for segmentation, in the lower right corner of each panel, a cropped zoomed-in image. Note: High signal intensity in the abdominal aorta (*) was observed due to inflowing unsaturated blood during 3D acquisition. FS, fat-suppressed; RF, random forest; T2W, T2-weighted.
Discussion
In this study, we developed and validated radiomics models using T2W imaging sequences from liver MRI to differentiate small (≤2 cm) hepatic metastases from hemangiomas. The RF models demonstrated high diagnostic performance in the training set and consistently yielded high AUC values in the internal validation set. In the external validation set, which utilized a different MRI vendor, the RF model based on conventional T2W and heavily T2W imaging outperformed the model using FS-T2W imaging. Furthermore, the decision curve analysis demonstrated that the RF models provided greater net clinical benefit. The RF models also contributed to correct classification for visually indeterminate lesions from the validation sets, suggesting potential clinical utility.
When hepatic lesions are small, it remains challenging to differentiate hepatic metastases from hemangiomas through visual assessment alone. The inherently low spatial resolution and high susceptibility to motion artifacts in DWI particularly affect the evaluation of small lesions (35). Hemangiomas often demonstrate high signal intensity on DWI due to the T2 shine-through effect (36); in small lesions, it can be difficult to correlate DWI findings with the apparent diffusion coefficient map. In addition, arterial phase imaging is highly susceptible to respiratory motion artifacts—often caused by transient dyspnea related to the pharmacokinetics of gadoxetic acid—which complicates the identification of characteristic enhancement patterns in small lesions (37). Given these challenges, our study focused on the application of an MRI-based radiomics model using T2W imaging sequences to differentiate small hepatic metastases from hemangiomas.
Several recent studies have demonstrated that radiomics features can effectively distinguish benign from malignant hepatic lesions, thereby aiding in the characterization of hepatic focal lesions (17,38,39). A prior study (17) using texture analysis derived from FS-T2W imaging (SPAIR) attempted to differentiate hepatic hemangiomas, metastases, and hepatocellular carcinomas and achieved promising results (AUC range = 0.80–0.91). However, previous studies lacked clear information on lesion size and did not perform a comprehensive comparative analysis of the three T2W imaging sequences. In our study, although the diagnostic performance of the RF model using FS-T2W imaging was satisfactory in the training and internal validation sets, it was less robust in the external validation set (AUC = 0.809, 95% CI = 0.721–0.879). This suboptimal performance may be explained by differences in the fat suppression techniques used in the training and external validation sets: the Siemens system employed SPAIR, whereas the GE system utilized CHESS (40,41). Therefore, when applying radiomics, careful consideration should be given to fat suppression techniques, software algorithms, and radiofrequency coil designs. In particular, further studies are warranted to clarify the impact of different fat-suppression methods on radiomic feature stability and model performance.
In our study, radiomics models contributed to the accurate classification of visually indeterminate lesions. In the internal validation set, most indeterminate cases were correctly classified by T2W-based models. In the external validation set, although three out of eight indeterminate lesions were misclassified, RF model using heavily T2W imaging showed promising diagnostic performance. This performance may further improve when radiomics models are trained and applied within the same MRI vendor. Radiomics-based classification may offer additional diagnostic support and enhance confidence in lesion interpretation. This could be especially beneficial in clinical settings where contrast-enhanced imaging is contraindicated due to adverse reactions, when the interpretation of contrast-enhanced images is limited by small lesion size or imaging artifacts, or in abbreviated non-contrast MRI protocols (42,43). However, further studies are warranted to determine the optimal way to combine the three T2W imaging sequences.
The present study has some limitations. First, as a retrospective single-center study, our analysis was based on a relatively small sample size and a limited number of pathologically confirmed lesions and visually indeterminate cases. In addition, the case distribution may not accurately reflect the real-world prevalence of hepatic metastases and hemangiomas. Although the external validation cohort provided nearly adequate statistical power, it was slightly below the estimated requirement, which may limit the detection of smaller between-sequence differences. Therefore, future studies with larger sample sizes from multiple institutions are warranted to validate the generalizability and clinical applicability of our findings. Second, this study included only clearly delineable lesions on all three T2W imaging sequences, which may have contributed to the high diagnostic performance observed. Third, although multiple lesions per patient were analyzed, statistical adjustments for lesion multiplicity were not incorporated into the per-lesion analysis. Lastly, lesion identification and segmentation were manually performed by a radiologist using a two-dimensional method rather than a fully automated, three-dimensional approach. Given the small size of the lesions (≤2 cm) and a slice thickness of 5 mm, the use of two-dimensional segmentation may have limited the ability of extracted texture features to fully represent lesion volume. In addition, as the segmentation was performed by a single experienced radiologist, inter-observer agreement could not be assessed, which represents another limitation of this study. Nevertheless, the radiomics model demonstrated excellent diagnostic performance, suggesting that a three-dimensional approach could yield even more accurate results and further enhance diagnostic utility.
In conclusion, MRI-based radiomics models using T2W imaging sequences demonstrated strong diagnostic performance in differentiating small (≤2 cm) hepatic metastases from hemangiomas. They may enhance diagnostic confidence for visually indeterminate lesions and have potential as a non-invasive diagnostic tool.
Supplemental Material
sj-docx-1-acr-10.1177_02841851251407343 - Supplemental material for MRI radiomics model using T2-weighted imaging sequences to differentiate small hepatic metastases and hemangiomas
Supplemental material, sj-docx-1-acr-10.1177_02841851251407343 for MRI radiomics model using T2-weighted imaging sequences to differentiate small hepatic metastases and hemangiomas by Sungeun Park, Mi Hye Yu, Hee Sun Park, Sung Il Jung and Young Jun Kim in Acta Radiologica
Footnotes
Data availability
The datasets generated during and/or analyzed during the current study are not publicly available, but are available from the corresponding author on reasonable request.
Declaration of conflicting interests
The authors declared no potential conflicts of interest with respect to the research, authorship, and/or publication of this article.
Funding
The authors disclosed receipt of the following financial support for the research, authorship, and/or publication of this article: This work was supported by Konkuk University Medical Center Research Grant 2024.
Supplementary material
Supplementary material for this article is available online.
References
Supplementary Material
Please find the following supplemental material available below.
For Open Access articles published under a Creative Commons License, all supplemental material carries the same license as the article it is associated with.
For non-Open Access articles published, all supplemental material carries a non-exclusive license, and permission requests for re-use of supplemental material or any part of supplemental material shall be sent directly to the copyright owner as specified in the copyright notice associated with the article.