






Abstract
Differentiating pheochromocytoma from lipid-poor adenoma (LPA) on conventional CT remains challenging because of overlapping imaging features. Radiomics captures relevant quantitative imaging information that maybe useful for this differentiation. We aimed to evaluate the diagnostic performance of CT-based radiomics for the preoperative differentiation of pheochromocytoma from LPA. PubMed, Scopus, Embase, and Web of Science were comprehensively searched from inception through October 13, 2025. Eligible studies applied CT-based radiomics to differentiate pheochromocytoma from LPA. Pooled sensitivity, specificity, likelihood ratios, diagnostic odds ratio, and area under the curve (AUC) were estimated. Statistical heterogeneity was assessed using I2 statistic and subgroup analyses were conducted to find their potential sources. Publication bias was assessed using Deek's funnel plot asymmetry test. After deduplication and thorough screening process, seven studies encompassing 1,272 patients met the inclusion criteria. Six studies were included in the meta-analysis, yielding a pooled sensitivity of 0.92 (95% CI, 0.83–0.97), specificity of 0.89 (95% CI, 0.79–0.94), and AUC of 0.85 (95% CI, 0.81–0.94). Subgroup analyses showed higher sensitivity in studies reporting image preprocessing (0.97 vs 0.83, P < 0.01). No considerable publication bias was detected (P = 0.12). Nomogram models integrating radiomics with clinicoradiological features achieved significantly higher AUCs than radiomics-only models (0.95 vs 0.87, P = 0.004). In conclusion, CT-based radiomics demonstrated high accuracy for distinguishing pheochromocytoma from LPA, with unenhanced CT providing the strongest discrimination. Integration of radiomics with clinicoradiological variables further enhances performance. However, multicenter validation with standardized pipelines is needed for clinical translation.
Introduction
The widespread use of high-resolution cross-sectional imaging in routine clinical practice has markedly increased the detection of adrenal incidentalomas, now identified in approximately 4%–10% of adults (1–3). Although approximately 80% of these lesions are benign, non-functioning adrenocortical adenomas, accurate differentiation from potentially life-threatening entities, particularly pheochromocytomas, remains the primary clinical concern (4,5). Pheochromocytomas are catecholamine-secreting tumors located in the adrenal medulla (6). These rare neuroendocrine tumors carry a high risk of severe intraoperative hemodynamic instability and cardiovascular collapse if misdiagnosed and operated on without appropriate α-adrenergic blockade; therefore, accurate preoperative differentiation is critical for patient safety (7–9).
Historically, the non-invasive characterization of adrenal masses has relied primarily on unenhanced computed tomography (CT) (10). A homogeneous adrenal mass with unenhanced attenuation ≤10 Hounsfield units (HU) is widely accepted as diagnostic of lipid-rich adenoma, with near-100% specificity (11). However, up to 30% of benign adenomas are lipid-poor (LPA), posing a significant diagnostic challenge (12). On unenhanced CT, LPAs often exhibit attenuation values exceeding 10 HU, overlapping with the appearance of pheochromocytomas and metastases (13). Consequently, dynamic contrast-enhanced CT with washout analysis has been the clinical standard for two decades, leveraging the more rapid contrast washout of adenomas compared with non-adenomatous lesions (13,14). Although widely used in clinical practice, washout-based characterization lacks complete specificity. Pheochromocytomas may demonstrate washout kinetics similar to LPAs, likely due to their high vascularity and abnormal capillary permeability (15). This hemodynamic overlap may result in false-positive benign classifications, potentially leading to inappropriate clinical decisions, including unsafe discharge or unwarranted surgical intervention in patients with malignant tumors (16,17).
In response to these diagnostic limitations, radiomics has emerged as a transformative approach in precision oncology (18,19). Predicated on the hypothesis that medical images encode high-dimensional information reflective of tissue pathophysiology, radiomics entails the extraction of quantitative features beyond visual assessment (20–22). At the tissue level, this distinction is particularly relevant for the adrenal gland: LPAs typically exhibit relatively organized cellular architecture, whereas pheochromocytomas show marked intratumoral heterogeneity driven by hypervascularity, hemorrhage, and cystic degeneration (23).
Although CT-based radiomics has been investigated for this differential diagnosis, existing evidence remains heterogeneous and inconclusive. Differences in sample size, segmentation approaches (2D vs. 3D), and modeling strategies have led to inconsistent diagnostic performance. This study therefore systematically synthesizes available data to evaluate the diagnostic accuracy of CT-based radiomics for differentiating pheochromocytoma from LPA and its added value beyond conventional imaging.
Material and Methods
This study was conducted according to the Preferred Reporting Items for a Systematic Review and Meta-analysis of Diagnostic Test Accuracy Studies (PRISMA-DTA) guidelines (24). To ensure methodological transparency, the study protocol was registered a priori in the International Prospective Register of Systematic Reviews (PROSPERO; registration no. CRD420251167875).
Eligibility criteria
This study was designed to address the following priori research question: What is the overall diagnostic performance of CT-based radiomics for the preoperative differentiation of pheochromocytoma from lipid-poor adenoma (LPA)? To address this question, studies were considered eligible if they met the following criteria: (i) employed radiomics analysis to differentiate pheochromocytoma from LPA; (ii) used CT-based radiomics as the index test; (iii) applied histopathological assessment, based on surgical or biopsy specimens, as the reference standard; and (v) reported diagnostic performance outcomes, including either of sensitivity, specificity, accuracy, and/or area under the curve (AUC). In this study, radiomics analysis refers to classification models constructed using hand-crafted features extracted from CT images. Exclusion criteria comprised review articles, letters, commentaries, conference abstracts, unpublished studies, case reports, case series, experimental studies, non-peer-reviewed publications, and studies with full texts published in non-English languages.
Literature search
A comprehensive literature search was conducted in PubMed, Scopus, Embase, and Web of Science to identify all relevant studies published from database inception through 13 October 2025, without applying any filters or restrictions. Database-specific search strategies were developed using combinations of keywords related to radiomics, pheochromocytoma, and adenoma; the full search strategies are provided in Table S1 (see supplementary material). All retrieved records were imported into EndNote (version 21), where duplicate entries were removed (25). Subsequently, two reviewers independently screened titles and abstracts according to the predefined eligibility criteria, followed by full-text assessment of potentially eligible studies. Any discrepancies were resolved through discussion and consultation with a senior reviewer to achieve consensus. In addition, the reference lists of included articles were manually screened to identify any additional relevant studies.
Data extraction and quality assessment
Data extraction was independently conducted by two reviewers using a predefined, standardized Excel spreadsheet. Extracted variables included study characteristics (country, study design, number of centers), cohort details (number of patients and lesions), imaging parameters (lesion HU, scanner specifications, imaging phases, and image preprocessing), radiomics methodology (segmentation strategy, feature extraction and selection methods, classifiers, and validation approaches), as well as details of nomogram models and performance metrics. When multiple models were reported within a study, data from the radiomics model achieving the highest AUC were prioritized. Two independent reviewers assessed the methodological quality of each included study using the Methodological Radiomics Score (METRICS) tool (26). METRICS evaluates radiomics studies across multiple domains, including study design, imaging data, segmentation, image processing and feature selection, feature processing, preparation for modeling, model evaluation and comparison, testing, and open science. Scores range from 0 to 100, with higher scores indicating greater methodological rigor. Any discrepancies between reviewers during quality assessment or data extraction were resolved by consensus, with adjudication by a senior reviewer when necessary.
Data synthesis
All quantitative analyses and visualizations were performed using R (version 4.4.0; R Foundation for Statistical Computing, Vienna, Austria), utilizing the “mada”, “meta”, and “metafor” packages (27,28). Pooled diagnostic performance metrics, including sensitivity, specificity, positive likelihood ratio (PLR), negative likelihood ratio (NLR), and diagnostic odds ratio (DOR) were estimated using a bivariate random-effects model, with corresponding 95% confidence intervals (CIs). Overall diagnostic performance was summarized by constructing a summary receiver operating characteristic (sROC) curve, with an area under the curve (AUC) approaching 1.0 indicating optimal discriminative ability. The 95% CI for the AUC was derived via nonparametric bootstrapping with 1000 resamples using the “boot” package (29). Robustness of the pooled estimates was examined through sensitivity analyses employing a leave-one-out strategy, whereby each study was sequentially removed and the summary estimates recalculated. Between-study heterogeneity was quantified using Higgins’ I2 statistic, with values greater than 50% considered indicative of substantial heterogeneity (30). Subgroup analyses were undertaken to investigate potential sources of heterogeneity. Publication bias was assessed using Deeks’ funnel plot asymmetry test (31). Model selection was ranked according to validation strategy, prioritizing external test cohorts, followed by internal hold-out validation when external testing was not available. Only studies reporting sufficient data to reconstruct 2 × 2 contingency tables were eligible for quantitative synthesis. A separate meta-analysis was performed using the standardized mean difference (Cohen's d) to quantify differences in HU values between pheochromocytomas and LPAs on unenhanced and contrast-enhanced CT images. Corresponding authors were contacted via email when key data were missing or unclear. Studies for which the required information could not be obtained were retained for qualitative synthesis but excluded from the meta-analysis. When potential overlap between patient cohorts was identified, only the study that included an independent test cohort was retained. For studies that developed both radiomics-only and nomogram models and reported sufficient data to reconstruct contingency tables for each, pooled AUCs were calculated, and their overall diagnostic performance was compared using a z-test. Models combining radiomics features with clinical or conventional radiological variables were classified as nomogram models.
Results
Literature search
A comprehensive literature search across four databases yielded 767 records. After removal of 329 duplicates, 438 unique records were screened based on titles and abstracts, leading to the exclusion of 405 records. The full texts of the remaining 33 articles were independently reviewed by two investigators. Of these, 26 studies were excluded for the following reasons: inclusion of cohorts other than pheochromocytoma versus LPA (e.g. lipid-rich adenoma, adrenocortical carcinoma, or metastatic lesions), absence of radiomics analysis (e.g. reliance on conventional imaging features), conference abstracts, or slice-level analyses that evaluated multiple images from a single lesion. Finally, seven studies met the inclusion criteria and were included in the review (32–38). The study selection process is summarized in Fig. 1.
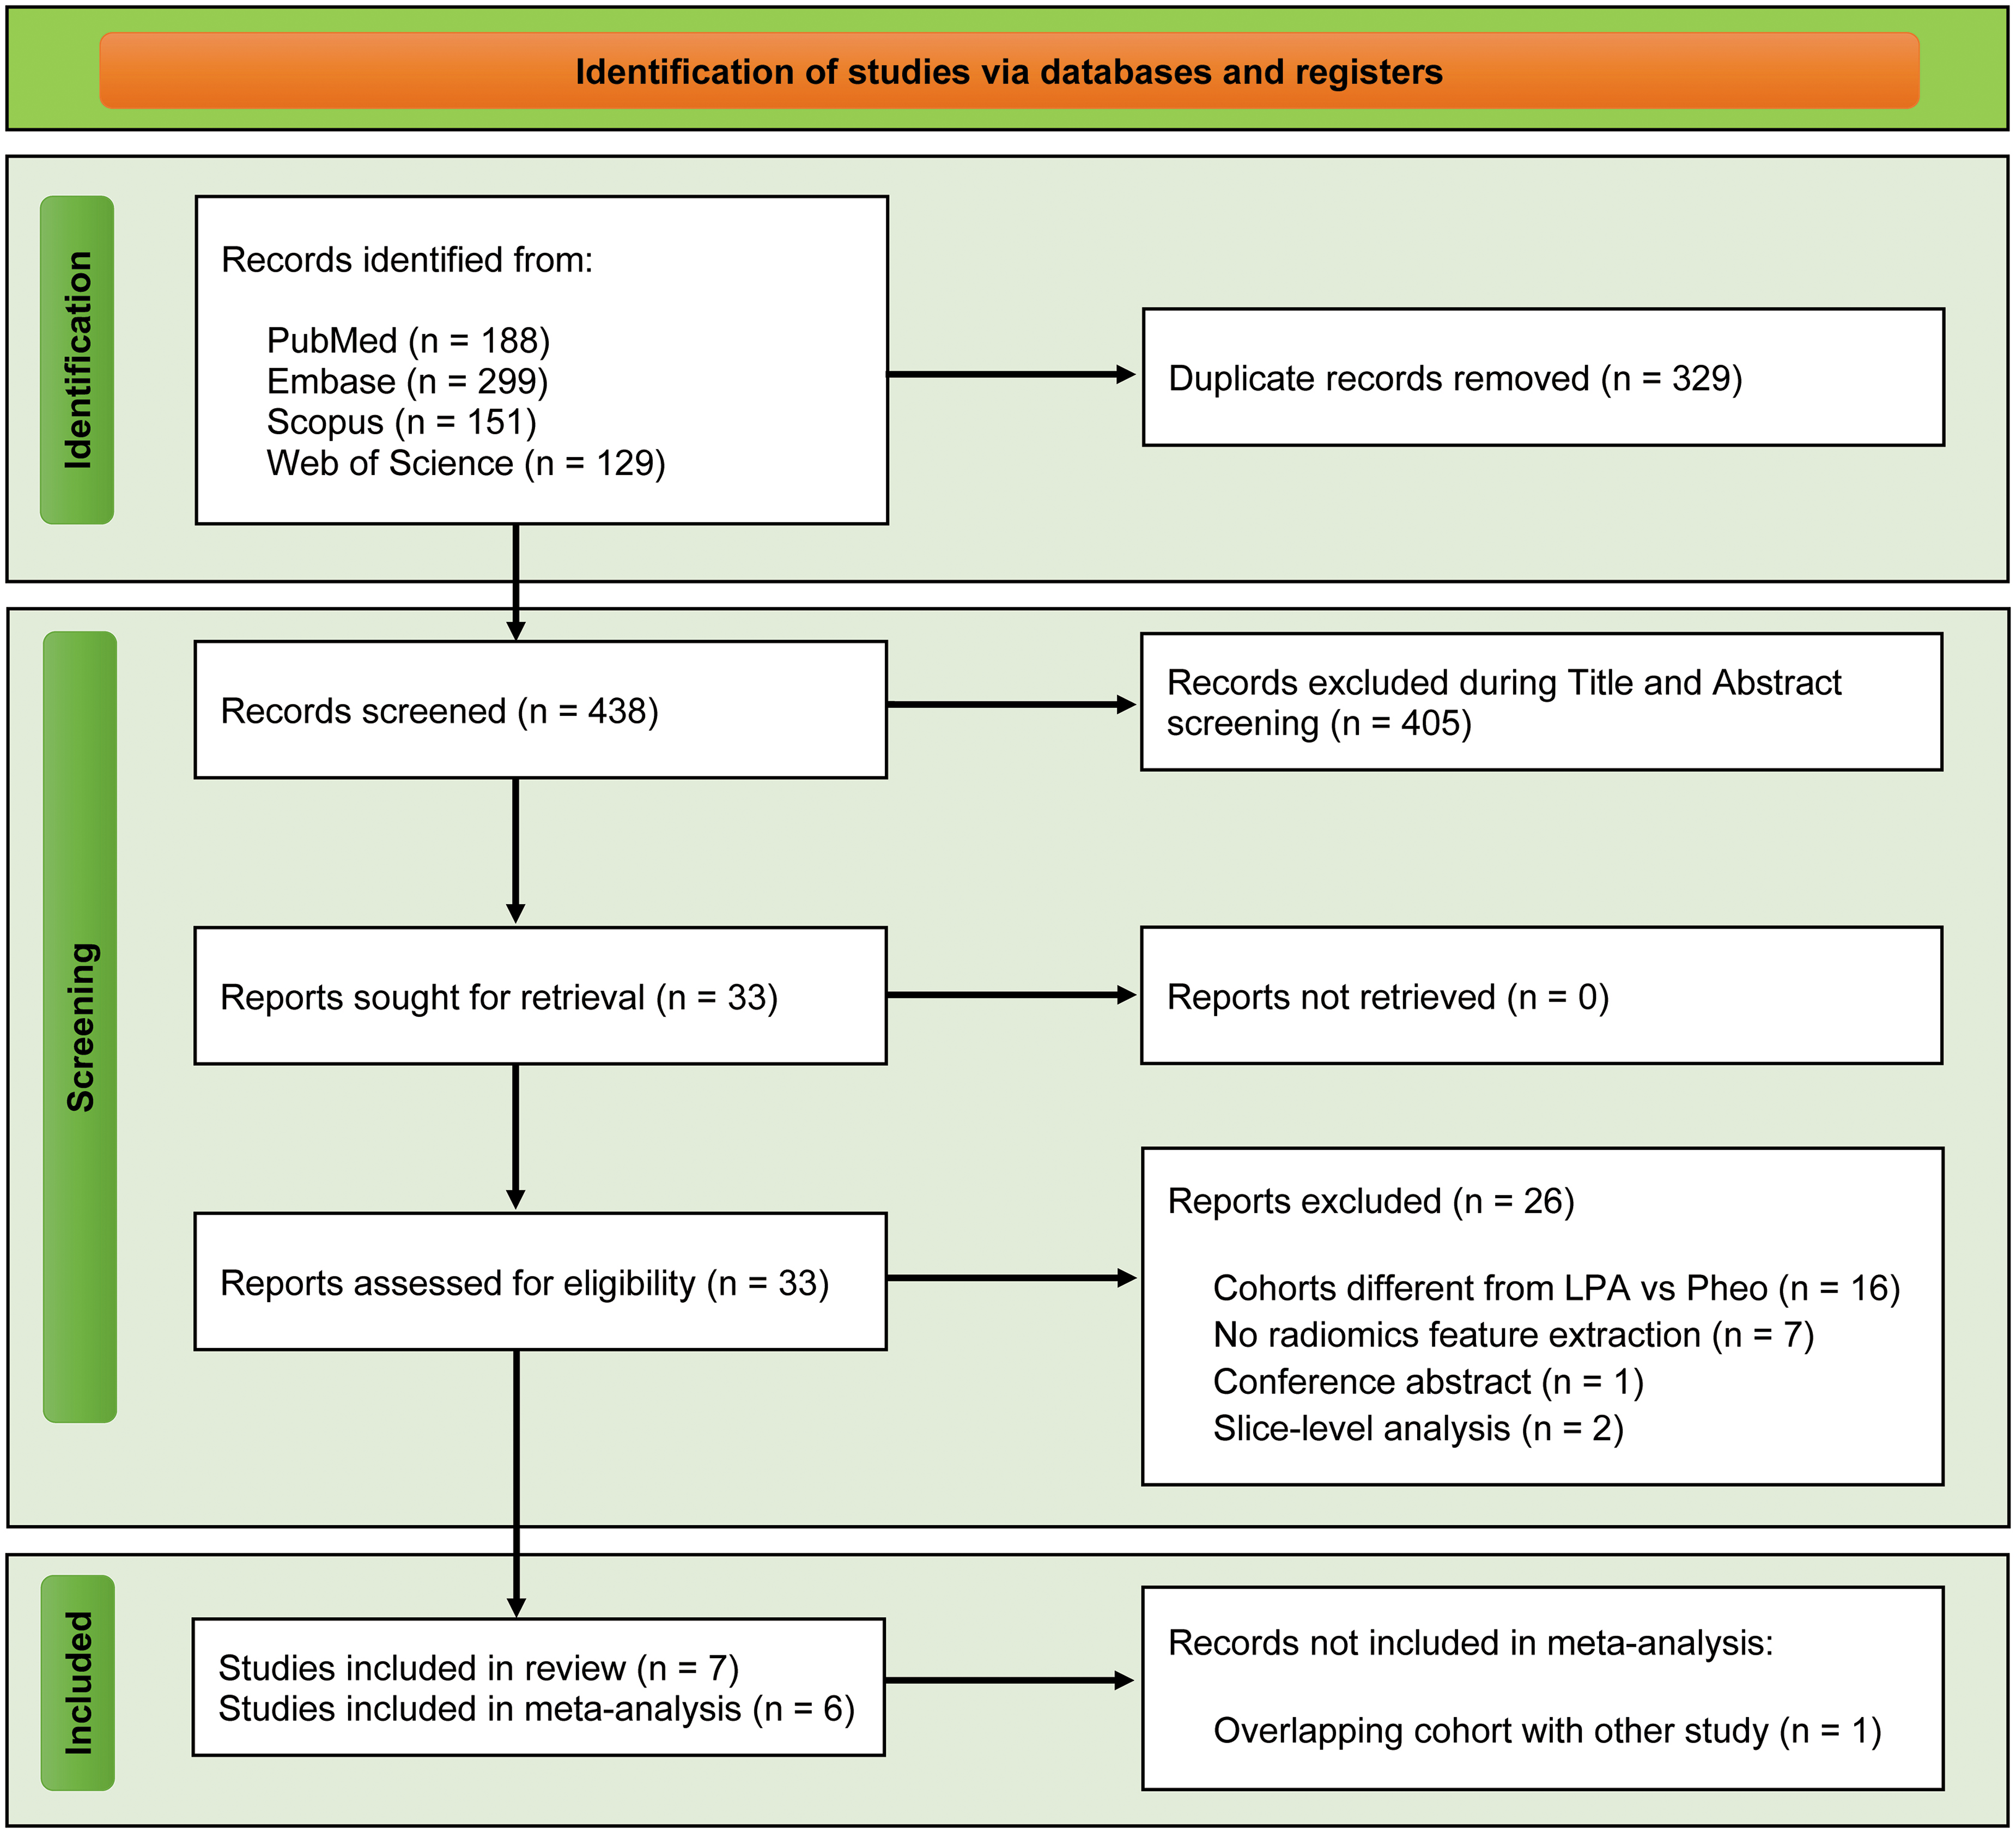
PRISMA flow diagram of study selection.
Study characteristics
Across eligible studies, 1272 patients were included (566 pheochromocytomas, 706 LPAs), published between 2017 and 2025, with sample sizes in the range of 56–352 patients. All studies employed a retrospective design; two were multicenter and five were single-center investigations. Histopathological confirmation based on adrenalectomy specimens served as the reference standard in all studies. Model validation strategies varied: two studies performed external validation, four used internal hold-out validation cohorts, and three evaluated model performance using the entire dataset without an independent validation set. Image preprocessing before feature extraction was reported in four studies and included normalization and resampling procedures. Manual segmentation was used in five studies, while two employed semi-automatic segmentation approaches. Logistic regression was the most frequently identified best-performing classifier, achieving the highest diagnostic performance in four studies. Details are shown in Tables 1, 2, and 3.
Demographic and imaging characteristics of included studies.
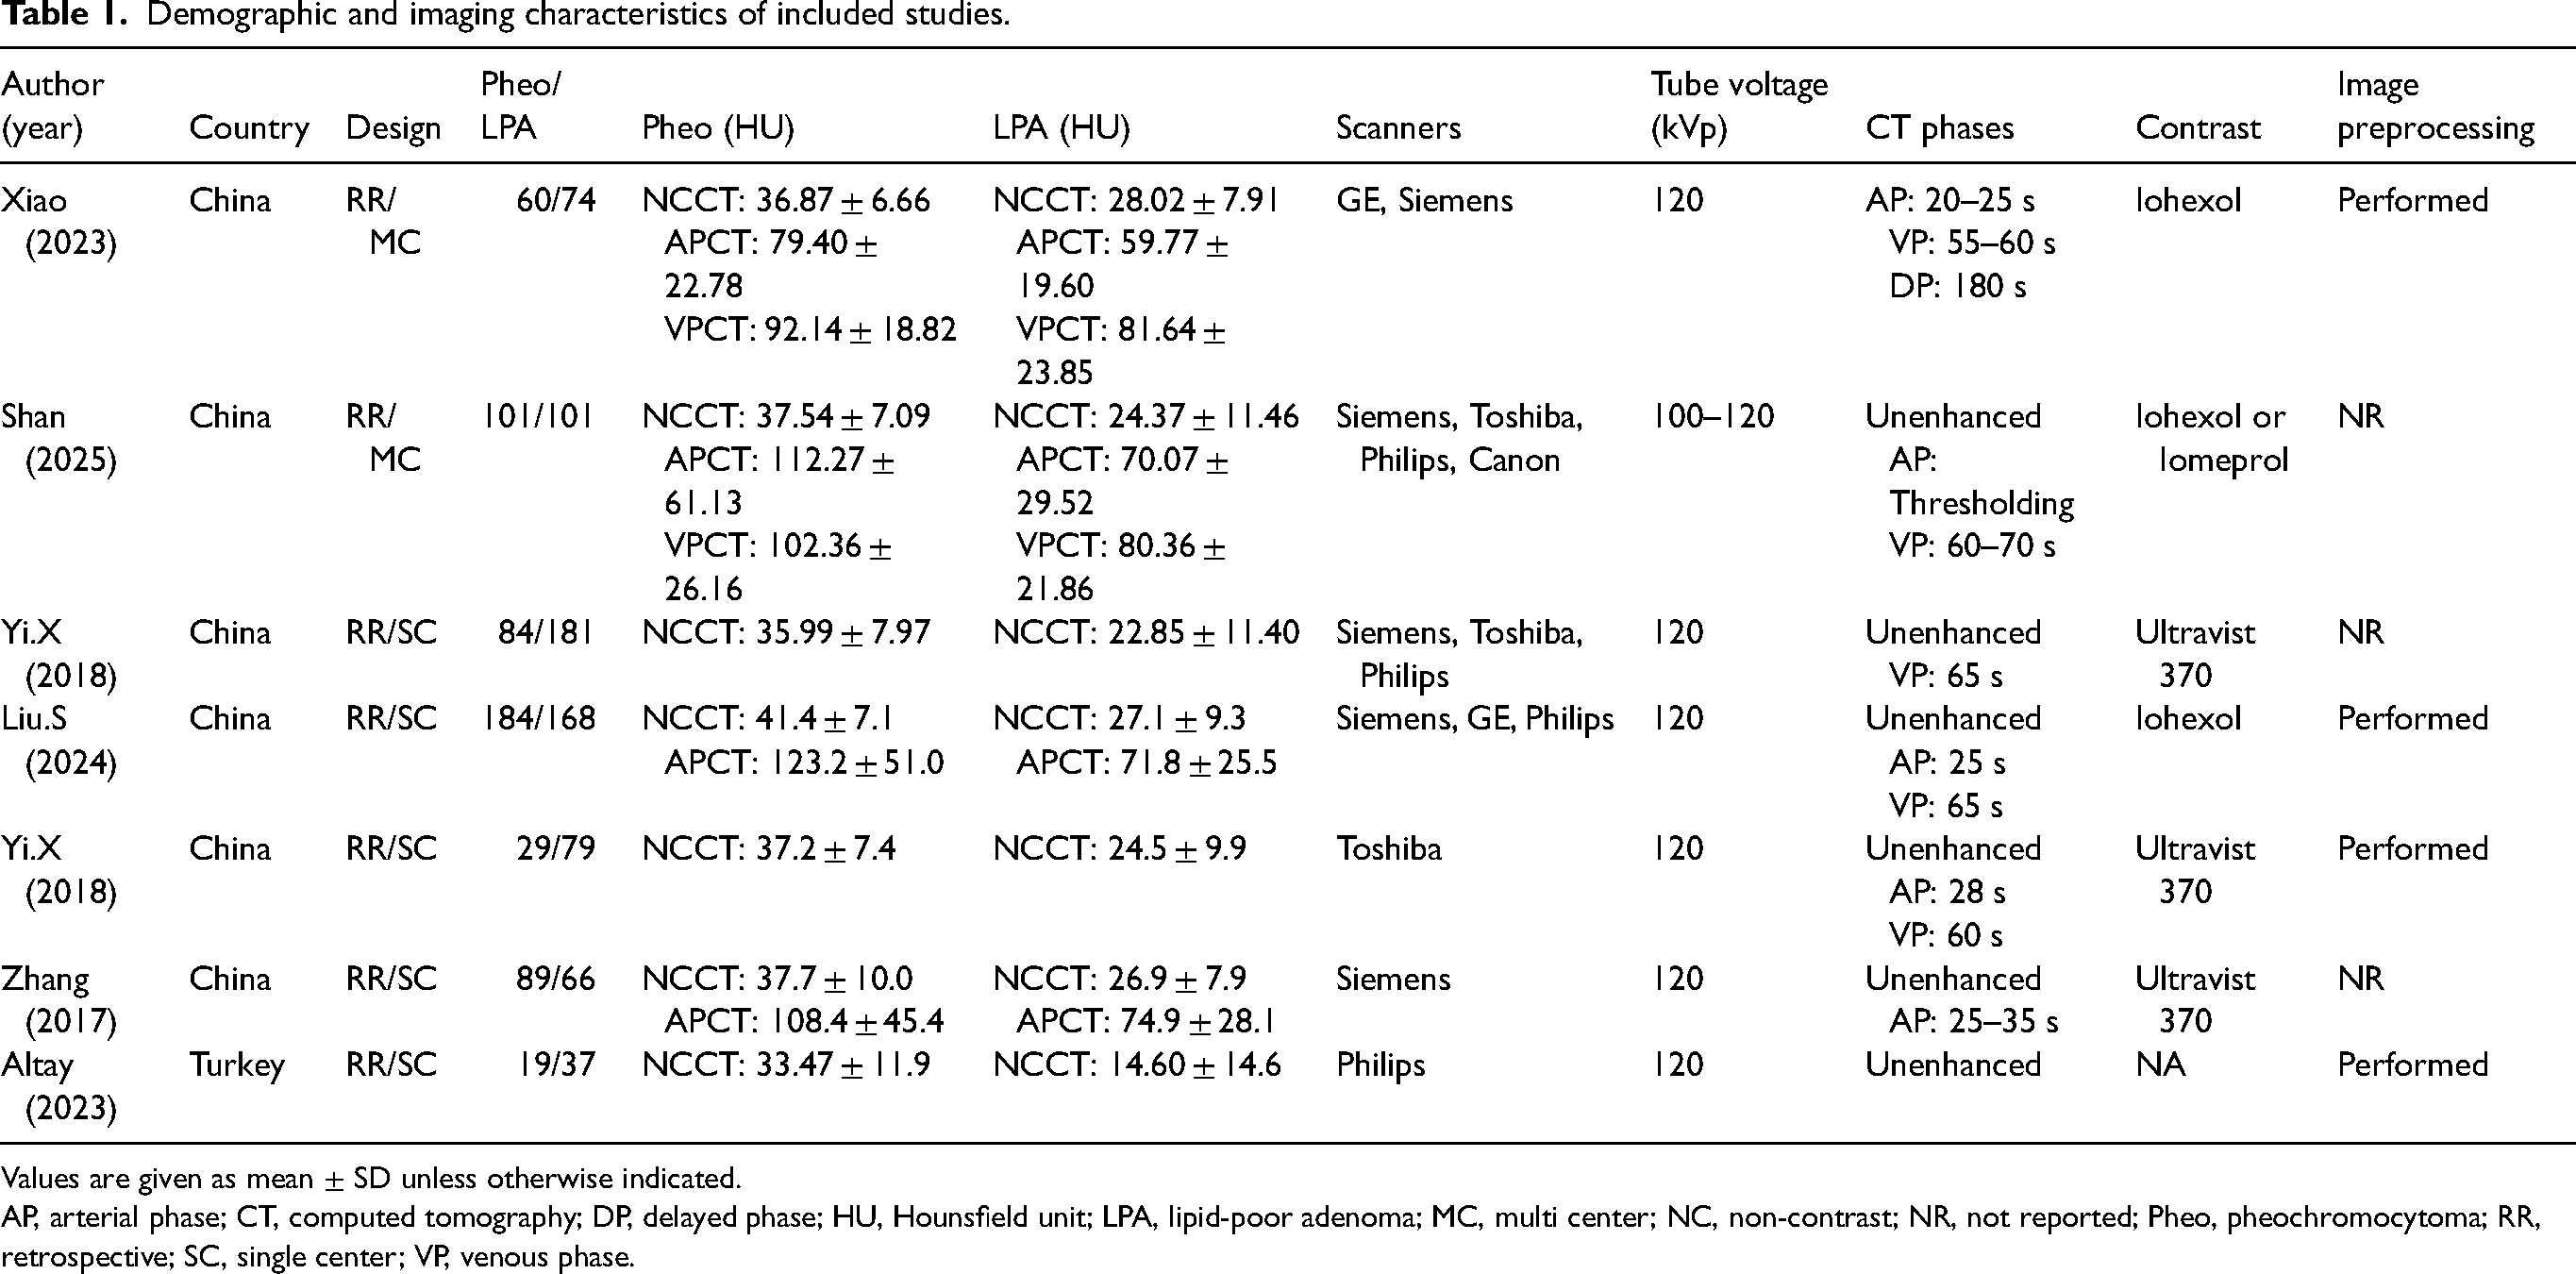
Values are given as mean ± SD unless otherwise indicated.
AP, arterial phase; CT, computed tomography; DP, delayed phase; HU, Hounsfield unit; LPA, lipid-poor adenoma; MC, multi center; NC, non-contrast; NR, not reported; Pheo, pheochromocytoma; RR, retrospective; SC, single center; VP, venous phase.
Details of segmentation, feature extraction and classifiers used in the included studies.
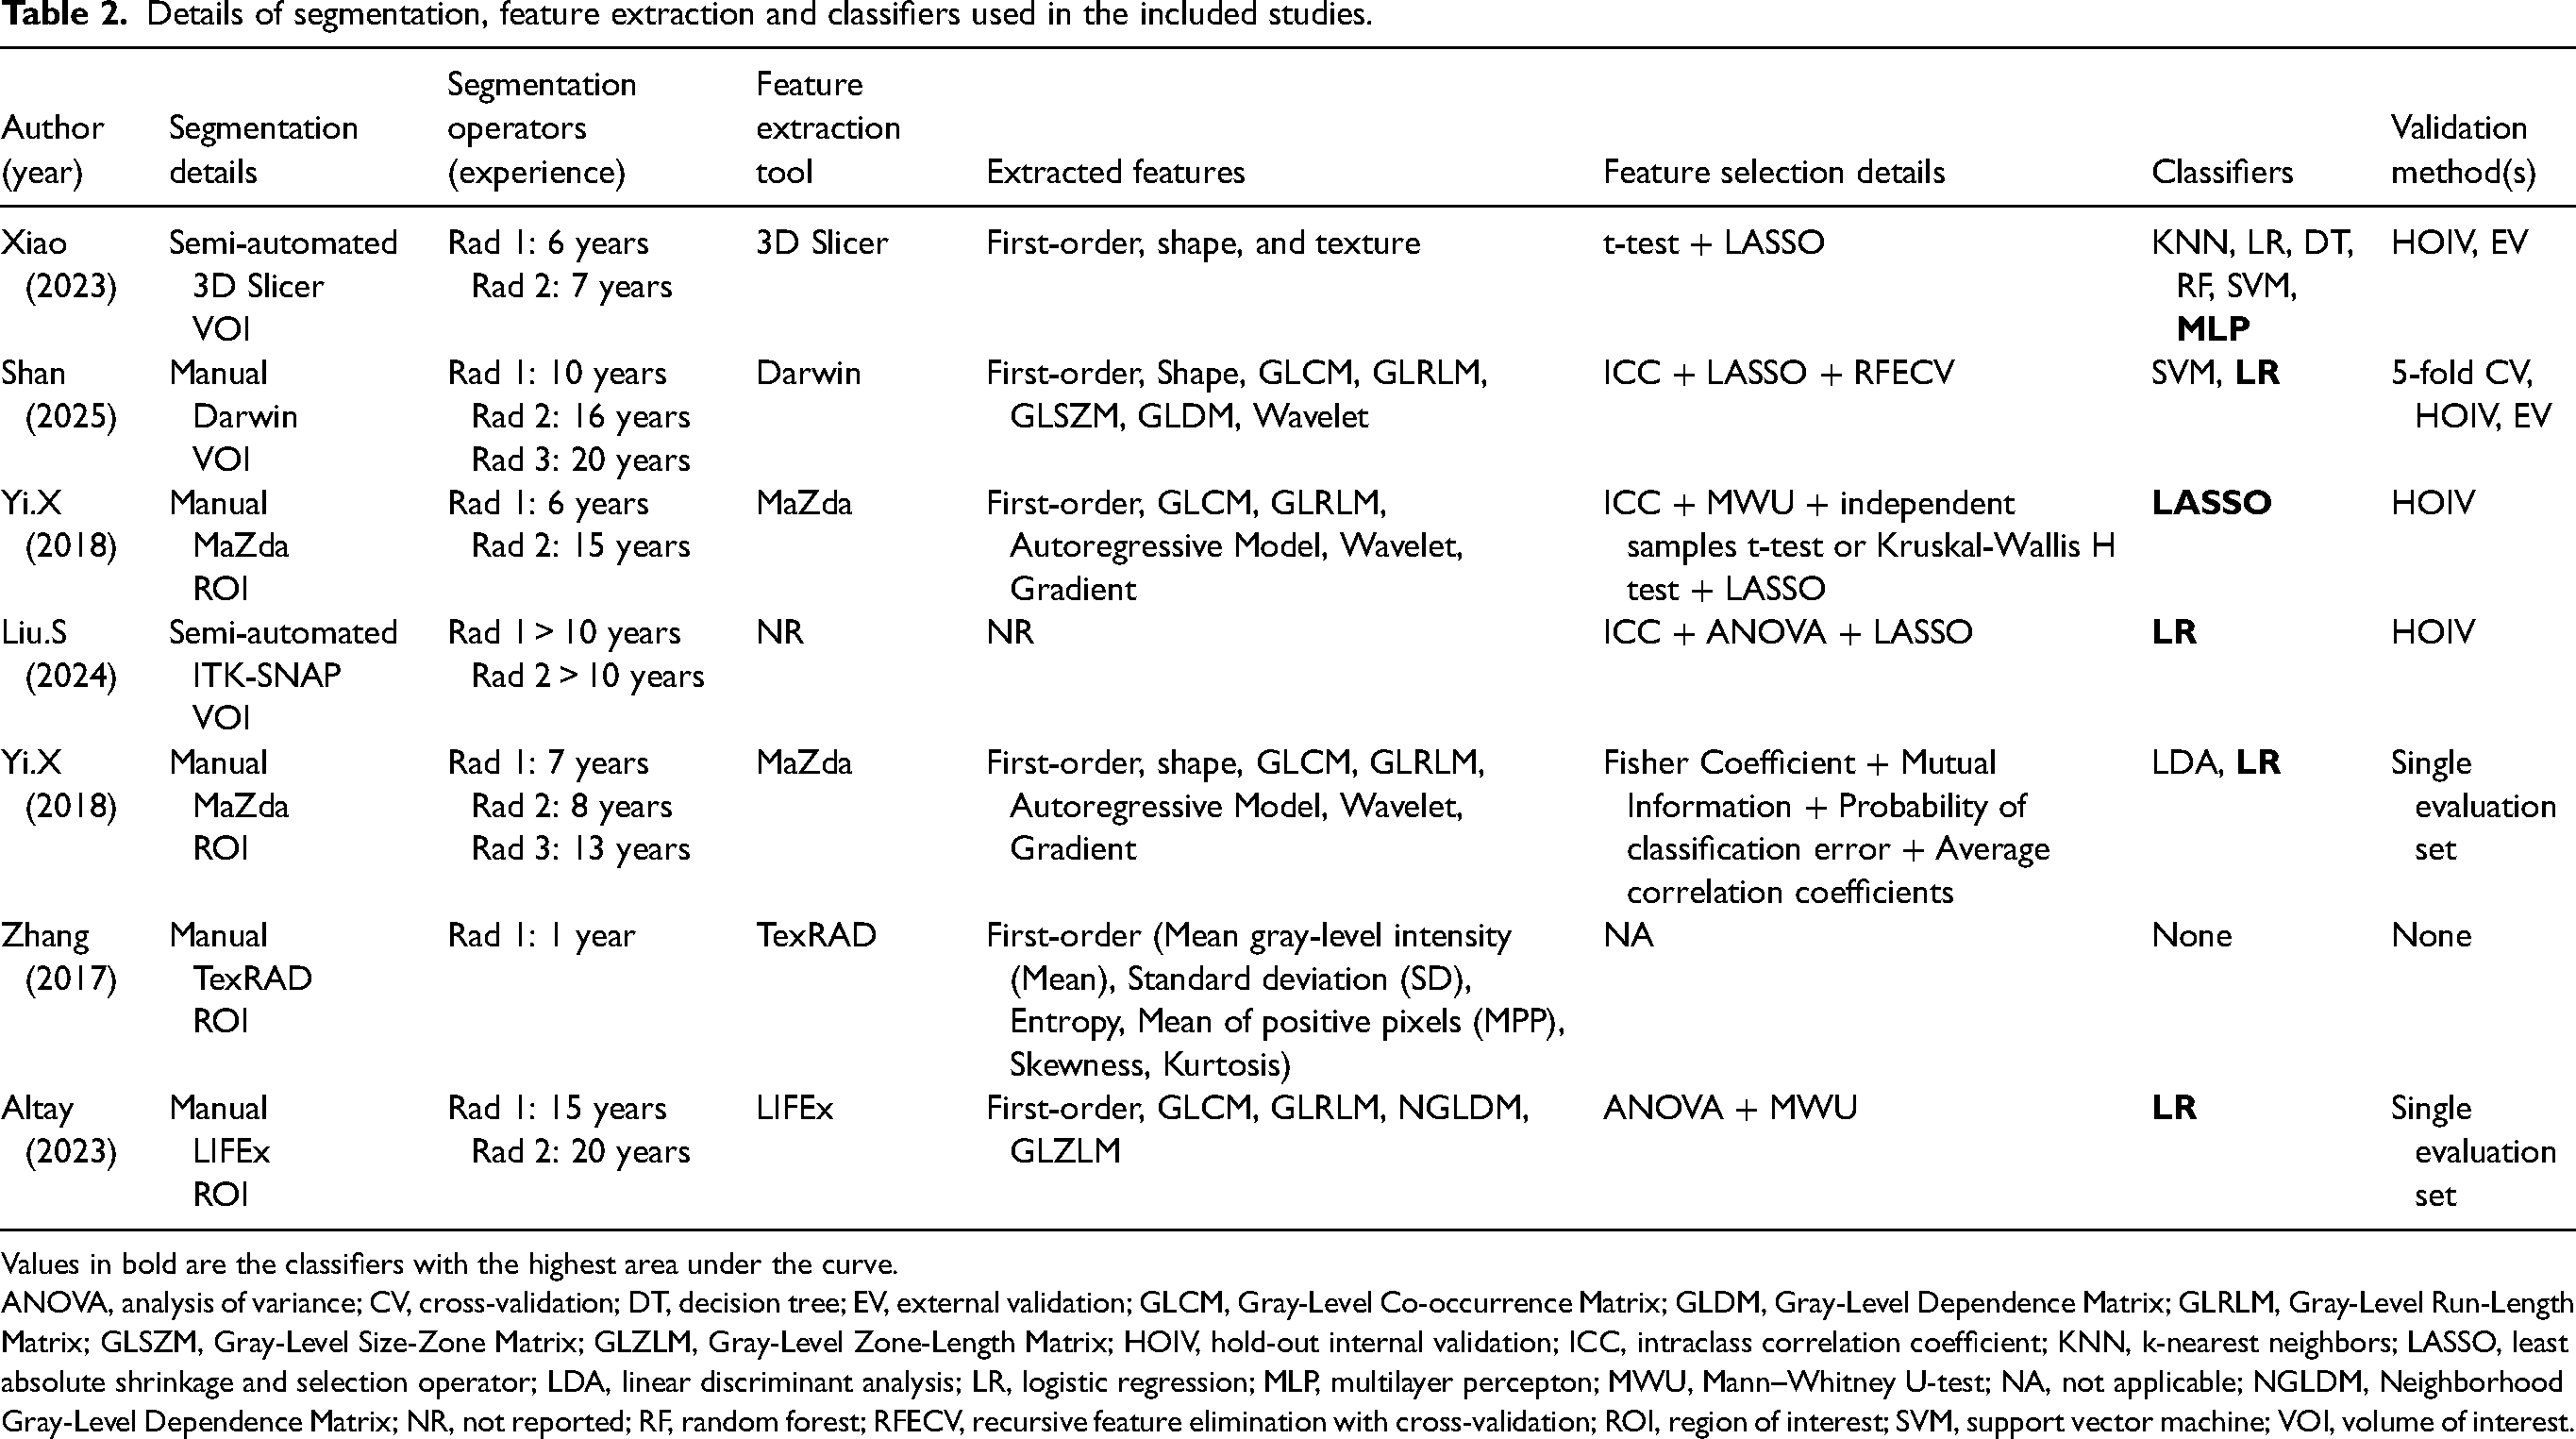
Values in bold are the classifiers with the highest area under the curve.
ANOVA, analysis of variance; CV, cross-validation; DT, decision tree; EV, external validation; GLCM, Gray-Level Co-occurrence Matrix; GLDM, Gray-Level Dependence Matrix; GLRLM, Gray-Level Run-Length Matrix; GLSZM, Gray-Level Size-Zone Matrix; GLZLM, Gray-Level Zone-Length Matrix; HOIV, hold-out internal validation; ICC, intraclass correlation coefficient; KNN, k-nearest neighbors; LASSO, least absolute shrinkage and selection operator; LDA, linear discriminant analysis; LR, logistic regression; MLP, multilayer percepton; MWU, Mann–Whitney U-test; NA, not applicable; NGLDM, Neighborhood Gray-Level Dependence Matrix; NR, not reported; RF, random forest; RFECV, recursive feature elimination with cross-validation; ROI, region of interest; SVM, support vector machine; VOI, volume of interest.
Performance metrics of the best models reported in the included studies.
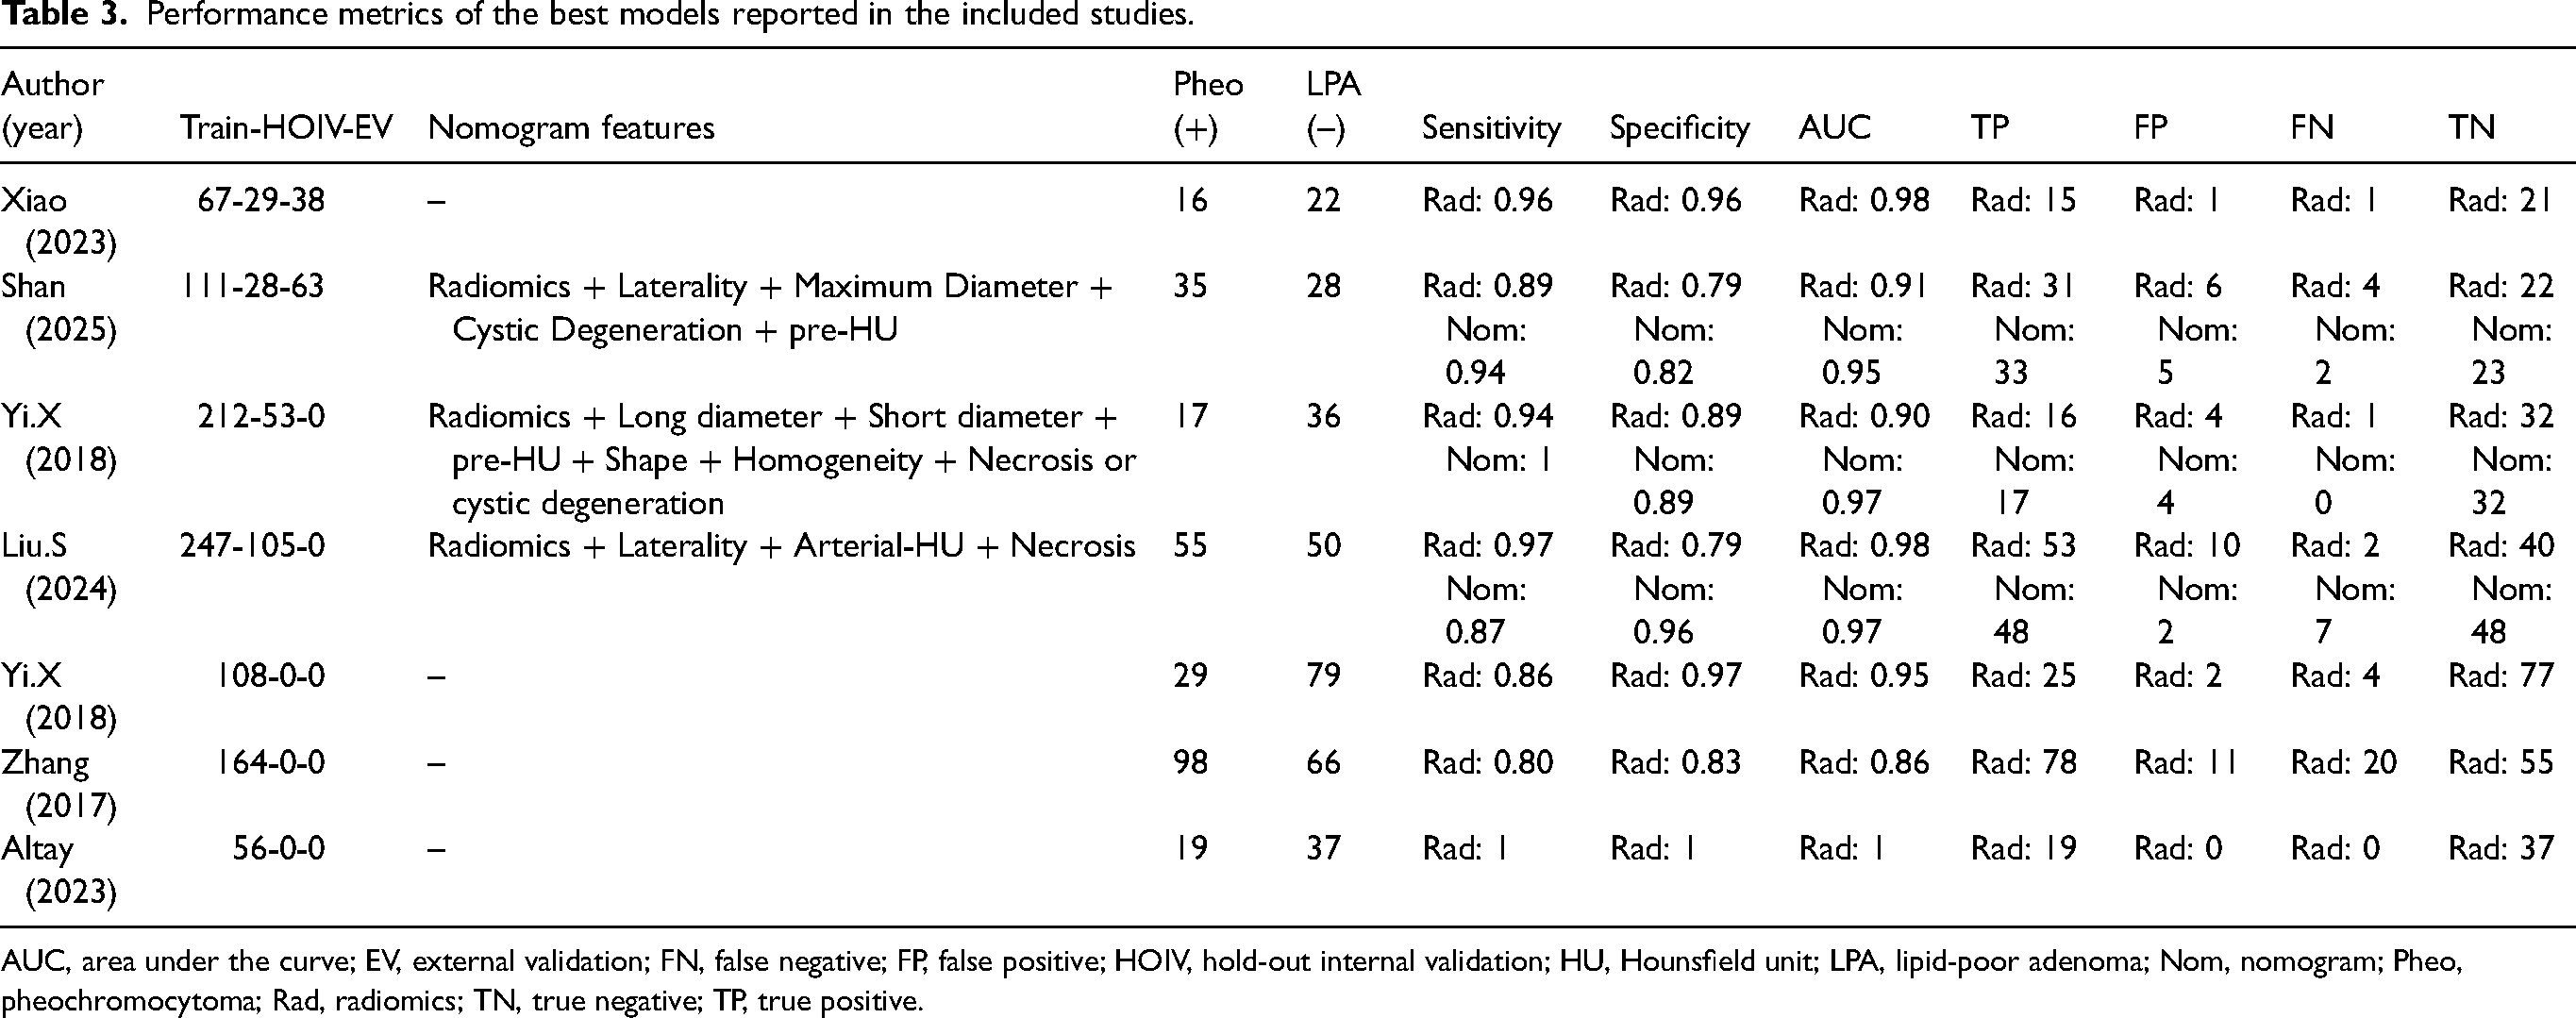
AUC, area under the curve; EV, external validation; FN, false negative; FP, false positive; HOIV, hold-out internal validation; HU, Hounsfield unit; LPA, lipid-poor adenoma; Nom, nomogram; Pheo, pheochromocytoma; Rad, radiomics; TN, true negative; TP, true positive.
Quality assessment
Using the METRICS tool, three studies were rated as good quality and four as moderate quality (Table S2 in the supplementary material). Methodological scores were in the range of 41.9%–79.5%, with a mean of 57.6% and a median of 55.7%. The most frequently observed limitations included insufficient adherence to open science practices (e.g. lack of code, model, and data availability), absence of model calibration assessment, inadequate consideration or reporting of potential confounders, and incomplete reporting of radiomics feature extraction parameters. Additional shortcomings involved the lack of fully automated segmentation approaches, failure to report the time interval between the index test and the reference standard, limited compliance with established radiomics and/or machine-learning reporting guidelines, and a scarcity of multicenter study designs.
Meta-analysis
Four studies reported mean HU values with corresponding standard deviations for both pheochromocytomas and LPAs on unenhanced and contrast-enhanced CT images (33,35,37,38). Pooled standardized mean differences (Cohen's d) were calculated separately for each imaging phase to compare their discriminative performance. As illustrated in Fig. 2, the unenhanced phase demonstrated a larger effect size (Cohen's d = 1.40; 95% CI = 1.13–1.67) compared with the contrast-enhanced phase (Cohen's d = 1.00; 95% CI = 0.79–1.22), indicating superior discrimination between the two entities on unenhanced CT.
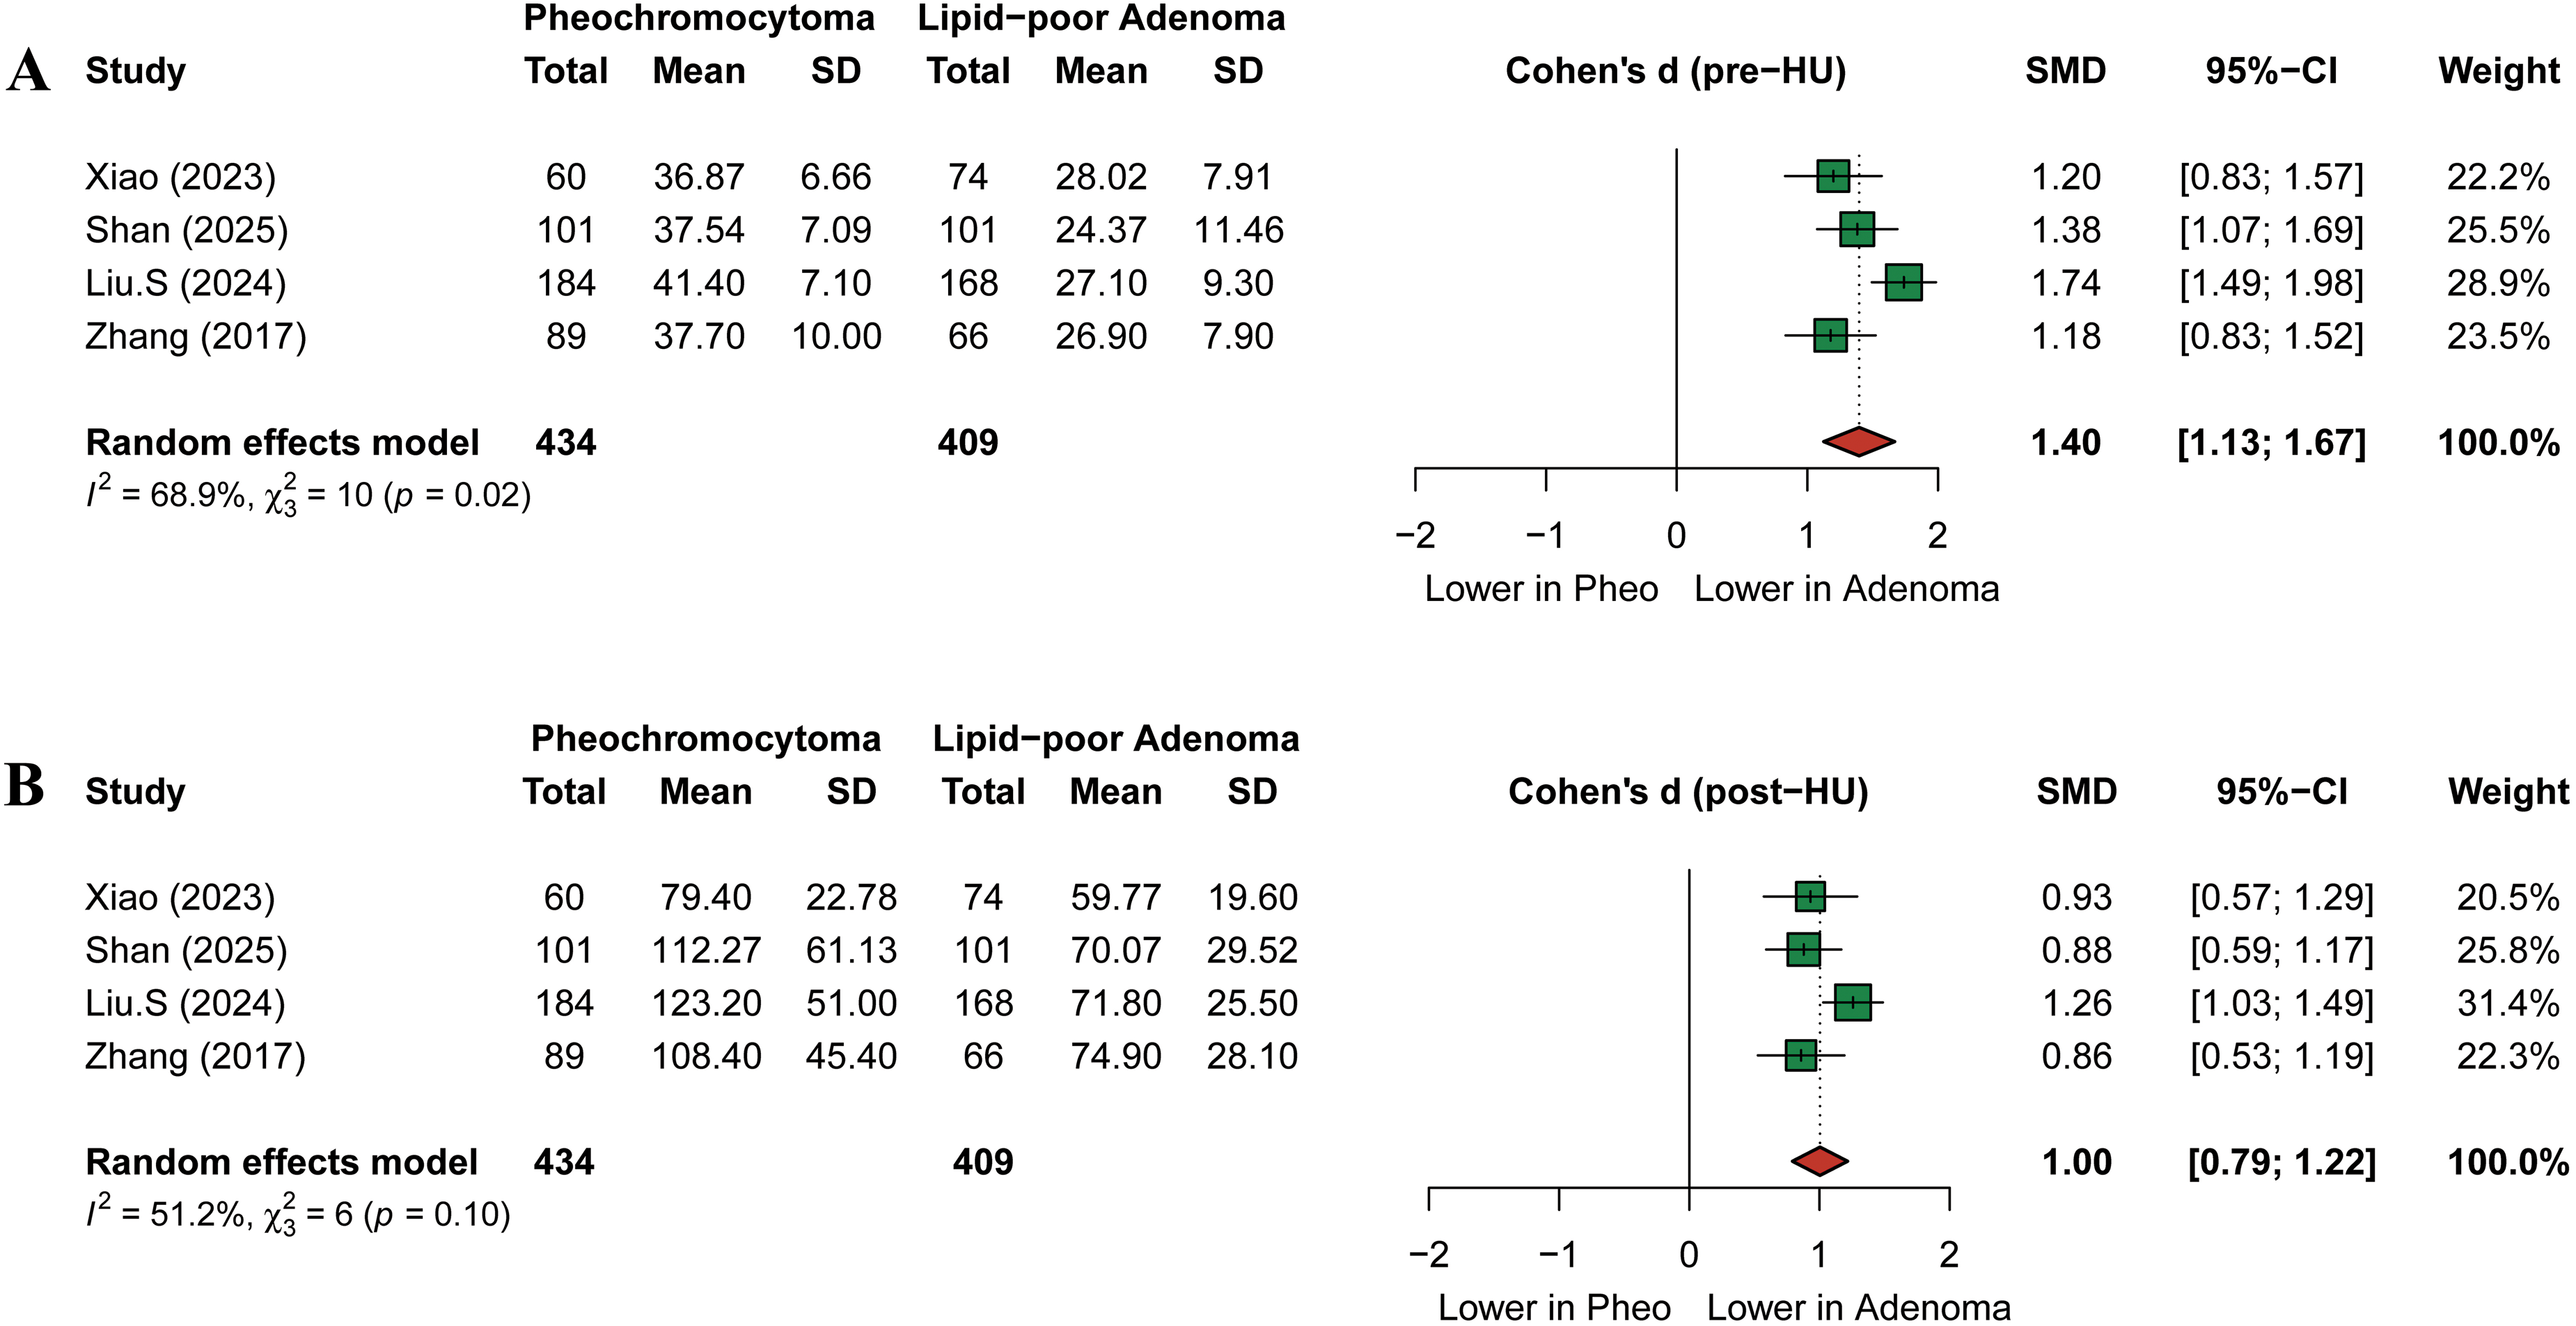
Forest plots illustrating the standardized mean differences in CT attenuation values between pheochromocytoma and lipid-poor adenoma on (a) unenhanced and (b) contrast-enhanced CT images. CT, computed tomography.
To further evaluate diagnostic performance of CT-based radiomics models for this purpose, a meta-analysis of diagnostic test accuracy was performed. Two studies were identified as including overlapping patient cohorts; therefore, one study was excluded to prevent data duplication (34). Finally, six independent studies comprising 240 pheochromocytomas and 239 LPAs were included in the diagnostic test accuracy meta-analysis (32,33,35–38). The pooled analysis demonstrated a sensitivity of 0.92 (95% CI = 0.83–0.97; I2 = 45%) and a specificity of 0.89 (95% CI = 0.79–0.94; I2 = 0%) (Fig. 3). The PLR was 5.37 (95% CI = 3.91–7.36; I2 = 30%), NLR was 0.11 (95% CI = 0.05–0.23; I2 = 52%), and DOR was 70.88 (95% CI = 23.14–217.13; I2 = 59%) (Figure S1 in the supplementary material). The model achieved an AUC of 0.85 (95% CI = 0.81–0.94) (Fig. 4).
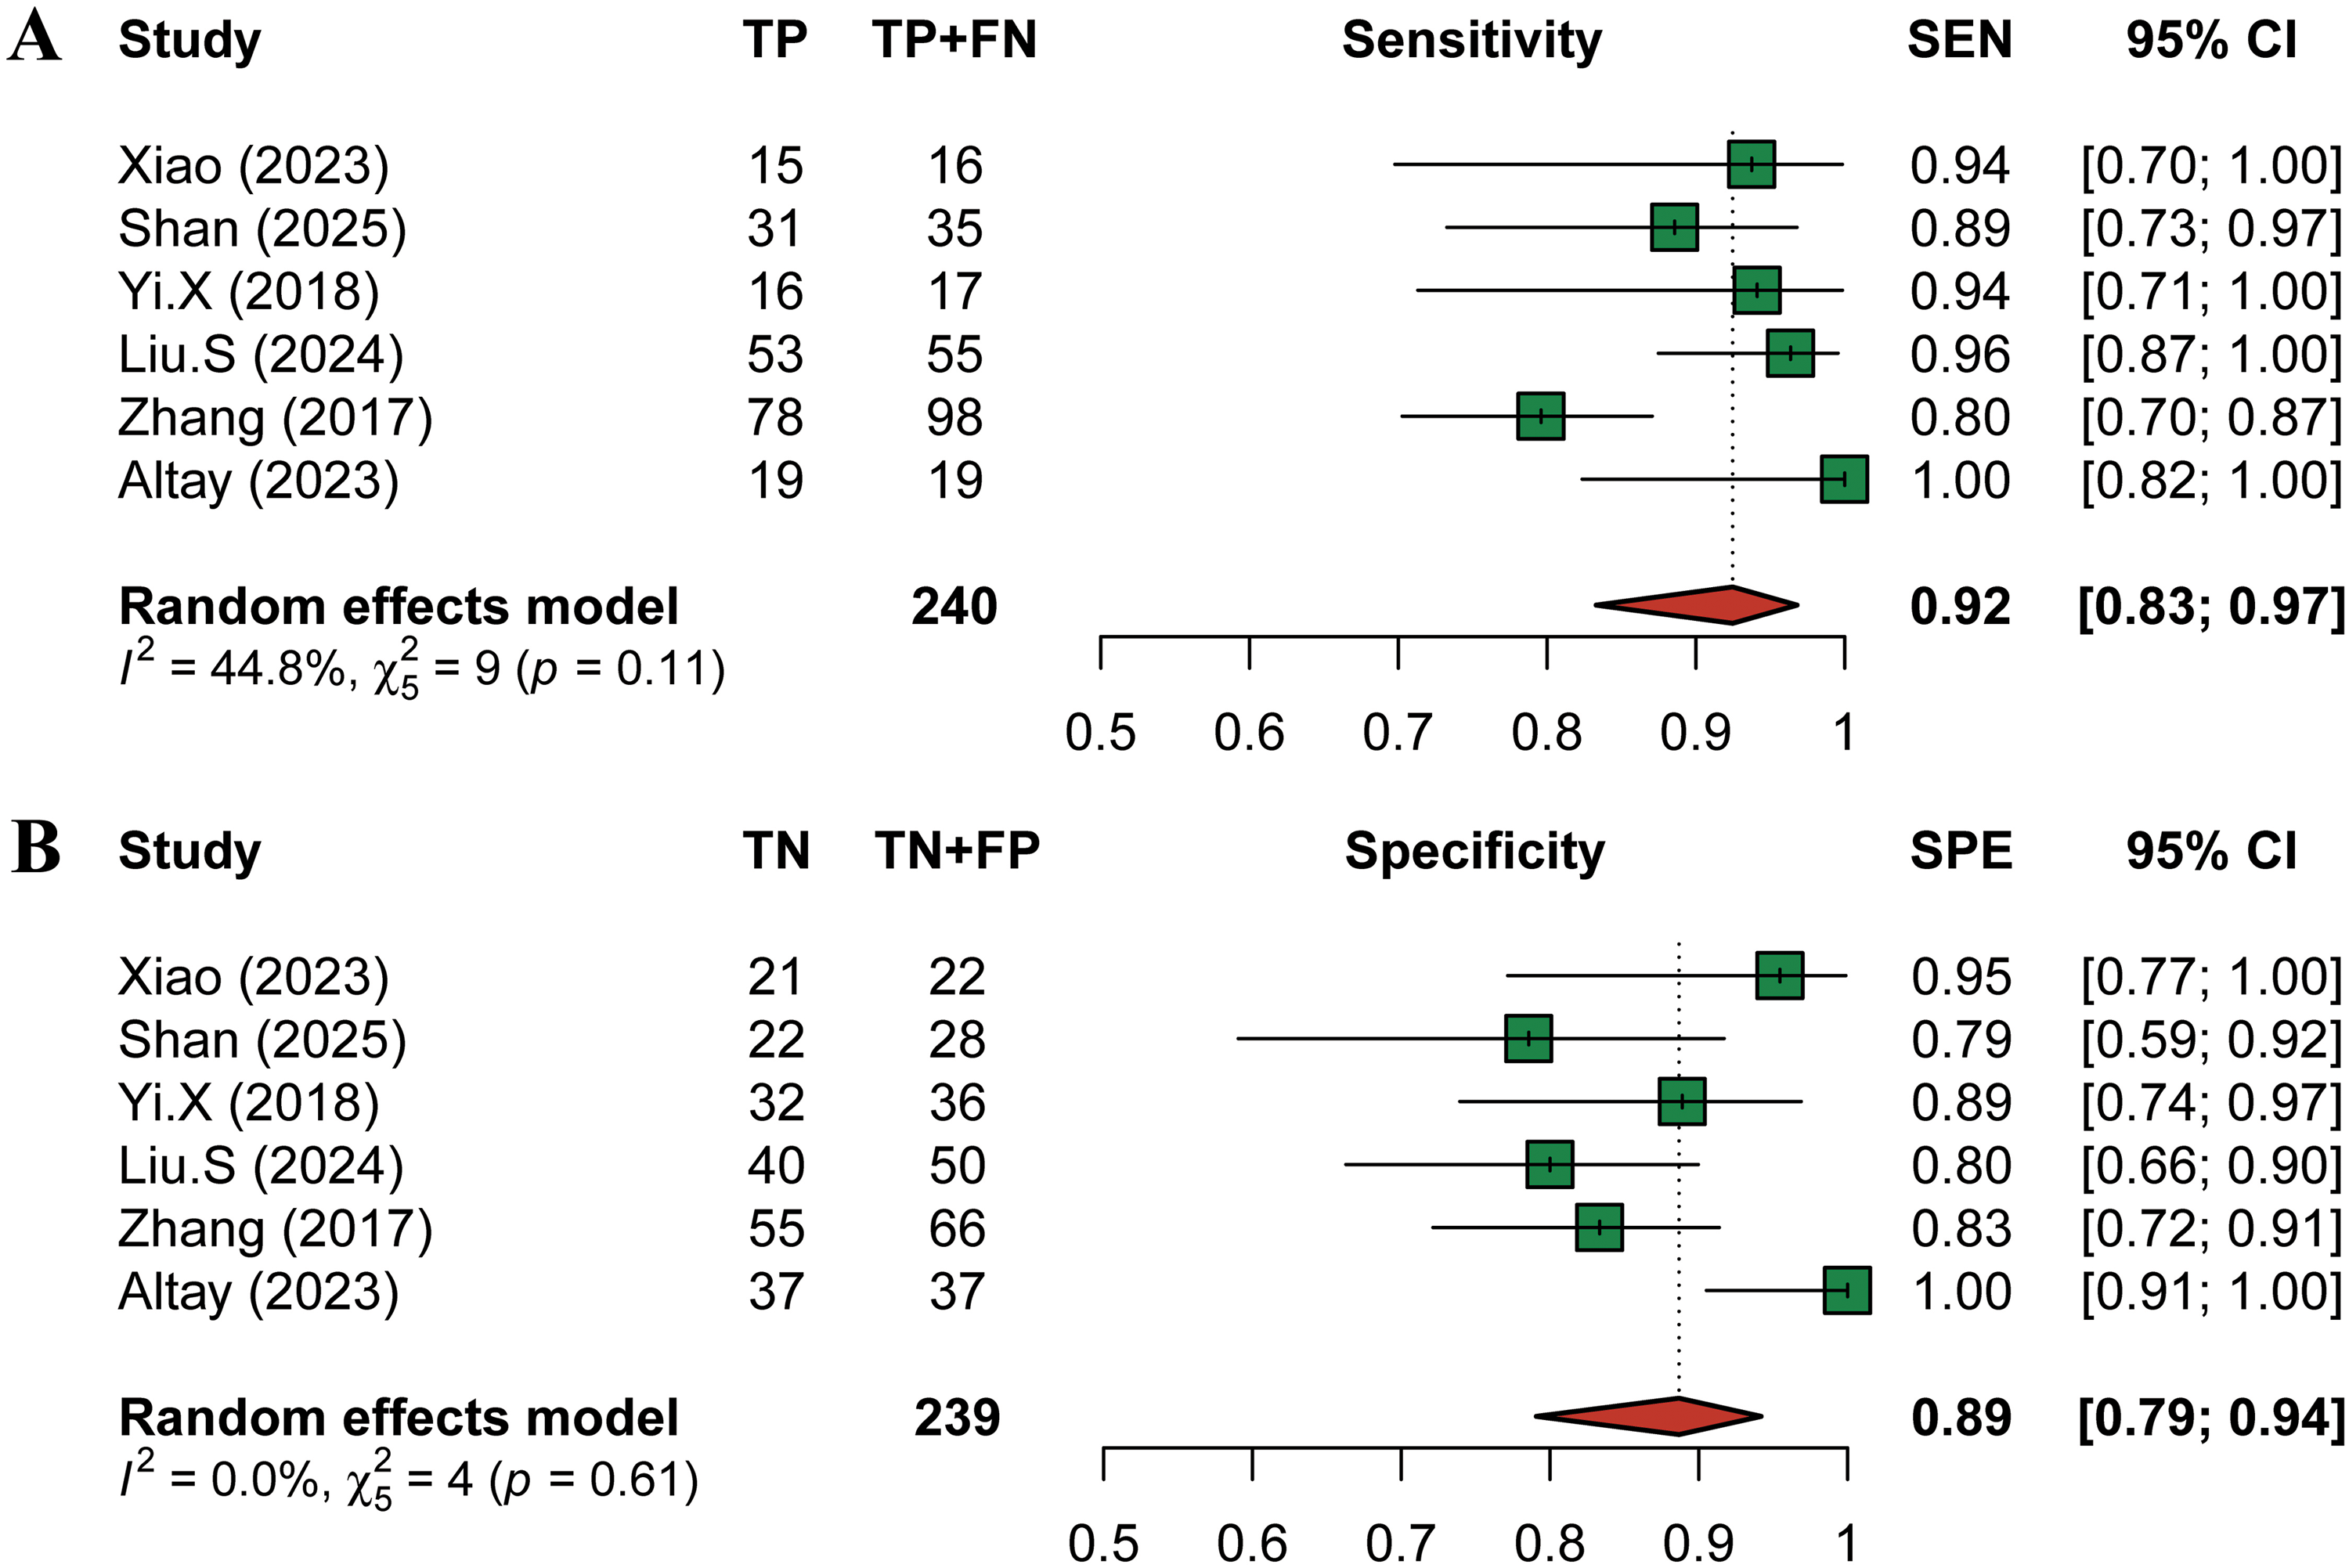
Forest plots showing (a) pooled sensitivity and (b) pooled specificity for CT-based radiomics in differentiating pheochromocytoma from lipid-poor adenoma. CT, computed tomography.
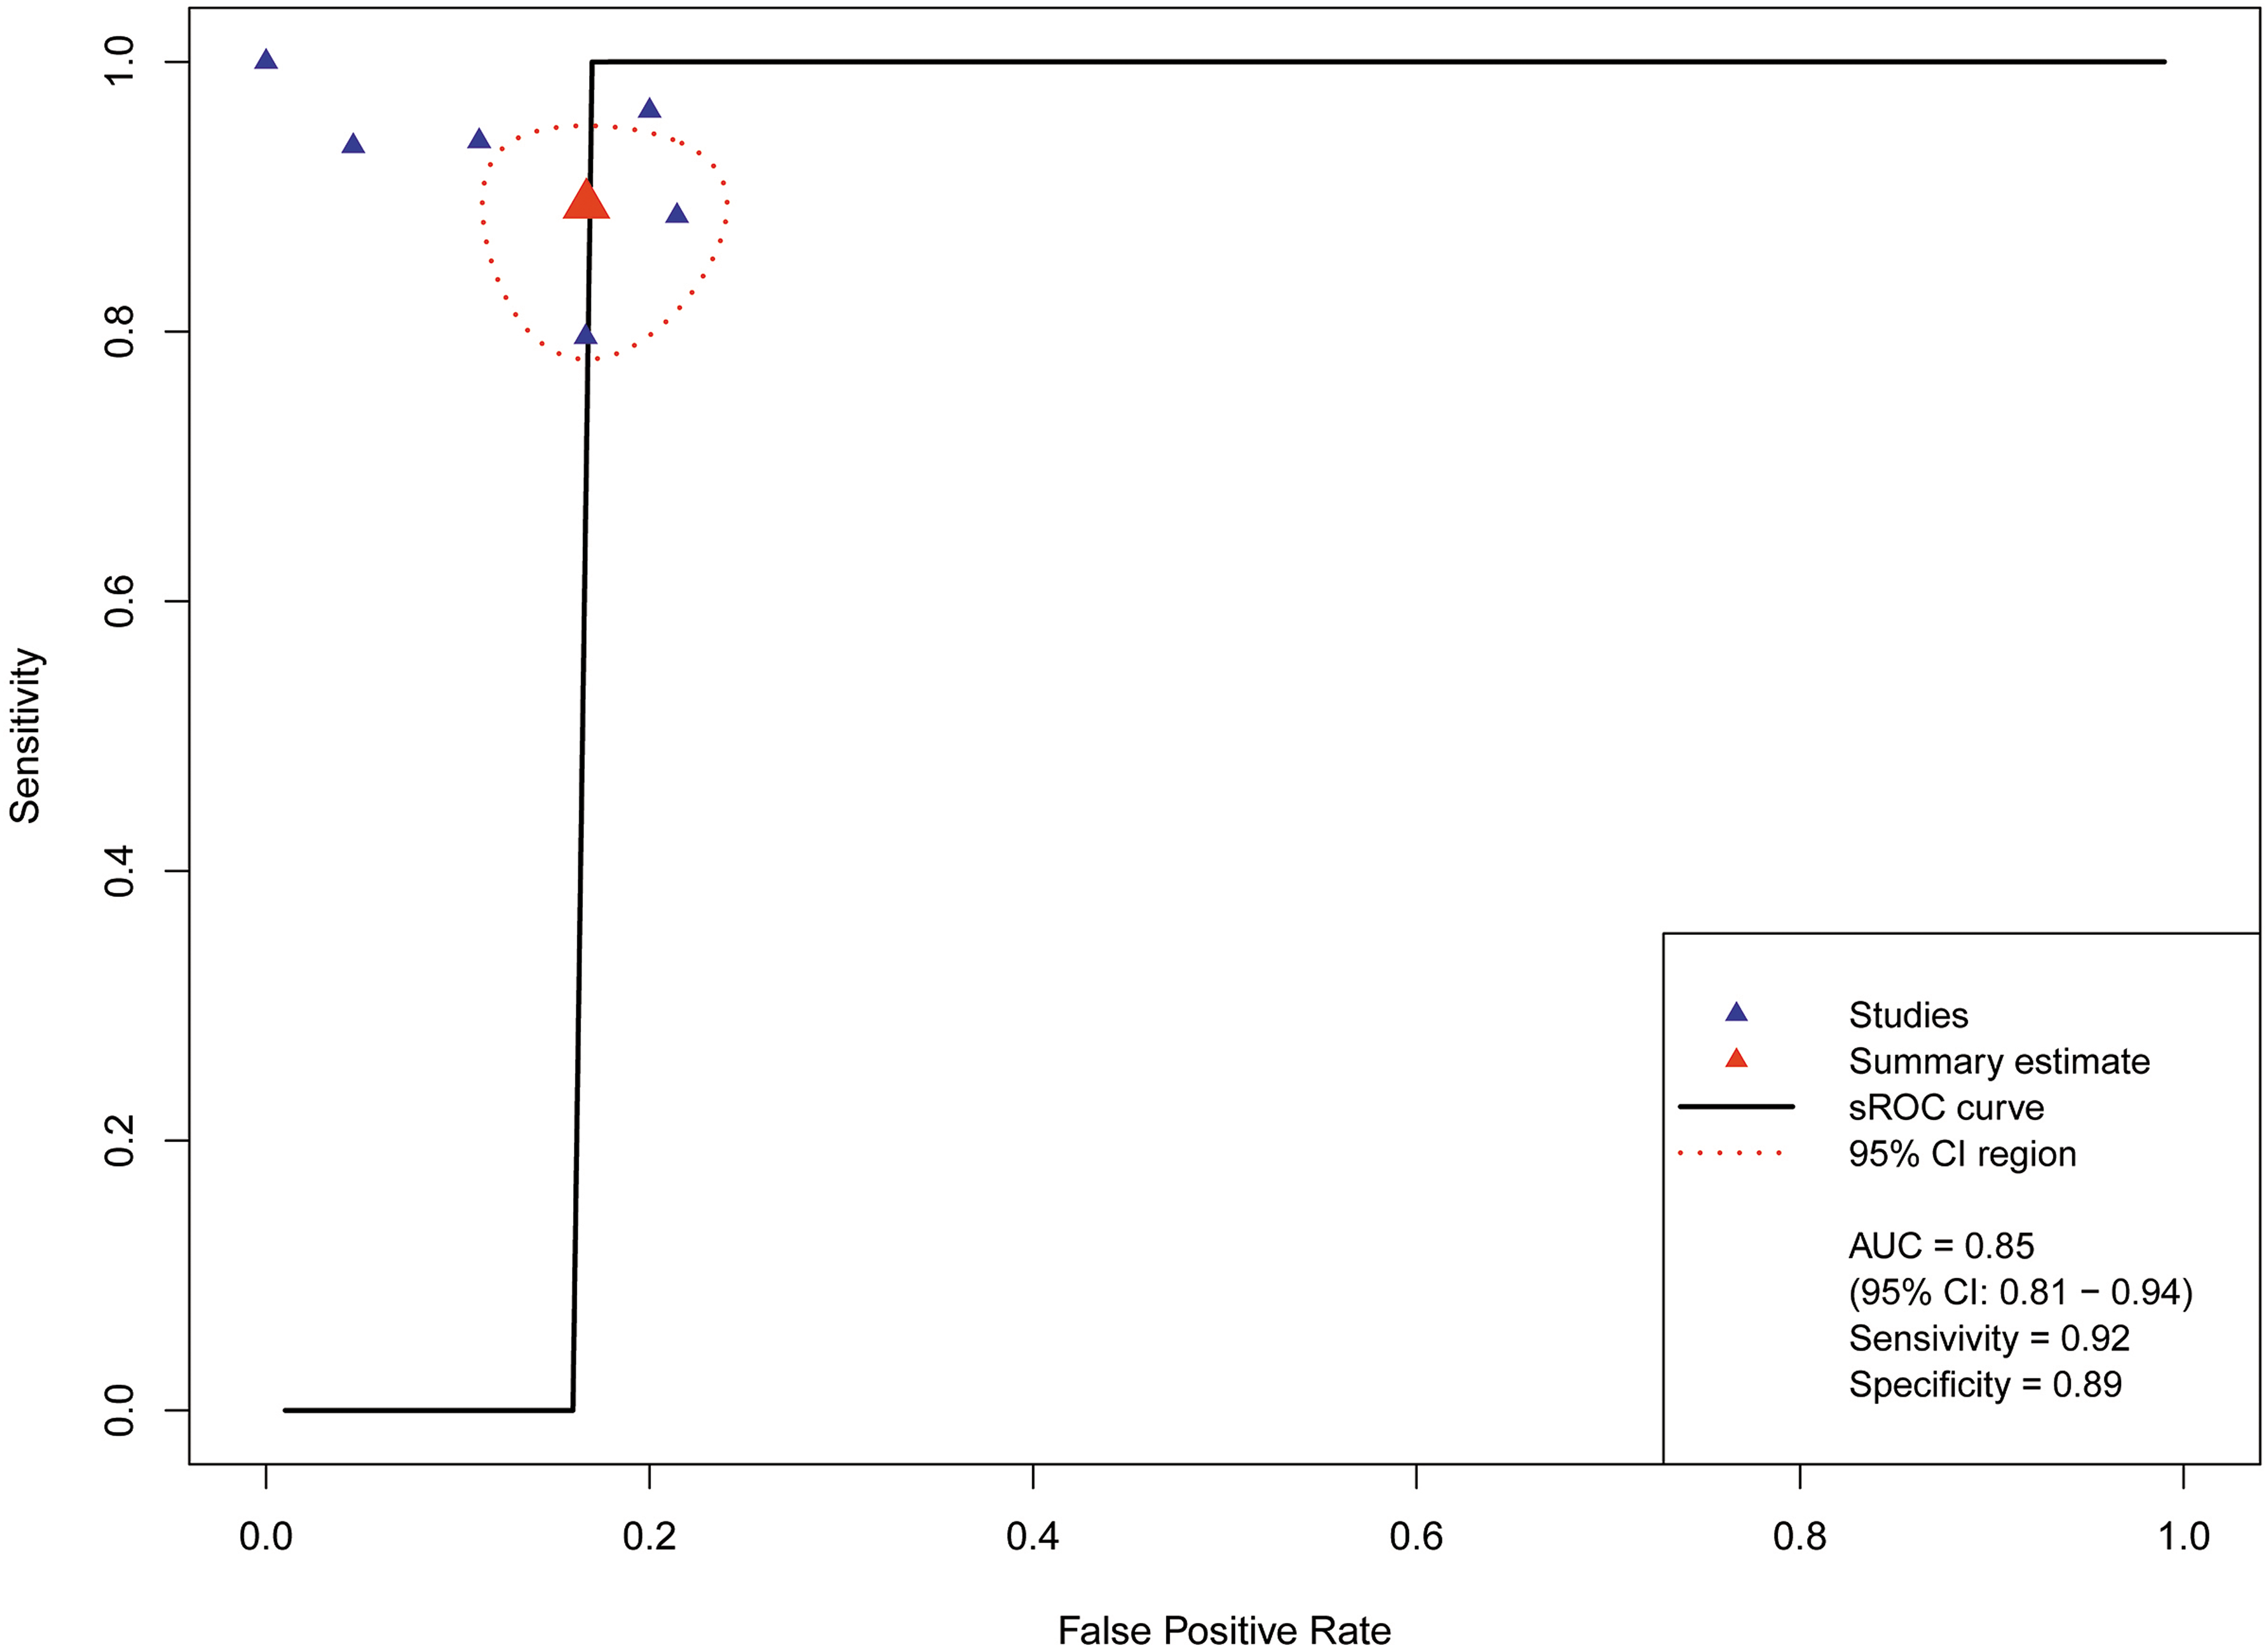
sROC curve and respective pooled AUC value for CT-based radiomics in differentiating pheochromocytoma from lipid-poor adenoma. AUC, area under the curve; CT, computed tomography; sROC, summary receiver operating characteristic.
Several analyses demonstrated moderate to substantial heterogeneity. To explore potential sources of heterogeneity, subgroup analyses were conducted based on study design (single-center vs. multicenter), reporting of image preprocessing, imaging phase (unenhanced vs. contrast-enhanced), segmentation region (2D vs. 3D), image acquisition strategy (single-scanner vs. multi-scanner), segmentation approach (manual vs. semi-automated), and validation method (external validation vs. hold-out or training sets) (Table 4). Studies that explicitly reported image preprocessing before feature extraction exhibited significantly higher pooled sensitivity compared with studies that did not report preprocessing steps (0.97 vs. 0.83; P <0.01). In addition, a marginally significant difference in pooled specificity was observed between studies using unenhanced images and those using contrast-enhanced images (0.93 vs. 0.79; P = 0.06). Sensitivity analysis using a leave-one-out approach did not identify any individual study that disproportionately influenced the pooled estimates (Table S3 in the supplementary material). Assessment of publication bias using Deeks’ funnel plot asymmetry test showed no evidence of small-study effects (P = 0.12) (Figure S2 in the supplementary material). For the comparison between nomogram-based and radiomics-only models, three eligible studies were included (23,36,37). Pooled analysis demonstrated superior diagnostic performance of nomogram models (P = 0.004), with a higher AUC (0.95 vs. 0.87), comparable sensitivity (0.92 vs. 0.93), and improved specificity (0.90 vs. 0.82) (Fig. 5).
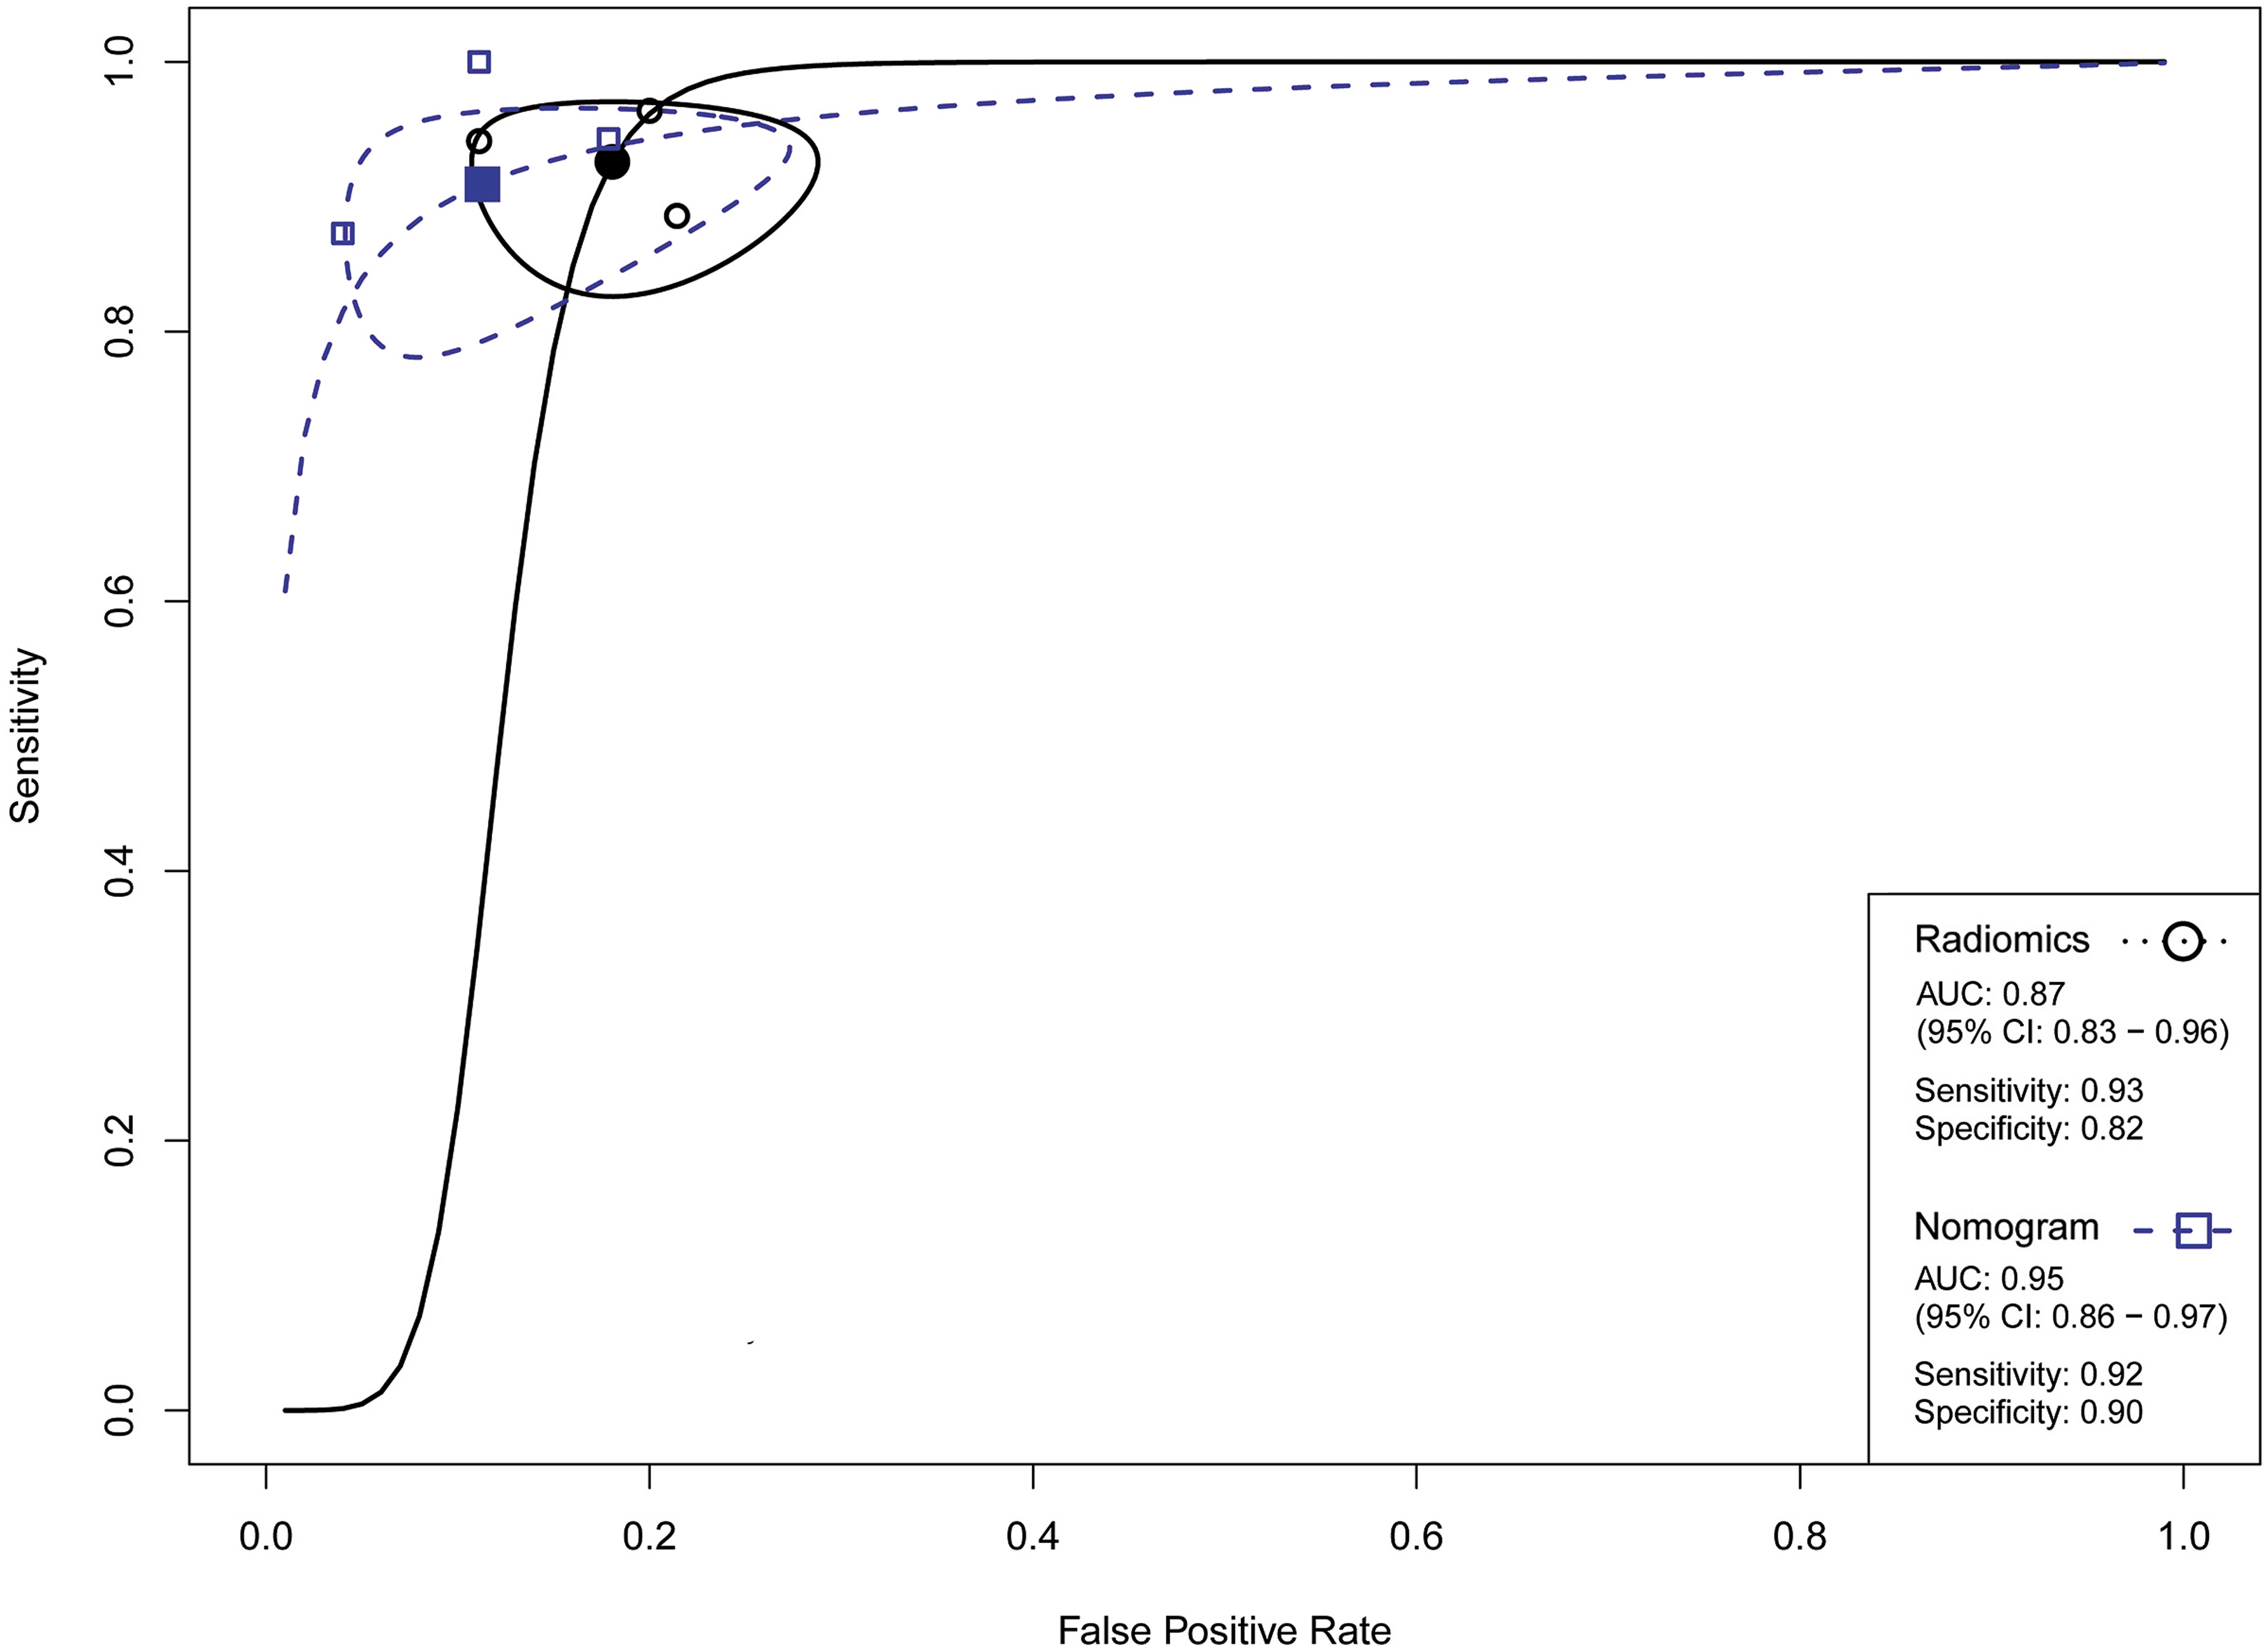
sROC curves illustrating the pooled diagnostic performance of CT-based radiomics for differentiating pheochromocytoma from lipid-poor adenoma, with corresponding pooled AUC values shown separately for radiomics-only and nomogram models. AUC, area under the curve; CT, computed tomography; sROC, summary receiver operating characteristic.
Results of subgroup analysis.
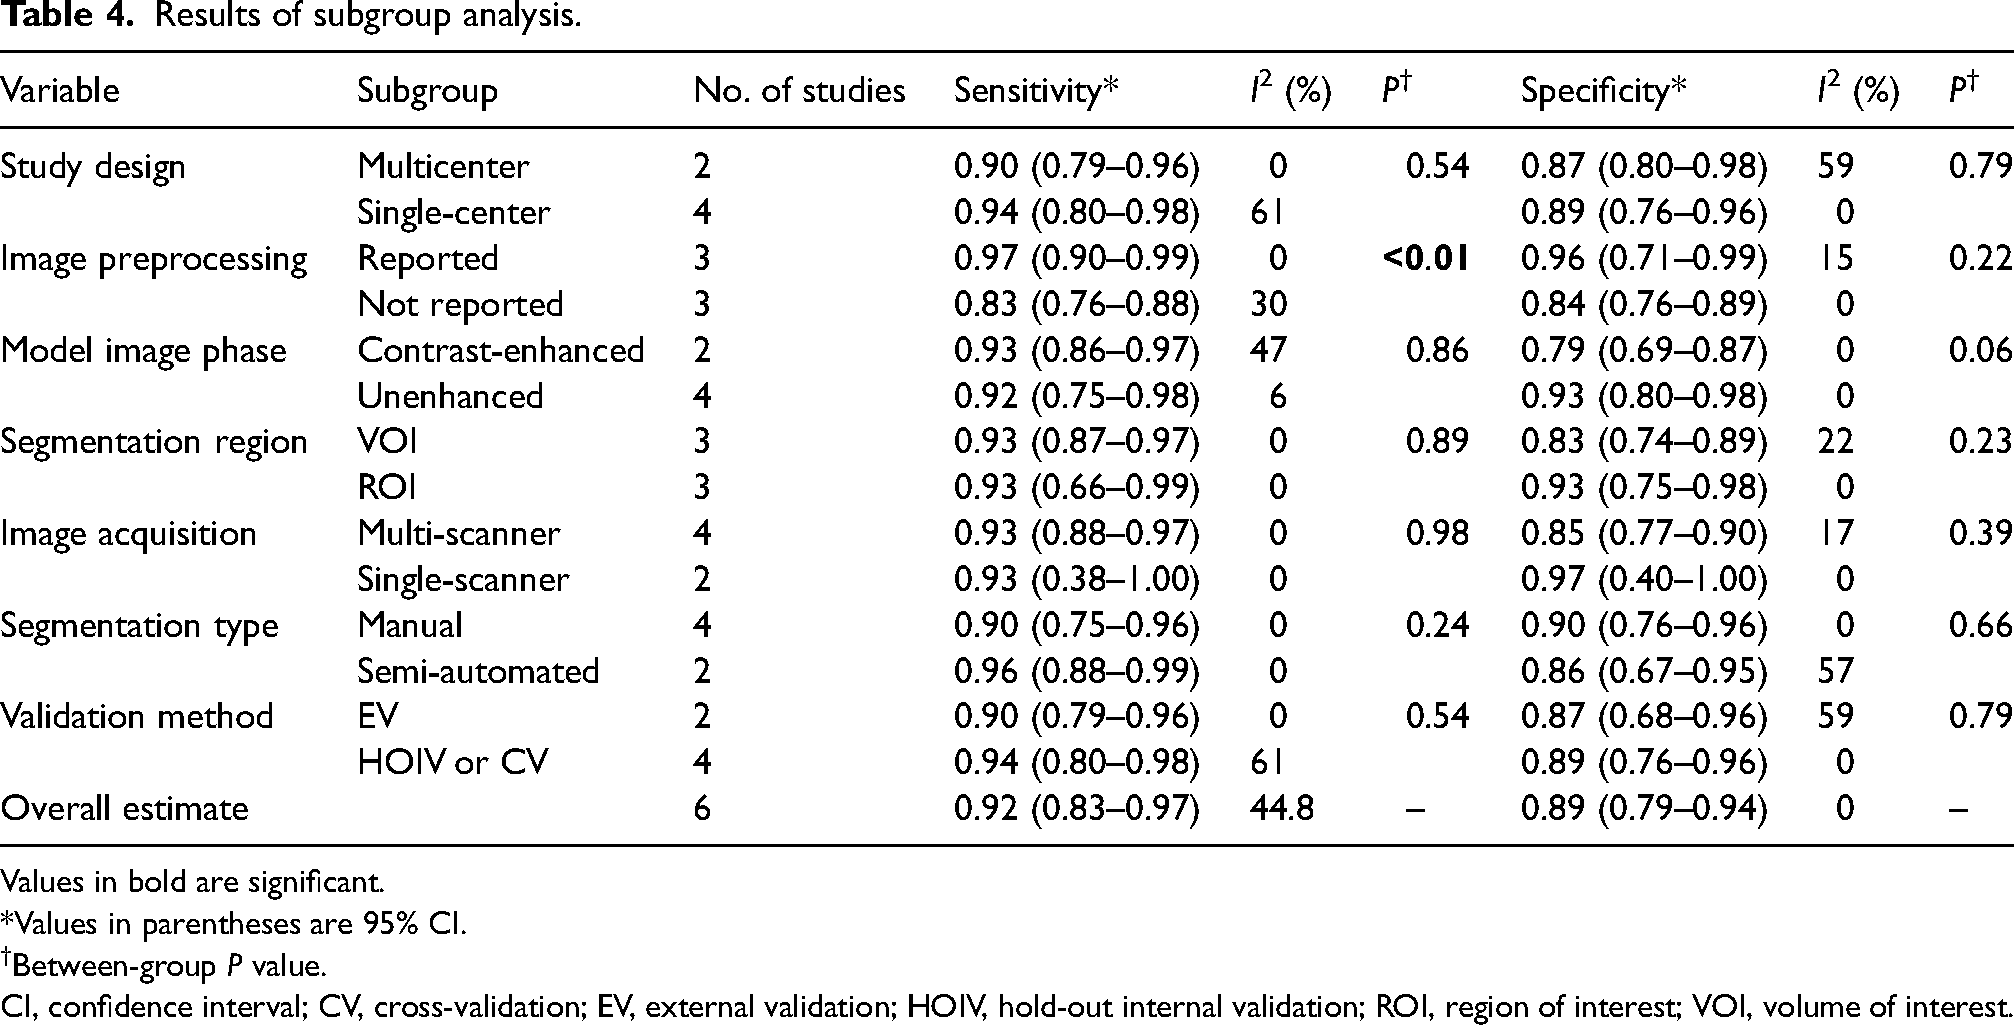
Values in bold are significant.
Values in parentheses are 95% CI.
Between-group P value.
CI, confidence interval; CV, cross-validation; EV, external validation; HOIV, hold-out internal validation; ROI, region of interest; VOI, volume of interest.
Discussion
In this systematic review and meta-analysis, CT-based radiomics models demonstrated high diagnostic accuracy for the preoperative differentiation of pheochromocytoma from LPA. The pooled sensitivity of 0.92 and specificity of 0.89, together with a summary AUC of 0.85, indicate a robust discriminative performance, supporting the potential role of radiomics as an adjunctive tool in adrenal lesion characterization. In parallel, our quantitative analysis demonstrated superior discrimination on unenhanced CT compared with contrast-enhanced phases, an advantage that can be further amplified by radiomics models through the extraction of higher-order textural and spatial features beyond single-parameter attenuation assessment.
Distinguishing LPA from pheochromocytoma remains a well-recognized diagnostic challenge in adrenal imaging (39). Although lipid-rich adenomas can be reliably identified on unenhanced CT using a density threshold of ≤10 HU, LPAs characteristically exceed this threshold and overlap substantially with pheochromocytomas on conventional attenuation-based assessment (13). In current clinical practice, this diagnostic uncertainty is typically addressed with a dedicated adrenal CT protocol incorporating delayed imaging to calculate absolute and relative percentage washout (APW and RPW), with thresholds of >60% and >40%, respectively, favoring LPA (40,41). However, prior studies have demonstrated considerable overlap between LPA and pheochromocytoma using both attenuation and washout criteria, particularly in small lesions, where pheochromocytomas may exhibit washout behavior comparable to that of adenomas (13). This overlap underscores the limitations of conventional CT, which relies on simplified parameter-based assessments. Radiomics offers a complementary approach by extracting high-dimensional features that capture lesion heterogeneity, texture, and spatial complexity beyond visual evaluation and standard attenuation measures.
Our analyses showed greater attenuation separation between LPA and pheochromocytoma on unenhanced CT, suggesting superior intrinsic discriminatory information compared with contrast-enhanced imaging. Subgroup analysis supported this, with slightly higher specificity for unenhanced radiomics models (0.93 vs. 0.79). Biologically, unenhanced attenuation reflects inherent tissue characteristics without confounding contrast kinetics. From a biological standpoint, attenuation on unenhanced CT predominantly reflects inherent tissue properties, including intracellular lipid content, cellular density, and baseline vascularity, without the confounding effects of contrast kinetics (42). Although LPA exceed the conventional ≤10 HU threshold, they generally exhibit lower native attenuation than pheochromocytomas, which are characteristically hypercellular and highly vascular, often with hemorrhagic or necrotic components that contribute to higher baseline attenuation. In contrast, contrast-enhanced phases are influenced by heterogeneous and overlapping enhancement and washout dynamics, which may mask these intrinsic differences and result in attenuation convergence between entities. Clinically, the preferential diagnostic value of unenhanced imaging is particularly advantageous, as it eliminates the need for contrast administration, reducing acquisition time, cost, and potential contrast-related risks.
Radiomics model performance and generalizability depend strongly on input data quality and consistency (43). Clinical translation requires careful image preprocessing to address methodological challenges (44). Although multi-institutional datasets improve external validity, heterogeneity across scanners, populations, and protocols introduces variability that may obscure disease-related signals and reduce performance (43). To address this issue, standardized image preprocessing and harmonization strategies are commonly employed to mitigate scanner- and protocol-related effects and to improve the reliability and comparability of extracted features (45). Consistent with this rationale, subgroup analysis showed higher sensitivity in studies using image preprocessing, suggesting improved diagnostic performance. Widely used approaches, including intensity normalization, voxel size resampling, gray-level discretization, and scanner harmonization techniques, aim to reduce technical variability while preserving biologically meaningful information. Transparent reporting and systematic adoption of these preprocessing pipelines are therefore essential for improving the reproducibility and clinical translatability of radiomics models.
We further observed that nomogram-based models demonstrated superior diagnostic performance compared with radiomics-only approaches, indicating that incorporation of clinicoradiological features enhances discrimination between pheochromocytoma and LPA. Pheochromocytomas were consistently associated with larger tumor size or maximum diameter, irregular lesion shape or margins, left-sided laterality, higher unenhanced CT attenuation, cystic or necrotic degeneration, and greater intralesional heterogeneity (35–37). These imaging characteristics are concordant with the established biology of pheochromocytomas as hypercellular, highly vascular, and structurally heterogeneous tumors, frequently exhibiting necrosis or hemorrhage and consequently higher baseline attenuation with complex texture patterns (39). Nomograms likely perform better by capturing both intuitive biological characteristics and subtle quantitative patterns. This integration improves robustness and interpretability, making them especially useful in diagnostically challenging scenarios.
The present study has some limitations. Because the most clinically challenging distinction is between LPA and pheochromocytoma, studies focusing on other adrenal lesions (e.g. lipid-rich adenoma,) were excluded, resulting in a limited number of included studies. In addition, only two studies performed external validation, highlighting the need for multicenter research with independent cohorts. In addition, the predominance of studies from China may limit generalizability.
In conclusion, CT-based radiomics shows high accuracy in differentiating pheochromocytoma from LPA preoperatively. Unenhanced CT performs best, especially when advanced radiomic features are used. Integrated nomogram models further improve specificity. However, evidence is limited by retrospective single-center designs and scarce external validation, emphasizing the need for prospective multicenter studies with standardized radiomics workflows.
Supplemental Material
sj-docx-1-acr-10.1177_02841851261462504 - Supplemental material for Preoperative differentiation of adrenal pheochromocytoma and lipid-poor adenoma using CT-based radiomics: a systematic review and meta-analysis
Supplemental material, sj-docx-1-acr-10.1177_02841851261462504 for Preoperative differentiation of adrenal pheochromocytoma and lipid-poor adenoma using CT-based radiomics: a systematic review and meta-analysis by Nima Broomand Lomer, Amir Mahmoud Ahmadzadeh and Anahita Azinfar in Acta Radiologica
Footnotes
Data availability
All relevant data are within the manuscript and its supporting information files.
Declaration of conflicting interests
The authors declared no potential conflicts of interest with respect to the research, authorship, and/or publication of this article.
Funding
This research did not receive any grant from funding agencies in the public, commercial, or non-profit sectors.

Supplementary material
Supplementary material for this article is available online.
References
Supplementary Material
Please find the following supplemental material available below.
For Open Access articles published under a Creative Commons License, all supplemental material carries the same license as the article it is associated with.
For non-Open Access articles published, all supplemental material carries a non-exclusive license, and permission requests for re-use of supplemental material or any part of supplemental material shall be sent directly to the copyright owner as specified in the copyright notice associated with the article.
