
Abstract
Objective
To investigate the association between the weight-to-waist ratio and total bone mineral density in US adults.
Methods
This cross-sectional study included 7005 adults from the National Health and Nutrition Examination Survey 2011–2018. The weight-to-waist ratio was calculated as body weight divided by waist circumference, and total bone mineral density was measured using dual-energy X-ray absorptiometry. Survey-weighted multivariable linear regression and restricted cubic spline analyses were conducted to evaluate the association between the weight-to-waist ratio and total bone mineral density after adjustment for demographic, socioeconomic, lifestyle, and clinical covariates.
Results
A higher weight-to-waist ratio was significantly associated with greater total bone mineral density across all models. In the fully adjusted model, each 1-unit increase in the weight-to-waist ratio was associated with a 0.39 g/cm2 increase in total bone mineral density (95% confidence interval: 0.35–0.42; P < 0.001). Participants in the highest weight-to-waist ratio quartile had significantly higher total bone mineral density than those in the lowest quartile (β = 0.09, 95% confidence interval: 0.08–0.10; P < 0.001). Restricted cubic spline analysis indicated a significant positive linear association. The association was stronger in men than in women (P for interaction <0.001).
Conclusions
A higher weight-to-waist ratio was independently associated with greater total bone mineral density in US adults, particularly among men. The weight-to-waist ratio may provide complementary anthropometric information regarding skeletal health, although prospective studies are needed to confirm causality.
Introduction
Osteoporosis is a major public health concern characterized by low bone mineral density (BMD) and increased fracture risk. Globally, it is estimated that over 200 million people suffer from osteoporosis. 1 Achieving higher peak bone mass by early adulthood is crucial for reducing osteoporosis risk later in life, as roughly 90% of peak bone mass is accrued by around 18 years of age. 2 Thereafter, age-related bone loss ensues, accelerating in midlife especially among women, which elevates susceptibility to fragility fractures. 3 Thus, understanding modifiable factors that influence BMD in adults is critical for osteoporosis prevention.
Body composition is one of the most important determinants of BMD. 4 Greater weight, often reflected by a higher body mass index (BMI), is associated with higher BMD and reduced fracture risk in many studies, presumably due to increased mechanical loading on the skeleton and hormonal effects of adipose tissue.5–7 Indeed, obesity has been found to correlate with higher BMD in both men and women, and moderate increases in BMI can have a protective effect on bone density. 5 However, the relationship between adiposity and bone health is complex.8,9 Adipose tissue secretes pro-inflammatory cytokines and adipokines that can promote bone resorption and impair bone formation. 9 Visceral fat is inversely associated with BMD and is linked to greater osteoporosis risk, whereas peripheral subcutaneous fat may have a more neutral or even protective influence.10,11 In contrast, individuals with higher lean body mass tend to have greater bone density, as muscle exerts direct mechanical forces on bone and stimulates bone anabolism.7,12,13 In conditions like sarcopenic obesity, bone outcomes are worse than in obesity with preserved muscle, underscoring the importance of body composition balance for skeletal health. 14
BMI reflects overall adiposity but cannot differentiate between fat mass and lean mass, nor does it adequately capture patterns of fat distribution. 15 In addition, skeletal size and height are important determinants of areal BMD measured by dual-energy X-ray absorptiometry (DXA), because taller individuals generally exhibit larger bone area and higher measured BMD values. Waist circumference (WC) and waist-to-height ratio (WHtR) are widely used anthropometric indicators associated with cardiometabolic risk, particularly abdominal obesity and visceral adiposity.16,17 Compared with BMI, these indices better reflect abdominal fat accumulation and obesity-related metabolic dysfunction. However, WC and WHtR primarily focus on central fat accumulation and may not adequately account for overall body weight and body composition balance, both of which are important determinants of skeletal loading and bone metabolism. Therefore, these indices may be less suitable for evaluating the combined effects of overall body mass and abdominal adiposity on skeletal health. Recently, the weight-adjusted waist index (WWI) has attracted increasing attention as a novel marker of obesity-related metabolic risk and has also been investigated in relation to BMD. 18 Nevertheless, WWI mainly reflects WC relative to body weight and emphasizes central adiposity normalized by body mass. In contrast, the weight-to-waist ratio (WWR), calculated as body weight (kg) divided by WC (cm), may provide an alternative anthropometric perspective by reflecting overall body mass relative to abdominal size. A higher WWR may reflect greater body weight relative to abdominal size and may therefore be associated with differences in body composition and mechanical loading. Conversely, a lower WWR may reflect relatively greater abdominal adiposity in relation to body weight. Previous DXA-based studies have consistently shown that lean body mass is positively associated with BMD, whereas excess visceral adiposity may adversely affect bone metabolism through inflammatory and endocrine pathways.19,20 However, anthropometric indices alone cannot directly distinguish lean mass, visceral fat, and subcutaneous fat compartments, which require imaging-based assessments such as DXA or computed tomography (CT). Given the close interactions among body weight, fat distribution, lean mass, and skeletal loading in bone metabolism, WWR may partially reflect their combined influence on skeletal health. To date, evidence specifically examining the association between WWR and BMD in adults remains limited.
In light of these considerations, the present study utilized nationally representative data from the US National Health and Nutrition Examination Survey (NHANES) to investigate the association between WWR and BMD among adults. 21 We hypothesized that WWR is associated with BMD. Through this analysis, we aim to provide additional evidence regarding obesity-related anthropometric indicators and skeletal health.
Methods
Data source and study population
This cross-sectional study was based on data from the US NHANES 2011–2018. 21 NHANES is a continuous, nationally representative survey that uses a complex multistage probability sampling design to assess the health and nutritional status of the non-institutionalized US population. Survey participants undergo in-home interviews and standardized physical examinations at mobile examination centers, where clinical measurements and laboratory tests are performed. The NHANES protocol was approved by the National Center for Health Statistics Research Ethics Review Board, and all participants provided written informed consent. The present study was based on publicly available de-identified NHANES data, and no identifiable participant information was accessible in this analysis. This study was conducted in accordance with the principles of the Declaration of Helsinki of 1975, as revised in 2024. The reporting of this study conforms to Strengthening the Reporting of Observational Studies in Epidemiology (STROBE) guidelines. 22 NHANES data are publicly accessible via the US Centers for Disease Control and Prevention (CDC) website: https://wwwn.cdc.gov/nchs/nhanes/.
From the NHANES 2011–2018 cycles, a total of 39,156 individuals were initially assessed. Participants younger than 20 years were excluded to restrict the analysis to adults (n = 16,539). Among the remaining 22,617 participants, individuals without total BMD data were further excluded (n = 11,717). According to the NHANES DXA procedures manual, missing or invalid whole-body DXA measurements may result from pregnancy, recent radiographic contrast exposure, body size exceeding scanner limitations, obesity-related image artifacts, implanted metallic devices, motion artifacts, or other quality control concerns. In addition, participants with missing WWR data (n = 116) or incomplete information on key covariates (n = 3779) were excluded. Ultimately, 7005 participants were included in the final statistical analysis. The detailed participant selection process is presented in Figure 1.

Flowchart of participant selection.
Study variables
The exposure of interest was the WWR. WWR (kg/cm) was calculated as body weight divided by WC. The outcome of interest was total BMD, measured in g/cm2 using DXA.
Covariates
The following variables (all obtained from NHANES questionnaires, examinations, or laboratory data) were adjusted for in the multivariable models: age, sex, educational level, PIR (poverty income ratio), race, marital status, physical activity (PA), smoking status, serum 25OHD (serum 25-hydroxyvitamin D), hypertension, and diabetes. Total weekly PA was assessed using the NHANES PA questionnaire, which collected information on the frequency and duration of moderate and vigorous recreational activities. Height was measured in centimeters during the NHANES examination. PA was expressed as metabolic equivalent task minutes per week (MET-min/week), a standardized measure of energy expenditure, and was determined following previously described methods. 23 Participants were then classified into two groups according to national PA guidelines: a low activity group (<500 MET-min/week) and a high activity group (≥500 MET-min/week). 24 Alcohol consumption was classified as mild drinking, moderate drinking, or heavy drinking according to self-reported alcohol intake obtained from the NHANES questionnaire. Smoking status was categorized as yes or no, with “yes” defined as having smoked at least 100 cigarettes over the course of one’s lifetime. Hypertension was categorized as yes or no, with “yes” defined as having ever been diagnosed with high blood pressure by a health professional or having a mean systolic blood pressure (SBP) ≥140 mmHg or diastolic blood pressure (DBP) ≥90 mmHg. Diabetes was categorized as yes or no, with “yes” defined as having ever been diagnosed with diabetes by a health professional or meeting any of the following criteria: fasting plasma glucose (FPG) ≥126 mg/dL (7.0 mmol/L), 2-h plasma glucose after oral glucose tolerance test (OGTT) ≥200 mg/dL (11.1 mmol/L), glycated hemoglobin (A1C) ≥6.5%, or current use of insulin or oral hypoglycemic medications.
Statistical methods
We used appropriate NHANES sample weights and survey design variables in all analyses to account for the complex sampling design and to obtain nationally representative estimates. Descriptive statistics were first computed for the overall sample and by WWR quartile. Continuous variables were expressed as weighted mean ±standard error (SE), and categorical variables as weighted percentages. We assessed differences in participant characteristics across WWR quartiles using weighted one-way analysis of variance for continuous variables and the Rao–Scott chi-squared test for categorical variables.
To evaluate the association between WWR and total BMD, we fit a series of weighted multivariable linear regression models. Model 1 was an unadjusted model including WWR as the sole predictor of total BMD. Model 2 adjusted for age, sex, and race. Model 3 additionally adjusted for education, marital status, PIR, alcohol consumption, PA, hypertension, diabetes, height, smoking status, and serum 25OHD. These models allowed us to observe how the WWR–BMD association changed with progressive adjustment for potential confounders. Beta coefficients (β) with 95% confidence intervals (CIs) and P-values were obtained, representing the estimated change in BMD per one-unit increase in WWR. We additionally evaluated WWR in quartiles to assess a potential dose–response relationship. P-values for trend across quartiles were calculated by modeling the median WWR value in each quartile as a continuous predictor in all models. Finally, we examined the functional form of the WWR–BMD relationship using restricted cubic splines (RCS) (Figure 2). All regression analyses were conducted using survey-weighted procedures in R software (version 4.2.0), and two-sided P <0.05 was considered statistically significant. All results presented account for the NHANES sampling weights and design.
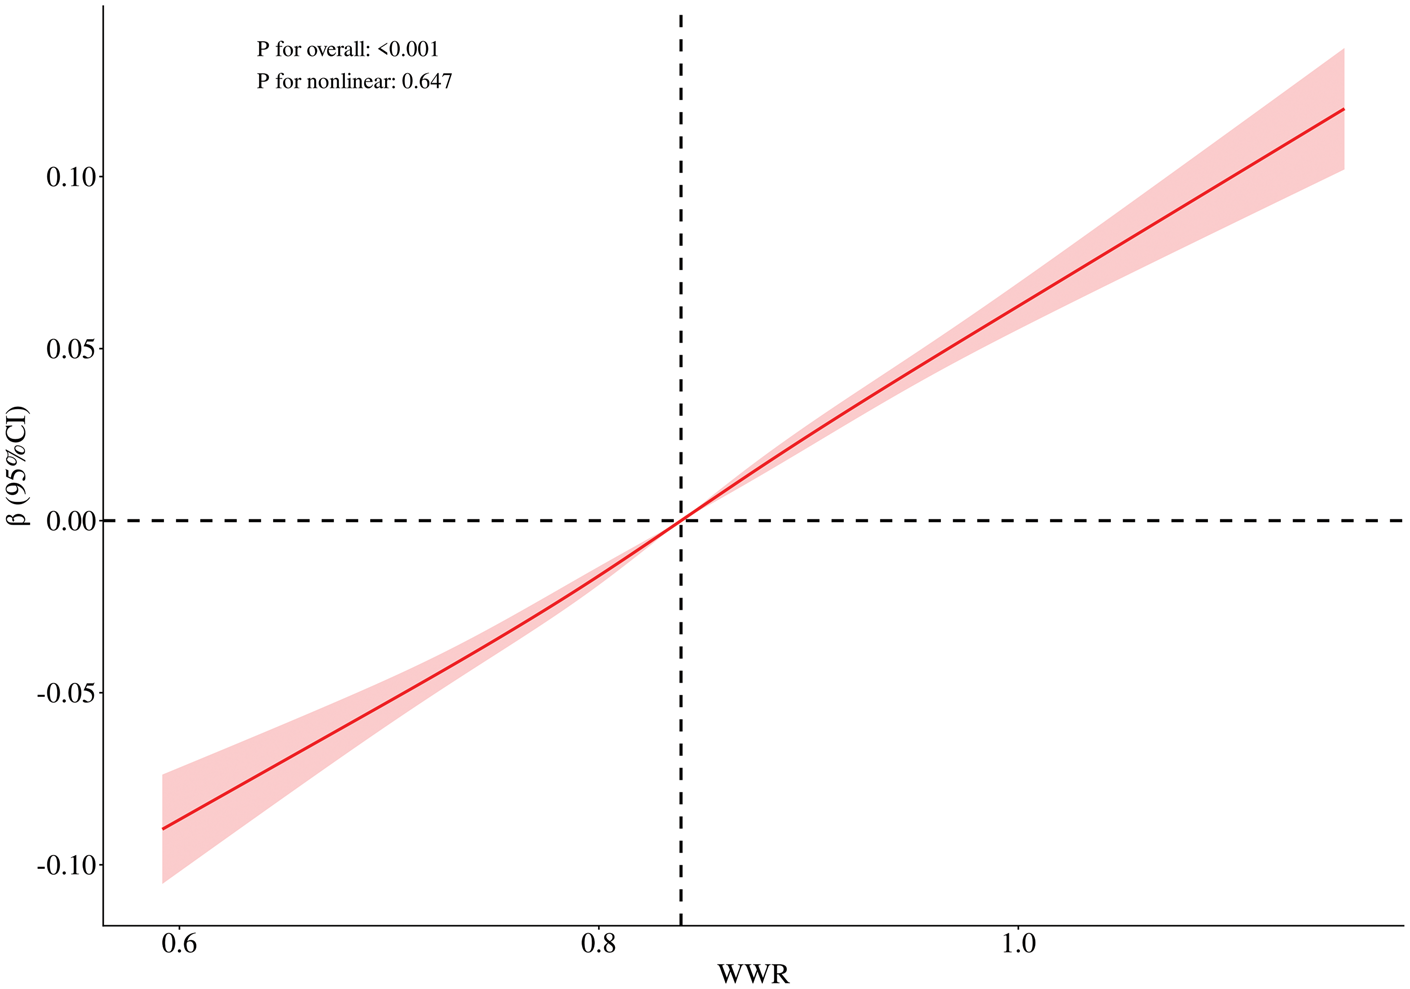
The relationship between WWR and BMD (g/cm2). The solid line represents the adjusted β estimate, and the shaded area represents the 95% CI. Adjusted for age, sex, race, education, physical activity, marital status, hypertension, diabetes, serum 25OHD, PIR, height, alcohol consumption, and smoking status.
Results
Study population characteristics
A total of 7005 adults aged 20–59 years (weighted mean age 38.89 ± 0.28 years) were included in this study. The weighted sex distribution was approximately 52.07% men and 47.93% women. Table 1 summarizes the basic characteristics of the study population overall and by quartiles of WWR (Q1 = lowest WWR, Q4 = highest WWR). Participants in the highest quartile of WWR were more likely to be men, younger, non-Hispanic Black, married or cohabiting, better educated, physically active, and to have a higher PIR. They also exhibited higher total BMD but lower serum 25OHD levels, along with a greater prevalence of hypertension and diabetes. In contrast, those in the lowest WWR quartile were more often women, older, Mexican American or from other racial groups, and less educated and had lower socioeconomic status. This group showed the lowest total BMD values, the highest serum 25OHD levels, and lower rates of hypertension and diabetes.
Baseline characteristics of the study population according to WWR quartiles.

Data are presented as unweighted n (weighted %) for categorical variables and weighted mean ± SE for continuous variables.
PIR, poverty income ratio; total BMD, total bone mineral density (g/cm2); serum 25OHD, serum 25-hydroxyvitamin D (nmol/L); WWR, weight-to-waist ratio; SE, standard error.
Association between WWR and BMD
Both continuous and categorical regression models were applied to comprehensively evaluate the association between the WWR and total BMD. In the continuous model, higher WWR levels were consistently associated with higher BMD across all three models (Table 2). In the fully adjusted Model 3, each 1-unit increase in WWR was associated with a 0.39 g/cm2 increase in total BMD (95% CI: 0.35–0.42). Similarly, in the categorical model, participants in higher WWR quartiles exhibited progressively greater BMD values. Compared with Q1, Q4 was associated with a 0.09 g/cm2 higher total BMD after full adjustment. Intermediate quartiles (Q2 and Q3) also showed significant elevations. The dose–response pattern remained evident, with a clear monotonic increase in BMD from Q1 to Q4 (P for trend < 0.001). RCS analyses were performed to further characterize the dose–response relationship between WWR and total BMD. As illustrated in Figure 2, the association between WWR and BMD demonstrated a significant overall effect (P-overall < 0.001), whereas the test for nonlinearity was not statistically significant (P-nonlinear = 0.647), indicating that the relationship was predominantly linear.
Association of WWR with total BMD (g/cm2).
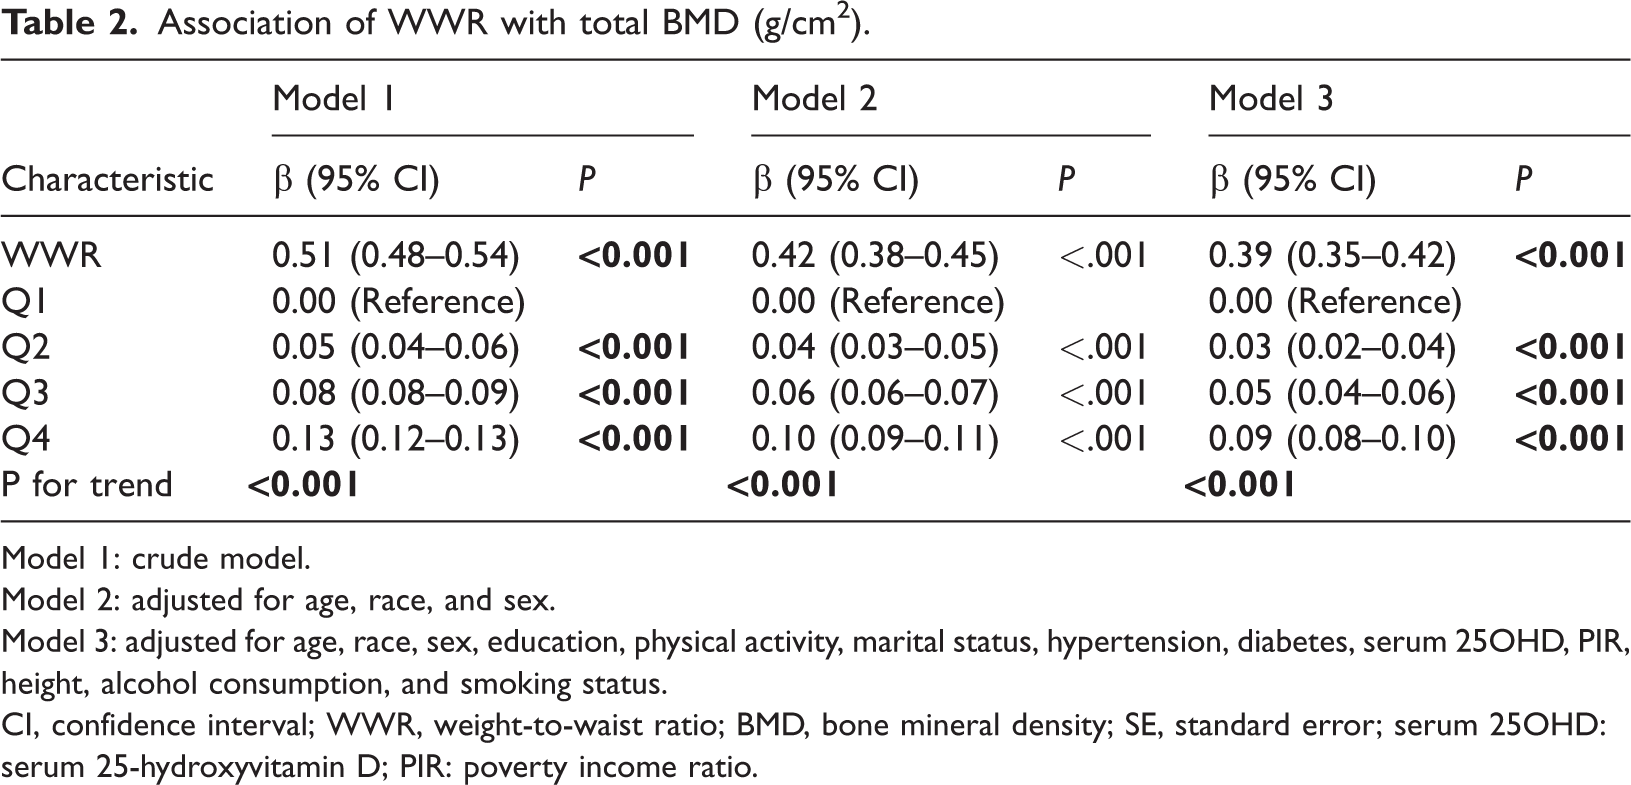
Model 1: crude model.
Model 2: adjusted for age, race, and sex.
Model 3: adjusted for age, race, sex, education, physical activity, marital status, hypertension, diabetes, serum 25OHD, PIR, height, alcohol consumption, and smoking status.
CI, confidence interval; WWR, weight-to-waist ratio; BMD, bone mineral density; SE, standard error; serum 25OHD: serum 25-hydroxyvitamin D; PIR: poverty income ratio.
Subgroup analysis
In subgroup analyses, a significant interaction was observed between WWR and sex (P for interaction <0.001) (Figure 3). Specifically, the positive association between WWR and total BMD was stronger in men (β = 0.51, 95% CI: 0.44–0.57) than in women (β = 0.30, 95% CI: 0.24–0.35). No significant interactions were observed across other subgroup categories, including age, education, smoking status, alcohol consumption, PA, race, marital status, hypertension, and diabetes (all P for interaction >0.05). Nevertheless, the association between WWR and total BMD remained positive and generally consistent across all subgroups.

Subgroup analysis of the association between WWR and total BMD (g/cm2). Adjusted for age, sex, race, education, physical activity, marital status, hypertension, diabetes, serum 25OHD, PIR, height, alcohol consumption, and smoking status. WWR, weight-to-waist ratio; BMD, bone mineral density; CI, confidence interval; PIR, poverty income ratio; 25OHD, 25-hydroxyvitamin D.
Discussion
Although prior studies have examined obesity-related anthropometric indices such as WC, WHtR, and the WWI in relation to bone outcomes, evidence specifically addressing the WWR remains limited. The present study extends the existing literature by evaluating the association between WWR and total BMD in a nationally representative adult population. We found that a higher WWR was independently and positively associated with greater total BMD after adjusting for potential confounders. This positive association was particularly evident in men. Therefore, our findings suggest that WWR may provide complementary anthropometric information regarding body habitus.
Several mechanisms may underlie the positive association between WWR and BMD. One possible explanation is that WWR reflects body weight relative to abdominal size. A higher WWR may therefore correspond to greater skeletal loading together with a lower degree of abdominal adiposity relative to body weight. Increased mechanical loading exerts greater stress on the skeleton, thereby stimulating bone formation and increasing BMD. 25 In addition, muscle contractions generate tensile forces on bone and provide important stimuli for bone remodeling, and previous studies have shown that muscle mass is more strongly associated with BMD than overall body weight or BMI in adults.26,27 Adipose tissue may also influence bone metabolism through endocrine and inflammatory pathways. Moderate adipose tissue can exert certain osteoprotective effects through aromatase-mediated conversion of androgens to estrogens, thereby promoting osteoblast activity.28,29 In contrast, excessive visceral adiposity is associated with increased secretion of pro-inflammatory cytokines such as interleukin (IL)-6 and tumor necrosis factor-alpha (TNF-α), which may promote osteoclast activation and impair bone formation through RANKL-related pathways.30,31 However, these interpretations should be approached cautiously because WWR is an indirect anthropometric index and cannot directly distinguish lean mass, visceral fat, and subcutaneous fat compartments, which require imaging-based assessments such as DXA or CT. Therefore, WWR may be better interpreted as a composite anthropometric marker reflecting the combined influence of body weight, abdominal adiposity, and body habitus, rather than a direct surrogate for muscle mass or fat distribution.
In subgroup analyses, the positive association between WWR and total BMD was more pronounced in men than in women. This finding is generally consistent with previous studies reporting stronger associations between body weight, lean mass, and BMD in male populations.32,33 One possible explanation is that men generally have greater skeletal muscle mass and muscle strength, which may impose higher mechanical loading on the skeleton and stimulate bone formation more effectively.34,35 In addition, sex-related differences in hormonal status and fat distribution may also contribute to the observed heterogeneity. Compared with men, women—particularly postmenopausal women—tend to experience lower estrogen levels, reduced lean mass, and relatively greater fat accumulation, factors that have been associated with less favorable bone outcomes.36,37 Furthermore, increased visceral adiposity and chronic low-grade inflammation may partially offset the beneficial effects of body weight on bone metabolism in women.
This study has several limitations. First, due to the cross-sectional design of NHANES, causal relationships between WWR and BMD cannot be established, and longitudinal studies are needed to confirm the directionality of the observed associations. Second, a substantial number of participants were excluded because of missing DXA or anthropometric data, which may have introduced selection bias and potentially affected the generalizability of the findings. Third, WWR is an indirect anthropometric indicator and cannot directly distinguish body composition compartments such as visceral fat, subcutaneous fat, and skeletal muscle, which require imaging-based assessments such as DXA or CT. Therefore, the biological significance of WWR should be interpreted with caution. Fourth, although we adjusted for multiple potential confounders, residual confounding from unmeasured factors, including medication use, dietary factors, and hormone levels, may still exist. Fifth, PA and other lifestyle variables were self-reported and may therefore be subject to recall or reporting bias. Finally, because NHANES represents the non-institutionalized US population, the generalizability of our findings to other populations or ethnic groups may be limited.
Conclusion
In this cross-sectional study of US adults, higher WWR was associated with higher total BMD, with a stronger association in men. WWR may provide complementary anthropometric information for epidemiologic research on body habitus and skeletal health, but its clinical utility and causal relevance require confirmation in prospective studies.
Footnotes
Acknowledgments
Not applicable.
Author contributions
Yang, Liu, Wei, and Wei contributed to data collection, analysis and writing of the manuscript. Li contributed to study design and writing of the manuscript. All authors read and approved the final manuscript.
Clinical trial number
Not applicable.
Consent for publication
Not applicable.
Declaration of conflicting interests
The authors declare no competing interests.
Ethical approval and consent to participate
The NHANES is an ongoing, large-scale cross-sectional survey conducted in the United States to provide objective health data and address emerging public health challenges in the general population. All NHANES participants provided consent for their data to be used. The present analysis was performed in accordance with the ethical standards laid down in the 1964 Declaration of Helsinki and its later amendments. Data collection for NHANES was approved by the National Center for Health Statistics Research Ethics Review Board. Because this study used publicly available de-identified NHANES data, additional institutional review board approval was not required.
Funding
The present study was supported by the Hebei Provincial 2024 Annual Medical Scientific Research Project Plan (No. 20241870).
Statement of equal author contributions
Not applicable.