
Abstract
Objective
Luteolin, a natural flavonoid, exhibits anticancer effects; however, its mechanisms of action are unclear.
Methods
This retrospective computational study combined network pharmacology, molecular docking, and molecular dynamics simulation to explore luteolin’s anticancer mechanisms in five types of cancers, including breast, lung, colorectal, gastric, and liver cancers. Network pharmacology helps uncover multi-target interactions in complex diseases. Public databases were used to build compound–target, target–disease, and protein–protein interaction networks. Molecular docking and dynamics simulations validated luteolin’s binding to AKT1. The Clinical Proteomic Tumor Analysis Consortium dataset and Human Protein Atlas database were used to assess AKT1 expression in cancer versus normal tissues.
Results
Topological analysis identified AKT1 (a PI3 K/AKT pathway kinase) as a hub gene linked to apoptosis, cell cycle, and tumor suppression. Molecular studies confirmed strong luteolin–AKT1 binding. Clinical Proteomic Tumor Analysis Consortium and Human Protein Atlas data showed that compared with normal tissues, higher AKT1 expression was present in lung, gastric, and breast cancers and lower expression was observed in liver and colorectal cancers.
Conclusion
The anticancer effects exerted by luteolin may involve AKT1 signaling modulation. Network pharmacology aids in revealing multi-target mechanisms of natural compounds, supporting further research on the therapeutic potential of luteolin.
Introduction
Natural products represent a promising source for the development of innovative anticancer therapeutics. In recent years, several plant-derived compounds with selective molecular targets have been successfully translated into clinical applications. 1 Among these, luteolin (3′, 4′, 5, 7-tetrahydroxyflavone), a naturally occurring flavone, has attracted considerable research interest due to its broad pharmacological profile, including notable antitumor effects observed in various cancer types.2,3 Abundantly present in several fruits, vegetables, and traditional Chinese medicinal herbs, luteolin modulates critical signaling pathways and molecular targets involved in tumorigenesis and metastasis, underscoring its potential as an anticancer agent. 2
Luteolin demonstrates potent antitumor activity against a broad spectrum of malignancies, such as breast, pancreatic, prostate, colon, and lung cancers.4–8 For instance, it has been reported to suppress breast cancer stemness via the nuclear factor erythroid 2-related factor 2 (Nrf2)–mediated pathway and increase chemosensitivity when combined with paclitaxel. 1 Jiang et al. have demonstrated that luteolin inhibits proliferation, promotes apoptosis, and reduces programmed death-ligand 1 (PD-L1) expression in KRAS-mutant lung cancer. 9 Additionally, luteolin has been shown to reverse epithelial–mesenchymal transition (EMT) by inhibiting the Notch signaling pathway. 10 Despite these advances, the mechanisms underlying luteolin’s anticancer effects remain complex and have not yet been fully elucidated. In this study, breast, lung, colorectal, gastric, and liver cancers were investigated due to their profound global and regional public health impact, clinical representativeness, and research significance. These cancers represent the most impactful malignancies across respiratory, digestive, and reproductive systems, covering diverse etiologies and clinical trajectories to inform global cancer control efforts.
Network pharmacology, initially proposed by the British pharmacologist Andrew L. Hopkins in 2007, represents an emerging interdisciplinary field that leverages systems biology and network analysis to elucidate drug actions within complex biological systems. 11 This approach enables the construction of multi-level interaction networks among compounds, target proteins, and biological pathways, effectively capturing the holistic characteristics of natural products that are often overlooked in conventional single-target drug discovery. 12 The integration of network pharmacology with computational methods such as molecular docking and molecular dynamics simulations has been increasingly adopted to investigate the mechanisms of potential anticancer compounds, providing a robust framework for predicting therapeutic effects and validating target interactions.13–16 In the present study, we applied this integrated computational strategy to explore the anticancer mechanisms of luteolin across multiple cancer types. Using systematic network construction, target identification, and dynamic simulation, we aimed to elucidate the multi-target actions and underlying pathways of luteolin, thereby offering a theoretical foundation for its further experimental validation and potential clinical applications.
Materials and methods
Target prediction of luteolin
The isomeric Simplified Molecular-Input Line-Entry System (SMILES) string and Structure Data File (SDF) molecular format of luteolin were obtained from the PubChem database (https://pubchem.ncbi. nlm.nih.gov) database. Subsequently, the targets associated with luteolin were identified using SwissTargetPrediction (http://swisstargetprediction.ch) 17 and the Traditional Chinese Medicine Systems Pharmacology Database and Analysis Platform (TCMSP, https://tcmspw.com/index.php), 18 and the relevant targets identified from the search were utilized as the predicted targets of luteolin. The data retrieved from these databases were subsequently merged.
Target prediction of five cancer types
The pertinent target associated with the keywords “lung cancer,” “liver cancer,” “gastric cancer,” “colorectal cancer,” and “breast cancer” were retrieved for the biological species “Homo sapiens” from the GeneCards (https://www.genecards. org/), 19 Online Mendelian Inheritance in Man (OMIM, https://www.omim.org/), 20 and Therapeutic Target Database (TTD, https://db.idrblab.net/ttd/) 21 databases.
GeneCards, the human gene database, allows researchers to efficiently explore and correlate a vast array of human genes, diseases, variants, proteins, cells, and biological pathways. OMIM is intended for use primarily by physicians and other professionals working in the field of genetic disorders, genetics researchers, and students of advanced science and medicine. The TTD database provides information regarding known and explored therapeutic protein and nucleic acid targets, their targeted diseases, related pathways, and drugs directed at these targets. In the GeneCards database, targets were filtered using a criterion of “Relevance score ≥15.” Cancer-related targets were then compiled by consolidating all the targets retrieved from the GeneCards, OMIM, and TTD databases. Subsequently, the data retrieved from these databases were merged, and duplicates were removed. The overlapping targets between luteolin and cancers were identified using the Jvenn database (http://bioinfo.genotoul.fr/jvenn).
Construction of protein–protein interaction (PPI) and drug–target–disease networks
The common targets were then input into the Search Tool for the Retrieval of Interacting Genes/Proteins (STRING) database (https://string-db.org/) to construct a PPI network. The “organism” parameter was set to “Homo sapiens,” and the minimum required interaction score was established at >0.4. The result was then imported into the Cytoscape_v3.10.3 software for visualization. This network consisted of 77 nodes and 474 edges (Figure 1(b)). The “Analyze Network CytoNCA app” tool in the Cytoscape_v3.10.3 software was employed to calculate the network topology parameters. Subsequently, nodes with the top 5 degree values were selected as core targets.

Identification of core targets of luteolin in cancer. (a) PPI network diagram and visualization of the core targets of luteolin in cancer using the STRING database. (b) In the PPI visualization diagram, core targets are sorted based on their degree value. A darker color and larger circle area indicate a higher degree value, signifying stronger interactions among targets. (c) Luteolin–target–cancer network. The yellow rectangle symbolizes luteolin, pink oval denotes five types of cancer, purple rectangle signifies 80 core targets, and gray lines primarily indicate the relationships between luteolin and core targets.
To analyze the complex associations among luteolin, overlapping targets, related pathways, and cancers, a drug–target–disease network was constructed using the Cytoscape_v3.10.3 software.
Gene Ontology (GO) and Kyoto Encyclopedia of Genes and Genomes (KEGG) enrichment analysis
GO and KEGG enrichment analyses of common targets were conducted using the Metascape database (http://metascape.org/). Statistical significance was established at p <0.01. Subsequently, we utilized the bioinformatics platform (http://www. bioinformatics.com.cn/) to generate a KEGG enrichment bubble diagram and a GO enrichment bar diagram.
Validation of luteolin–hub target gene interactions
Molecular docking technology was utilized to analyze the interactions between luteolin and its core targets. The crystal structures of AKT1 (PDB ID: 5kcv), epidermal growth factor receptor (EGFR) Protein Data Bank (PDB ID: 2gs2), estrogen receptor 1 (ESR1, PDB ID: 1a52), matrix metallopeptidase 9 (MMP9, PDB ID: 1l6j), and Steroid Receptor Coactivator (SRC) proto-oncogene (SRC, PDB ID: 2src) were obtained from the Research Collaboratory for Structural Bioinformatics (RCSBPDB, https://www.rcsb.org/), and the MOL2 (three dimensional (3D)) file of luteolin was downloaded from the TCMSP database. Subsequently, the proteins were processed using PyMOL (version 2.5.0) to remove water molecules, co-crystallized ligands, irrelevant protein chains, and ions. 22 Subsequently, drug and protein files were imported into the AutoDock Vina software (version 2.0) to separate the proteins, add non-polar hydrogens, and calculate the Gasteiger charges before saving them in the Protein Data Bank Partial Charge and Atom Type (PDBQT) format. 23 The target proteins were receptors, and luteolin was the ligand. The grid box for docking was constructed around the geometric center, based on the position of the original ligands and adjusted to ensure coverage of the docking pockets. Molecular docking and affinity calculations were performed utilizing the AutoDock Vina software (version 2.0). 24 The lower the binding energy, the greater the affinity between the ligand and its receptors. The conformation exhibiting the best affinity was selected as the final docking conformation and visualized using the PyMOL software (version 2.5.0).
Molecular dynamics simulation validation
The Gromacs2022 molecular dynamics (MD) simulation software was utilized in this study. The General AMBER Force Field (GAFF) force field was applied for small molecules, whereas the AMBER 14SB force field and Transferable Intermolecular Potential with 3 Points (TIP3P) water model were employed for proteins. The simulations were conducted under constant temperature, constant pressure, and periodic boundary conditions. Within the MD simulation framework, all hydrogen bonds were constrained using the LINCS algorithm, with a time step of 2 fs. Electrostatic interactions (ELEs) were computed utilizing the particle-mesh Ewald (PME) method with a 1.2-nm cutoff. The non-bonded interaction cutoff was set at 10 Å and updated at every 10 steps. Temperature control was achieved using the V-rescale method to maintain the system at 298 K, whereas pressure control was maintained at 1 bar using the Berendsen method. Equilibration simulations in the Number, Volume, Temperature (NVT) and Number, Pressure, Temperature (NPT) ensembles were conducted for 100 ps at 298 K, followed by a 100 ns production MD simulation of the complex system, with conformations saved at every 10 ps. Subsequently, Visual Molecular Dynamics (VMD) and PyMOL software (version 2.5.0) were employed for trajectory analysis, and the g_mmpbsa program was utilized to assess the binding free energy between the protein and small molecule ligand using the molecular mechanics Poisson–Boltzmann surface area (MMPBSA) method.
Differential expression analysis and immunohistochemistry staining of AKT1
The UALCAN portal (http://ualcan.path.uab.edu/analysis-prot.html), an interactive web resource for analyzing cancer omics data, was used to analyze protein expression in the Clinical Proteomic Tumor Analysis Consortium (CPTAC) dataset. 25 Herein, we explored the total AKT1 protein expression level (NC_000014.9) in primary and normal tissues by querying “AKT1.” The available datasets of five types of cancers, including breast, colon, liver, lung, and gastric cancers, were selected.
The Human Protein Atlas (HPA) database (https://www.proteinatlas.org/) was used to investigate AKT1 gene expression in five normal tissue types and AKT1 protein expression in five cancer types. We downloaded immunohistochemical images of breast, colon, liver, lung, and gastric cancers with the corresponding normal tissues from the HPA to evaluate the differential expression of AKT1. The Gene Expression Profiling Interactive Analysis (GEPIA) database (http://gepia.cancer-pku.cn/) was used to verify the differential expression of AKT1 in these tumor types and corresponding normal tissues.
AKT1-related gene enrichment analysis
We first searched the STRING website (https://string-db.org/) using the query of a single protein name (“AKT1”) and organism (“Homo sapiens”). Subsequently, we set the following main parameters: minimum required interaction score (“Low confidence (0.150)”), meaning of network edges (“evidence”), maximum number of interactors to show (“no more than 50 interactors” in the first shell) and active interaction sources (“experiments”). Finally, the available experimentally determined AKT1-binding proteins were obtained.
We used the “Similar Gene Detection” module of the Gene Expression Profiling Interactive Analysis 2 (GEPIA2) database to identify the top 100 genes correlated with AKT1 based on gene expression data from tumor and normal tissues in The Cancer Genome Atlas (TCGA) database. We also applied the “correlation analysis” module of the GEPIA2 database to perform pairwise gene Pearson correlation analysis of AKT1 and the selected genes. Base-2 logarithm of transcripts per million (log2 TPM) was applied for the dot plot. The p-value and the correlation coefficient (R) were indicated. Moreover, we used the “Gene Corr” module of TIMER2 to supply the heatmap data of the selected genes, which contains the partial correlation (cor) and p-value in the purity-adjusted Spearman's rank correlation test.
We combined the two sets of data to perform KEGG pathway analysis. In brief, we uploaded the gene lists to the Database for Annotation, Visualization, and Integrated Discovery (DAVID) with the settings of selected identifier (“OFFICIAL_GENE_SYMBOL”) and species (“Homo sapiens”) and obtained the data of the functional annotation chart. The enriched pathways were finally visualized using the ‘tidyr’ and ‘ggplot2’ R packages. A two-tailed p <0.05 was considered statistically significant.
Statements
This study was conducted in accordance with the ethical standards of the Helsinki Declaration of 1975 (as revised in 2024). This retrospective bioinformatics analysis was based on publicly available datasets. Ethical approval was waived by the Institutional Review Board of Xuzhou University of Technology, as no human or animal participants were involved. Due to the retrospective nature of this study and the use of anonymized public data, written informed consent was not required. All data used in this study were obtained from publicly accessible databases. No personal identifiable information was involved in the analysis. The reporting of this study conforms to the Strengthening the Reporting of Observational Studies in Epidemiology (STROBE) guidelines for observational studies. 26
Results
Potential targets of luteolin
In total, 100 potential targets of luteolin were identified using the SwissTargetPrediction database, and their corresponding gene names were retrieved from the UniProt database.
Related targets of cancers
We conducted a search in the GeneCards, OMIM, and TTD databases for targets related to lung, liver, gastric, colorectal, and breast cancers and calculated the median relative score. After eliminating duplicates, we identified 4541 relevant targets for five types of cancer. The Jvenn database was utilized to identify overlapping targets, resulting in 80 common targets (Figure 2).
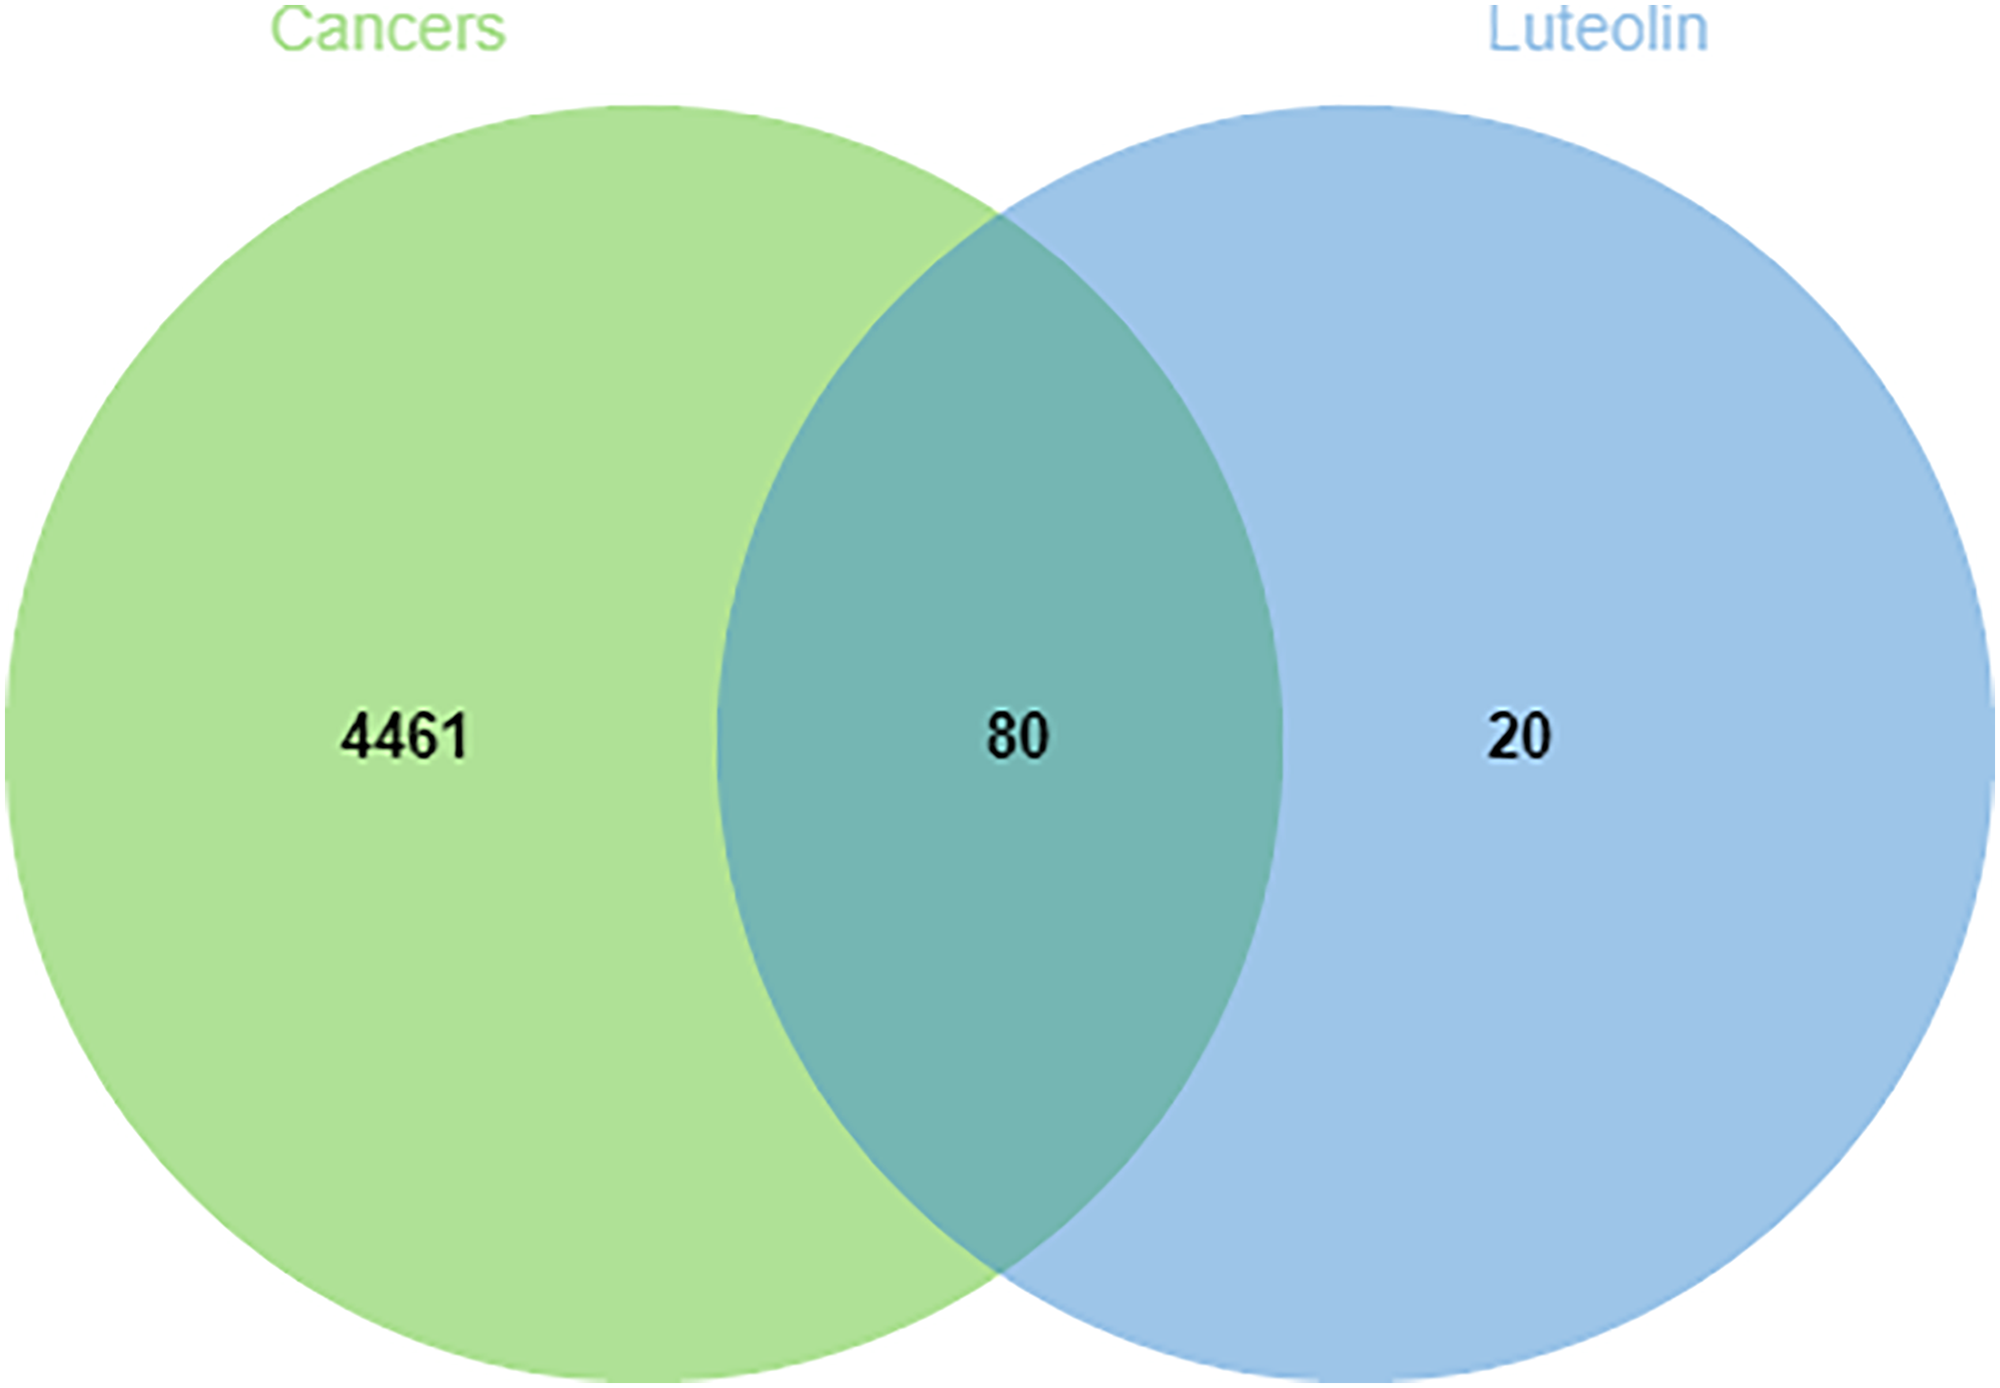
Venn diagram of the overlapping targets.
PPI network and drug–target–disease network
These common targets were then imported into the STRING database to construct a PPI network (Figure 1(a)) and were subsequently visualized using the Cytoscape_v3.10.3 software (Figure 1(b)). The targets with the highest degree values, specifically AKT1, EGFR, ESR1, MMP9, and SRC were identified as core targets. Utilizing Cytoscape v3.10.3 software, a drug–target–disease network diagram was constructed, as shown in Figure 1(c).
GO and KEGG enrichment analyses
The 80 luteolin-cancer targets were further analyzed using the Metascape database, revealing 459 enriched biological process (BP), 60 cellular component (CC), and 76 molecular function (MF) terms. The top 10 most enriched terms from BP, CC, and MF were visualized in different diagrams (Figure 3(a) to (c)). BP terms primarily involved cellular response to chemical stress, response to oxidative stress, cellular response to oxidative stress, and response to amyloid-beta. CC terms mainly included apical part of the cell, extrinsic component of the plasma membrane, and transcription regular complex. MF terms mainly included a variety of kinase regulator activity, especially serine/threonine kinase activity. The top 10 enriched KEGG terms were visualized in a Sankey plot diagram (Figure 3(d)).
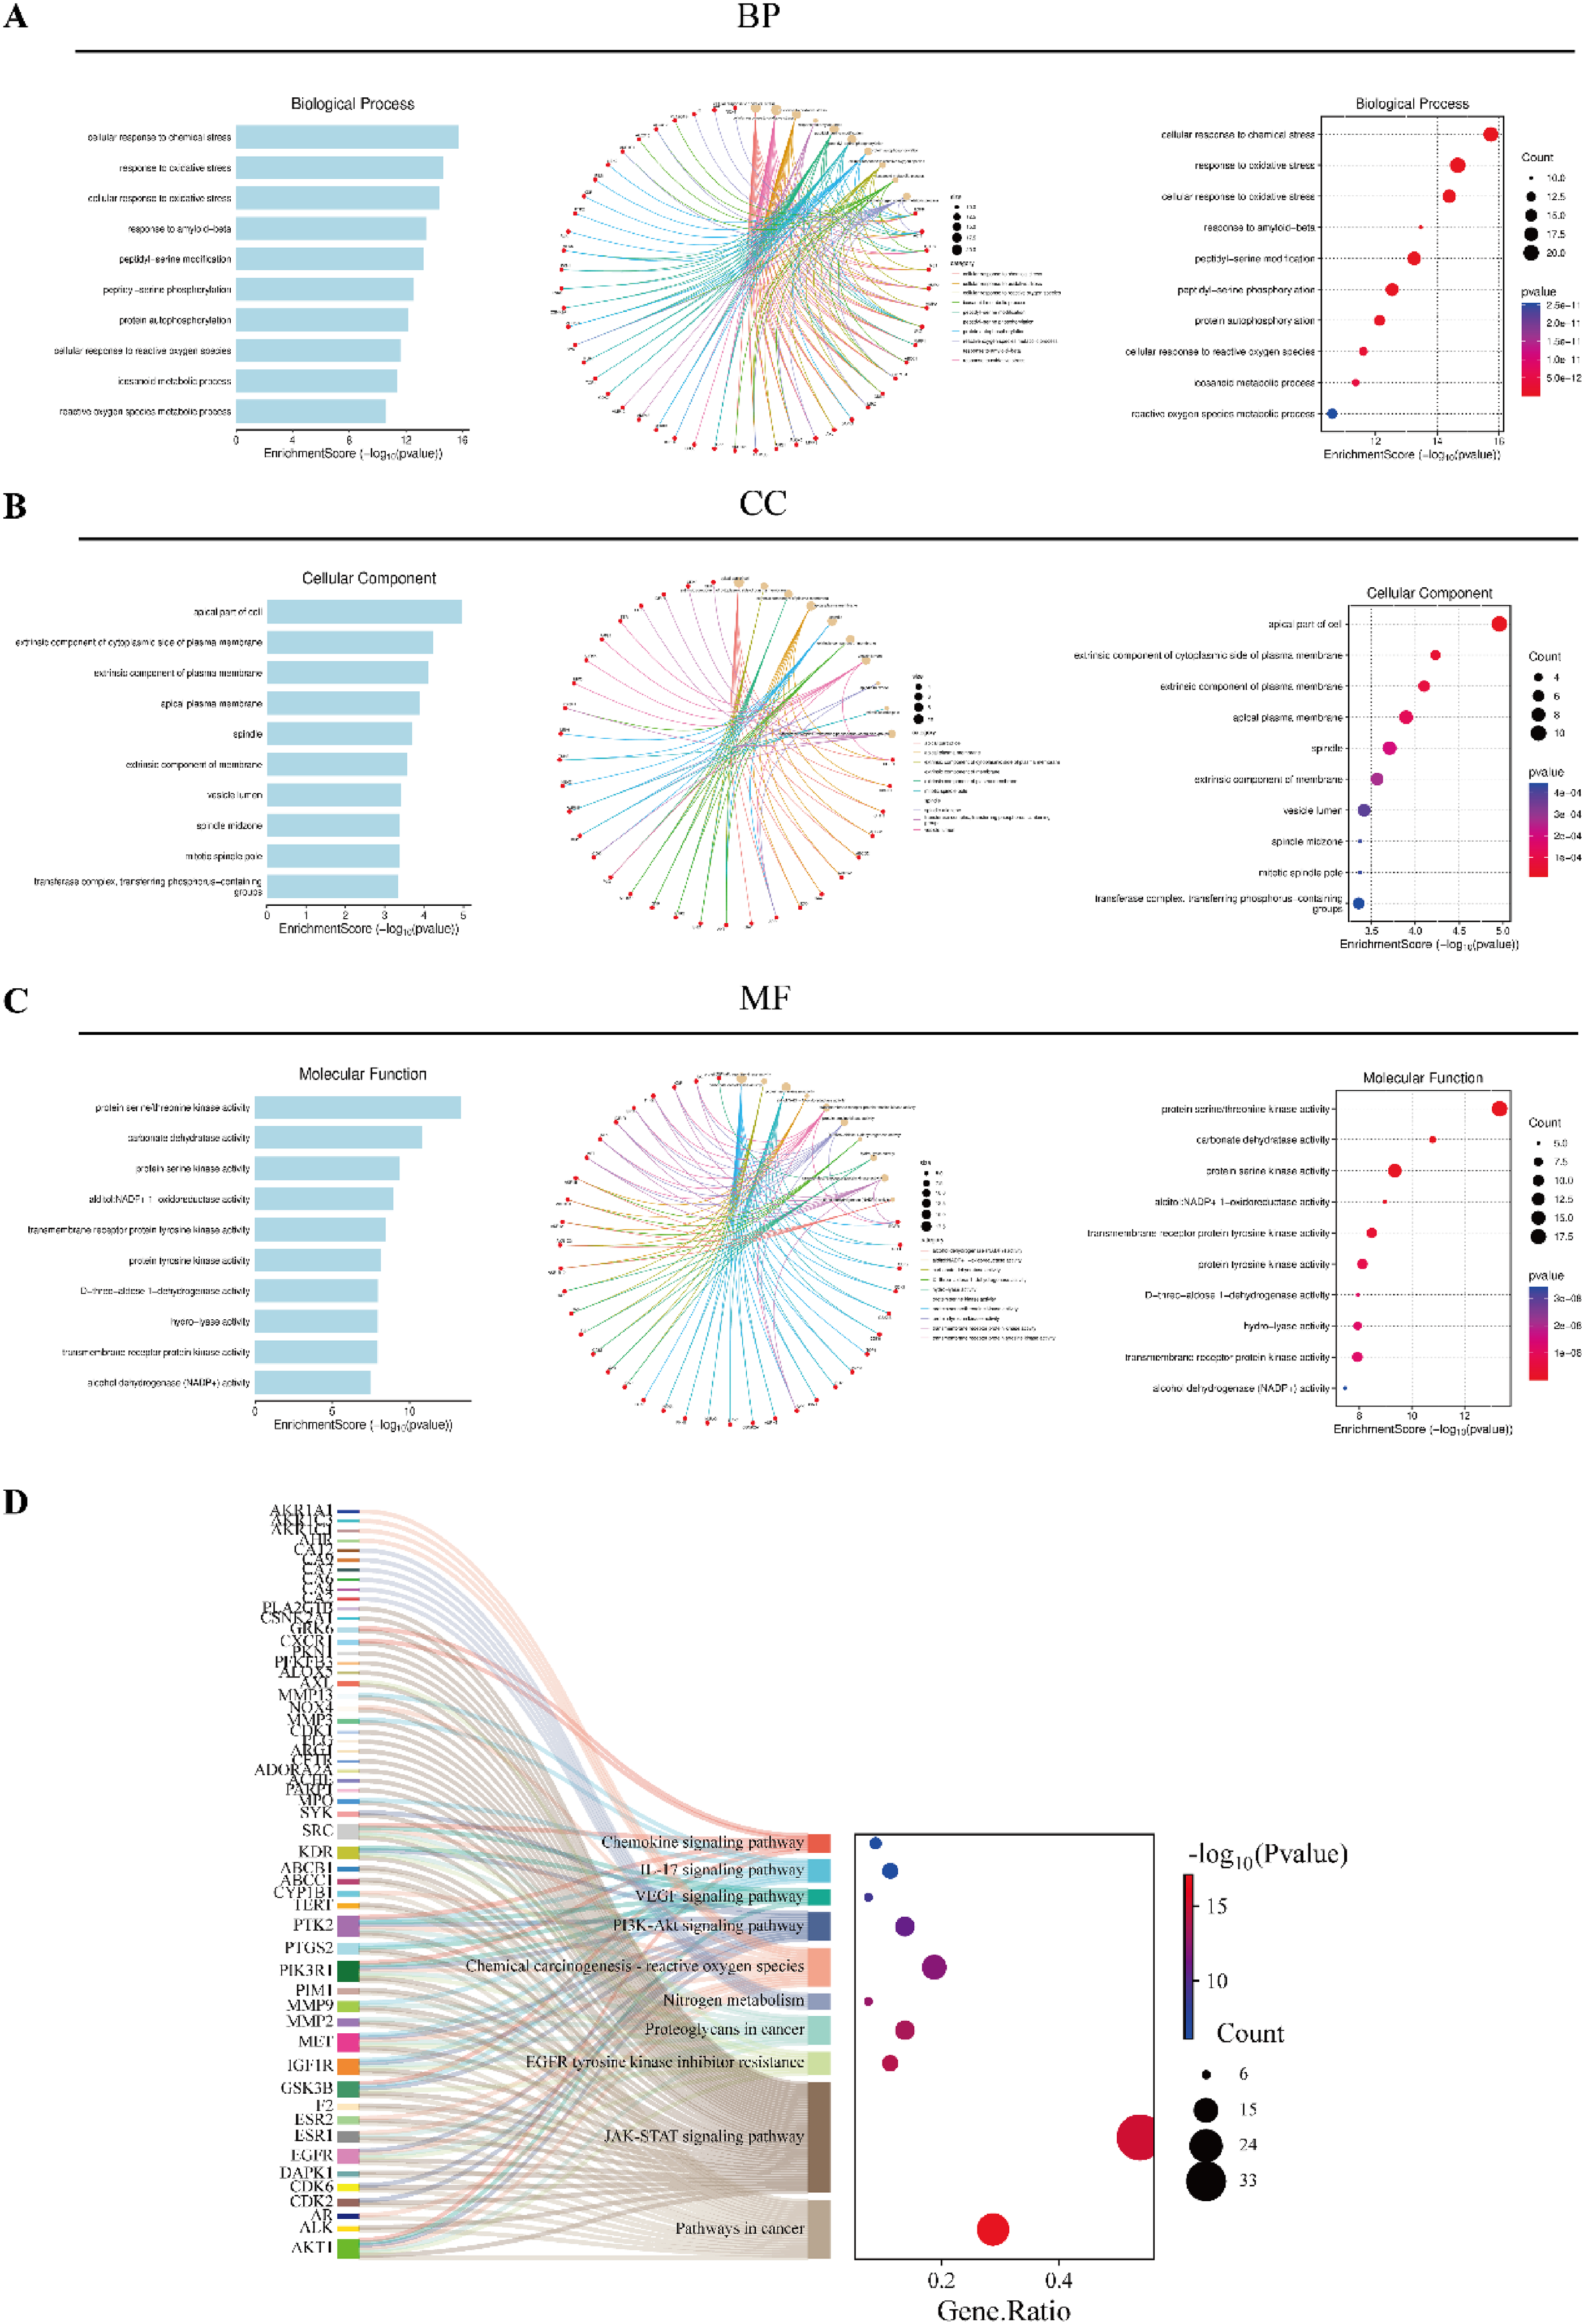
Go and KEGG enrichment analysis of luteolin-cancers core targets. (a) Triadic histogram depicting the GO biological processes (BPs), molecular functions (MFs), and cellular components (CCs) of the core targets of luteolin in cancer. (b) Sankey dot plot of KEGG enrichment analysis for the top 10 pathways of the core targets of luteolin in cancer (p < 0.05).
Molecular docking
Based on the PPI network analysis, molecular docking was conducted to evaluate the docking modes and binding affinities of luteolin with the five core targets. The molecular docking modes are shown in Figure 4(a). The results showed that the amino acids asparagine (ASN)-54) and threonine (THR)-211) in the AKT1 protein formed hydrogen bonds with luteolin, whereas aspartate (ASP)-292, tryptophan (TRP)-80, leucine (LEU)-210), and valine (VAL)-270 formed pi-anion, pi-pi stacked, and pi-alkyl hydrophobic interactions, and amino acids such as LEU-264, ASN-204, and isoleucine-84 (ILE-84) formed van der Waals interactions. Additionally, as shown in Figure 4(b), the binding affinity of the core targets with luteolin was <7.5 kcal/mol, indicating that these targets could stably bind with luteolin. 27 The binding affinity of AKT1-luteolin was −9.6 kcal/mol indicated that the binding was the most stability. These results demonstrate the reliability of network pharmacological results.

Molecular docking modes of luteolin with the core targets. (a) Luteolin–AKT1, luteolin–EGFR, luteolin–ESR1, luteolin–MMP9, and luteolin–SRC. (b) The binding affinity heatmap diagram of the core targets with luteolin.
MD simulation
According to the binding affinity, we further investigated the stability and structural changes of luteolin binding to AKT1 by performing MD simulations. Following the molecular docking results, the simulated trajectories were processed, and the simulated conformations were superimposed. The results are shown in Figure 5(a). The superimposition degree of the small molecule was relatively high, indicating that the small molecule remained bound to the protein throughout. Principal component analysis (PCA) is an analytical method used to reduce data dimensions and extract the main motion patterns. As shown in Figure 5(b), the PCA plot has one red spot with the highest frequency of occurrence, indicating that it is the conformation where luteolin binds to AKT1 most stably. The surface electrostatic potential (SEP) reflects the charge properties of different regions on the molecular surface and is an important physical quantity for describing the charge distribution on the molecular surface and its influence on the external environment. The SEP of the simulated structure was analyzed, and the results are shown in Figure 5(c). Luteolin is bound to the interior of the protein, and the binding surface is predominantly negatively charged, facilitating ELE and the formation of hydrogen bonds.

Molecular dynamics simulation. (a) Simulated conformation superposition; (b) PCA and protein structure; (c) the surface electrostatic potential of luteolin binding to AKT1; (d) RMSD of the complex, proteins, and small molecule ligands; (e) Rg of the complex; (f) FEL of the complex; (g) RMSF of AKT1 in the complex; (h) B-factor of the complex; (i) the distance between AKT1 and the luteolin binding site (dock site ligand); (j) the embedding area between luteolin and AKT1 protein.
Root mean square deviation (RMSD) is commonly employed to assess the extent of structural variations from the initial molecular structure. As shown in Figures 5(d), the RMSD values of the luteolin-AKT1 system were stabilized after 20 ns, indicating that the binding of luteolin to AKT1 was stable. The radius of gyration (Rg) is used to identify the compactness of molecules. As shown in Figures 5(e), the fluctuation ranges of the Rg values of the luteolin-AKT1 system were small throughout the simulations. Free energy landscape (FEL) is a diagram used to describe the free energy distribution of molecular systems in different conformational states. It can demonstrate various possible conformations of the binding system and their relative stability. The RMSD and Rg of the luteolin-AKT1 system were used to generate the FEL diagrams, as shown in Figure 5(f). There exists one state with relatively low energy in the complex, indicating that the overall structure of the luteolin-AKT1 system was relatively stable. The root mean square fluctuation (RMSF) is commonly used to represent the degree of fluctuation of individual atoms in molecules. As shown in Figure 5(g), the RMSF values of amino acid residues in the luteolin-AKT1 system (except the residues 211, 264, 270, and 292) were lower than those in the AKT1 system. Taking the RMSF value as the B-factor, a B-factor plot was constructed. The results are shown in Figure 5(h). The flexibility of amino acids around luteolin is relatively low, resulting in relatively stable binding of luteolin to AKT1.
The centroid evolution analysis can resolve the state of small molecules on the protein surface and analyze the distance between the centroid of the initial docking site residue and the centroid of the small molecule. The stability of the protein–ligand complex can be evaluated by monitoring the distances between luteolin and the center of AKT1 as well as between luteolin and the binding site, which gradually stabilized, indicating stable binding of luteolin to AKT1 (Figure 5(i)). Buried solvent accessible surface area (SASA) is a method used to assess the extent of surface area that becomes buried on the formation of a molecular complex and is therefore inaccessible to the solvent. It represents the area of direct contact between the ligand and protein. The greater the value of the buried SASA, the stronger the intermolecular interaction. A larger buried SASA reflects a larger protein–ligand contact interface. As shown in Figure 5(j), the buried SASA gradually stabilized, indicating that the contact area between luteolin and AKT1 gradually stabilized, consistent with the stable binding of the two.
Hydrogen bond interaction is an important force for the binding of proteins to ligands. Hydrogen bonds are related to ELEs and can reflect the strength of ELEs. As depicted in Figure 6(a), the number of hydrogen bonds between small molecules and proteins fluctuates between one and three. Hydrogen bond frequency analysis is commonly used to study the formation and retention of hydrogen bonds between or within molecules. Using this analysis, ligands at the binding sites can be identified. A high-frequency hydrogen bond was formed on a certain amino acid residue at the point. As presented in Figure 6(b), the left panel shows the acceptors, donors, and occupancies of hydrogen bond pairs. The right panel shows the formation frequency of hydrogen bonds, with the line density indicating the hydrogen bond formation frequency. The results demonstrate relatively low hydrogen bond stability between luteolin and AKT1. Figure 6(c) shows the ELE and van der Waals (VDW) forces between luteolin and AKT1 binding. The results indicate that VDW force and ELE in the complex gradually stabilize as the simulation proceeds, suggesting gradual stabilization of the binding between the small molecule and protein.

Analysis of hydrogen bond interactions between luteolin and AKT1 protein. (a) Hydrogen bond number of the complex; (b) frequency of hydrogen bonds; (c) binding energy analysis; (d) contribution of amino acid binding energy.
Comprehensively, considering RMSD, Rg, distance, buried SASA and interaction energy analysis, the stable portion of the complex trajectory was selected for binding free energy calculations using the MMPBSA. The ΔEMMPBSA of the small molecule and protein was −86.084 ± 2.36 kJ/mol, and the binding energy and affinity of the two were relatively high. The binding energy ΔEMMPBSA was decomposed to calculate the energy contribution of each amino acid to the binding between luteolin and AKT1. The important amino acids in the protein were evaluated. The residues in the protein that contributed more to their respective binding energies are shown in Figure 6(d). The key amino acid residues involve in luteolin binding included TRP-80 and LEU-210.
Differential expression analysis and immunohistochemistry staining of AKT1
Analysis of the CPTAC dataset showed higher total AKT1 protein expression in the primary tissues of lung, gastric, and breast cancers (Figure 7(a) to (e), p < 0.001, left panel) than in normal tissues; however, the total AKT1 protein expression was lower in the primary tissues of liver and colon cancers than in normal tissues. Immunohistochemical results of normal and tumor tissues stained with AKT1-corresponding antibodies HPA002891 in breast and liver tissues, CAB080436 in colon and gastric tissues, and CAB003765 in lung tissue were obtained from the HPA database. Immunohistochemical staining results showed that, compared with normal liver and colon tissues, the immunohistochemical staining of tumor tissues was light, indicating that AKT1 proteins were significantly under expressed in these tumor tissues (Figure 7(b) to (e), right panel). Immunohistochemical results revealed that compared with the corresponding normal tissues, lung, breast, and gastric tumor tissues, exhibited deeper staining, indicating significantly higher AKT1 expression (Figure 7(a), (c), and (d)). Similarly, immunohistochemical results validated the AKT1 expression results of the CPTAC dataset.

Validation of the expression of AKT1 in five types of cancers and as in the corresponding normal tissues. (a) The protein expression and immunohistochemical staining of AKT1 in lung cancer and corresponding normal tissue; (b) protein expression and immunohistochemical staining of AKT1 in liver cancer and corresponding normal tissue; (c) protein expression and immunohistochemical staining of AKT1 in gastric cancer and corresponding normal tissue; (d) protein expression and immunohistochemical staining of AKT1 in breast cancer and corresponding normal tissue; (e) protein expression and immunohistochemical staining of AKT1 in colon cancer and corresponding normal tissue.
AKT1-related gene enrichment analysis
To further investigate the molecular mechanism of the AKT1 gene in tumorigenesis, we screened for AKT1-binding proteins and AKT1 expression-correlated genes for a series of pathway enrichment analyses. Using the STRING tool, we obtained a total of 50 AKT1-binding proteins, which were supported by experimental evidence. Figure 8(a) shows the interaction network of these proteins. We used the GEPIA2 tool to combine all tumor expression data of TCGA and obtained the top 100 genes that correlated with AKT1 expression. As shown in Figure 8(b), the AKT1 expression level was positively correlated with that of TFIIB-related factor 1 (BRF1, R = 0.74), zinc finger and BTB (Bric-a-brac, Tramtrack, Broad-complex) domain containing 42 (ZBTB42, R = 0.72), WD repeat domain 20 (WDR20, R = 0.71), BAG cochaperone 5 (BAG5, R = 0.65), CDC42 binding protein kinase beta (CDC42BPB, R = 0.63), and ubiquitin protein ligase E3 component n-recognin 7 (UBR7, R = 0.60) genes (all p < 0.001). The corresponding heatmap data also showed a positive correlation with AKT1.

AKT1-related gene enrichment analysis. (a) Available experimentally determined AKT1-binding proteins using the STRING tool; (b) using the GEPIA2 approach, we also obtained the top 100 AKT1-correlated genes in TCGA projects and analyzed the expression correlation between AKT1 and selected targeting genes, including BRF1, ZBTB42, WDR20, BAG5, CDC42BPB, and UBR7 (all p < 0.001); (c) Sankey dot plot of KEGG pathway enrichment analysis of AKT1-correlated genes; (d) triadic histogram depicting the GO analysis including biological processes (BPs), molecular functions (MFs), and cellular components (CCs) of AKT1 correlated genes.
We used the TCGA and CPTAC stomach adenocarcinoma datasets to perform KEGG and GO enrichment analyses. The KEGG data presented in Figure 8(c) suggest that the “P13K-Akt signaling pathway” and “FoxO signaling pathway” might be involved in the action of AKT1 in tumor pathogenesis. The top 10 most enriched terms from BP, CC, and MF were visualized using different diagrams (Figure 8(d)). BP terms primarily involved peptidyl-serine phosphorylation and modification. CC terms mainly included TORC2 complex, CD40 receptor complex, and TOR complex. MF terms mainly included serine/threonine kinase activity, serine kinase activity, and ubiquitin protein ligase binding.
Discussion
This study employed network pharmacology and molecular docking to demonstrate that luteolin, a natural flavone, exerts anticancer effects through multi-target pathways, prominently targeting AKT1, a key regulator in tumorigenesis and progression. Systematic analysis using the TCMSP platform revealed luteolin’s favorable pharmacokinetic properties (absorption, distribution, metabolism, and excretion), supporting its therapeutic potential. 28 The intersection of luteolin targets and cancer-associated genes identified AKT1 as a central node in the PPI network, alongside core targets such as EGFR, ESR1, MMP9, and SRC, which are pivotal in cancer signaling cascades. 29 Functional enrichment analysis indicated luteolin’s modulation of oxidative stress response, apoptotic signaling, and inorganic substance response, processes critically linked to tumor suppression. 30 Pathway enrichment further highlighted the phosphoinositide 3-kinase (PI3K)-Akt and tumor necrosis factor (TNF) signaling pathways as central to luteolin’s antitumor activity, underscoring its broad-spectrum potential across cancer types. Experimental validation confirmed luteolin’s binding affinity to predicted targets and its efficacy in reducing cancer cell viability in vitro. 3 Additionally, its neuroprotective role in ischemic stroke models, mediated through TNF signaling, reveals a common mechanistic axis in both cancer and neurological diseases.31,32 Collectively, these findings position luteolin as a promising multi-targeted anticancer candidate, with AKT1 playing a central role in its mechanism.
Luteolin has emerged as a therapeutic agent with potential applications in cancer, stroke, and inflammatory diseases. Advanced computational and experimental approaches, particularly network pharmacology, have elucidated its multi-target interactions and pathway modulation. In cancer, luteolin disrupts oncogenic pathways such as the PI3K–Akt pathway, which is frequently dysregulated in malignancies such as osteosarcoma and glioma.2,33 Network analyses identified AKT1 as a pivotal hub in osteosarcoma, with in vivo studies confirming its role in inhibiting tumor proliferation and metastasis. 34 Similarly, in glioma, luteolin interacts with AKT1 to modulate oxidative stress and apoptosis. Molecular docking simulations further support its strong binding affinity to targets, reinforcing its multi-target therapeutic potential. 35 In addition to oncology, luteolin exhibits neuroprotective effects in ischemic stroke by modulating TNF signaling and inflammatory pathways.36,37 Its antimetastatic activity stems from the inhibition of EMT, a critical process in cancer invasion and drug resistance. 38 Complemented by robust antioxidant properties, luteolin demonstrates cytoprotective and anti-inflammatory effects across disease models. 39 These pleiotropic actions highlight its promise as a novel therapeutic for diverse pathologies.
The identification of AKT1 as a key therapeutic target of luteolin across multiple cancer types represents a significant advancement in elucidating the molecular mechanisms underlying its anticancer properties. As a naturally occurring flavonoid, luteolin exhibits broad-spectrum pharmacological activities, including antiproliferative, pro-apoptotic, and antioxidant effects in various cancer cell lines. 40 However, its clinical application has been limited by challenges such as poor aqueous solubility and limited bioavailability. 41 Recent advances in nano formulation technologies offer promising solutions to enhance systemic delivery and efficacy. Concurrently, network pharmacology has expanded the research scope by enabling the systematic identification of key molecular targets and signaling pathways involved in luteolin’s antitumor activity.
Network pharmacology studies have revealed that luteolin interacts with multiple biological targets, with AKT1 emerging as a central node in cancer progression regulation. 42 As a critical component of the PI3K/AKT/mechanistic target of the rapamycin (mTOR) signaling cascade, AKT1 plays a pivotal role in cell survival, proliferation, and apoptosis resistance—processes frequently dysregulated in malignancies. Through multi-target modulation, luteolin suppresses tumor growth and metastasis by interfering with EMT, a key driver of cancer cell invasion and drug resistance. 43 The compound’s ability to suppress EMT-related transcription factors and downstream signaling pathways further highlights its therapeutic relevance in oncology. Molecular docking simulations corroborate the binding affinity between luteolin and AKT1, reinforcing the drug ability of this interaction. 44
Despite these promising findings, certain limitations must be addressed when considering clinical translation. Although nano formulations improve luteolin’s pharmacokinetic profile, discrepancies between in vitro and in vivo efficacies persist. Additionally, although network pharmacology provides comprehensive insights into potential targets, experimental validation in preclinical models is essential to confirm AKT1’s biological significance as a therapeutic target. The complexity of luteolin’s multi-target mechanism also necessitates further investigation into its safety profile and potential off-target effects, particularly when combined with conventional chemotherapeutic agents. 45 Collectively, these findings underscore luteolin’s potential as a multi-targeted anticancer agent, with AKT1 serving as a pivotal mediator of its therapeutic effects across cancer types.
The discovery of AKT1 as a luteolin target, facilitated by network pharmacology, opens novel avenues for oncological research and therapeutic development. Luteolin demonstrates significant antiproliferative and antimetastatic properties through diverse mechanisms, including apoptosis induction, cell cycle arrest, and EMT suppression, a critical process in cancer metastasis. 46 Given EMT’s role in enhancing cancer cell motility, invasiveness, and therapy resistance, identifying bioactive compounds such as luteolin that modulate this process with minimal cytotoxicity is crucial. Network pharmacology studies have further elucidated luteolin’s multi-target profile, particularly in glioma, where it interacts with key nodes such as AKT1, EGFR, and ESR1, influencing pathways such as the PI3K-Aktpathway, which is central to tumor progression. 33 These findings highlight luteolin’s drug ability and indicate its potential utility in precision oncology, especially for cancers with AKT1 dysregulation. Moreover, luteolin’s neuroprotective effects in ischemic stroke models, mediated through anti-inflammatory and anti-apoptotic pathways, indicate broader therapeutic potential beyond oncology.
The immunohistochemistry data supporting the bioinformatics trends were sourced from public databases (CPTAC and HPA). AKT1, as a core kinase of the PI3 K/AKT signaling pathway, exhibits complex and tissue-specific regulation of its expression and activity across different cancer types. Our data showed that the total AKT1 protein expression was significantly higher in tumor tissues than in paired normal tissues in lung, gastric, and breast cancers (p < 0.001). Conversely, its expression was lower in tumor tissues of liver and colon cancers. This discrepancy may reflect the heterogeneity in the pathogenesis of different cancers. In lung, gastric, and breast cancers, AKT1 overexpression might serve as an oncogenic factor driving cell survival, proliferation, and apoptosis resistance. In liver and colorectal cancers, the lower expression of AKT1 could suggest the activation of alternative survival signaling pathways in these specific contexts or mean that AKT1 plays a more context-dependent role related to cell differentiation or migration suppression. Furthermore, differences in the tumor microenvironment, genetic mutation profiles, and epigenetic modifications could contribute to the cancer type–specific expression pattern of AKT1.
Future research should prioritize validating luteolin’s in vivo efficacy in cancer models, optimizing its pharmacokinetic properties, and exploring synergistic combinations with existing chemotherapeutics. Structure–activity relationship studies and formulation development are also warranted to enhance bioavailability and target specificity. Integrating multi-omics data with systems pharmacology approaches will refine our understanding of luteolin’s molecular interactions and accelerate clinical translation.
Conclusion
In this study, we employed an integrated computational approach combining network pharmacology, molecular docking, and MD simulations to systematically explore the anticancer mechanisms of luteolin across five cancer types. Our analyses identified AKT1 as a central hub gene within the luteolin–target interaction network. These findings, supported by both bioinformatics predictions and subsequent computational validation (molecular docking and dynamics simulations), highlight the potential of luteolin as a multi-target therapeutic agent in oncology.
Footnotes
Acknowledgments
The authors would like to thank the anonymous editors and reviewers for their valuable comments and suggestions that improved the quality of this manuscript.
Ethics statement
The public data we used to validate our key genes were sourced from The Cancer Genome Atlas (TCGA), Gene Expression Profiling Interactive Analysis 2 (GEPIA2), Clinical Proteomic Tumor Analysis Consortium (CPTAC), and The Human Protein Atlas (HPA) databases, as cited in our paper. These data were utilized solely for research purposes.
Authors’ contributions
Conceptualization, H-X. X.; investigation, H-X. X. and J.S.; methodology, W-Y. Q. and C-D. Z.; writing—original draft preparation, H-X. X.; funding acquisition, H-X. X.; validation, H-X. X.; visualization, H-X. X.; software, H-X. X.; data curation, J.S.; supervision, N-N. Z.; writing—review and editing, H-X. X.; project administration, H-X. X. All the authors have read and agreed to the submitted version of the manuscript.
Funding
The authors disclosed receipt of the following financial support for the research, authorship, and/or publication of this article: This work was supported by National Natural Science Foundation of China (Grant No. 32302865); Natural Science Foundation of Jiangsu Province, China (Grant No. BK20210077); and Basic Research Project of Xuzhou city (Grant No. KC22010).
Conflict of interest
The authors declare that the research was conducted in the absence of any commercial or financial relationships that could be construed as a potential conflict of interest.
Data availability statement
All data generated or analyzed during this study are included in this published article and its supplementary information files. The original datasets supporting the conclusions of this article are available in the TCGA and CPTAC public data repositories, with access links provided in the main text.