
Abstract
Objective
Although renal failure is an important cause of death in the United States, recent mortality trends and subgroup differences remain insufficiently characterized. This nationwide ecological time-trend study examined renal failure mortality among adults in the United States from 1999 to 2024 by sex, age, race and ethnicity, region, state, urbanization level, and renal failure subtype.
Methods
Deaths among adults aged ≥25 years with renal failure as the underlying cause of death were identified from the Centers for Disease Control and Prevention Wide-ranging Online Data for Epidemiologic Research (CDC WONDER) database. Renal failure was defined using International Classification of Diseases, Tenth Revision codes N17 to N19. Primary measures were age-adjusted mortality rate and average annual percent change. Subtype analyses were performed for acute, chronic, and unspecified renal failure.
Results
From 1999 to 2024, 1,192,598 deaths were attributed to renal failure. Annual deaths increased from 34,456 to 53,848, whereas age-adjusted mortality rate changed only modestly from 19.57 to 19.05 per 100,000 population, with an average annual percent change of −0.16 (95% confidence interval, −0.62 to 0.30). In 2024, males had a higher age-adjusted mortality rate than females (22.72 vs. 16.26), and non-Hispanic Black individuals exhibited the highest age-adjusted mortality rate (37.53). Adults aged 45–54 years showed a significant long-term increase. Subtype analyses revealed increasing chronic renal failure, a nonsignificant increase in acute renal failure, and markedly declining unspecified renal failure.
Conclusions
Although overall renal failure age-adjusted mortality rate remained largely stable from 1999 to 2024, this pattern masked divergent subtype trends and persistent subgroup disparities. Higher rates among males, non-Hispanic Black individuals, and nonmetropolitan populations suggest that gaps have not narrowed sufficiently, likely reflecting unequal cardiometabolic risk burden, delayed detection, and uneven access to kidney care. Prevention strategies should prioritize high burden communities and improve early chronic kidney disease recognition, risk factor control, and access to nephrology care.
Keywords
Introduction
Renal failure (RF) encompasses a range of conditions leading to substantial healthcare utilization and mortality, particularly in aging populations. 1 Chronic kidney disease (CKD) affects an estimated 13.4%–15.2% of adults globally, with major causes including hypertension, diabetes, and glomerulonephritis.2,3
Risk factors for RF are closely associated with older age and cardiometabolic conditions, particularly obesity and metabolic syndrome, which together expand the population at risk for progressive CKD. 4 Poorly controlled hypertension and diabetes remain dominant pathways to kidney damage and progression to end-stage renal disease (ESRD) requiring dialysis or kidney transplantation. 5 In advanced RF, deaths are often related to cardiovascular and infectious complications and can be precipitated by acute physiologic decompensation such as volume overload and hyperkalemia, together with severe uremic toxicity. 6
RF burden is not evenly distributed: older adults, racial/ethnic minority groups, and rural residents frequently experience higher risk and worse outcomes, partly reflecting barriers across prevention, specialty care access, and community resources.7,8 Population-based data and reviews consistently document substantially higher ESRD burdens in Black and Hispanic populations, and socioeconomic disadvantage (including community poverty) independently contributes to ESRD risk.9,10 During the coronavirus disease 2019 (COVID-19) pandemic, evidence indicates meaningful disruption of CKD-related health services and reduced access to care, raising concern for delayed detection and treatment, especially in resource-constrained settings.11,12
Although many studies emphasize disease burden and prevalence, relatively fewer studies have focused on national mortality trends for RF using standardized death certificate surveillance. Therefore, we conducted a nationwide analysis of United States (U.S.) adult mortality from RF (1999–2024) using Centers for Disease Control and Prevention Wide-ranging Online Data for Epidemiologic Research (CDC WONDER) Underlying Cause of Death database. 13 Temporal trends were quantified using the Joinpoint Regression Program, with stratification by sex, age, race/ethnicity, census region, state, and urban–rural status, focusing on long-term mortality trends while considering the impact of the COVID-19 period.
Methods
Study design and data source
We conducted a nationwide ecological time-trend study of RF mortality in the U.S. from 1999 to 2024 using the CDC WONDER Underlying Cause of Death database (https://wonder.cdc.gov/).14,15 This database compiles death certificate information from the National Vital Statistics System and provides annual death counts and mortality rates with standard age adjustment options. 13 All analyses were restricted to adults aged ≥25 years.
Case definition and stratification variables
Deaths were included if RF was listed as the underlying cause of death on the death certificate, defined using International Classification of Diseases, Tenth Revision (ICD-10) codes N17–N19 in the CDC WONDER query.
We extracted annual mortality counts and rates overall and by the following strata: sex (female, male), age group (25–34, 35–44, 45–54, 55–64, 65–74, 75–84, and ≥85 years), race and ethnicity (Hispanic, non-Hispanic (NH) White, NH Black, and NH Other), U.S. census region (Northeast, Midwest, South, and West), state, and urbanization level based on the 2013 National Center for Health Statistics Urban Rural Classification Scheme for Counties, aggregated as metropolitan versus nonmetropolitan. 16 Because the 2013 NCHS urbanization classification is only available for selected years in CDC WONDER, analyses based on this scheme were limited to 2020 and earlier.
To address the clinical heterogeneity within the RF definition, we further conducted subtype analyses according to the ICD-10 codes. Acute RF was defined as N17, chronic RF as N18, and unspecified RF as N19. For each subtype, we repeated the analyses of deaths, age-adjusted mortality rates (AAMRs), and average annual percent change (AAPC) overall and across major demographic and geographic subgroups.
Outcomes and measures
The primary measures were the AAMR per 100,000 population and the AAPC in AAMR. Annual death counts were reported as secondary measures of absolute mortality burden. Age adjustment used the direct method with the year 2000 U.S. standard population, which is the standard approach for comparing mortality over time and across groups with different age structures. 17
For age group analyses, we used age-specific mortality rates per 100,000 population within each age band rather than AAMR, because age adjustment is not applicable within a single age stratum.
Statistical analysis
We quantified long-term change by calculating the percent change in deaths and AAMR between 1999 and 2024 for each subgroup. Temporal trends in AAMR (and age-specific crude rates for age band analyses) were evaluated using joinpoint regression with log-linear models, reporting the annual percent change (APC) for each segment and the AAPC across the full study period. 18 Model selection followed the standard permutation test approach to identify the number of joinpoints, and statistical significance was assessed using two-sided testing with an alpha level of 0.05. 18 Percent change in deaths was calculated as follows: (deaths in 2024 − deaths in 1999) / deaths in 1999] × 100%.
To improve comparability across subgroups, selected mortality rate ratios were calculated by dividing the AAMR of the comparison group by that of the reference group. For age-specific analyses, rate ratios were calculated using age-specific mortality rates within each age stratum rather than AAMR.
Because CDC WONDER suppresses small cell counts to protect confidentiality, suppressed values were not recovered or imputed.
Ethics statement
This study used publicly available, deidentified, aggregate mortality data. Institutional review board approval and informed consent were not required. This study was reported in accordance with the Strengthening the Reporting of Observational studies in Epidemiology (STROBE) guidelines. 19
Results
Overall mortality trends
From 1999 to 2024, 1,192,598 deaths were attributed to RF among adults aged ≥25 years in the U.S. (Table S1). The number of annual deaths increased from 34,456 in 1999 to 53,848 in 2024, corresponding to a 56.28% increase (Table 1; Figure 1). However, the AAMR remained largely stable, changing from 19.57 (95% confidence interval (CI), 19.36–19.78) per 100,000 population in 1999 to 19.05 (95% CI, 18.89–19.22) in 2024. The AAPC was −0.16 (95% CI, −0.62 to 0.30), indicating no statistically significant long-term change in age-adjusted mortality.
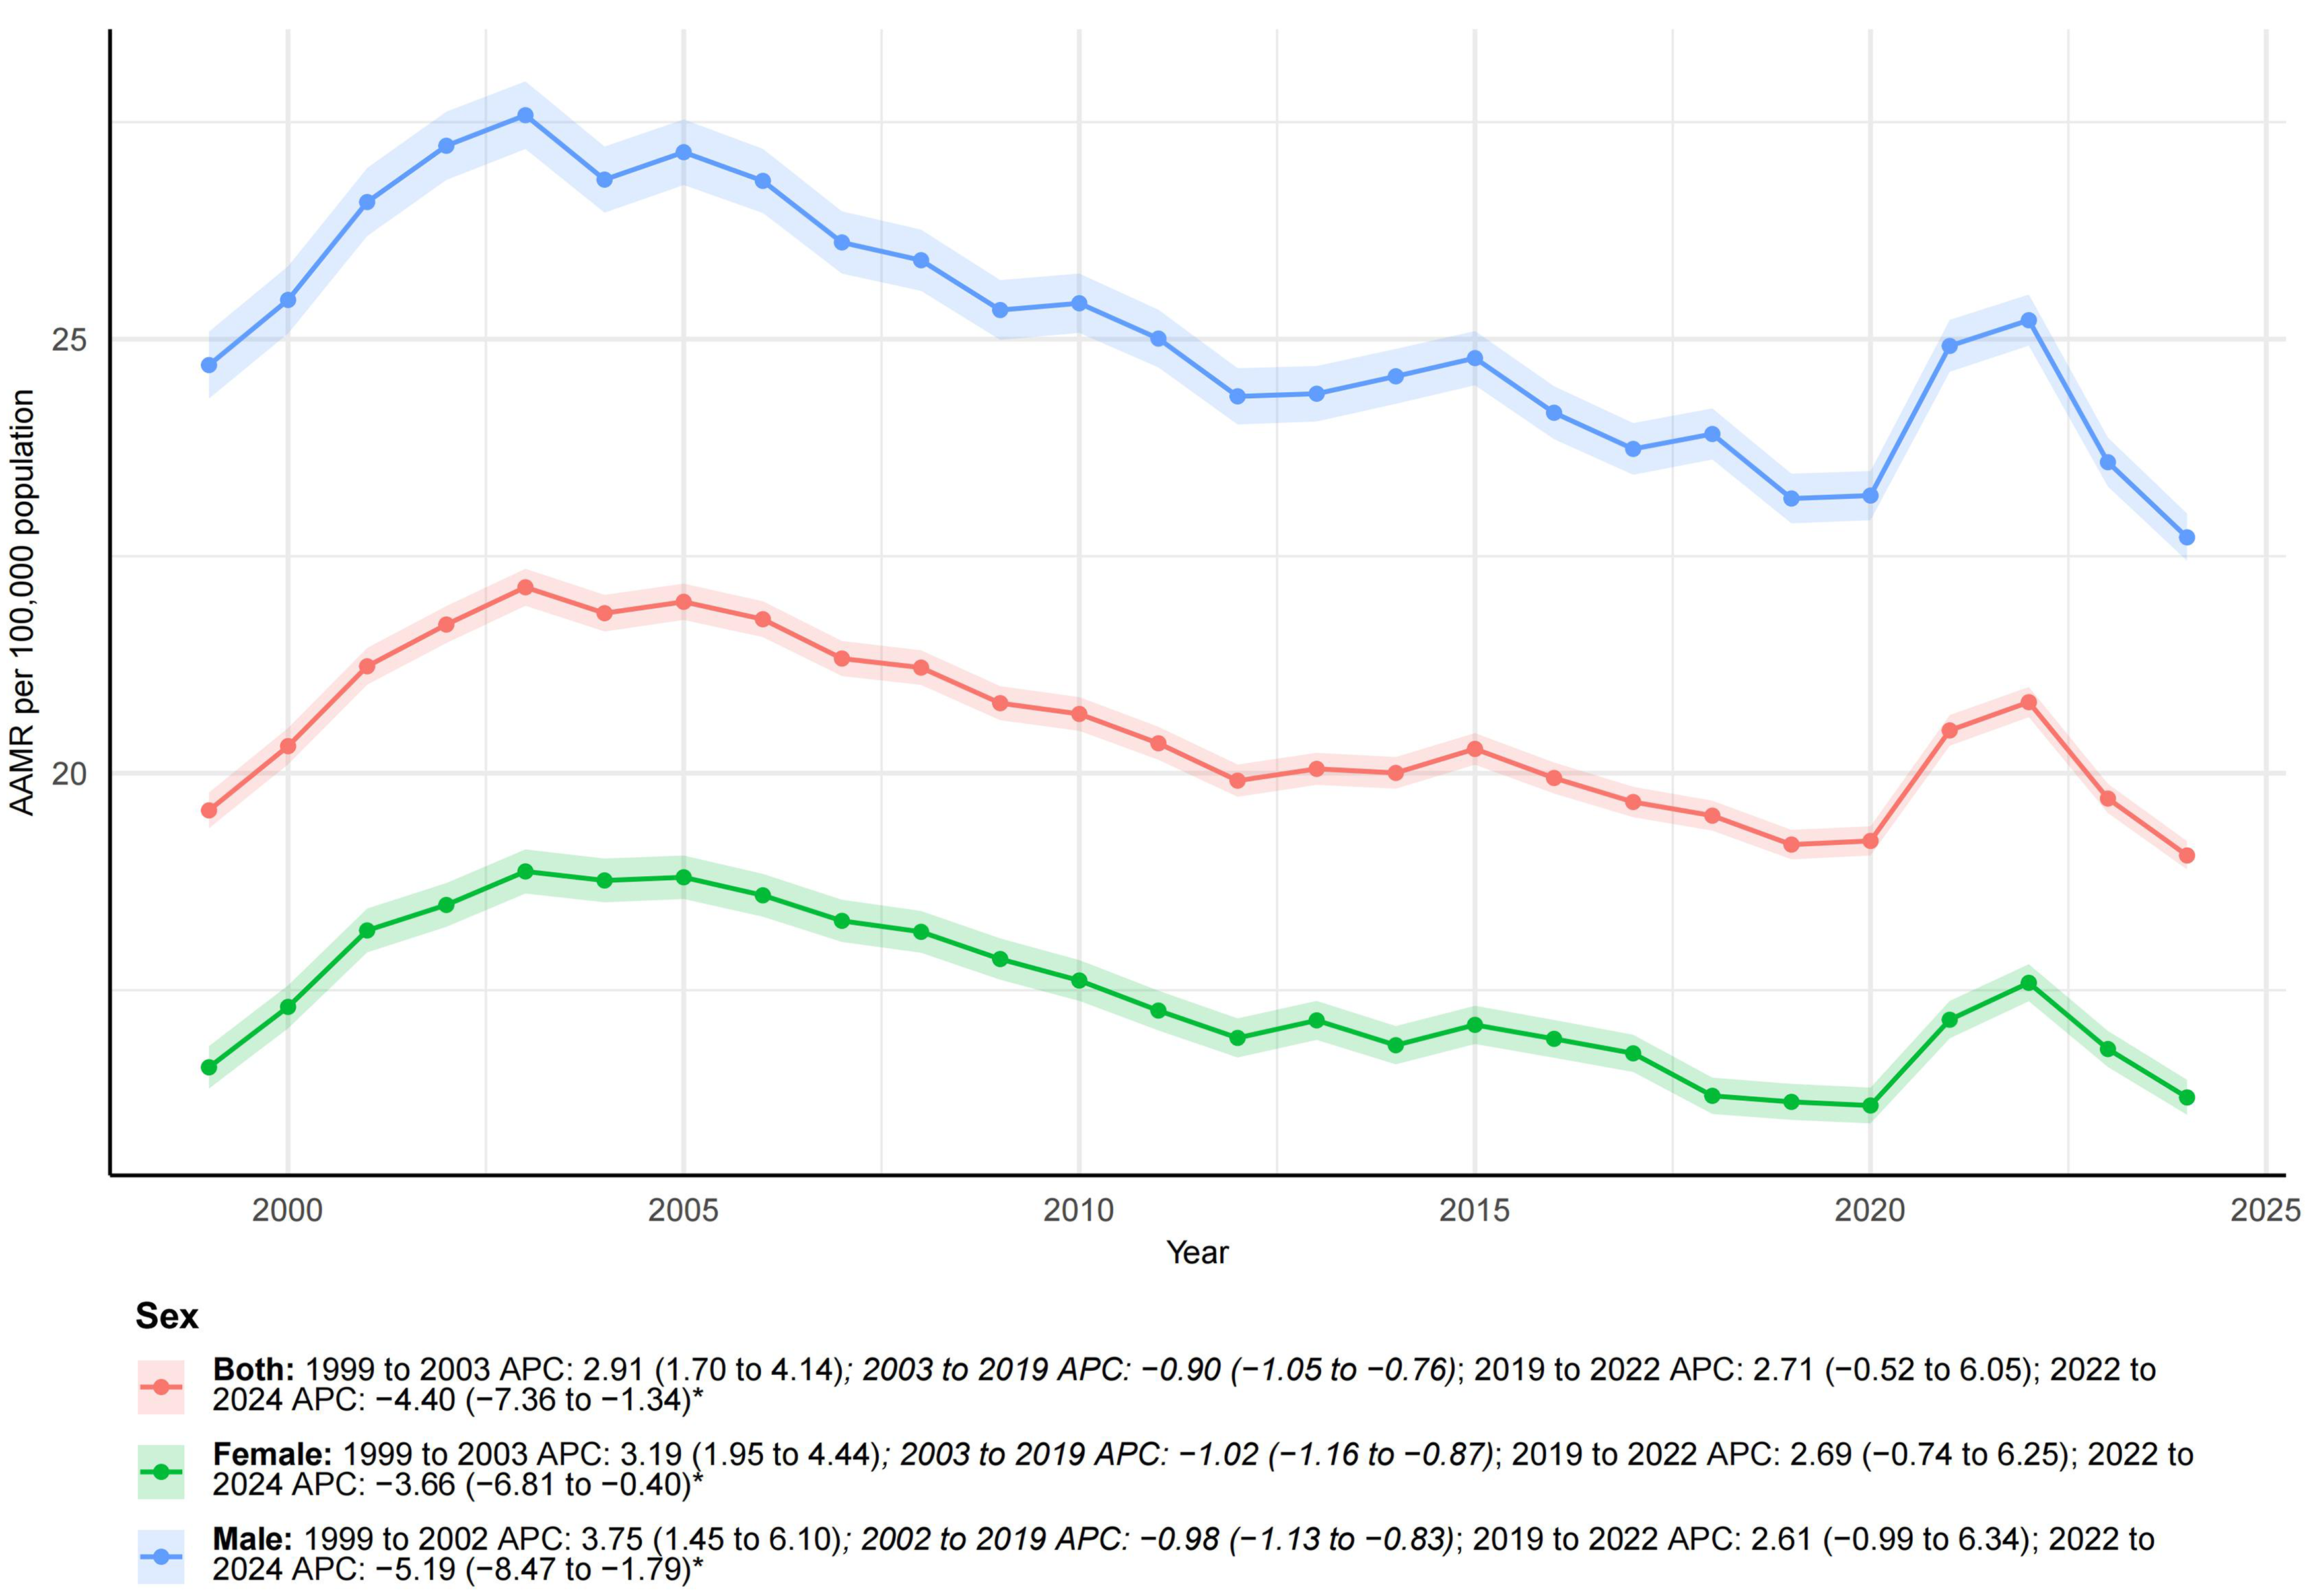
Temporal trends of AAMR for renal failure in the United States overall and by sex.
Renal failure deaths and AAMR in the United States in 1999 and 2024 and their temporal trends.
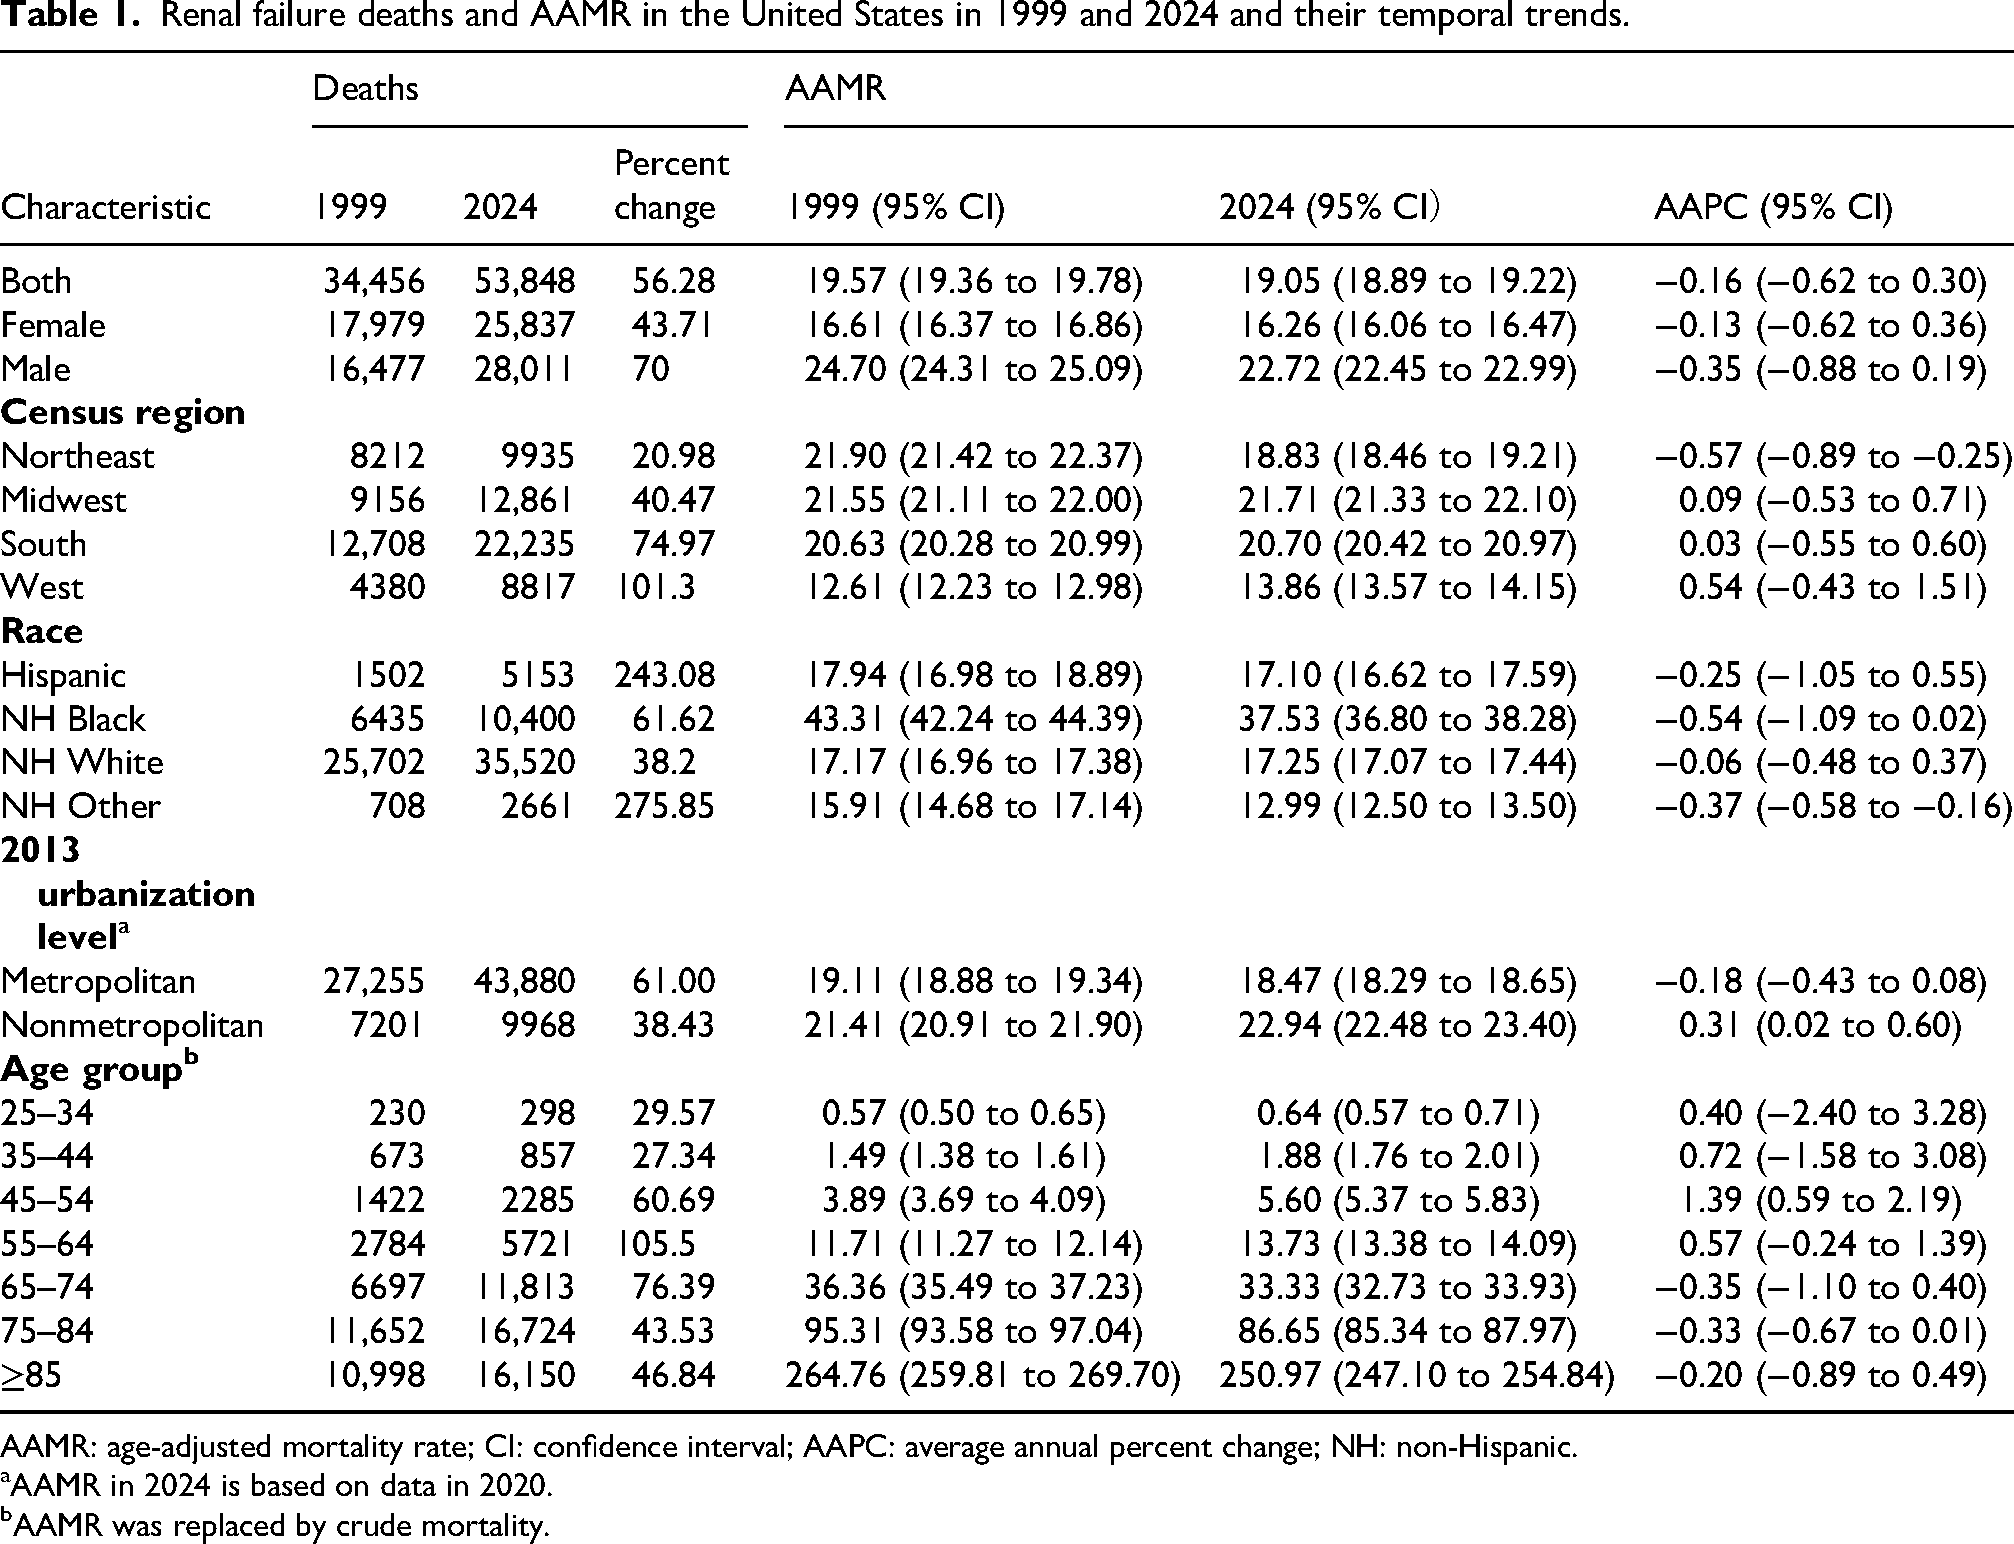
AAMR: age-adjusted mortality rate; CI: confidence interval; AAPC: average annual percent change; NH: non-Hispanic.
AAMR in 2024 is based on data in 2020.
AAMR was replaced by crude mortality.
Joinpoint analysis revealed that RF AAMR increased from 1999 to 2003, declined from 2003 to 2019, increased again during the early COVID-19 period from 2019 to 2022 (APC, 2.71; 95% CI, −0.52 to 6.05), and then decreased significantly from 2022 to 2024 (APC, −4.40; 95% CI, −7.36 to −1.34) (Figure 1).
Subtype analyses by RF category
Subtype analyses revealed divergent trends across RF categories. For acute RF, the number of deaths increased from 4698 in 1999 to 11,108 in 2024, while AAMR increased from 2.67 (95% CI, 2.60–2.75) to 3.94 (95% CI, 3.86–4.01) per 100,000 population. The AAPC was 1.38 (95% CI, −0.25 to 3.04), suggesting a nonsignificant upward trend (Table S2). Cumulatively, acute RF accounted for 211,219 deaths (Table S3).
Chronic RF mortality increased significantly, with deaths rising from 13,933 to 38,092 and AAMR increasing from 7.88 (95% CI, 7.75–8.02) to 13.46 (95% CI, 13.33–13.60). The AAPC was 2.17 (95% CI, 1.56–2.77) (Table S4). Cumulatively, chronic RF accounted for 667,029 deaths (Table S5). In contrast, unspecified RF declined markedly, with the number of deaths decreasing from 15,825 to 4648 and AAMR decreasing from 9.00 (95% CI, 8.86–9.14) to 1.65 (95% CI, 1.61–1.70). The AAPC was −6.61 (95% CI, −7.23 to −5.99) (Table S6), and cumulative deaths were 314,350 (Table S7).
Trends by sex
In 2024, males had a higher AAMR than females (22.72 vs. 16.26 per 100,000 population), corresponding to a male to female mortality rate ratio of 1.40 (Table 1; Figure 1). From 1999 to 2024, male AAMR decreased from 24.70 (95% CI, 24.31–25.09) to 22.72 (95% CI, 22.45–22.99), with an AAPC of −0.35 (95% CI, −0.88 to 0.19). Female AAMR changed from 16.61 (95% CI, 16.37–16.86) to 16.26 (95% CI, 16.06–16.47), with an AAPC of −0.13 (95% CI, −0.62 to 0.36). Thus, males consistently exhibited higher mortality rates, but neither sex showed a significant long-term change in AAMR.
Trends by age group
RF mortality rates were strongly age graded. In 2024, the age-specific mortality rate was highest among adults aged ≥85 years (250.97 per 100,000 population), followed by those aged 75–84 years (86.65), 65–74 years (33.33), 55–64 years (13.73), 45–54 years (5.60), 35–44 years (1.88), and 25–34 years (0.64) (Table 1; Figure 2).
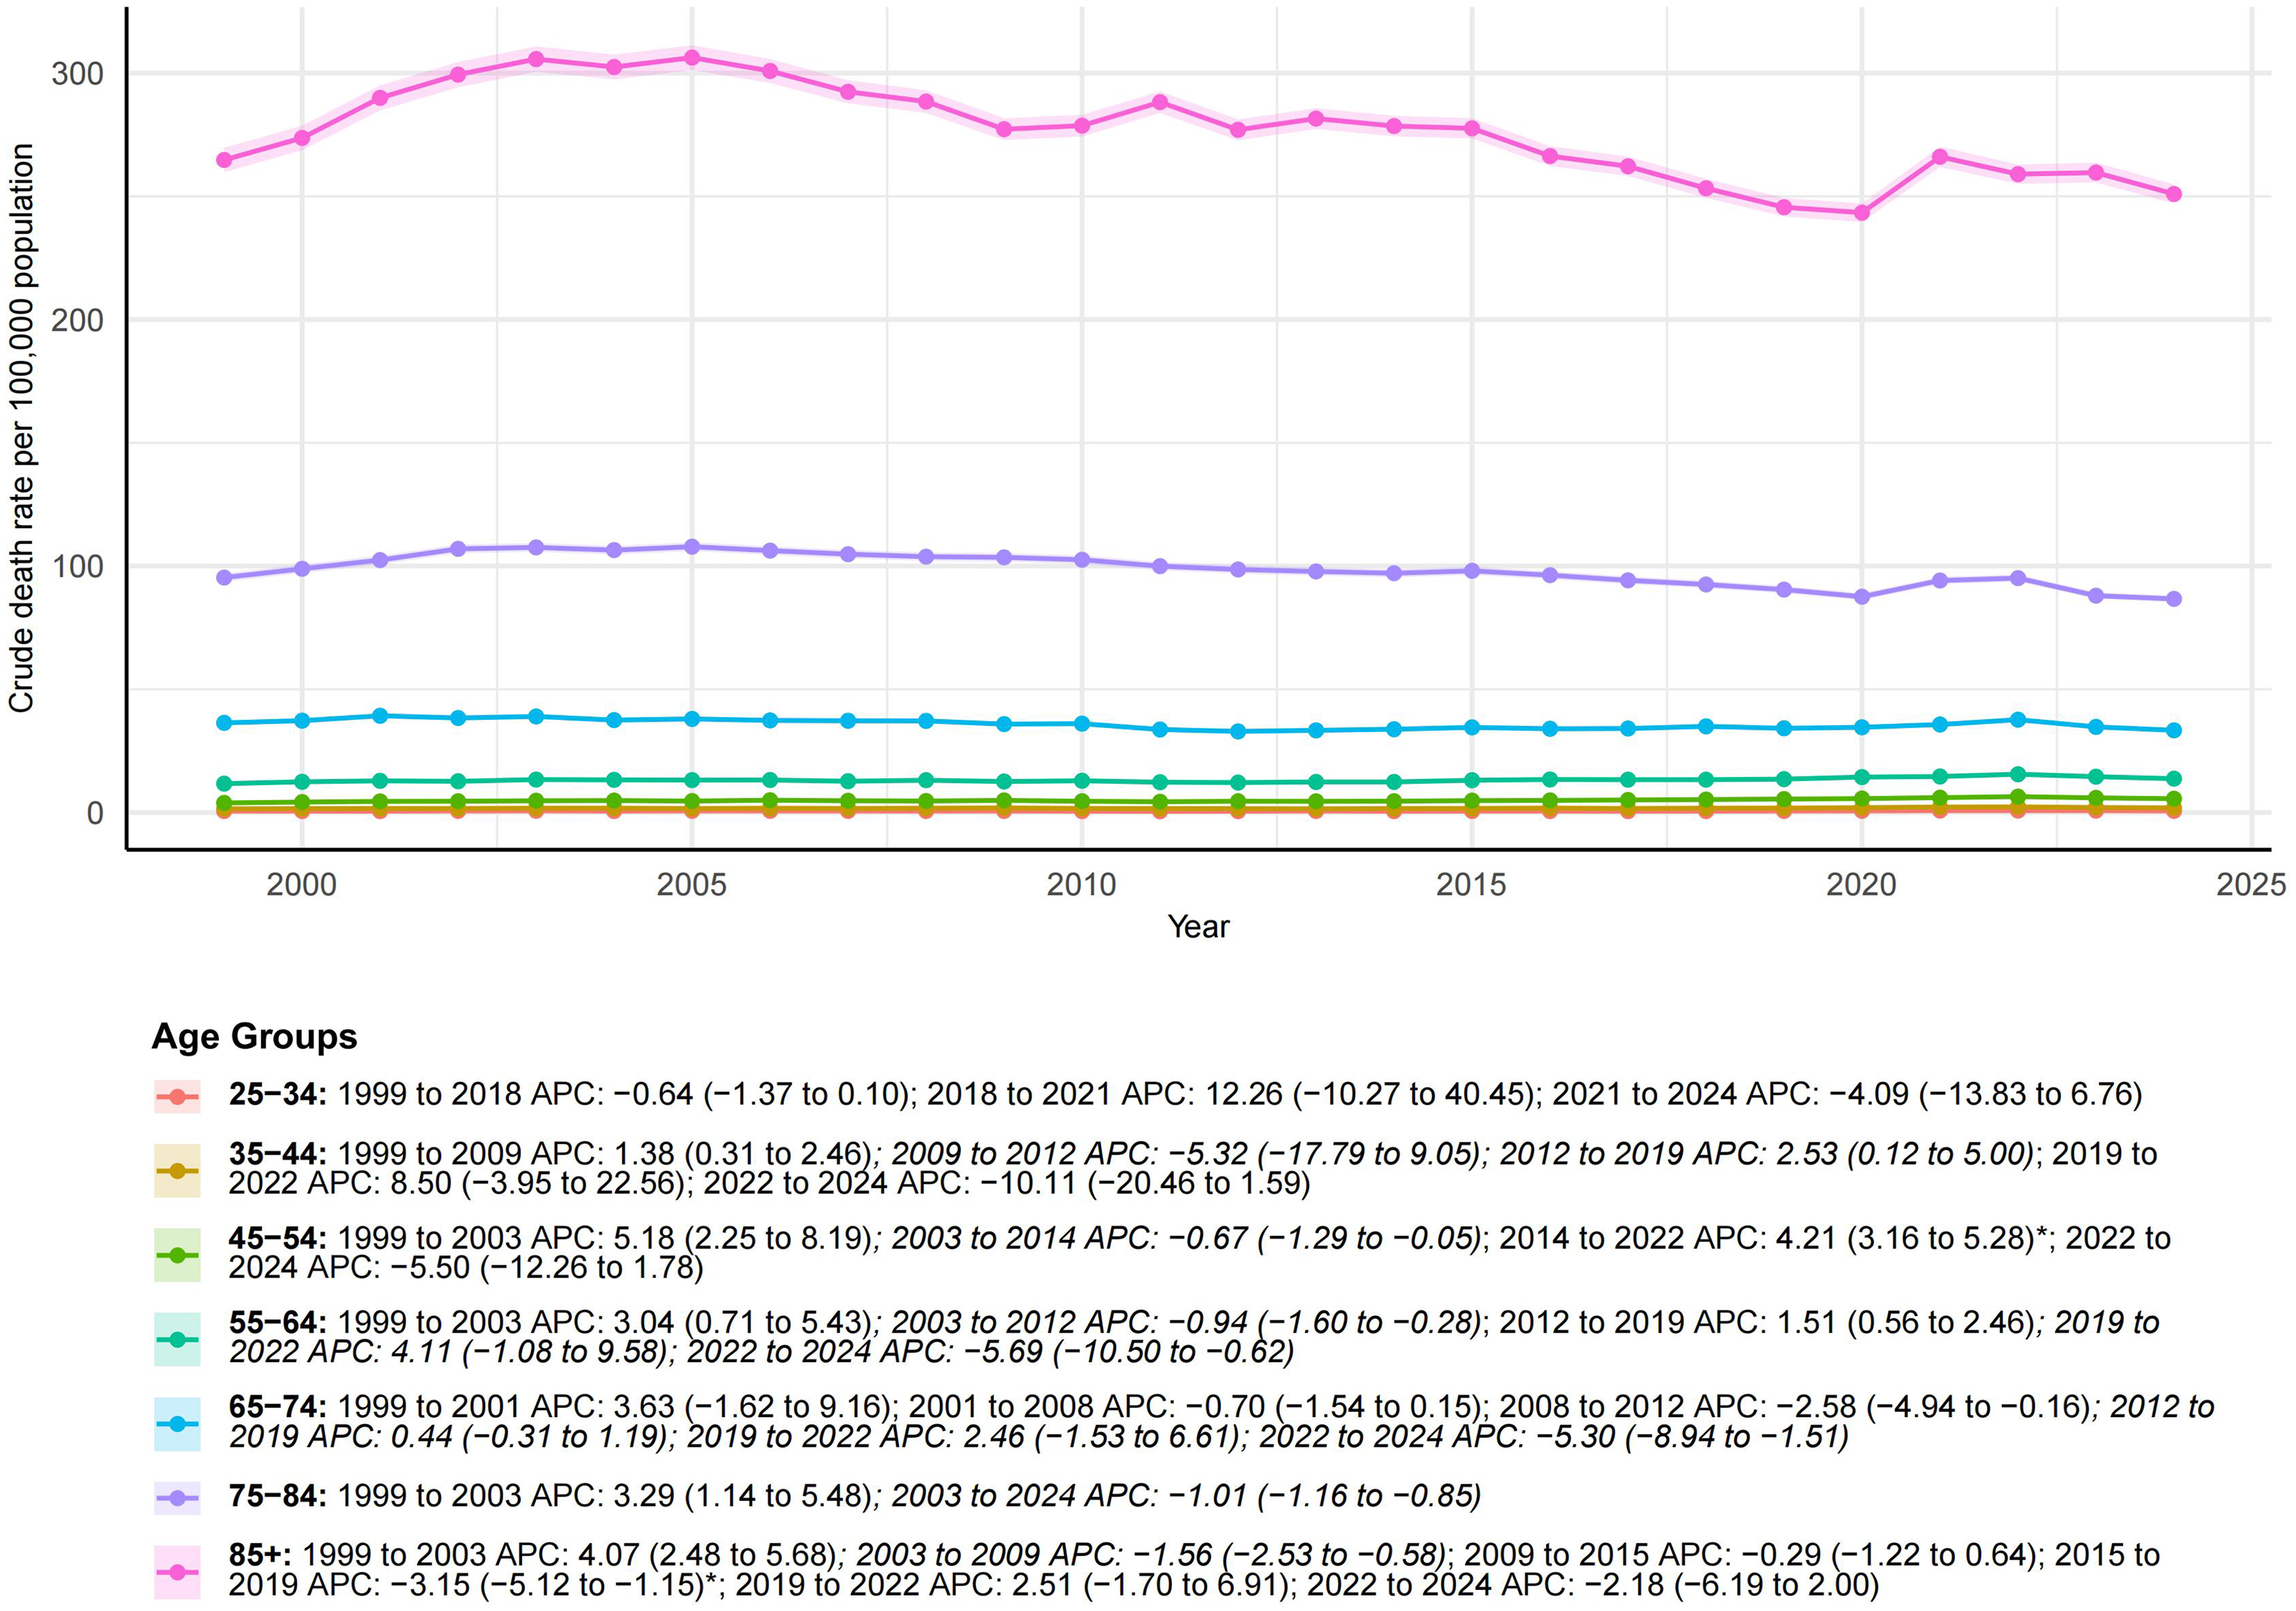
Temporal trends of crude death rates for renal failure in the United States by age group.
Temporal trends varied across age groups. The 45–54 year group demonstrated a significant increase, with the mortality rate rising from 3.89 in 1999 to 5.60 in 2024 and an AAPC of 1.39 (95% CI, 0.59–2.19). Positive but nonsignificant AAPC estimates were observed among adults aged 25–34 years, 35–44 years, and 55–64 years. Older age groups showed stable or slightly declining long-term trends, including adults aged 65–74 years (AAPC, −0.35; 95% CI, −1.10 to 0.40), 75–84 years (AAPC, −0.33; 95% CI, −0.67 to 0.01), and ≥85 years (AAPC, −0.20; 95% CI, −0.89 to 0.49).
Trends by race and ethnicity
In 2024, NH Black individuals had the highest AAMR at 37.53 per 100,000 population, followed by NH White individuals at 17.25, Hispanic individuals at 17.10, and NH Other individuals at 12.99 (Table 1; Figure 3). The AAMR in NH Black individuals was 2.18 times that in NH White individuals.

Temporal trends of AAMR for renal failure in the United States by race.
Among NH Black individuals, AAMR decreased from 43.31 (95% CI, 42.24–44.39) in 1999 to 37.53 (95% CI, 36.80–38.28) in 2024, with an AAPC of −0.54 (95% CI, −1.09 to 0.02). AAMR remained largely stable among NH White individuals (17.17–17.25; AAPC, −0.06; 95% CI, −0.48 to 0.37) and Hispanic individuals (17.94–17.10; AAPC, −0.25; 95% CI, −1.05 to 0.55). NH Other individuals showed a significant decline in AAMR, from 15.91 to 12.99, with an AAPC of −0.37 (95% CI, −0.58 to −0.16).
Trends by census region
In 2024, the Midwest and South had relatively high AAMRs at 21.71 and 20.70 per 100,000 population, respectively, followed by the Northeast (18.83) and West (13.86) (Table 1; Figure 4). Compared with the West, the 2024 AAMR was 1.57 times higher in the Midwest and 1.49 times higher in the South.

Temporal trends of AAMR for renal failure in the United States by census regions.
The Northeast showed a significant long-term decline, with AAMR decreasing from 21.90 in 1999 to 18.83 in 2024 and an AAPC of −0.57 (95% CI, −0.89 to −0.25). The Midwest and South showed stable long-term trends, with AAPCs of 0.09 (95% CI, −0.53 to 0.71) and 0.03 (95% CI, −0.55 to 0.60), respectively. The AAMR in the West increased from 12.61 to 13.86, but the AAPC was not statistically significant (0.54; 95% CI, −0.43 to 1.51).
Trends by urbanization level
Analyses by urbanization level were interpreted according to the years available for the 2013 National Center for Health Statistics Urban Rural Classification Scheme in CDC WONDER. Within the available period, nonmetropolitan areas had consistently higher RF mortality than metropolitan areas (Table 1; Figure 5). At the end of the available period, the AAMR was 22.94 per 100,000 population in nonmetropolitan areas and 18.47 in metropolitan areas, corresponding to a rate ratio of 1.24.

Temporal trends of AAMR for renal failure in the United States by urbanization level.
Metropolitan areas had an AAPC of −0.18 (95% CI, −0.43 to 0.08), whereas nonmetropolitan areas had a significant positive AAPC of 0.31 (95% CI, 0.02–0.60), suggesting a less favorable temporal pattern in nonmetropolitan populations.
State-level mortality burden and trends
State-level comparisons were interpreted primarily using AAMR and AAPC rather than cumulative deaths, because crude death counts are strongly influenced by state population size. In 2024, AAMRs varied substantially across states. The highest AAMRs were observed in Arkansas (32.05 per 100,000 population), Kentucky (31.53), Missouri (30.49), Louisiana (30.21), and Mississippi (29.61), whereas lower AAMRs were observed in states such as Vermont, Washington, Oregon, Minnesota, and South Dakota (Table S8; Figure 6).
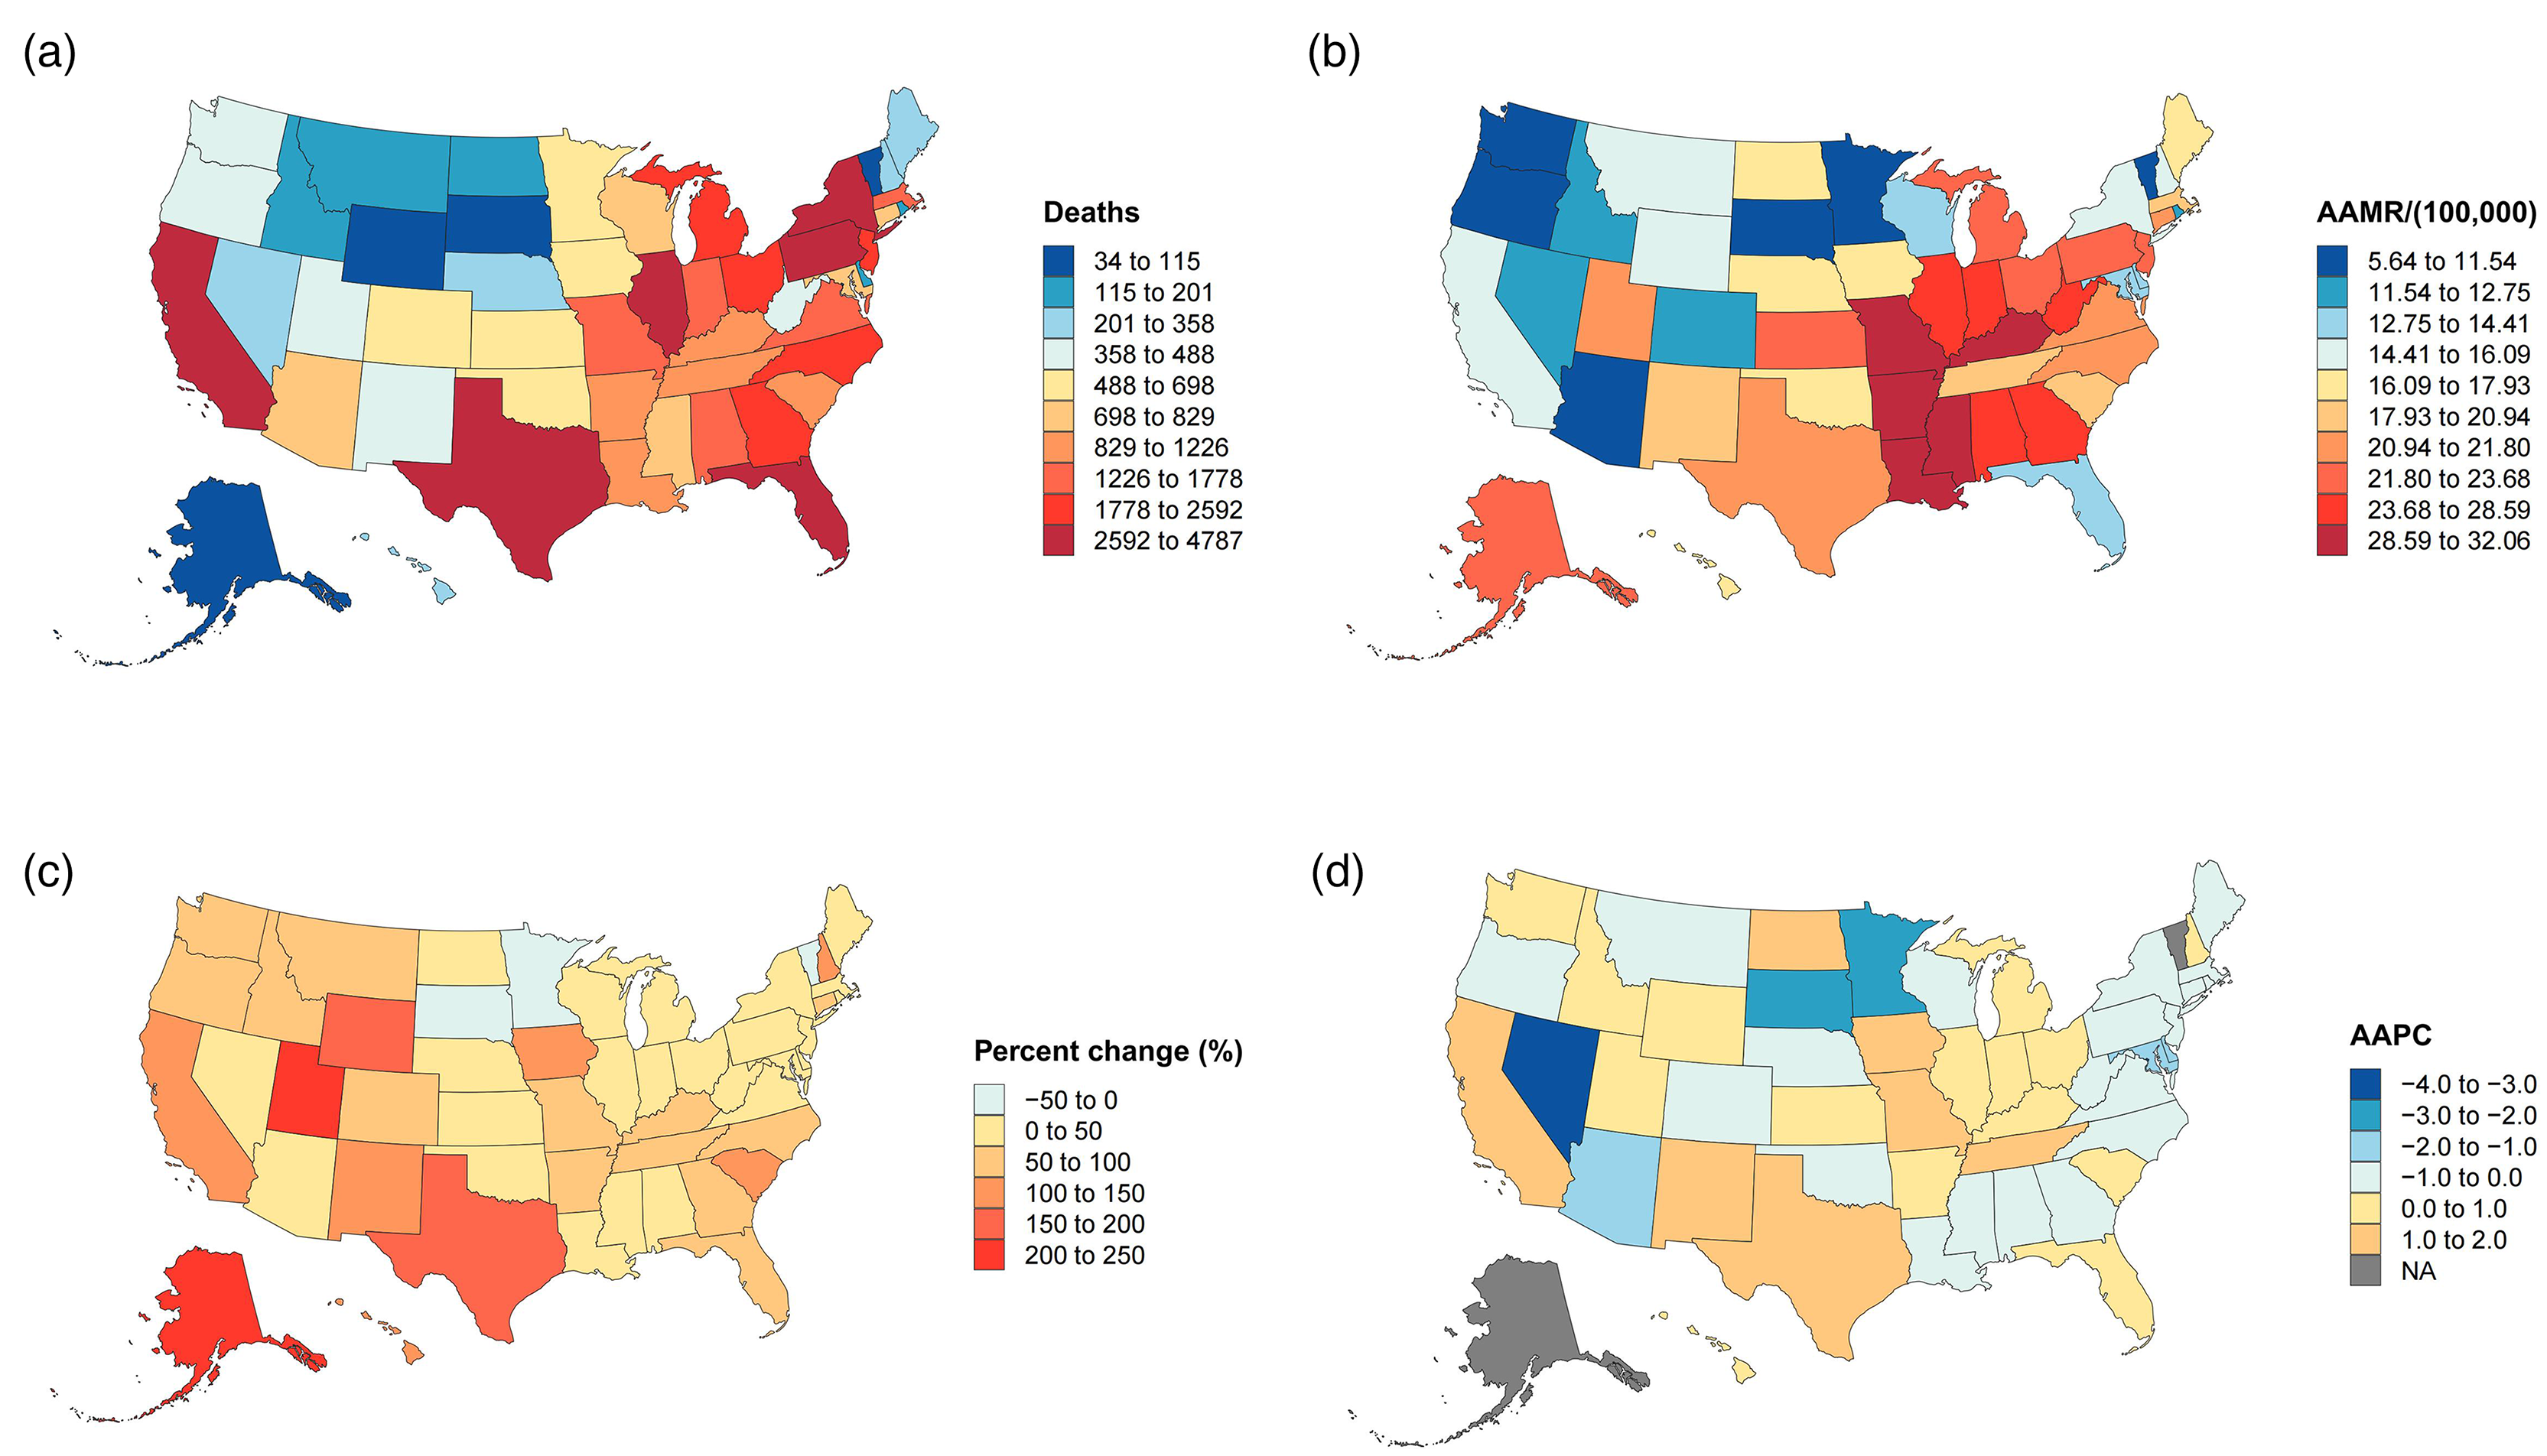
Temporal trends of AAMR for renal failure in the United States by state level.
Long-term trends also varied by state. Significant increases in AAMR were observed in several states, including California, Iowa, Kentucky, Missouri, New Mexico, Tennessee, and Texas. In contrast, significant decreases were observed in Arizona, Delaware, District of Columbia, Minnesota, Mississippi, Nevada, New York, South Dakota, and Virginia. These findings indicate heterogeneous temporal patterns that were not explained solely by state population size (Table S8; Figure 6).
Discussion
In this nationwide analysis updated through 2024, deaths attributable to RF increased substantially, whereas the overall AAMR remained largely stable. This contrast is important. The rise in deaths from 34,456 in 1999 to 53,848 in 2024 likely reflects population growth, aging, and a larger population living with advanced kidney disease, rather than a proportional increase in standardized mortality risk. The overall AAMR changed only modestly, from 19.57 to 19.05 per 100,000 population, with an AAPC of −0.16. Therefore, the central finding of this study is not simply that more deaths occurred but that the standardized mortality burden has not meaningfully declined despite advances in kidney care.
When RF was separated into acute RF, chronic RF, and unspecified RF, the trajectories were clearly different. Chronic RF mortality increased significantly, with the AAMR rising from 7.88 in 1999 to 13.46 in 2024 and an AAPC of 2.17. Although acute RF also demonstrated an upward pattern, the AAPC was not statistically significant. In contrast, unspecified RF declined sharply, with the AAMR decreasing from 9.00 to 1.65 and an AAPC of −6.61. These opposing patterns indicate that the stable overall AAMR should not be interpreted as uniform stability across RF categories. Rather, the rise in chronic RF mortality appears to have been partly offset by the decline in unspecified RF. The significant increase in chronic RF mortality deserves particular attention. It may reflect the growing number of adults living with diabetes, hypertension, obesity, and metabolic syndrome, which are major drivers of CKD onset and progression. Current KDIGO guidance emphasizes risk stratification, blood pressure control, diabetes management, and kidney protective therapies to delay CKD progression and reduce complications.20,21 Systematic reviews also support the association of metabolic syndrome and obesity with incident CKD and disease progression.22,23 At the same time, acute kidney injury is associated with increased long-term risks of CKD, ESRD, and death, providing a plausible pathway through which acute insults may contribute to later RF mortality. 24 Thus, stable overall AAMR does not necessarily mean that the clinical burden of kidney disease has improved across all domains.
Sex and age patterns demonstrated persistent differences rather than uniformly worsening trends. Males consistently exhibited higher AAMRs than females, with a male to female rate ratio of 1.40 in 2024, but neither sex showed a statistically significant long-term AAPC. This suggests a stable excess burden among males rather than a rapidly widening sex gap. Age-specific mortality rates were highest among older adults, but the most notable temporal increase occurred among adults aged 45–54 years. This finding suggests that RF mortality is not only a late life issue and that midlife cardiometabolic risk control may be important for reducing future kidney-related mortality.
Racial and ethnic differences remained substantial after age adjustment. NH Black individuals continued to have the highest AAMRs in 2024, more than twice that of NH White individuals. Although the AAPC among NH Black individuals suggested a modest decline rather than an increase, the persistently high absolute rate indicates that the disparity has not narrowed enough in public health terms. This persistent excess burden may reflect differences in cardiometabolic risk burden, socioeconomic disadvantage, delayed CKD detection, and unequal access to predialysis nephrology care and longitudinal kidney disease management.25–27
Geographic heterogeneity across census regions and the urban and rural gradient in mortality are also consistent with prior evidence that kidney disease burden, comorbid risk factor prevalence, and care access vary substantially by place. Studies of U.S. kidney outcomes have documented meaningful regional differences in CKD and ESRD measures, supporting the concept that place-based exposures and health system organization contribute to heterogeneous trajectories.28,29 The higher mortality rate in nonmetropolitan settings by the end of the available urbanization classification window is concordant with reports that rural residence can be associated with worse outcomes among patients receiving dialysis, potentially reflecting longer travel distances, workforce shortages in nephrology, fewer vascular access resources, and fragmented specialty follow up. 30 These findings underscore the value of place targeted strategies that pair cardiometabolic prevention with strengthened CKD detection and longitudinal management infrastructure in areas with persistent excess mortality.
Although the principal focus is long-term change, the pattern of elevated mortality in the early pandemic years warrants brief contextualization within the kidney literature. COVID-19 has been linked to a high incidence of acute kidney injury among hospitalized patients and to worsened outcomes in individuals with advanced kidney disease.31,32 In parallel, U.S. dialysis and transplant populations experienced measurable excess mortality during the pandemic period in multiple settings, indicating that short term shocks can temporarily alter broader long-term mortality trends.33,34 Importantly, in this study the pandemic signal is interpreted as a time-limited perturbation within a broader multi-decade trend rather than as a standalone explanatory framework.
Several limitations should be noted. First, this study relied on RF recorded as the underlying cause of death on death certificates, which may underestimate the broader mortality burden related to kidney disease. Patients with CKD, ESRD, or acute kidney injury may die from cardiovascular disease, infection, diabetes related complications, sepsis, or other acute events, and these conditions may be recorded as the underlying cause instead of RF. Previous studies have shown poor agreement between death certificates and kidney disease registry data in cause of death classification among patients with ESRD or those receiving dialysis.35,36 More recent U.S. evidence has also shown limited agreement in cause of death classification between the U.S. Renal Data System and integrated health care system records among patients with ESRD. 37 Therefore, our findings should be interpreted as deaths certified as being due to RF, rather than all deaths occurring among people with kidney disease.
Second, changes in death certification and ICD coding practices may have influenced temporal trends. The marked decline in unspecified RF, together with the increase in chronic RF, may partly reflect improved diagnostic specificity or changes in code selection. Because CDC WONDER provides aggregate data, we could not determine whether these subtype shifts reflected true changes in disease burden, diagnostic recognition, or certification practice.
Conclusions
From 1999 to 2024, deaths attributed to RF increased among adults in the U.S.; however, the overall AAMR remained largely stable. This apparent stability masked divergent subtype trends, including a significant increase in chronic RF mortality and a marked decline in unspecified RF mortality. Persistent disparities were observed by sex, race and ethnicity, age, geography, and urbanization level, with particularly high standardized mortality rates among males, NH Black individuals, older adults, and nonmetropolitan populations. These findings support earlier CKD detection, stronger cardiometabolic risk control, improved access to nephrology care, and targeted interventions in high burden communities.
Supplemental Material
sj-xlsx-1-imr-10.1177_03000605261463635 - Supplemental material for Long-term mortality trends and disparities in renal failure across the United States, 1999 to 2024: A nationwide population-based ecological time-trend study
Supplemental material, sj-xlsx-1-imr-10.1177_03000605261463635 for Long-term mortality trends and disparities in renal failure across the United States, 1999 to 2024: A nationwide population-based ecological time-trend study by Yu Wang and Xiaofei Leng in Journal of International Medical Research
Footnotes
Ethics approval and consent to participate
Ethical approval and informed consent were not required because this study used publicly available, de-identified, aggregate data.
Authors contributions
Funding
The authors received no financial support for the research, authorship, and/or publication of this article.
Declaration of conflicting interests
The authors declared no potential conflicts of interest with respect to the research, authorship, and/or publication of this article.
Data availability statement
The data used in this study were obtained from the publicly available CDC WONDER database. Further inquiries can be directed to the corresponding author.
Supplemental material
Supplemental material for this article is available online.
References
Supplementary Material
Please find the following supplemental material available below.
For Open Access articles published under a Creative Commons License, all supplemental material carries the same license as the article it is associated with.
For non-Open Access articles published, all supplemental material carries a non-exclusive license, and permission requests for re-use of supplemental material or any part of supplemental material shall be sent directly to the copyright owner as specified in the copyright notice associated with the article.