






Abstract
Objective
Cardiometabolic multimorbidity is a major driver of chronic disease burden in aging Chinese populations. Conventional single disease risk scores cannot reliably identify those at high cardiometabolic multimorbidity risk, which stems from interconnected metabolic and cardiovascular dysregulation. The stress–hyperglycemia ratio, a marker of acute glycemic dysregulation independent of glycosylated hemoglobin, predicts individual cardiometabolic events; however, to our knowledge, its longitudinal association with cardiometabolic multimorbidity and modification by insulin resistance remain uncharacterized.
Methods
We performed a 9-year prospective analysis of the data from 4019 cardiometabolic multimorbidity–free adults aged ≥45 years enrolled in the nationally representative China Health and Retirement Longitudinal Study. Incident cardiometabolic multimorbidity was defined as new-onset of ≥2 cardiometabolic disorders (hypertension, diabetes, coronary heart disease, and stroke). We assessed baseline stress–hyperglycemia ratio, identified stress–hyperglycemia ratio trajectories using latent class growth modeling, constructed stress–metabolism synergy indices, and evaluated associations with incident cardiometabolic multimorbidity using multivariable Cox regression, predictive performance testing, and mediation analysis.
Results
Each 1-SD increase in the baseline stress–hyperglycemia ratio was associated with 13% higher fully adjusted cardiometabolic multimorbidity risk (hazard ratio = 1.13, 95% confidence interval = 1.03–1.24, p = 0.013) in a linear dose–response pattern. The moderate-increasing stress–hyperglycemia ratio trajectory conferred an approximately twofold higher fully adjusted cardiometabolic multimorbidity risk versus the low-stable trajectory (hazard ratio = 2.04, 95% confidence interval = 1.01–4.15, p = 0.048). The stress–hyperglycemia ratio–estimated glucose disposal rate index showed the most pronounced association and improved discriminative performance (concordance index = 0.70), with potential mediators, including accelerated biological aging, glycemic dyscontrol, and atherogenic dyslipidemia.
Conclusion
Baseline stress–hyperglycemia ratio, its longitudinal trajectories, and the stress–hyperglycemia ratio–estimated glucose disposal rate index demonstrate a modest yet significant incremental predictive value for incident cardiometabolic multimorbidity among middle-aged and older Chinese adults, providing a potential, low-cost framework for cardiometabolic multimorbidity risk stratification in primary care that requires further external validation.
Keywords
Introduction
Cardiometabolic multimorbidity (CMM), defined as the concurrent presence of two or more cardiovascular and metabolic disorders in a single individual, has emerged as a defining hallmark and leading driver of the global chronic disease epidemic. 1 Affecting over one in three middle-aged and older adults worldwide, CMM portends a poor prognosis and imposes a substantial burden on individuals and health systems.2,3 In China, demographic shifts and rising disease prevalence have made CMM a focus of public health intervention. 4
Conventional risk scores, although useful for single diseases, fail to reliably predict CMM risk, a condition involving the interplay of multiple physiological systems.5,6 Progress therefore requires a shift in focus toward biomarkers that reflect integrative metabolic regulation rather than isolated risk factors. Emerging evidence highlights the stress–hyperglycemia ratio (SHR) as one such candidate. The SHR quantifies the discrepancy between an acute fasting glucose level and the glucose concentration expected from a patient's average long-term control (glycosylated hemoglobin (HbA1c)). 7 Thus, it specifically captures acute dysregulation in the glucose metabolism. This is pathophysiologically relevant as acute glucose fluctuations are potent inducers of endothelial dysfunction and inflammation. 8 Accordingly, the SHR predicts various cardiometabolic events, even in individuals without diabetes. 9 However, its role in predicting CMM—an integrated condition involving multiple cardiometabolic disorders—has not been explored in population-based prospective studies.
Despite this promise, critical questions persist. No prospective link between SHR and CMM in population-based studies has been established. Furthermore, the clinical interpretation of SHR has relied almost exclusively on single measurements, neglecting the information contained in its long-term trajectory. Most fundamentally, we posit that the cardiovascular risk conferred by a high SHR is not uniform; however, it is critically modulated by the background metabolic status, particularly insulin resistance. Testing this “stress–metabolism synergy” hypothesis may provide important insights into CMM pathogenesis.
Leveraging the prospective, nationally representative China Health and Retirement Longitudinal Study (CHARLS) cohort, this study was conducted with the following objectives: (a) determine the association of baseline SHR with CMM onset and its dose–response shape; (b) model long-term SHR trajectories and their relationship with CMM risk; (c) develop a composite metric reflecting stress–metabolism synergy and evaluate its incremental predictive value compared with the SHR; and (d) investigate potential biological mediators. By examining static, dynamic, and interactive dimensions of metabolic stress, our work aimed to provide a simple, actionable framework for CMM risk stratification in primary care settings.
Methods
Study design and population
This prospective cohort study used data from the CHARLS, a nationally representative prospective cohort of community-dwelling adults aged ≥45 years in China. The CHARLS employs a multistage, stratified sampling design. We analyzed data from five waves (2011 (baseline), 2013, 2015, 2018, and 2020), with a median follow-up duration of 9.0 years (from baseline to Wave 5 in 2020). Fasting blood samples were collected at baseline and in 2015 (Wave 3). The study protocol was approved by the Peking University Institutional Review Board (IRB, IRB00001052-11015), and all participants provided written informed consent. 10
Participants were eligible if their CMM status could be determined at baseline (Wave 1, 2011). We excluded individuals with the following: (a) missing data for baseline CMM assessment; (b) prevalent CMM at baseline; (c) prevalent cancer at baseline; (d) incident CMM diagnosed between Waves 1 and 3; (e) incomplete data for key cardiometabolic and aging-related indices (SHR, estimated glucose disposal rate (eGDR), light biological age (Light-BioAge), and atherogenic index of plasma (AIP)) at Wave 1 or 3; and (f) loss to follow-up or missing outcome data at Wave 5. Figure 1 details the screening process. The final analytical sample comprised 4019 individuals.
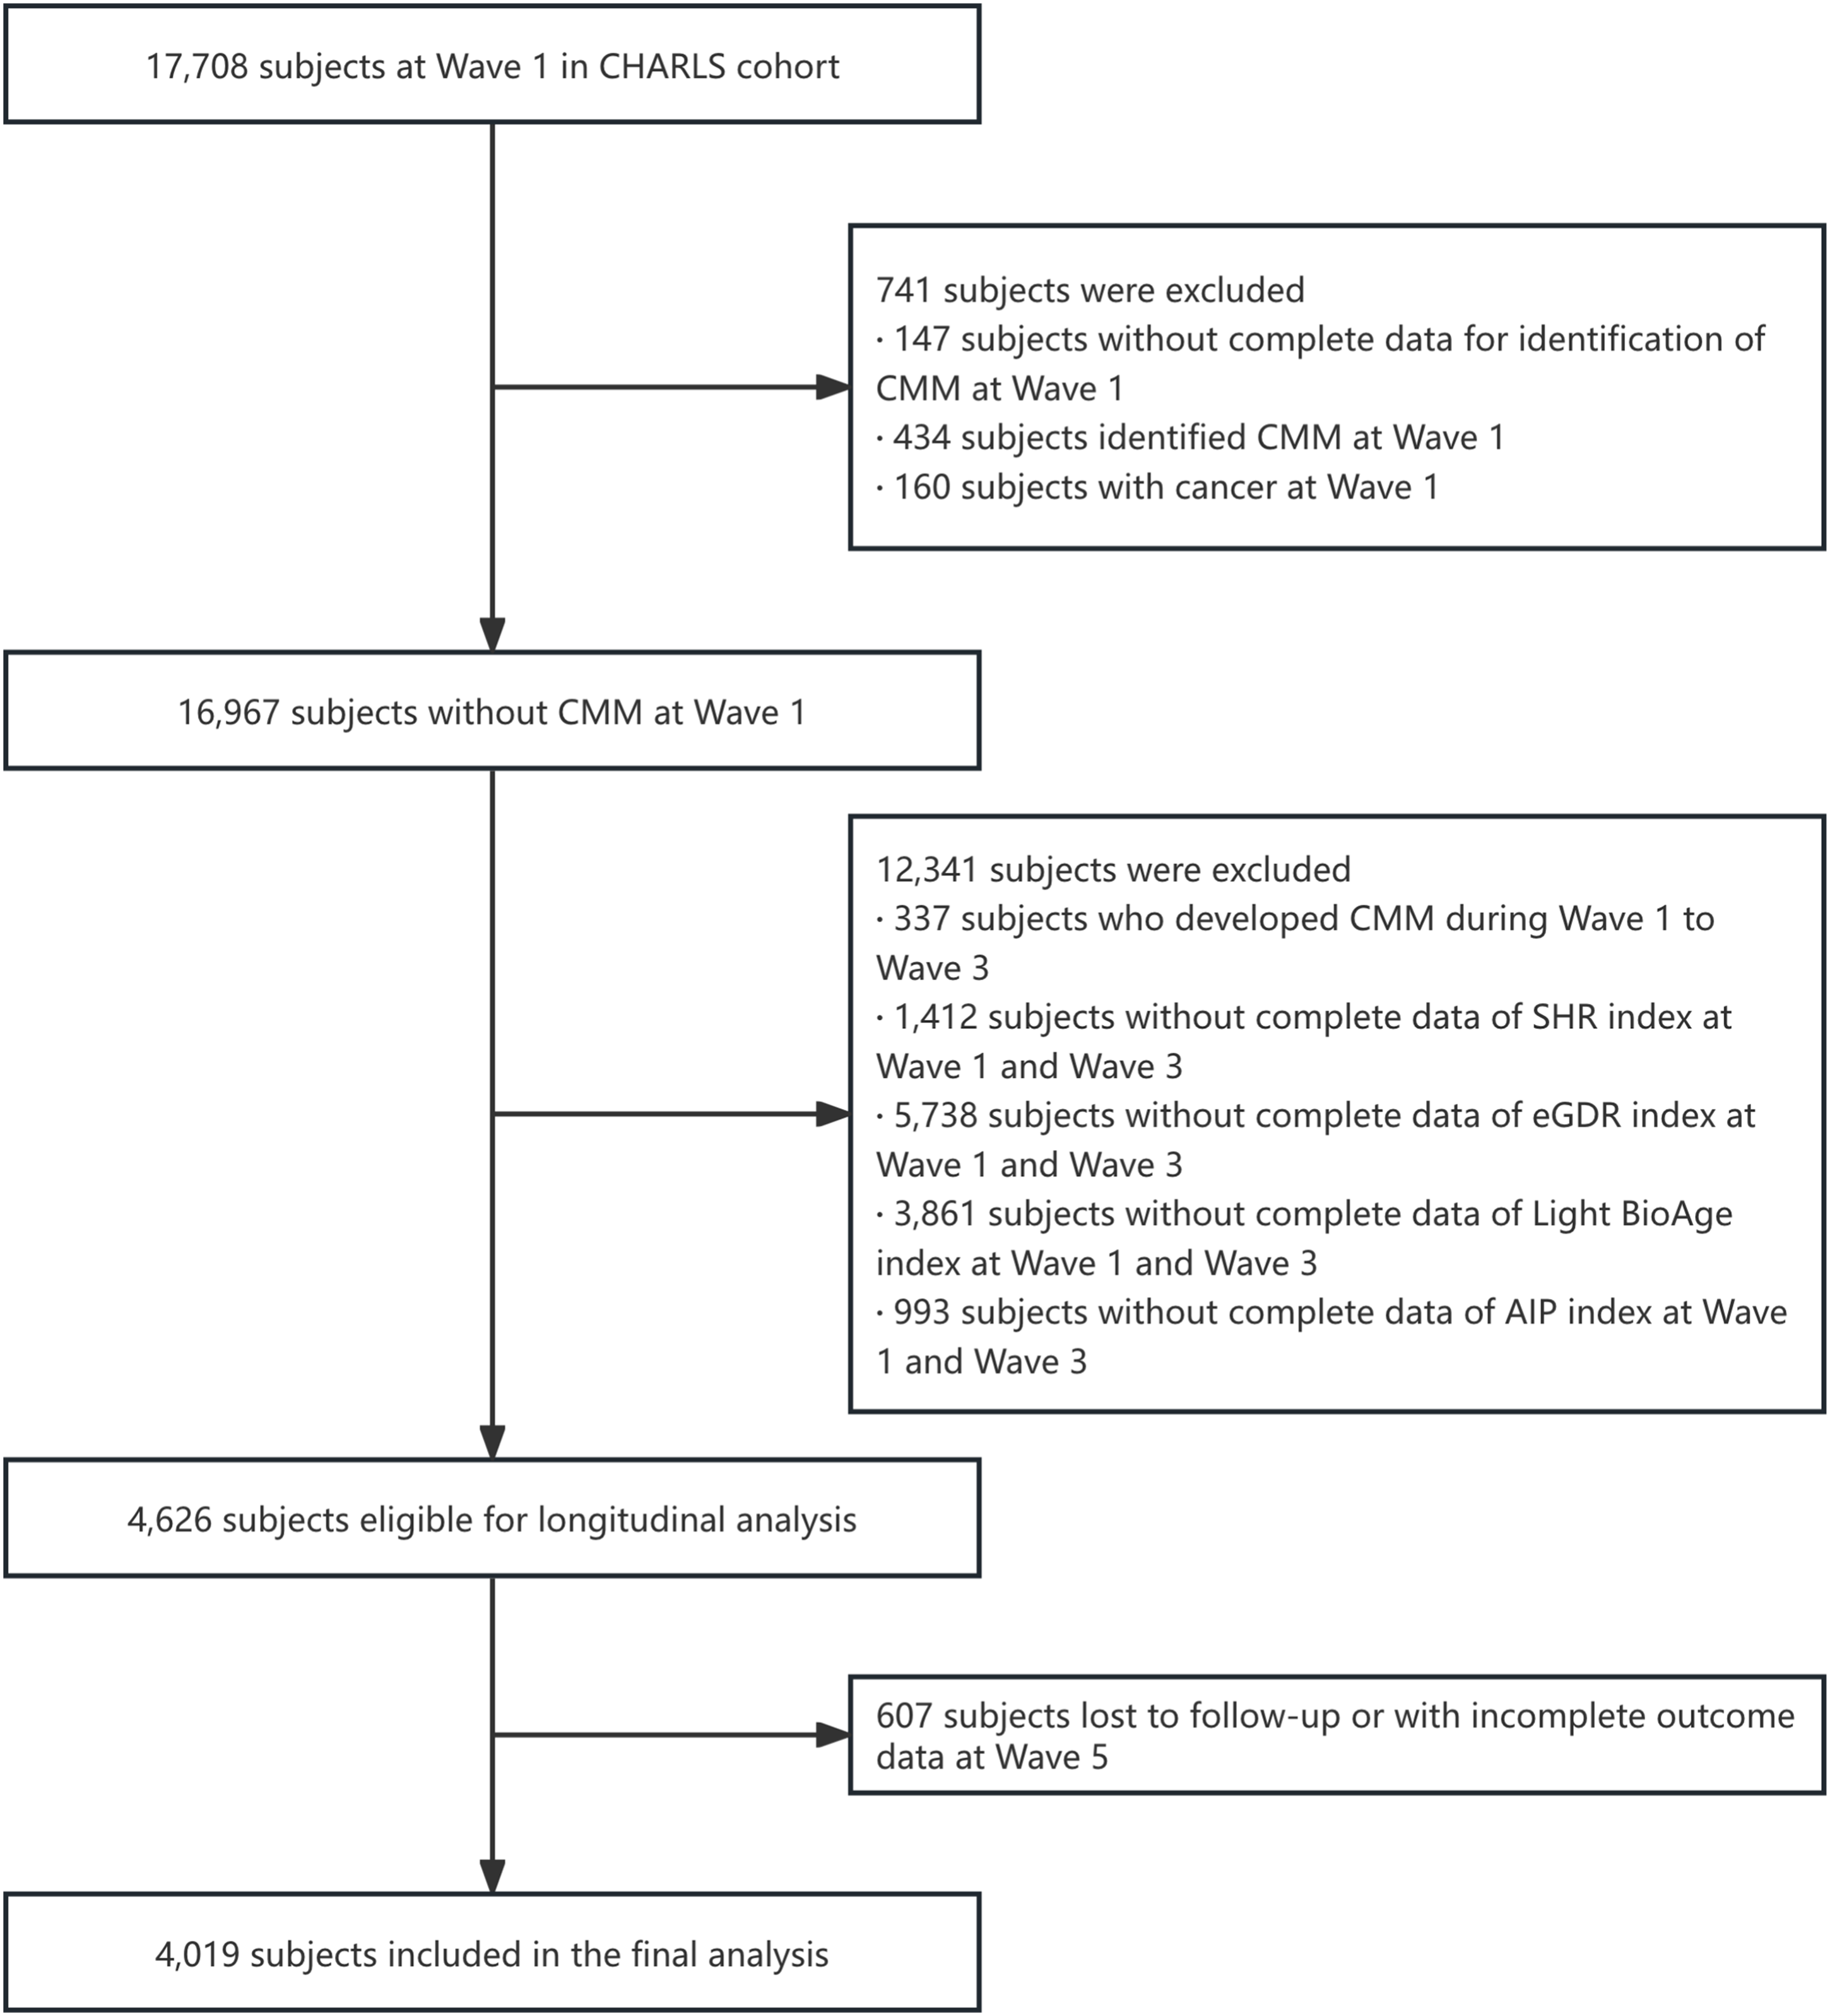
Study flow diagram of participant selection in the CHARLS cohort.
Definitions of outcome and exposures
Outcome: CMM
The primary outcome of this study was incident CMM, defined according to the standardized criteria established by the Emerging Risk Factors Collaboration and validated in Chinese population-based studies.1,11 CMM was defined as the new-onset co-occurrence of ≥2 of the following four physician-diagnosed cardiometabolic conditions: (a) hypertension; (b) type 2 diabetes mellitus or elevated blood glucose (fasting plasma glucose ≥7.0 mmol/L or 2-h postprandial glucose ≥11.1 mmol/L, or physician-diagnosed); (c) heart disease (including coronary heart disease, myocardial infarction, angina pectoris, and congestive heart failure); and (d) stroke (including cerebral infarction and cerebral hemorrhage).
We excluded participants with prevalent CMM (≥2 of the above component diseases) at baseline (Wave 1, 2011) from the final study cohort. For participants free of CMM at baseline, incident CMM was defined as the first-time occurrence according to the above criteria during follow-up, according to two prespecified scenarios: (a) participants with no component diseases at baseline developed ≥2 component diseases during follow-up and (b) participants with one component disease at baseline developed at least one additional component disease during follow-up.
Disease status for all component conditions was primarily ascertained via the standardized and validated questionnaire of the CHARLS, with the following core questions for each condition: 10 “Has your doctor informed you that you have hypertension?;” “Have you been diagnosed with diabetes mellitus or elevated blood glucose levels (including abnormal glucose tolerance and raised fasting blood glucose)?;” “Have you been diagnosed with heart disease (such as myocardial infarction, coronary heart disease, angina pectoris, congestive heart failure, or other heart conditions)?;” and “Have you experienced a stroke (including cerebral infarction and cerebral hemorrhage) as diagnosed by a doctor?.” To ensure diagnostic accuracy, all self-reported disease diagnoses were further cross-verified with participants’ self-reported medication use. The endpoint of follow-up was the first occurrence of incident CMM, loss to follow-up, all-cause death, or the Wave 5 (2020) follow-up visit, whichever occurred first.
Core exposure: SHR and its longitudinal trajectory
The primary exposure of this study was the SHR, a validated index that quantifies relative acute glycemic exposure independent of chronic long-term glucose control.
7
The SHR was calculated using the formula previously validated in general adult populations:

Higher SHRs indicate more prominent stress hyperglycemia. FPG and HbA1c were measured using standardized laboratory testing in the CHARLS cohort, with biologically implausible out-of-range values excluded prior to index calculation. For cross-sectional analyses of baseline characteristics, participants were stratified into quartiles (Q1 to Q4) according to their baseline (Wave 1, 2011) SHRs.
To model the longitudinal changes in SHR over time, we applied Latent Class Growth Modeling (LCGM) using SHR measurements from Wave 1 (2011) and Wave 3 (2015). LCGM is a well-established finite mixture modeling approach used to identify distinct, unobserved subgroups of participants with homogeneous longitudinal patterns of SHR change. 12 This analysis was restricted to participants free of CMM at both Wave 1 and Wave 3, with complete SHR data at the two visits, to minimize the risk of reverse causality bias, consistent with the study's prespecified inclusion criteria.
We fitted LCGM models with 1–5 latent trajectory classes, using linear polynomial terms for the time parameter, consistent with our two-wave longitudinal design with two time points. The optimal number of latent trajectory classes was determined based on prespecified criteria: (a) the lowest Bayesian Information Criterion value and (b) average posterior probability (APP) of class assignment >0.7 for all latent classes, indicating high classification accuracy. 13 This model selection process yielded three distinct SHR trajectory classes. All LCGM analyses were conducted using the traj package for R (version 4.3.0; R Core Team, Vienna, Austria).
Stress–metabolism synergy indices
To evaluate the synergistic effect of stress hyperglycemia and chronic metabolic dysregulation, we constructed three multiplicative synergy indices at baseline (Wave 1), which served as secondary core exposures of the study:
SHR–eGDR index. Calculated as SHR × (1/eGDR), reflecting the synergy between stress hyperglycemia and insulin resistance. SHR–HbA1c index. Calculated as SHR × HbA1c, reflecting the synergy between stress hyperglycemia and chronic hyperglycemia. SHR–AIP index. Calculated as SHR × AIP, reflecting the synergy between stress hyperglycemia and atherogenic lipid profile.
The eGDR, a validated non-invasive surrogate marker of insulin sensitivity, was computed using the formula developed and validated in general population cohorts:
14

In this formula, WC refers to waist circumference (cm); hypertension status is dichotomously coded (1 for yes, 0 for no), and HbA1c was measured as percentage (%). eGDR values were expressed in mg/kg/min, and its reciprocal (1/eGDR) was used to represent the degree of insulin resistance, with higher values indicating more severe insulin resistance. 15
The AIP, a validated biomarker of atherogenic lipid profile, was calculated using the following formula:
16

To ensure comparability across indices with different scales, all synergy indices were standardized to Z-scores (mean = 0, SD = 1) based on the overall study population prior to multivariable regression analyses.
Covariates
Based on previously established literature and causal inference principles, we selected a set of baseline covariates for multivariable adjustment, grouped into three conceptually distinct categories:
Demographic factors. Age (continuous, years), sex (male/female), residence (urban/rural), educational level (categorical: below junior high school, junior high school, high school, college or above), marital status (categorical: married, divorced, widowed, never married); Lifestyle factors. Smoking status (never/former/current), alcohol consumption (never/former/current), BMI (continuous, kg/m2); Baseline comorbidities. Physician-diagnosed diabetes, hypertension, chronic lung disease, and stroke (all binary, yes/no).
For sensitivity analysis, we additionally included a panel of blood-based biomarkers, including white blood cell (WBC) count, mean corpuscular volume (MCV), blood urea nitrogen (BUN), serum creatinine, C-reactive protein (CRP), uric acid, hematocrit, and hemoglobin. All covariates were defined based on standardized CHARLS questionnaire items and laboratory measurements, 10 consistent with the study's data collection protocols.
Missing data handling
The missing rate of all covariates was <10%. To minimize bias from missing data, we performed multiple imputation by chained equations (MICE) to generate 10 imputed complete datasets.17,18 The imputation model included all exposure variables, outcome variables (CMM event status and follow-up time), covariates, and auxiliary variables associated with missingness. Pooled effect estimates were calculated using Rubin's rules. 19 A complete-case analysis was conducted as a sensitivity check to verify the robustness of the primary results.
Statistical analyses
All statistical analyses were conducted using R 4.3.0 (R Core Team, Vienna, Austria). Two-sided p-values <0.05 were considered to indicate statistical significance, and all analyses were based on pooled imputed data unless otherwise specified. Continuous variables with normal distribution are presented as mean ± SD, and categorical variables are presented as numbers (percentages, %). Between-group comparisons were performed using one-way analysis of variance (ANOVA) for continuous variables and chi-square (χ2) test for categorical variables.
Cox proportional hazards regression analysis
Cox proportional hazards regression models were used to estimate hazard ratios (HRs) and 95% confidence intervals (CIs) for the associations between baseline exposures (SHR and the three stress–metabolism synergy indices) and incident CMM. For these baseline analyses, the origin of follow-up was defined as the baseline interview in Wave 1 (2011), with participants followed up prospectively through 2020. Event times were calculated as number of months from the Wave 1 interview to the event which occurred earliest among incident CMM, loss to follow-up, death, or the Wave 5 (2020) visit. We constructed four nested hierarchical models to adjust for potential confounding stepwise, with the fully adjusted model serving as the primary model for the main results:
Model 1. Unadjusted crude model Model 2. Adjusted for demographic and anthropometric factors (age, sex, and BMI) Model 3. Further adjusted for lifestyle and socioeconomic factors (residence, educational level, marital status, smoking status, and alcohol consumption) based on Model 2 Model 4. Fully adjusted model, further adjusted for baseline comorbidities (diabetes, hypertension, lung disease, stroke) based on Model 3.
Nonlinear association test
Restricted cubic spline (RCS) regression with four knots placed at the 5th, 35th, 65th, and 95th percentiles of SHR was applied to test the nonlinear association between continuous SHR and incident CMM, with adjustment for all covariates in Model 4. 20
Trajectory analysis
The LCGM-derived SHR trajectory group was entered as a categorical predictor into the fully adjusted Cox model (Model 4) to evaluate the association between longitudinal SHR changes and subsequent CMM risk. Consistent with the LCGM analysis criteria described in 2.2.2, trajectory groups were defined based on the optimal three-class model. To prevent reverse causality and immortal time bias, this trajectory-based survival analysis utilized a left-truncated landmark design. The origin of follow-up was landmarked at the Wave 3 examination (2015)—the timepoint at which the longitudinal trajectories were fully established—and extended through 2020. Participants with incident CMM or censored prior to Wave 3 were excluded. Event times were calculated as number of months from the Wave 3 interview to the earliest event among incident CMM, loss to follow-up, death, or the Wave 5 (2020) visit.
Predictive utility evaluation
We compared the predictive performance of three sets of models: (a) a base model, including demographic and lifestyle covariates in Model 3; (b) an enhanced model adding SHR to the base model; and (c) separate enhanced models adding each stress–metabolism synergy index to the base model. Model discrimination was assessed using Harrell's concordance index (C-index) and time-dependent area under the receiver operating characteristic curve (AUC), with between-model comparisons performed using DeLong's test for C-index and the method proposed by Uno et al. for time-dependent AUC. 21 Model reclassification was evaluated using continuous net reclassification improvement (NRI) and integrated discrimination improvement (IDI). 22 Clinical net benefit was assessed using decision curve analysis (DCA) across a threshold probability range of 0–0.5. 23
Mediation analysis
For the synergy index with the best predictive performance, we performed mediation analysis to disentangle the direct and indirect effects on CMM risk, with three prespecified mediators measured at Wave 1: (a) HbA1c (long-term glycemic control); (b) AIP (atherogenic lipid profile); (c) and Light-BioAge (accelerated biological aging, calculated as a simplified biological aging clock based on chronological age and three routine biomarkers, using the formula: Light-BioAge = Age + 5.0875 × creatinine + 1.5766 × glucose + 4.2983 × ln(CRP + 1) − 16.7562). 24 Separate simple mediation models were fitted for each mediator, with adjustment for all covariates in Model 4. The statistical significance of mediation effects was tested using bias-corrected non-parametric bootstrap with 1000 resamples. 25
Sensitivity analyses
Three prespecified sensitivity analyses were conducted to validate the robustness of the primary findings: (a) complete-case analysis using only participants with no missing data for any variable; (b) verification of the proportional hazards assumption using Schoenfeld residual tests, with a global p-value >0.05 indicating no violation of the assumption; and (c) extended Cox model with additional adjustment for eight blood-based biomarkers to rule out residual confounding. 26
Results
Baseline characteristics of the study population
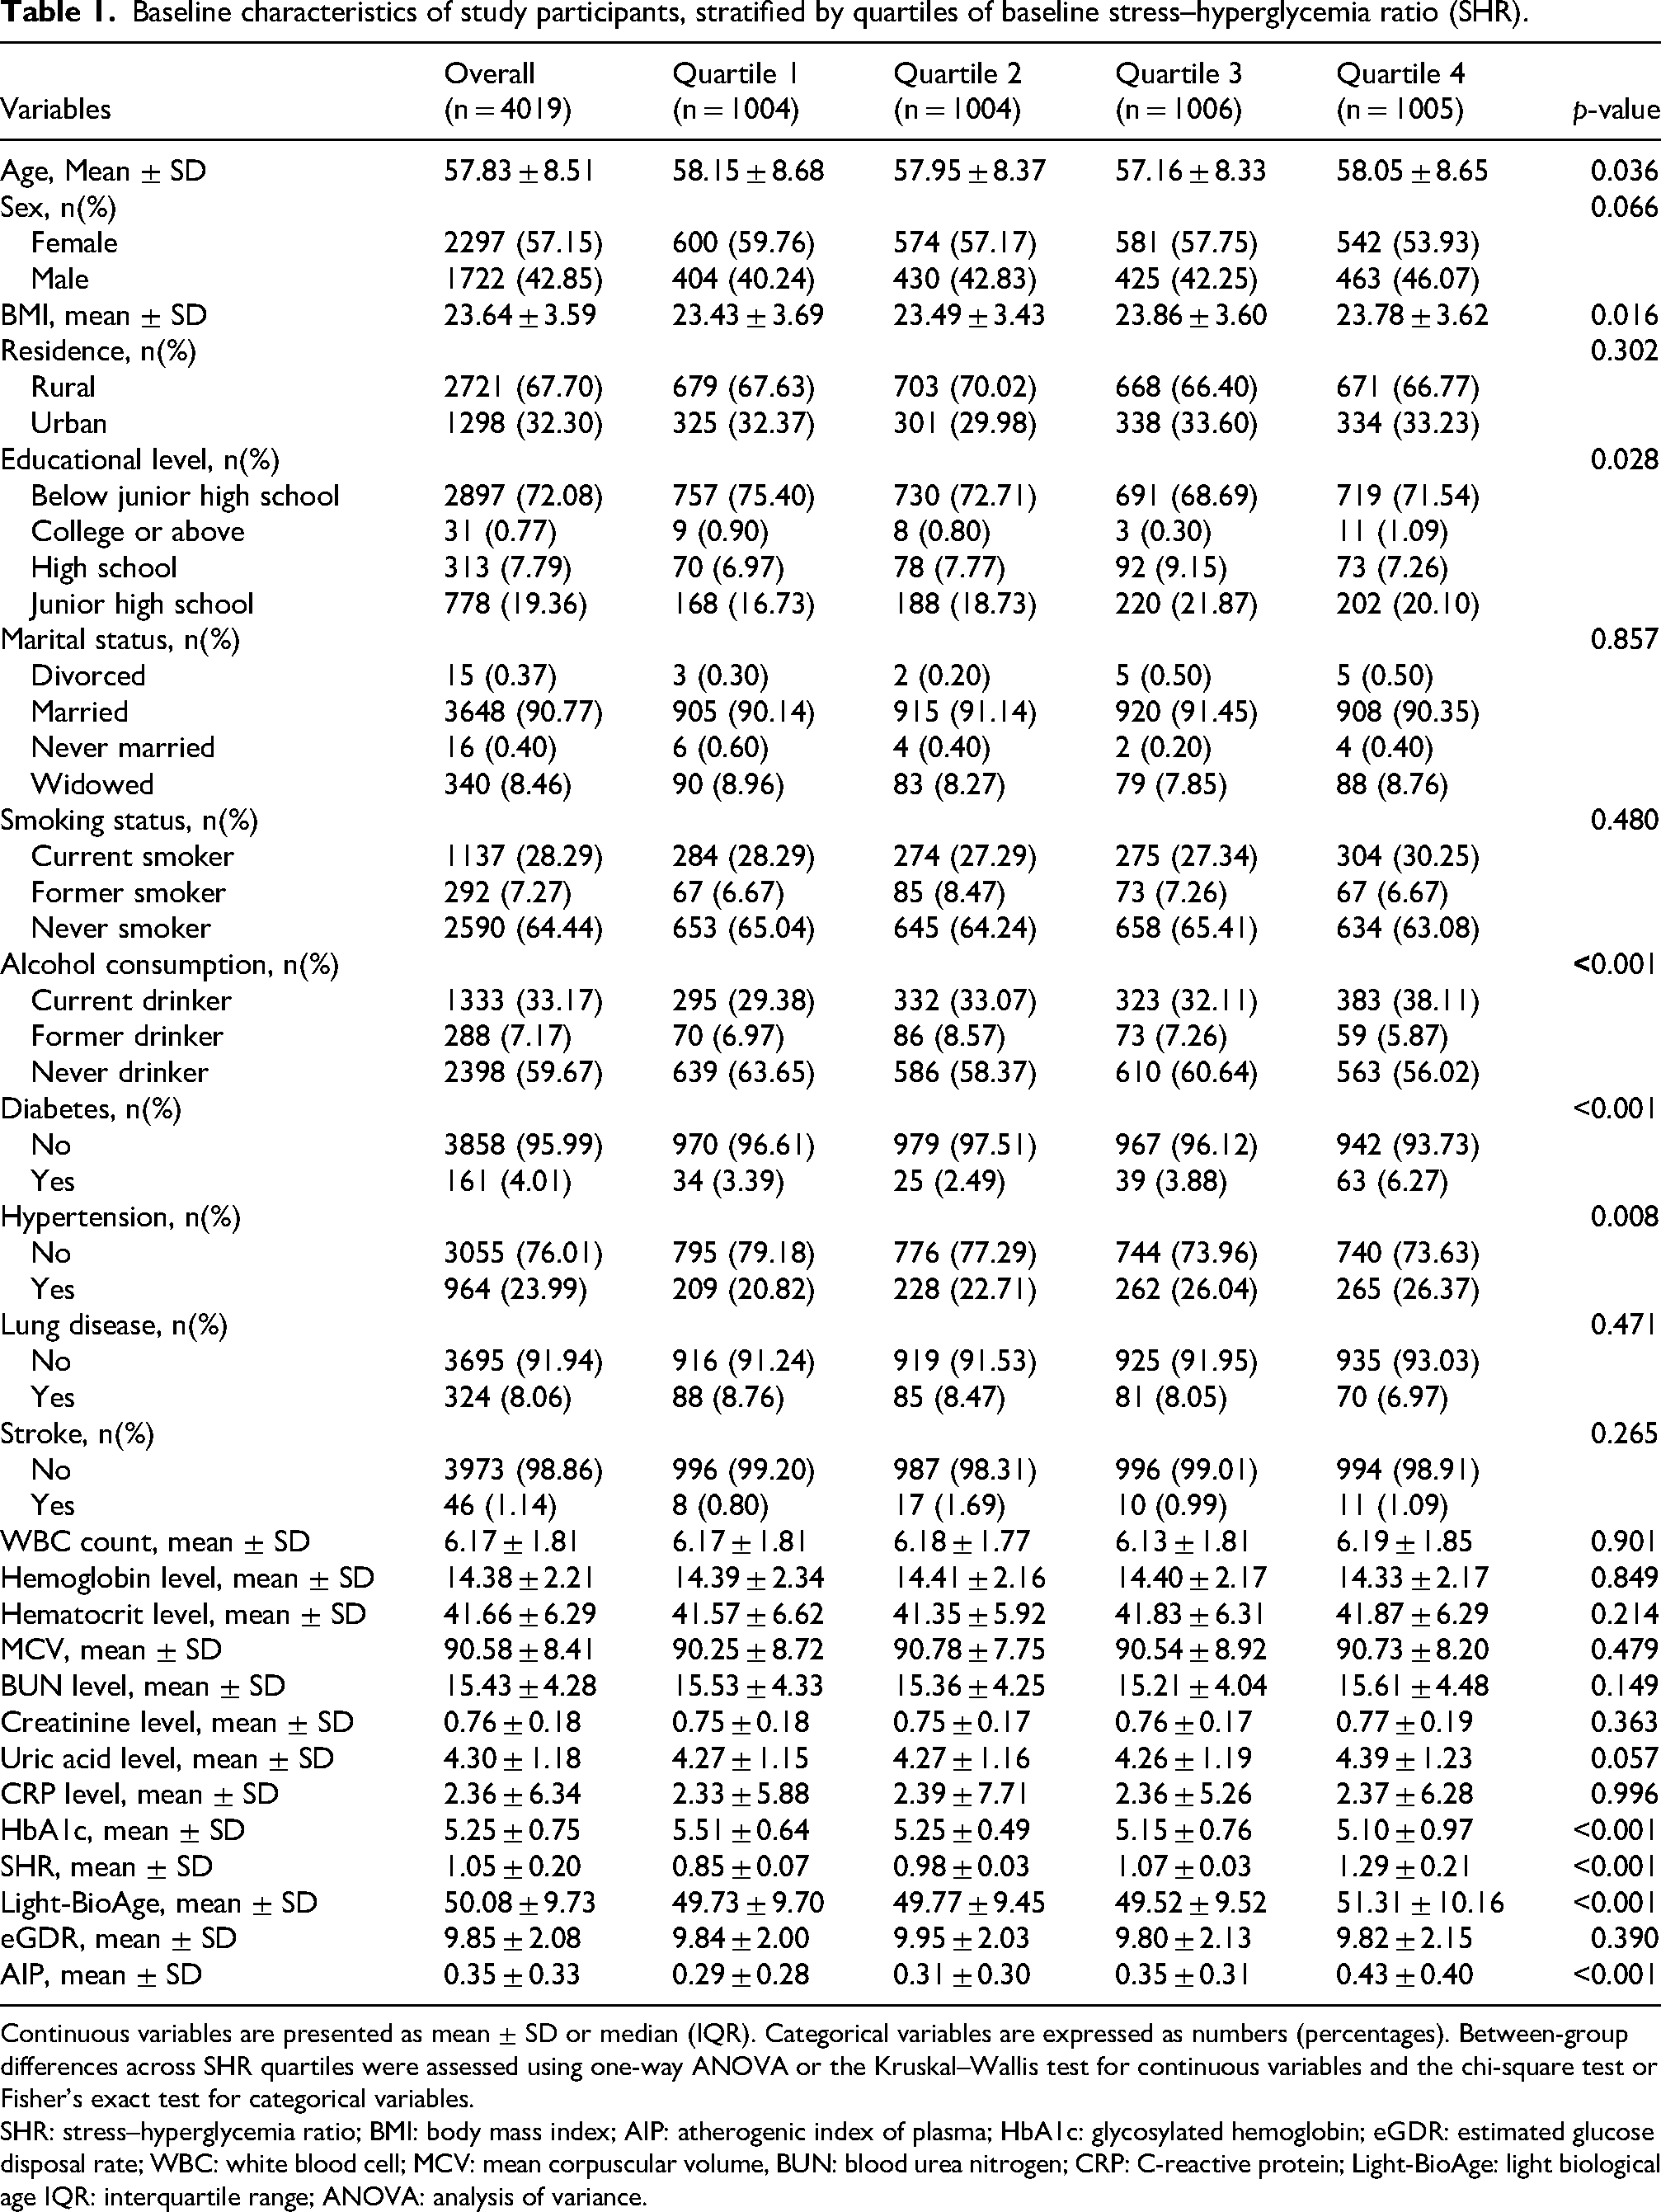
In total, 4019 participants were included in the final analysis; the mean age of the study population was 57.8 years, and 42.9% were men. Over a median follow-up duration of 9.0 years, 313 participants (7.8%) developed incident CMM. Participants were stratified into quartiles (Q1 to Q4) according to the baseline SHR, with approximately 25% of the sample in each quartile (Table 1).
Baseline characteristics of study participants, stratified by quartiles of baseline stress–hyperglycemia ratio (SHR).
Continuous variables are presented as mean ± SD or median (IQR). Categorical variables are expressed as numbers (percentages). Between-group differences across SHR quartiles were assessed using one-way ANOVA or the Kruskal–Wallis test for continuous variables and the chi-square test or Fisher's exact test for categorical variables.
SHR: stress–hyperglycemia ratio; BMI: body mass index; AIP: atherogenic index of plasma; HbA1c: glycosylated hemoglobin; eGDR: estimated glucose disposal rate; WBC: white blood cell; MCV: mean corpuscular volume, BUN: blood urea nitrogen; CRP: C-reactive protein; Light-BioAge: light biological age IQR: interquartile range; ANOVA: analysis of variance.
Significant between-quartile differences were observed for SHR, Light-BioAge, AIP, HbA1c, age, BMI, prevalence of diabetes and hypertension, educational level, and alcohol consumption (all p < 0.05). No significant between-group differences were observed in other demographic, lifestyle, or laboratory parameters (all p > 0.05, Table 1).
Association between the baseline SHR and incident CMM risk
To characterize the relationship between the baseline SHR and incident CMM, we employed both continuous and categorical analytical approaches (Supplementary Table 1). In fully adjusted models, each 1-SD increase in the SHR Z-score was associated with a 13% higher risk of CMM (HR = 1.13, 95% CI: 1.03–1.24, p = 0.013). When the SHR was examined by quartiles, the hazard for the highest quartile (Q4) was significantly elevated in crude and partially adjusted models (HRs = 1.40–1.42). However, following comprehensive adjustment for confounders in Model 4, this association attenuated and did not reach statistical significance (HR = 1.34, 95% CI: 0.98–1.83, p = 0.067).
RCS analysis revealed a significant, linear dose–response relationship between the SHR and CMM risk after full adjustment for covariates (p for overall = 0.012; p for non-linearity = 0.114) (Supplementary Figure 1).
Longitudinal SHR trajectories and their association with CMM risk
Group-based LCGM identified three distinct longitudinal SHR trajectories over the follow-up period (2011–2015, Supplementary Figure 2):
1. Trajectory 1: “Low-stable,” characterized by persistently low and stable SHR levels;
2. Trajectory 2: “Moderate-increasing,” starting at a moderate level and showing a clear upward trend; and
3. Trajectory 3: “Highdeclining,” which began at the highest level, exhibited a gradual decline over time, and remained elevated compared with Trajectory 1 throughout the observation period.
Model diagnostic statistics and the APP matrix are detailed in Supplementary Tables 2 and 3.
Kaplan–Meier analysis showed significantly different cumulative incidence curves of CMM among the three distinct SHR trajectory classes (log-rank p = 0.011; Supplementary Figure 3). Participants in Trajectory Class 2 (“Moderate-increasing”) exhibited the highest risk, with a cumulative incidence that markedly exceeded those of the other groups throughout the follow-up period.
Cox regression models with progressive adjustment revealed a graded association between SHR trajectory class and CMM risk (Supplementary Table 4). Relative to the “low-stable” class (Class 1), the “moderate-increasing” class (Class 2) demonstrated a consistently elevated and statistically significant hazard across all models. The point estimate attenuated modestly with sequential covariate adjustment, from an unadjusted HR of 2.32 (95% CI: 1.15–4.68) in Model 1 to a fully adjusted HR of 2.04 (95% CI: 1.01–4.15) in Model 4. Conversely, the “high-declining” class (Class 3) showed a weaker, non-significant association throughout the adjustment process, with a fully adjusted HR of 1.52 (95% CI: 0.91–2.53, p = 0.107). This pattern suggests that the excess risk linked to the “moderate-increasing” trajectory is largely independent of the key confounders adjusted for in our models.
Stress–metabolism synergistic indicators and CMM risk
The association of stress hyperglycemia with CMM risk was further examined in the context of metabolic dysregulation. Multiplicative interaction terms (SHR–AIP, SHR–HbA1c, and SHR–eGDR) were constructed to test for synergistic effects. In the fully adjusted model (Model 4, Table 2), each combined metric showed a stronger association with CMM (HRs: 1.20 to 1.22) compared to SHR alone (HR = 1.13), and all interaction terms were statistically significant (p < 0.001). This consistent pattern suggests that the concurrent assessment of stress and metabolic markers improves risk stratification.
Hazard ratios for CMM associated with SHR and synergistic metabolic indicators in multivariable models.
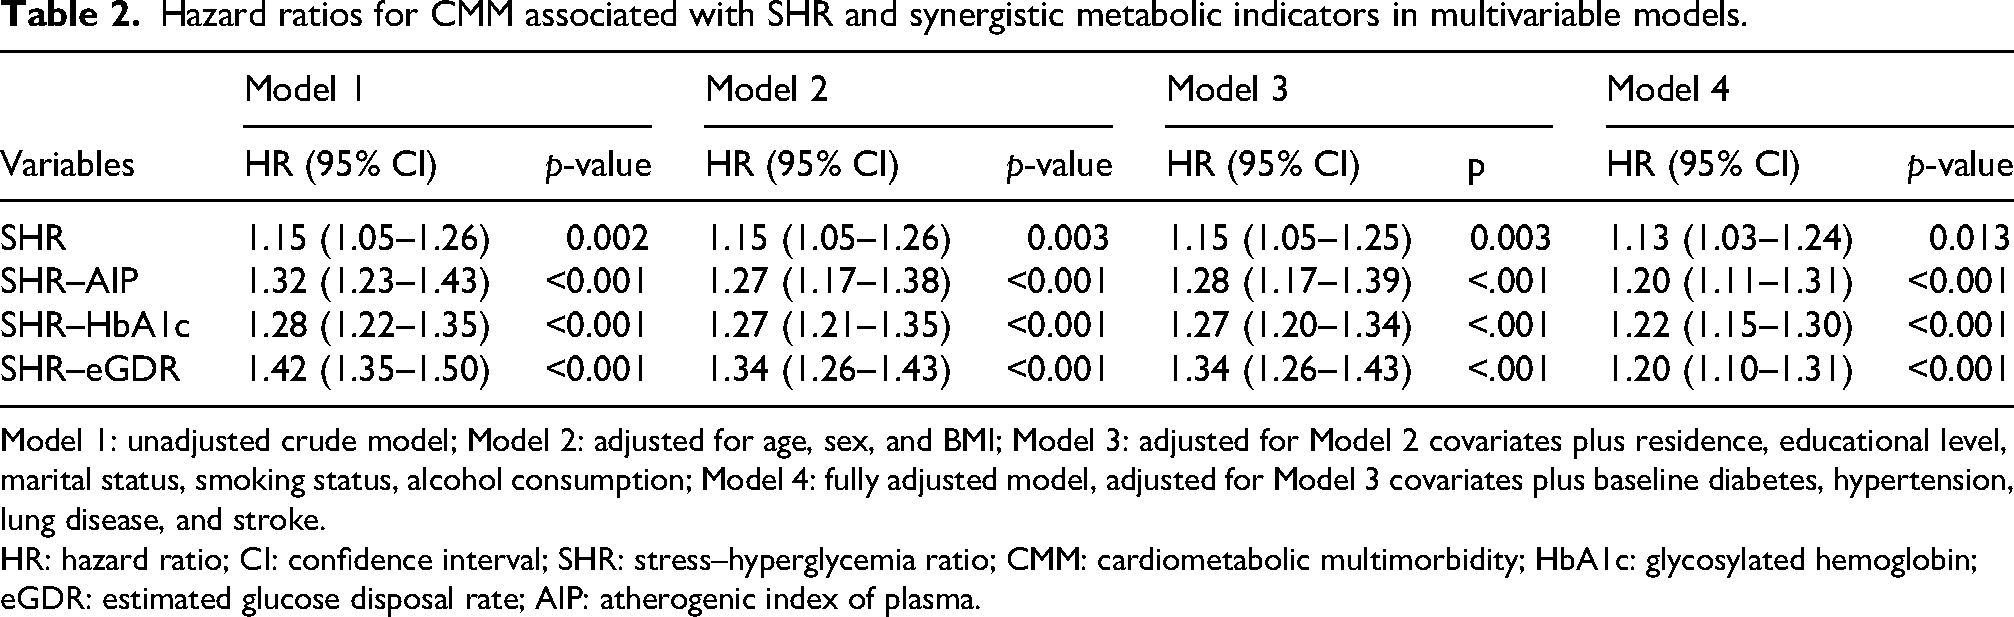
Model 1: unadjusted crude model; Model 2: adjusted for age, sex, and BMI; Model 3: adjusted for Model 2 covariates plus residence, educational level, marital status, smoking status, alcohol consumption; Model 4: fully adjusted model, adjusted for Model 3 covariates plus baseline diabetes, hypertension, lung disease, and stroke.
HR: hazard ratio; CI: confidence interval; SHR: stress–hyperglycemia ratio; CMM: cardiometabolic multimorbidity; HbA1c: glycosylated hemoglobin; eGDR: estimated glucose disposal rate; AIP: atherogenic index of plasma.
Predictive performance comparison
The stress–metabolism synergy indices were significant predictors of incident CMM, with improved discriminative capacity over the isolated SHR. This was reflected in a stepwise increase in the C-index from a baseline of 0.66 (SHR model) to 0.68, 0.69, and 0.70 for models containing the SHR–AIP, SHR-HbA1c, and SHR–eGDR indices, respectively (Supplementary Table 5).
Receiver operating characteristic (ROC) curves visually confirmed the enhanced discriminative capability of the synergy index models over the SHR-only model (Figure 2). DCA further demonstrated that the SHR–eGDR index model yielded a higher net clinical benefit across most clinically relevant risk thresholds compared with the SHR-only models (Supplementary Figure 4).
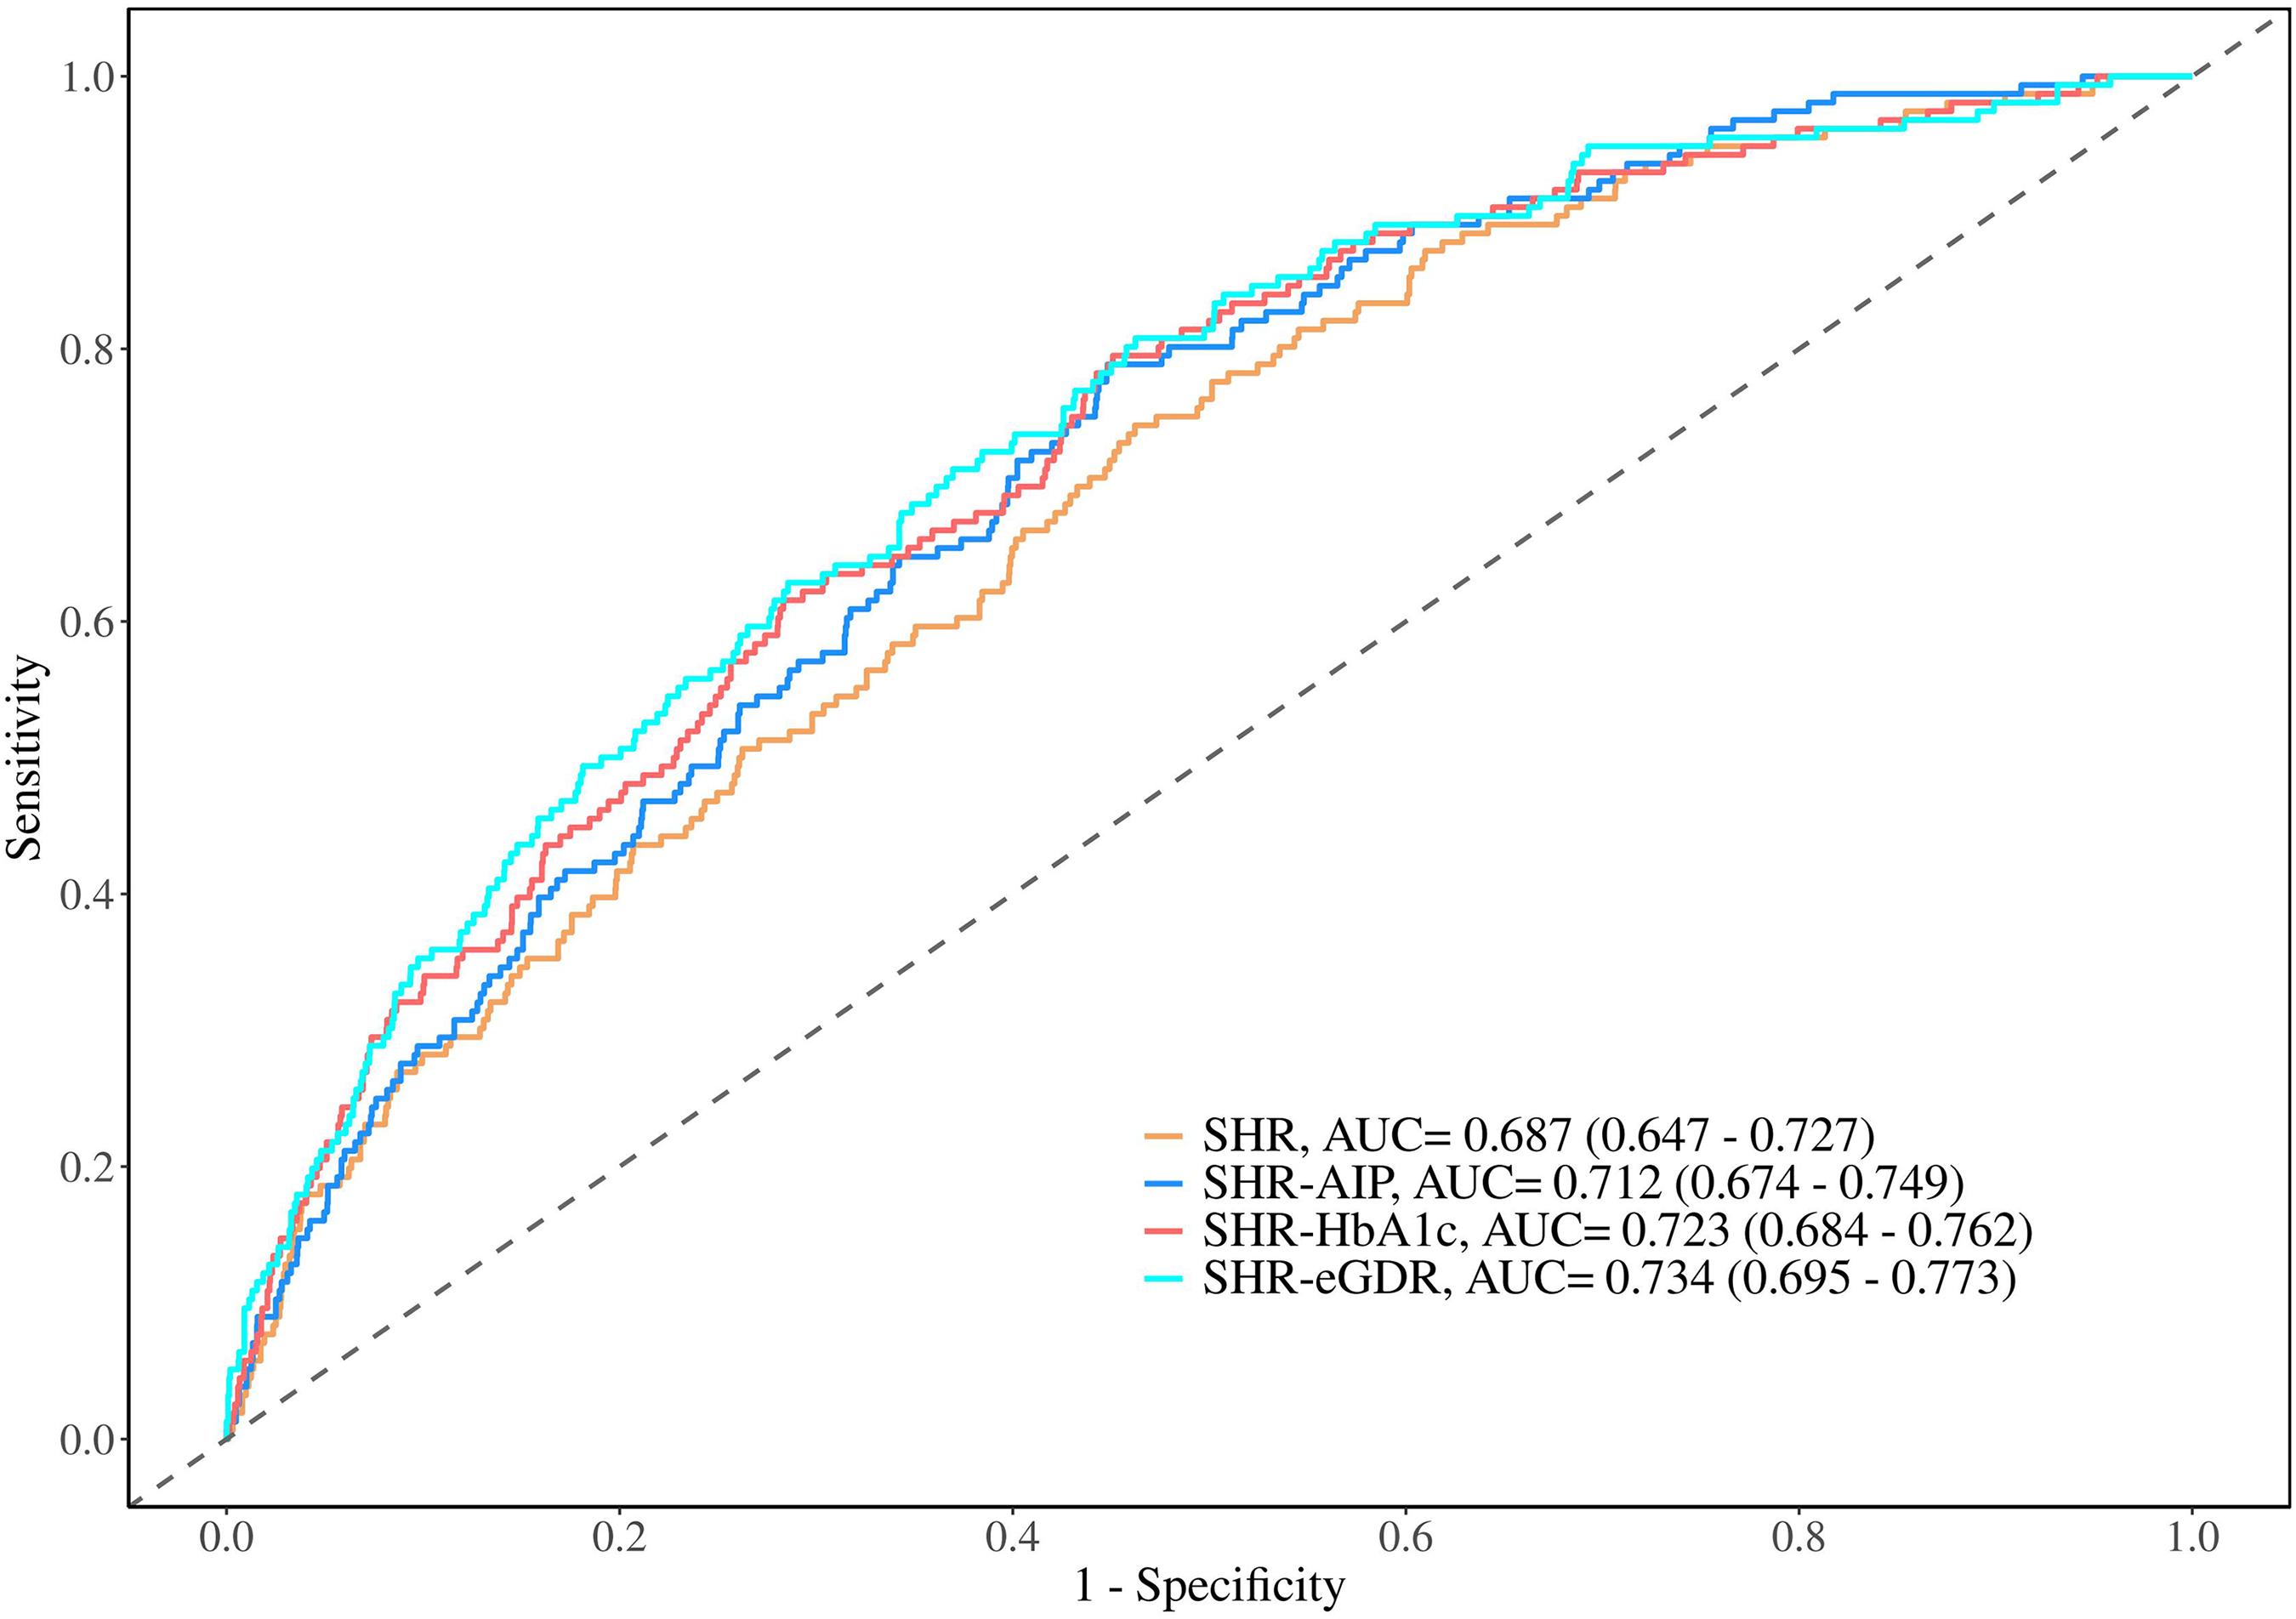
Receiver operating characteristic curves of models incorporating stress–metabolism synergy indices for predicting cardiometabolic multimorbidity.
Their incremental predictive value was further confirmed in the reclassification analysis (Supplementary Table 6). The SHR–eGDR index provided the most substantial gain, with significant improvements in reclassification (NRI = 0.546; 95% CI: 0.389–0.704; p < 0.001) and integrated discrimination (IDI = 0.020; 95% CI: 0.008–0.032; p = 0.001). The other two indices also contributed significant, though smaller, improvements. Thus, the synergistic indices, particularly the SHR–eGDR index, consistently improved CMM predictive models, with enhanced discrimination, reclassification, and clinical usefulness.
Dose–response relationship between the SHR–eGDR index and CMM risk
Supplementary Figure 5 shows the dose–response association between the SHR–eGDR index and incident CMM based on RCS models, adjusted for all covariates. We observed a highly significant overall association (p for overall < 0.001), with a statistically significant nonlinear trend (p for non-linearity = 0.048). Specifically, a distinct threshold effect was identified; when the SHR–eGDR index exceeded approximately 0.10, the risk of incident CMM increased significantly with rising index values.
Subgroup analyses for the SHR–eGDR Index and CMM risk
Stratified Cox regression analyses were conducted to assess the stability of the association between SHR–eGDR index and CMM risk across prespecified subgroups (Supplementary Figure 6). The overall positive association between higher SHR–eGDR and elevated CMM risk (HR 1.20, 95% CI 1.10–1.31; p < 0.001) remained consistent across subgroups stratified by age, sex, smoking status, alcohol consumption, and diabetes status, with no significant effect modification observed (all p for interaction > 0.05). Hypertension status was the only significant effect modifier (p for interaction = 0.031): the association between the SHR–eGDR index and CMM risk was stronger in participants without hypertension (HR 1.46, 95% CI 1.19–1.79; p < 0.001) than in those with hypertension (HR 1.19, 95% CI 1.07–1.32; p = 0.001).
Mediation analyses of the association between the SHR–eGDR index and CMM risk
Mediation analyses were conducted to identify the biological pathways linking the SHR–eGDR index to CMM risk, using three prespecified pathophysiological mediators: (a) HbA1c (long-term glycemic control); (b) AIP (atherogenic lipid profile); and (c) Light-BioAge (accelerated biological aging). All analyses were performed using separate simple mediation models for each mediator, with mediation effects tested using bias-corrected bootstrap method (Figure 3).
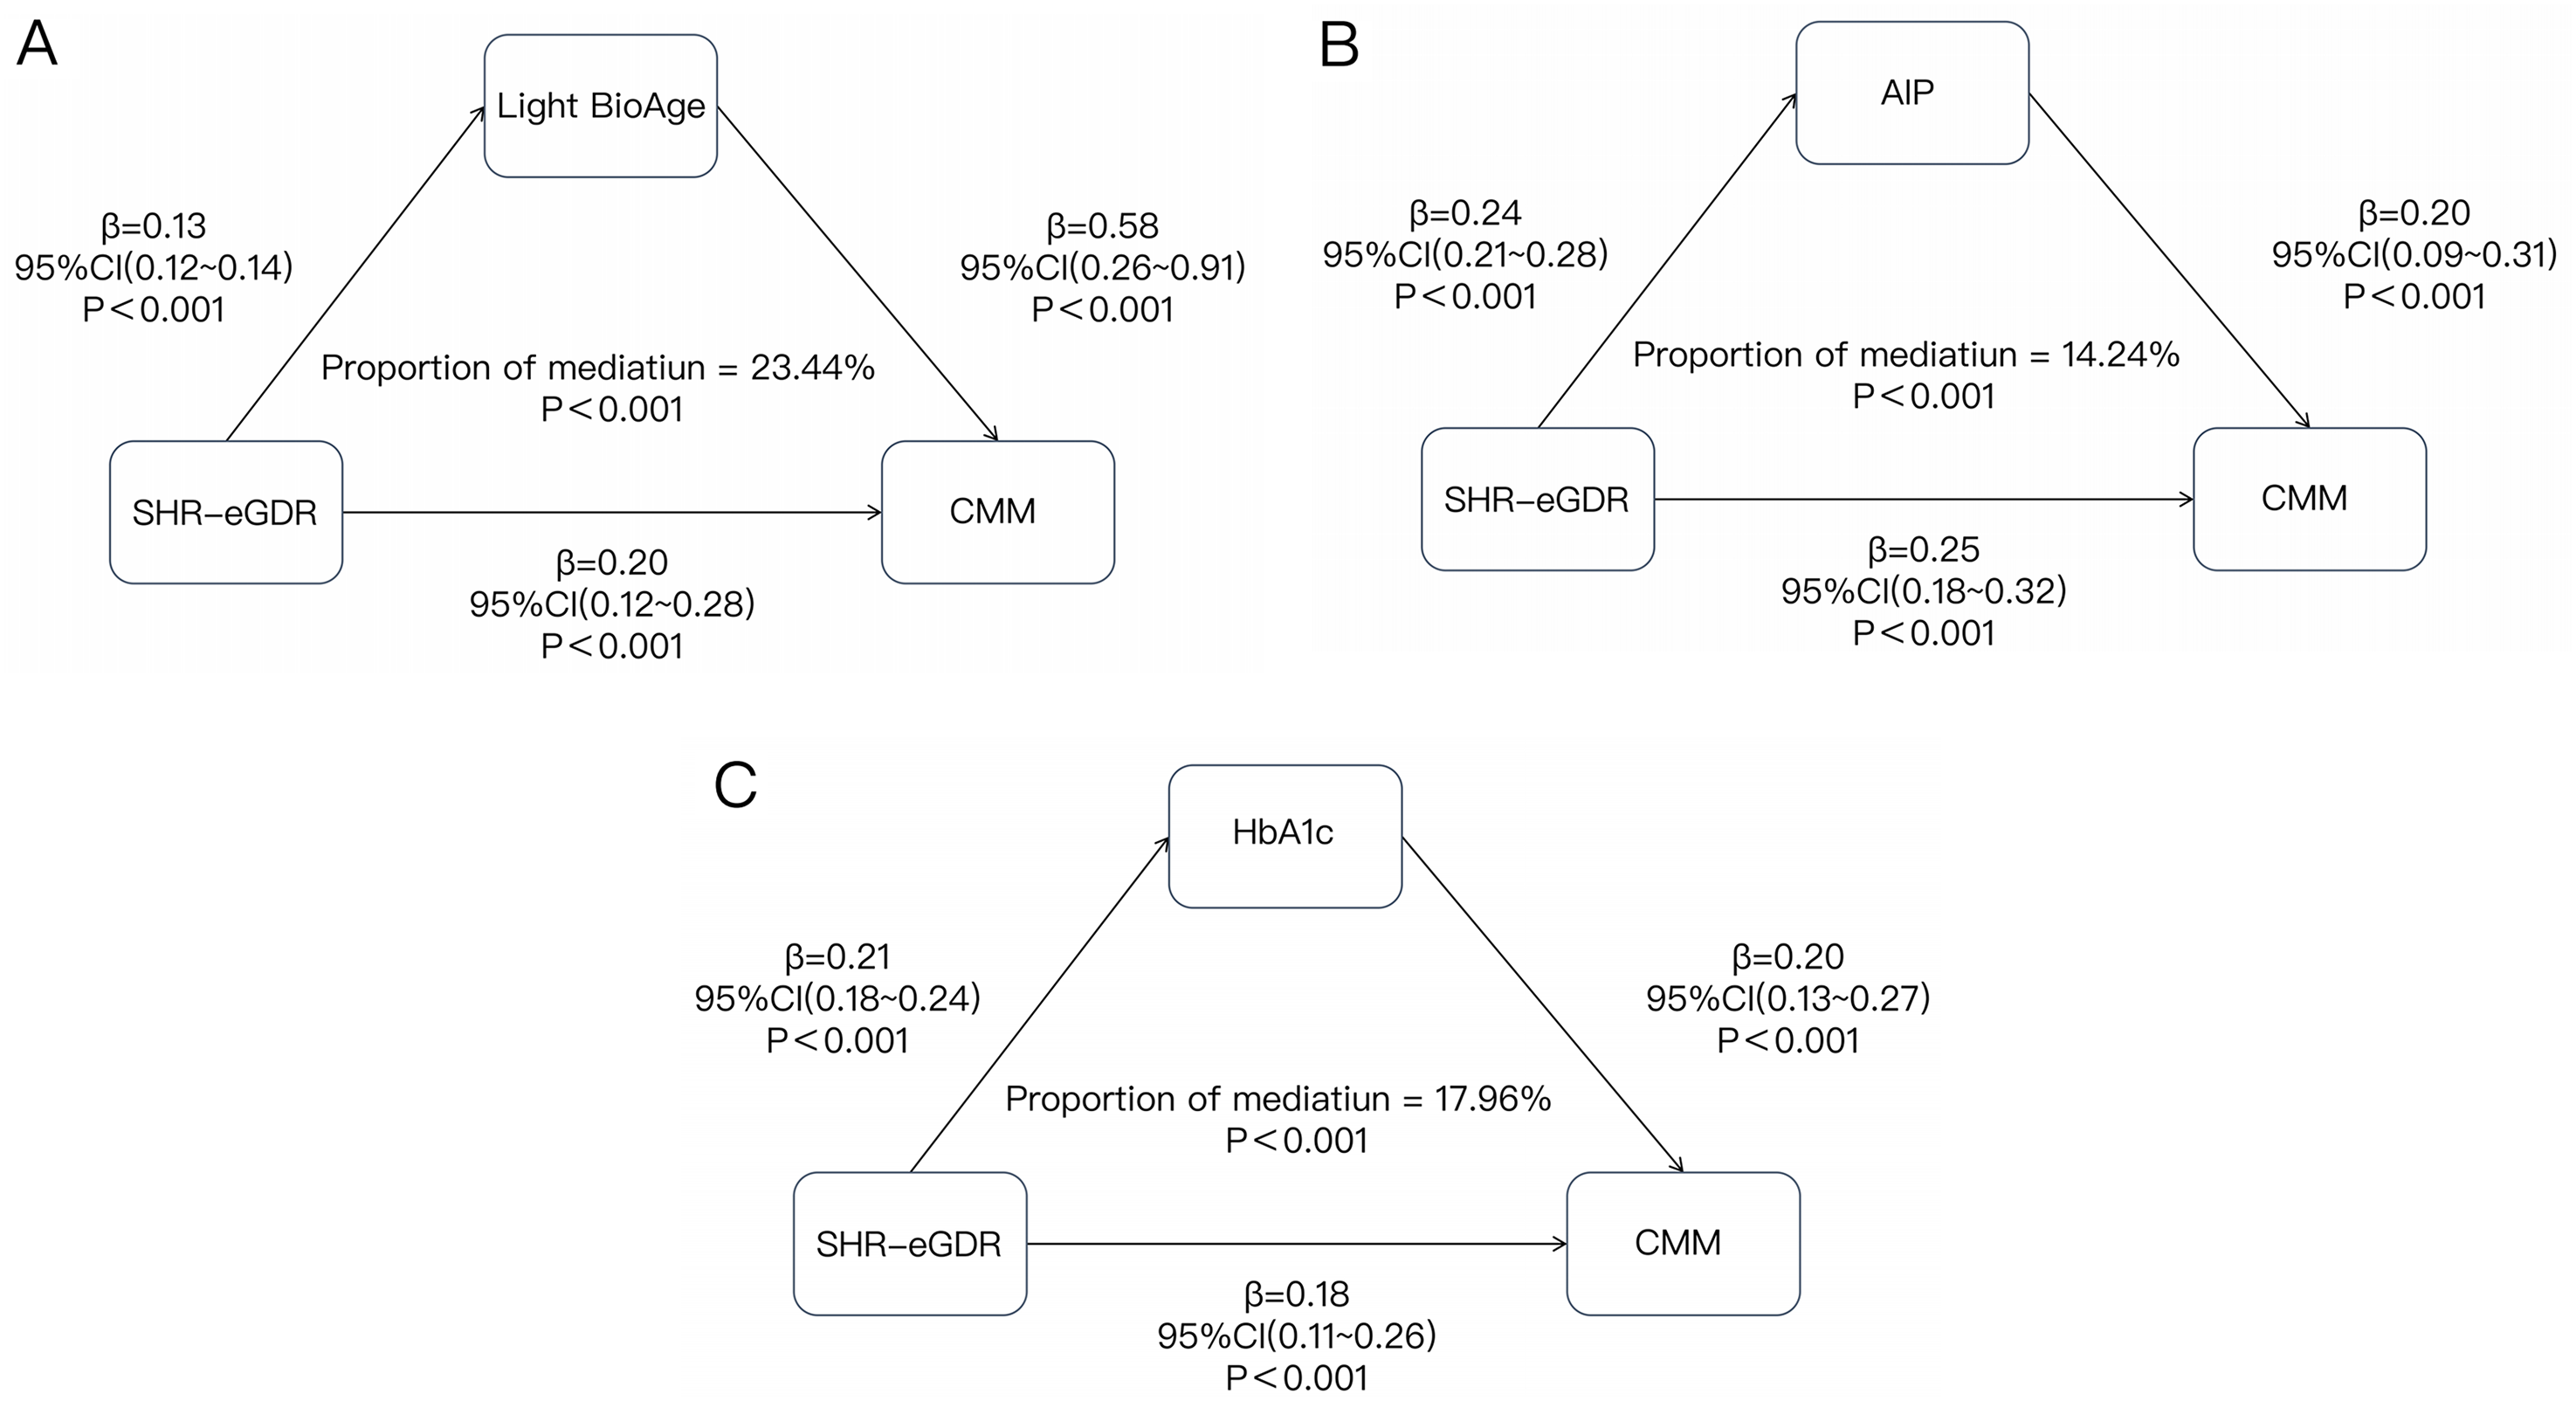
Mediation analyses evaluating the biological pathways underlying the association between the SHR–eGDR index and CMM risk. (a) Mediation model illustrating the effect of Light-BioAge on cardiometabolic multimorbidity, with standardized path coefficients, 95% CIs, and mediation proportion. (b) Mediation model illustrating the effect of AIP on cardiometabolic multimorbidity, with standardized path coefficients, 95% CIs, and mediation proportion. (c) Mediation model illustrating the effect of HbA1c on cardiometabolic multimorbidity, with standardized path coefficients, 95% CIs, and mediation proportion.
All three mediators showed statistically significant mediation effects (all p < 0.001): 17.96% of the total effect of the SHR–eGDR index on CMM risk was mediated by HbA1c, 14.24% by AIP, and 23.44% by Light-BioAge. All individual paths (exposure to mediator and mediator to outcome) were statistically significant (all p < 0.001), and the direct effect of the SHR–eGDR index on CMM risk remained significant in all three mediation models (all p < 0.001).
Sensitivity analyses of the associations between stress–metabolism synergistic indices and CMM risk
We performed three prespecified sensitivity analyses to confirm the robustness of the observed associations between the four stress–metabolism synergistic indices and CMM risk, with consistent results across all analyses (Supplementary Table 7). First, complete-case analysis restricted to 3914 participants with full covariate data yielded nearly identical effect estimates to the primary multiple imputation analysis, with all four indices retaining statistically significant positive associations with CMM risk (fully adjusted HR 1.13–1.22, all p < 0.05; Supplementary Table 8), confirming that missing data handling did not affect our conclusions. Second, Schoenfeld residual tests confirmed the validity of the Cox proportional hazards model assumptions, with all global and individual-level p-values >0.05 (Supplementary Table 9) and no systematic temporal trend in residual diagnostic plots (Supplementary Figure 7). Third, additional adjustment for eight hematological and biochemical markers (including WBC, CRP, serum creatinine, and uric acid) resulted in minimal changes to HR estimates (magnitude of change <0.02) and no attenuation of statistical significance (Supplementary Table 10), ruling out residual confounding from these factors. Taken together, these analyses confirmed that the positive associations between the stress–metabolism synergistic indices and CMM risk were highly robust to variations in analytical approach, model specification, and covariate adjustment.
Discussion
In this 9-year nationwide prospective cohort of 4019 community-dwelling Chinese adults, we examined the association between the SHR and incident CMM. The baseline SHR was positively and linearly associated with incident CMM in fully adjusted models, with no threshold effect observed in RCS analyses. Longitudinal SHR trajectories during the period from 2011 to 2015 were independently linked to subsequent CMM risk, with participants in the moderate-increasing SHR group showing an approximate twofold higher CMM risk versus those with persistently low-stable SHR. Composite indices integrating the SHR with chronic metabolic dysregulation markers, particularly the SHR–eGDR index, had stronger associations with CMM and enhanced predictive performance compared with the SHR alone, supporting our “stress–metabolism synergy” framework. Accelerated biological aging, long-term glycemic dyscontrol, and atherogenic dyslipidemia were identified as key mediators of the SHR–eGDR–CMM association. To our knowledge, this is the first population-based cohort study in Chinese adults evaluating the prospective association of both baseline SHR and its longitudinal trajectories with incident CMM.
Previous studies have linked SHR to individual cardiometabolic outcomes, even in non-diabetic populations; however, they have not assessed its association with CMM, a condition defined by co-occurring interrelated cardiometabolic disorders with shared pathophysiological pathways.1,27–29 Our study extends this literature in two critical ways. First, we found that the SHR, a marker of acute glycemic dysregulation independent of chronic glycemic control, is associated with CMM risk. 7 This is biologically plausible; acute glucose fluctuations quantified by the SHR promote endothelial dysfunction, oxidative stress, and low-grade inflammation, core mechanisms underlying CMM component conditions. 30 Second, we observed a linear dose–response association between the SHR and CMM risk, indicating that even small SHR elevations may increase the CMM risk. Notably, the effect size of the baseline SHR on CMM is relatively modest, and the hazard for the highest quartile attenuated to marginal significance after full covariate adjustment, suggesting its role as an incremental predictor rather than a standalone dominant driver.
Nearly all prior SHR research involved single cross-sectional measurements, which cannot capture longitudinal glycemic changes. We addressed this gap using latent class growth mixture modeling to characterize SHR trajectories and found that longitudinal SHR trajectory was independently associated with CMM risk, with a more robust effect than baseline SHR alone. The moderate-increasing SHR trajectory correlated with a twofold higher CMM risk, while no significant association was observed for the high-declining group. These findings highlight the incremental value of longitudinal SHR monitoring for CMM risk stratification, consistent with prior cardiometabolic biomarker research. 31
A key novel finding of this study is that the SHR–CMM association is modified by underlying metabolic status, particularly insulin resistance, the core of our “stress–metabolism synergy” hypothesis. No prior population-based study in Chinese community-dwelling adults has evaluated the synergistic interaction between acute glycemic stress and chronic metabolic dysregulation on CMM risk. The SHR–eGDR index, integrating the SHR with a validated non-invasive insulin sensitivity marker, demonstrated a favorable discriminative capacity (C-index 0.70), with significant improvements in risk reclassification and clinical net benefit versus SHR alone. 32 Mechanistically, insulin resistance—the core feature of metabolic syndrome—may amplify the adverse effects of acute glucose fluctuations by impairing endothelial insulin signaling, increasing oxidative stress and systemic inflammation, and promoting a proatherogenic lipid profile. These processes can create a self-reinforcing cycle that drives the development of multiple cardiometabolic disorders. 33 We observed a CMM risk threshold for SHR–eGDR above 0.10 and a stronger association in participants without baseline hypertension, supporting its value for primordial cardiovascular prevention. Exploratory mediation analyses revealed that accelerated biological aging had the strongest mediating effect, with no prior study reporting this role; acute glucose fluctuations and insulin resistance may synergistically promote aging hallmarks, established CMM risk factors.24,34,35 Long-term glycemic dyscontrol and atherogenic dyslipidemia also explained smaller but significant mediation effects. 16
Several methodological constraints regarding the SHR–eGDR index warrant cautious interpretation. First, a degree of conceptual circularity and statistical reinforcement exists, as constituent components (such as HbA1c and hypertension) overlap among the exposure formulas, baseline mediators, and components defining the incident CMM outcome. This mathematical pre-positioning partly accounts for the enhanced predictive performance. Nevertheless, collinearity diagnostics demonstrated no severe statistical distortion, with the Generalized Variance Inflation Factor for SHR–eGDR being merely 2.213 (
Our findings have actionable implications aligned with China's cardiovascular disease prevention guidelines. 4 The SHR and SHR–eGDR index are calculated using routine clinical measurements, making them low-cost tools for CMM risk stratification in Chinese primary care, especially in low-resource settings. 4 Longitudinal SHR monitoring can identify high-risk individuals (even those with moderate baseline SHR and a rising trajectory) for early lifestyle interventions proven to reduce cardiometabolic risk. 36 Additionally, our data highlight the need to address combined acute glycemic stress and metabolic dysregulation, rather than isolated risk factors, for CMM prevention.
Limitations of this study, aligned with the Strengthening the Reporting of Observational Studies in Epidemiology (STROBE) guidelines, include several key methodological constraints. 37 First, the extensive exclusion of participants due to missing blood biomarkers at either Wave 1 or Wave 3 reduced our final sample to 4019 individuals, introducing a potential selection bias. This data attrition reflects the conditional compliance with phlebotomy within the CHARLS design. Because individuals who completed blood sampling across multiple waves are frequently healthier, younger, or more compliant, a potential “healthy survivor effect” cannot be ruled out. Methodologically, such selection bias typically shifts observed HRs toward the null, meaning our findings likely represent conservative estimates of the true association. To statistically counteract this imbalance, major demographic predictors of cohort attrition (such as age, sex, education, and residency) were rigorously adjusted for in our multivariable Cox models. Second, the standard definition of CMM aggregates heterogeneous disease combinations involving distinct pathophysiological mechanisms. Although the SHR acts as a systemic driver of endothelial damage, its predictive strength may vary across distinct disease clusters (e.g. metabolic versus macrovascular dyads), which warrants further sub-phenotype analyses in future investigations. Third, due to data availability constraints in the CHARLS cohort, long-term SHR trajectories were modeled using only two measurement waves (2011 and 2015). Consequently, these patterns capture annualized linear rates of change rather than true multipoint, nonlinear trajectories, making the analysis susceptible to short-term biological fluctuations or regression to the mean. This structural constraint also resulted in a highly unbalanced class distribution where the “moderate-increasing” subgroup comprised merely 1.2% of the total cohort (N = 47). Although the underlying LCGM demonstrated exceptional classification cleanliness (entropy = 0.982, APP = 88.04% for this small group), the limited sample size inherently constrained statistical precision and widened the CIs. These trajectory findings must therefore be interpreted cautiously as hypothesis-generating and mandate validation in cohorts with denser longitudinal data. Fourth, outcome ascertainment relied primarily on self-reported physician diagnoses, introducing risks of underdiagnosis and non-differential misclassification bias. Although this approach was mitigated by cross-referencing with objective medication records using a method validated in prior CHARLS-based research, the true incidence of early-stage or asymptomatic CMM components might still have been underestimated.38,39 Fifth, since the exposure indices and metabolic mediators were captured concurrently at baseline, the mediation analysis lacks strict temporal ordering and cannot confirm causal directions. It should be viewed strictly as a statistical decomposition of shared metabolic variance, and future Mendelian randomization studies are required to establish causality. 40 Finally, our findings may not be generalizable to non-community-dwelling or non-Chinese populations, and residual confounding cannot be entirely excluded despite comprehensive multivariate adjustment.
Conclusion
Baseline SHR and its longitudinal trajectories demonstrated incremental predictive value for incident CMM among community-dwelling middle-aged and older Chinese adults. The SHR–eGDR index, integrating acute glycemic stress and chronic insulin resistance synergy, showed improved CMM predictive performance versus the SHR alone, with the association partially explained by accelerated biological aging, glycemic dyscontrol, and atherogenic dyslipidemia. These findings provide a potential, low-cost framework for CMM risk stratification in Chinese primary care, while advancing understanding of CMM pathogenesis. The clinical utility of these composite indices remains moderate and strictly necessitates rigorous external validation in independent, non-Chinese cohorts before clinical implementation.
Supplemental Material
sj-docx-1-imr-10.1177_03000605261465269 - Supplemental material for Stress–hyperglycemia ratio, its longitudinal trajectories, and stress–metabolism synergy in predicting cardiometabolic multimorbidity: A nationwide prospective cohort study
Supplemental material, sj-docx-1-imr-10.1177_03000605261465269 for Stress–hyperglycemia ratio, its longitudinal trajectories, and stress–metabolism synergy in predicting cardiometabolic multimorbidity: A nationwide prospective cohort study by Qiangqiang Ma, Haohao Lei, Ming Zhang, Guanji Wu and Qingqing Li in Journal of International Medical Research
Footnotes
Acknowledgments
We are grateful to the China Health and Retirement Longitudinal Study (CHARLS) research team and the National School of Development at Peking University for designing, implementing, and maintaining the survey and making its de-identified dataset freely available for academic research.
Ethics approval
The original China Health and Retirement Longitudinal Study (CHARLS) was approved by the Biomedical Ethics Review Committee of Peking University (IRB00001052-11015); all participants provided written informed consent prior to enrollment, and all procedures in this secondary analysis study fully complied with the 1964 Helsinki Declaration and its later amendments.
Consent to participate
Not applicable.
Consent for publication
Not applicable.
Author contributions
QM: Conceptualization, drafting of the original manuscript, writing - review & editing, and primary formal data analysis. HL: Data curation, secondary formal data analysis, and participation in drafting the original manuscript. MZ: Data visualization, and contribution to manuscript review and editing. GW: Manuscript review and revision, data curation, and software technical support. QL: Manuscript review and editing, and study supervision and process management. All authors have read and approved the final submitted version of the manuscript and agree to be accountable for all aspects of the work in ensuring that questions related to the accuracy or integrity of any part of the work are appropriately investigated and resolved.
Funding
The authors received no financial support for the research, authorship, and/or publication of this article.
Declaration of conflicting interests
The authors declare no potential conflicts of interest with respect to the research, authorship, and/or publication of this article.
Data availability
The datasets analyzed in this study are derived from the prospective, nationally representative China Health and Retirement Longitudinal Study (CHARLS) hosted by Peking University, with de-identified data publicly accessible to academic researchers via the official repository ( ) after free registration and submission of a brief research proposal.
Supplemental material
Supplemental material for this article is available online.
References
Supplementary Material
Please find the following supplemental material available below.
For Open Access articles published under a Creative Commons License, all supplemental material carries the same license as the article it is associated with.
For non-Open Access articles published, all supplemental material carries a non-exclusive license, and permission requests for re-use of supplemental material or any part of supplemental material shall be sent directly to the copyright owner as specified in the copyright notice associated with the article.
