






Abstract
Introduction
Obesity and osteoporosis are important and common global health problems because of their increasing prevalence and significant impact on mortality and morbidity. The relationship between obesity and bone mineral density remains controversial and is not fully understood. This study aimed to investigate the saturation effect of body mass index on femoral neck bone mineral density in apparently healthy older Syrians adults.
Methods
This cross-sectional study analyzed data from 170 apparently healthy Syrian adults (both males and females) aged ≥50 years. Height and weight were measured, and body mass index was calculated. Bone mineral density of the lumbar spine and femoral neck was assessed using dual-energy X-ray absorptiometry.
Results
The results of this study showed a statistically significant positive relationship between femoral neck bone mineral density and body mass index (p value < 0.001). This relationship was not linear; rather, a fitted curve indicated a turning point (saturation value) at which the positive effect of body mass index reached its peak and then began to gradually decrease.
Conclusions
There was a positive relationship between femoral neck bone mineral density and body mass index in both males and females, with a saturation effect of body mass index on femoral neck bone mineral density. The body mass index saturation value was 30.5 kg/m2 in apparently healthy older Syrian adults.
Introduction
Osteoporosis and obesity are two serious and complex worldwide health issues. 1 Osteoporosis is the most common metabolic bone disease, 2 characterized by low bone mass and microarchitectural deterioration. 3 It is often silent until complicated by fracture, 4 and these fractures are a significant cause of morbidity and mortality, resulting in an enormous economic cost to the health care system. 5
Dual-energy x-ray absorptiometry (DXA) of the lumbar spine and proximal femur (hip) provides accurate and reproducible bone mineral density (BMD) measurements. 6 BMD testing is the gold standard for diagnosing osteoporosis. 7
BMD is classified as normal when the T-score is ≥−1 standard deviation (SD) compared with the mean value of healthy young adults, low bone mass (osteopenia) when the T-score is between −1 and −2.5 SD, and osteoporosis when the T-score is ≤ −2.5 SD, based on the World Health Organization (WHO) diagnostic classification.4–8
Obesity is a medical condition of excessive fat accumulation that leads to negative effects on health. 9 The WHO defines overweight as a body mass index (BMI) of 25.0–29.9 kg/m2 and obesity as a BMI ≥ 30.0 kg/m2 in adults. 10
The association between bone tissue and obesity is complex and not fully understood. Obesity increases the levels of leptin, estrogens, and insulin, which play important roles in promoting bone formation and reducing bone resorption, therefore, protecting bone.11,12 At the same time, obesity is associated with low-grade systemic inflammation, which may impair bone formation through the upregulation of pro-inflammatory cytokines (interleukin-6 and tumor necrosis factor-α). 13
This study aimed to investigate the relationship between BMI and femoral neck BMD and the saturation effect of BMI on femoral neck BMD in apparently healthy older Syrian adults.
Methods
Study design and participants
A cross-sectional study was conducted between March 2023 and March 2024 and included 170 apparently healthy older Syrian adults who attended the bone densitometry clinic at the National University Hospital in Damascus. The sample size of 170 participants, including both males and females, was determined based on a sample size calculation, 14 with a 95% confidence interval, a predictive value of 0.05, and a margin of error of 5%.
Inclusion criteria
Apparently healthy males and females aged ≥50 years (individuals with no medical history, no chronic medication use, and normal clinical and laboratory findings) who visited the bone densitometry clinic at the National University Hospital in Damascus.
Exclusion criteria
The exclusion criteria were as follows: (a) Individuals with any type of cancer; (b) individuals with a history of taking medications that affect BMD measurements, such as corticosteroids, bisphosphonates, tamoxifen, proton pump inhibitors, anticoagulants; (c) females with early ovarian failure; and (d) individuals with conditions affecting bone density, such as rheumatoid arthritis, hyperparathyroidism, hyperthyroidism, end-stage kidney disease, liver failure, diabetes mellitus.
Data collection
This study received approval from the hospital's Ethics Committee in accordance with the Helsinki Declaration of 1975, as revised in 2024. Written informed consent was obtained from all patients participating in the study, and all patients’ information was deidentified. The reporting of this study conforms to the Strengthening the Reporting of Observational Studies in Epidemiology (STROBE) guidelines. 15
Data collection included demographic variables (sex, age, physical activity (walking/week), smoking, alcohol consumption, and employment), menopause duration (females), and personal habits.
BMD was measured centrally for all participants using DXA of the lumbar spine and femoral neck by the device located in the bone densitometry clinic at the National University Hospital in Damascus: Discovery Wi (S/N 80058) scan (Hologic, Inc., Bedford, MA, USA).
The results were recorded as BMD in g/cm2, and the diagnosis was made based on the WHO recommendation according to T-score. Participants were then divided into three groups: normal BMD, osteopenia, and osteoporosis. 4
Weight was measured in kilograms; height in meters, and BMI was calculated by dividing weight in kilograms by the square of height in meters. These measurements were taken in light clothing and no shoes using the same scale (Seca, Germany).
Participants were then classified according to BMI into three groups based on the WHO recommendations 9 : normal weight (BMI 18.5–24.9 kg/m2), overweight (BMI 25.0–29.9 kg/m2), and obesity (BMI ≥ 30.0 kg/m2).
The following analyses (complete blood count, Creatinine, Alanine transaminase, Glucose, Calcium, Phosphorus, and Albumin) were performed for all participants and were all standard.
Statistical analysis
Descriptive and analytical statistical methods were used, including simple and multiple linear regression models, followed by saturation effect analysis. Statistical Package for the Social Sciences version 23.0 (SPSS Inc., Chicago, IL, USA) was used for the statistical analyses. A p value <0.05 was considered statistically significant.
Results
Tables 1 and 2 present the main characteristics of the study participants, including the descriptive statistics of the demographic and qualitative variables (Table 1) and the descriptive statistics of the quantitative variables for the study sample (Table 2).
The descriptive statistics of demographic and qualitative variables for study sample.
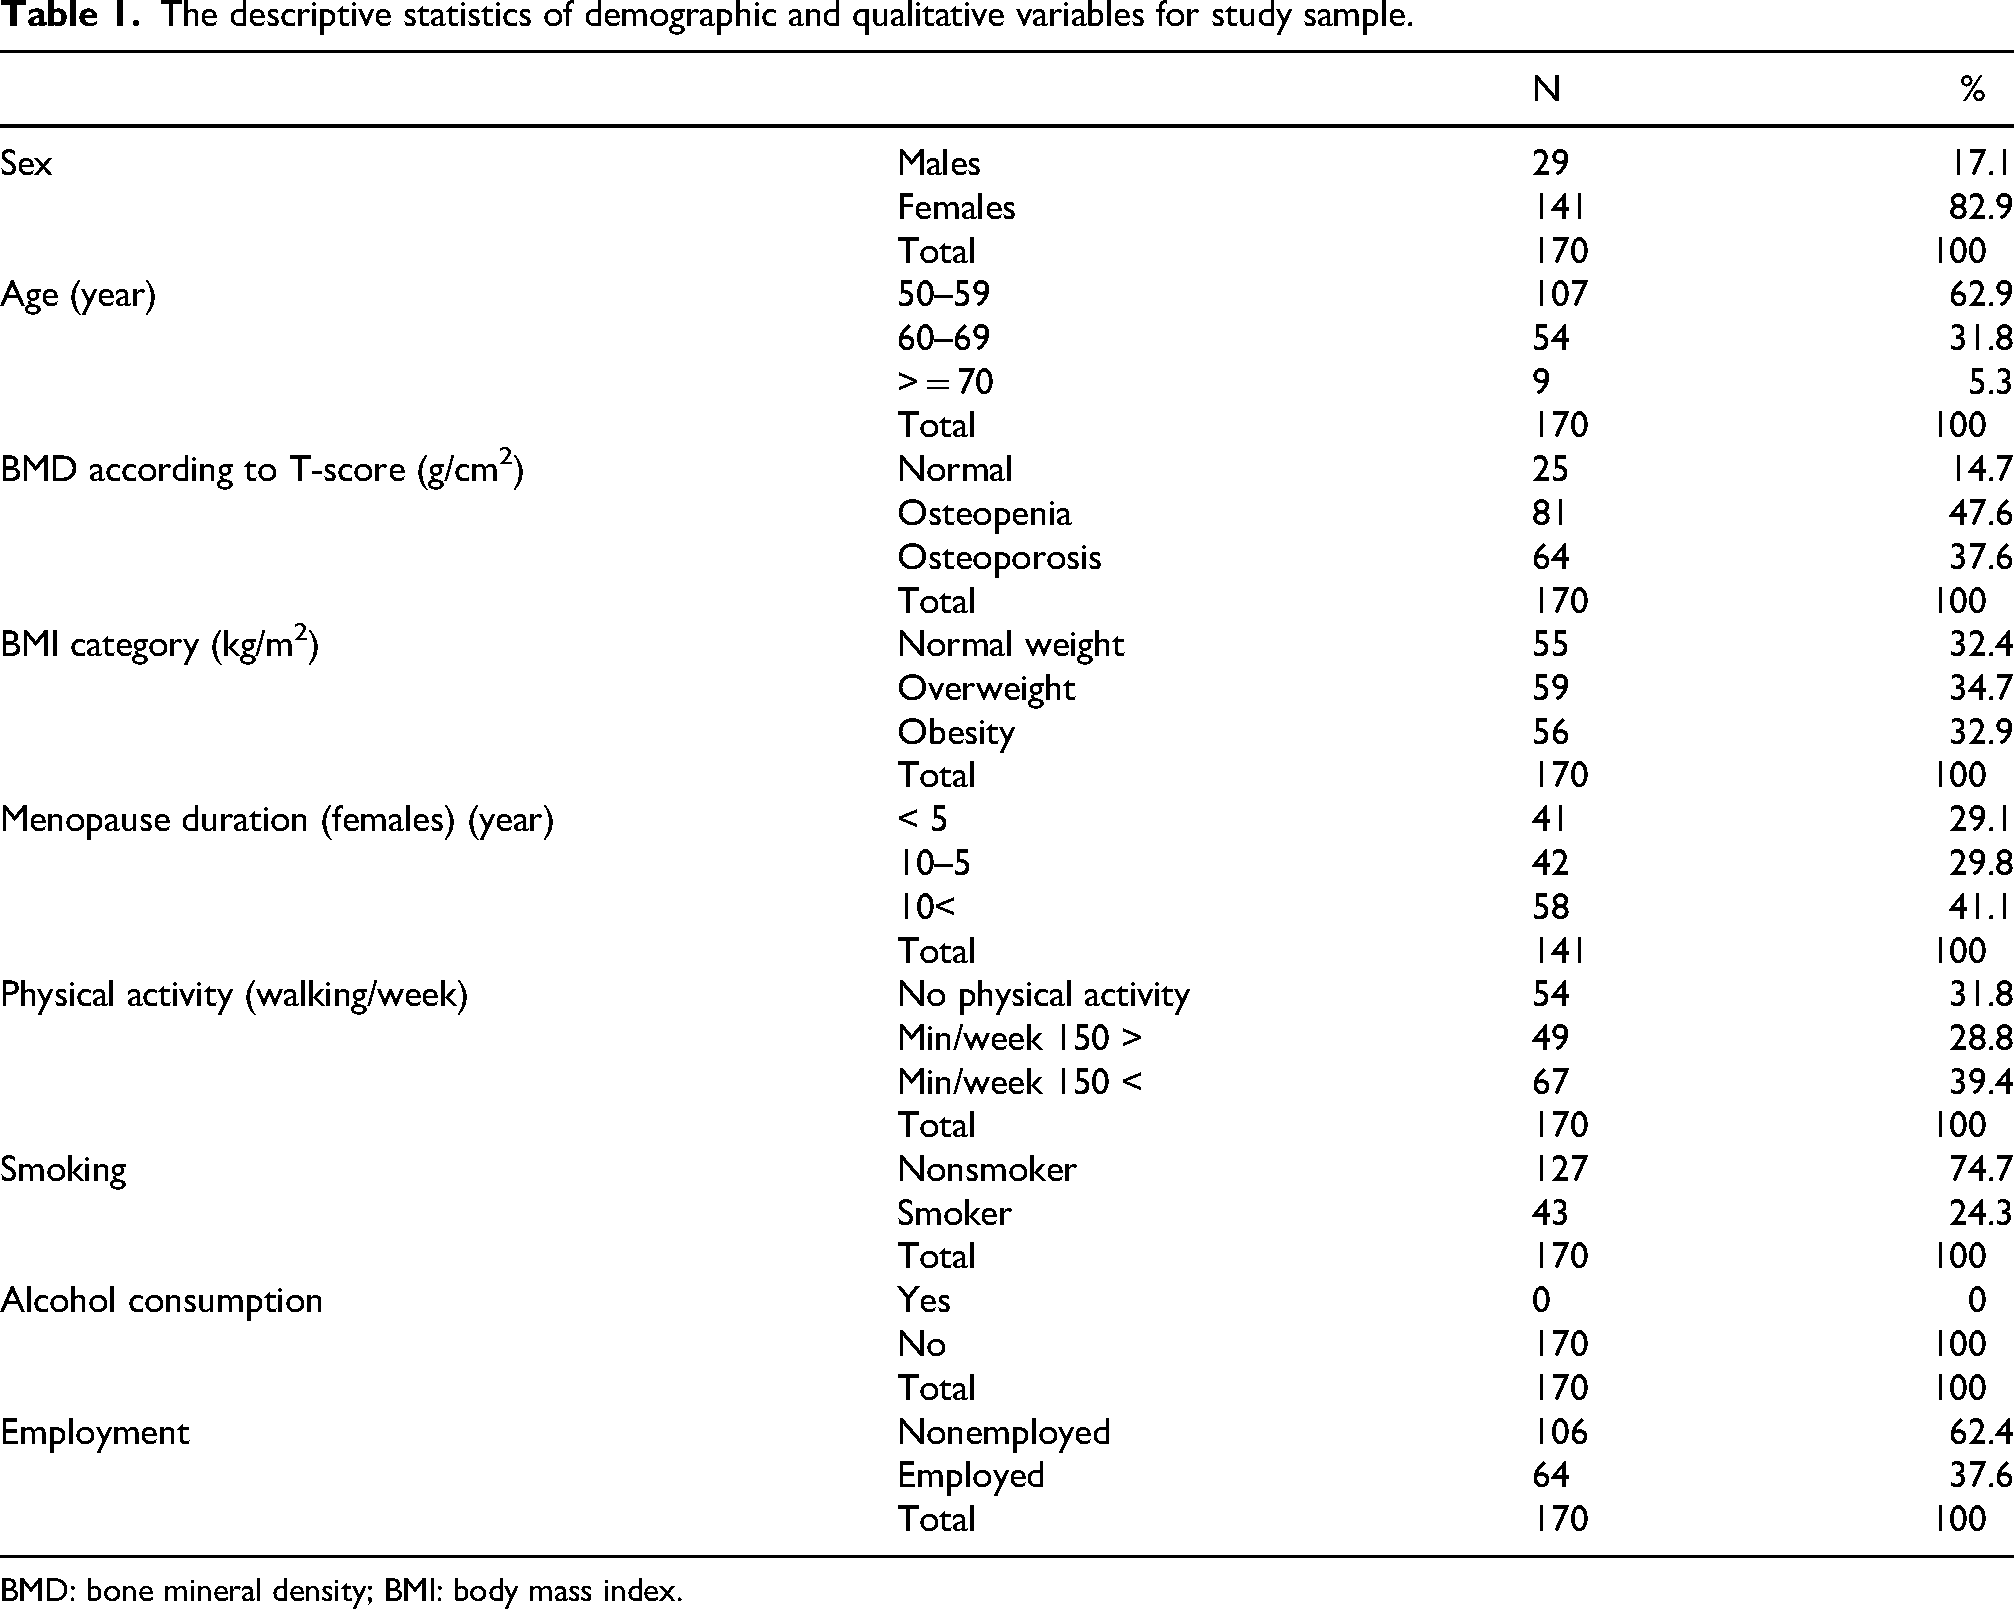
BMD: bone mineral density; BMI: body mass index.
The descriptive statistics of quantitative variables for study sample: the results of simple and multiple linear regression analysis for predicting femoral neck BMD with BMI.
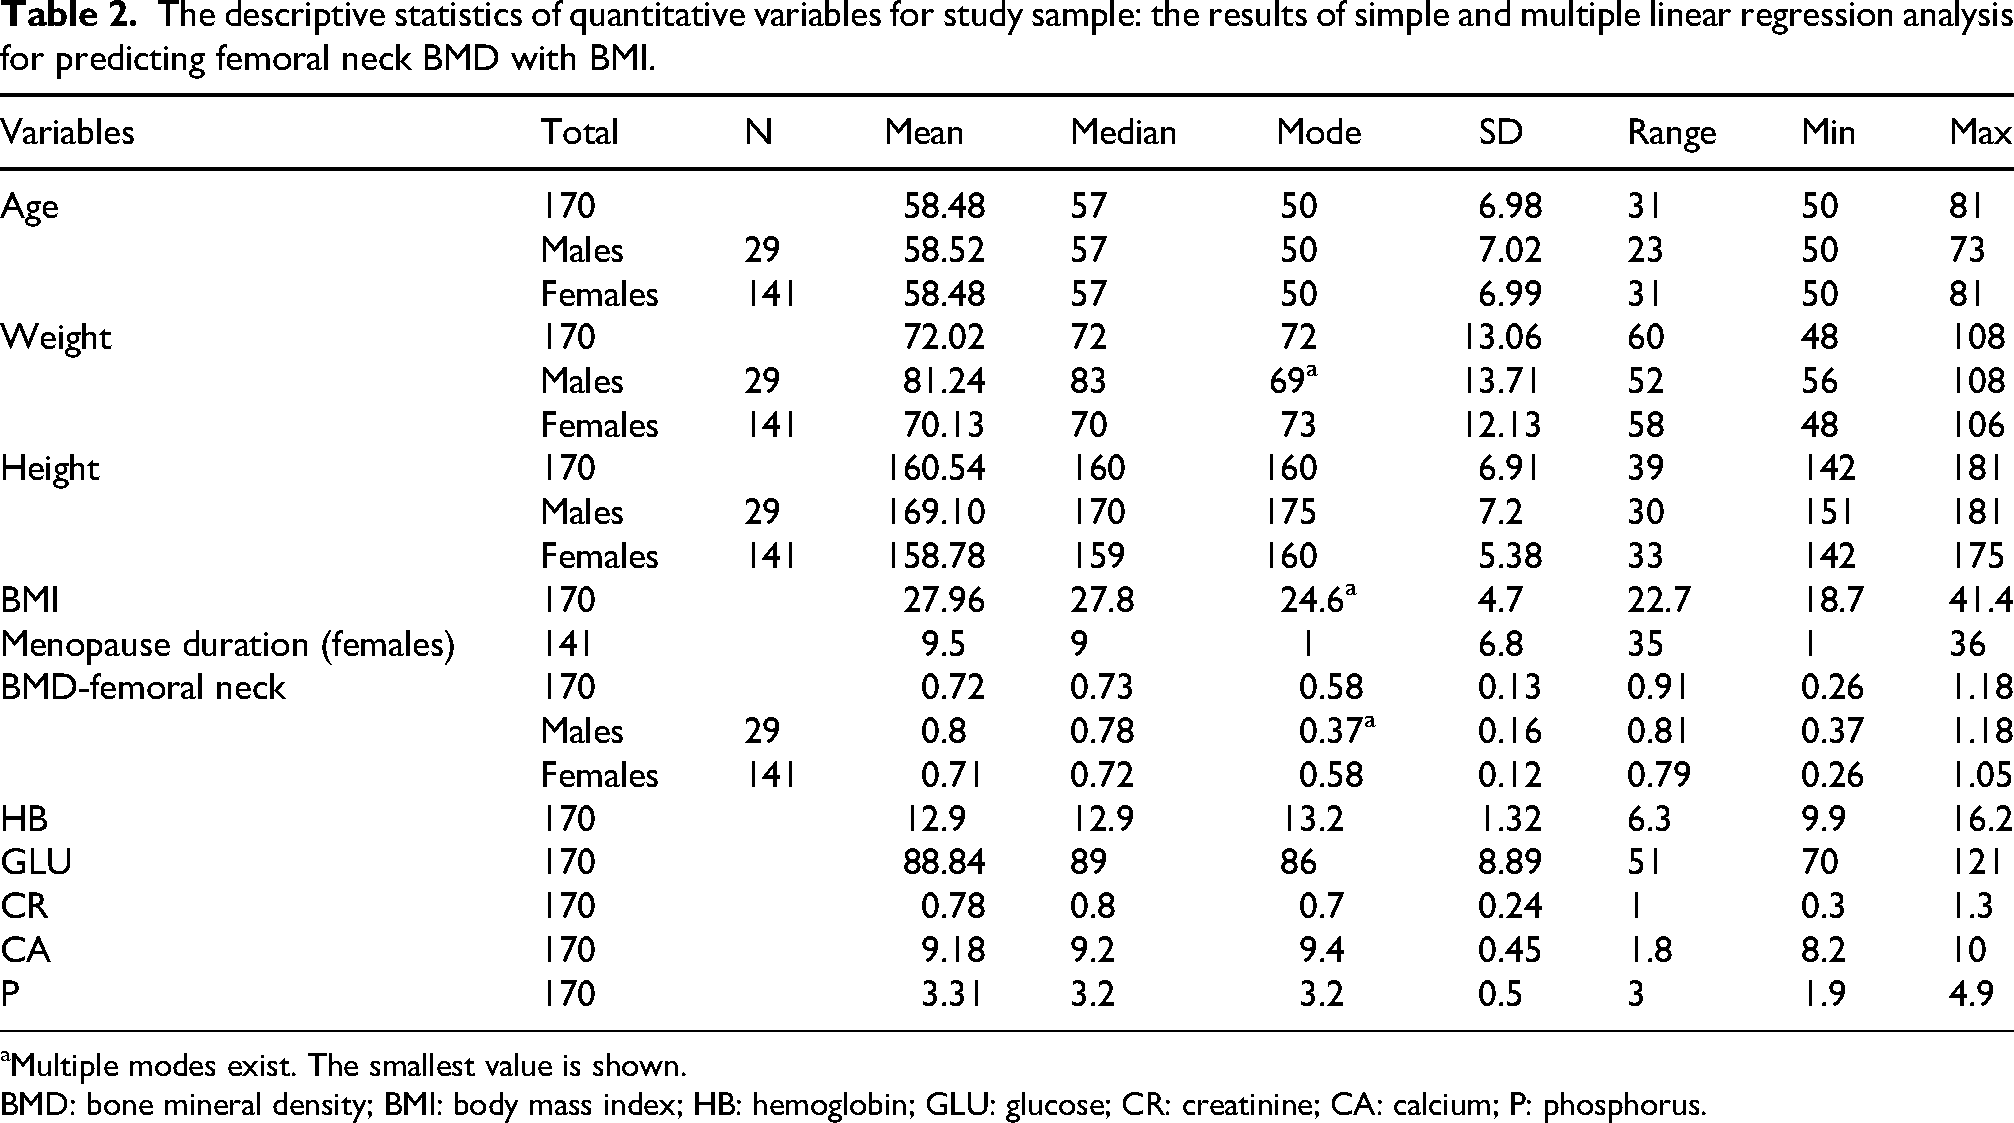
Multiple modes exist. The smallest value is shown.
BMD: bone mineral density; BMI: body mass index; HB: hemoglobin; GLU: glucose; CR: creatinine; CA: calcium; P: phosphorus.
The results of the simple and multiple linear regression analyses for predicting femoral neck BMD from BMI showed a statistically significant positive relationship between femoral neck BMD and BMI. This association remained unchanged after excluding confounders factor (sex, age, menopause duration, physical activity (weekly walking), smoking), as shown in (Table 3). After discovering a statistically significant positive relationship between femoral neck BMD and BMI, saturation effect analysis was performed. The results showed that this relationship was not linear; rather, a fitted curve indicated a turning point (saturation value) at which the positive effect of BMI on femoral neck BMD reached its peak and then began to gradually decrease. The BMI saturation value was 30.5 kg/m2 (Figure 1).
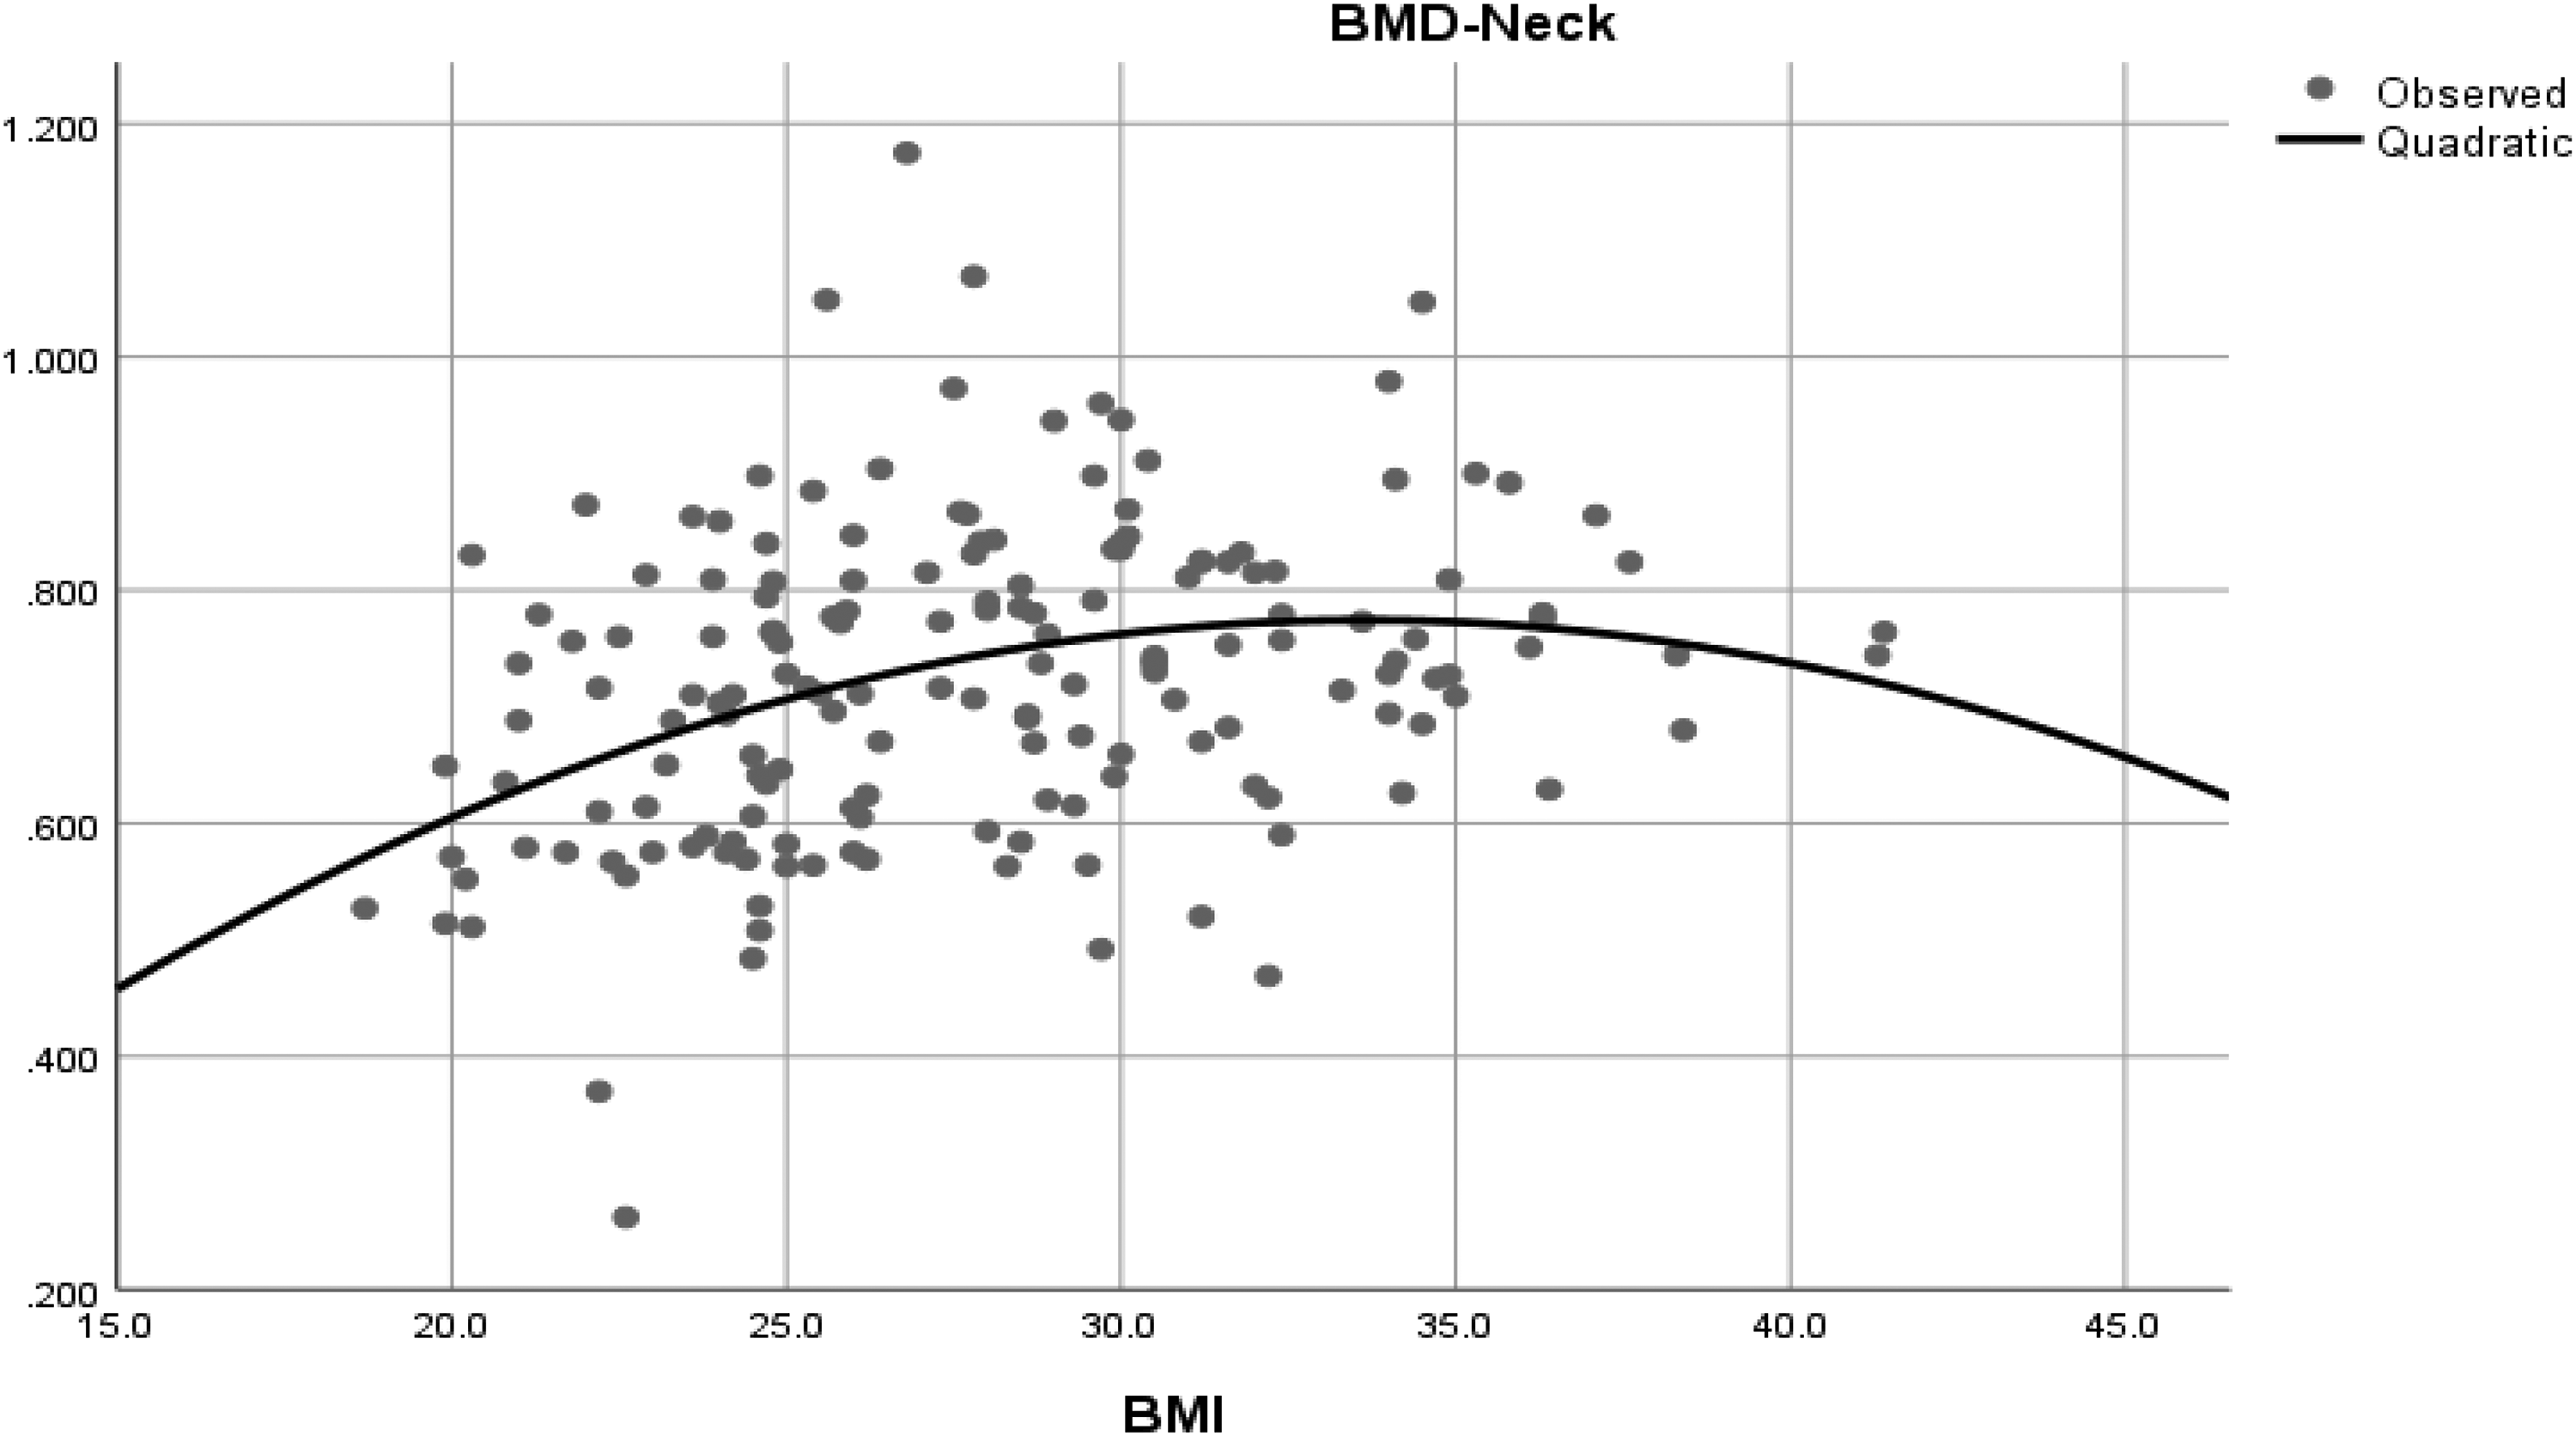
Scatter plot showing the distribution of participants according to femoral neck BMD and BMI values in the study sample. The vertical axis represents BMI (kg/m2), whereas the horizontal axis represents femoral neck BMD in g/cm2.
This table shows a statistically significant positive relationship between femoral neck BMD and BMI, and this association remains positive significant even after excluding confounding factors.
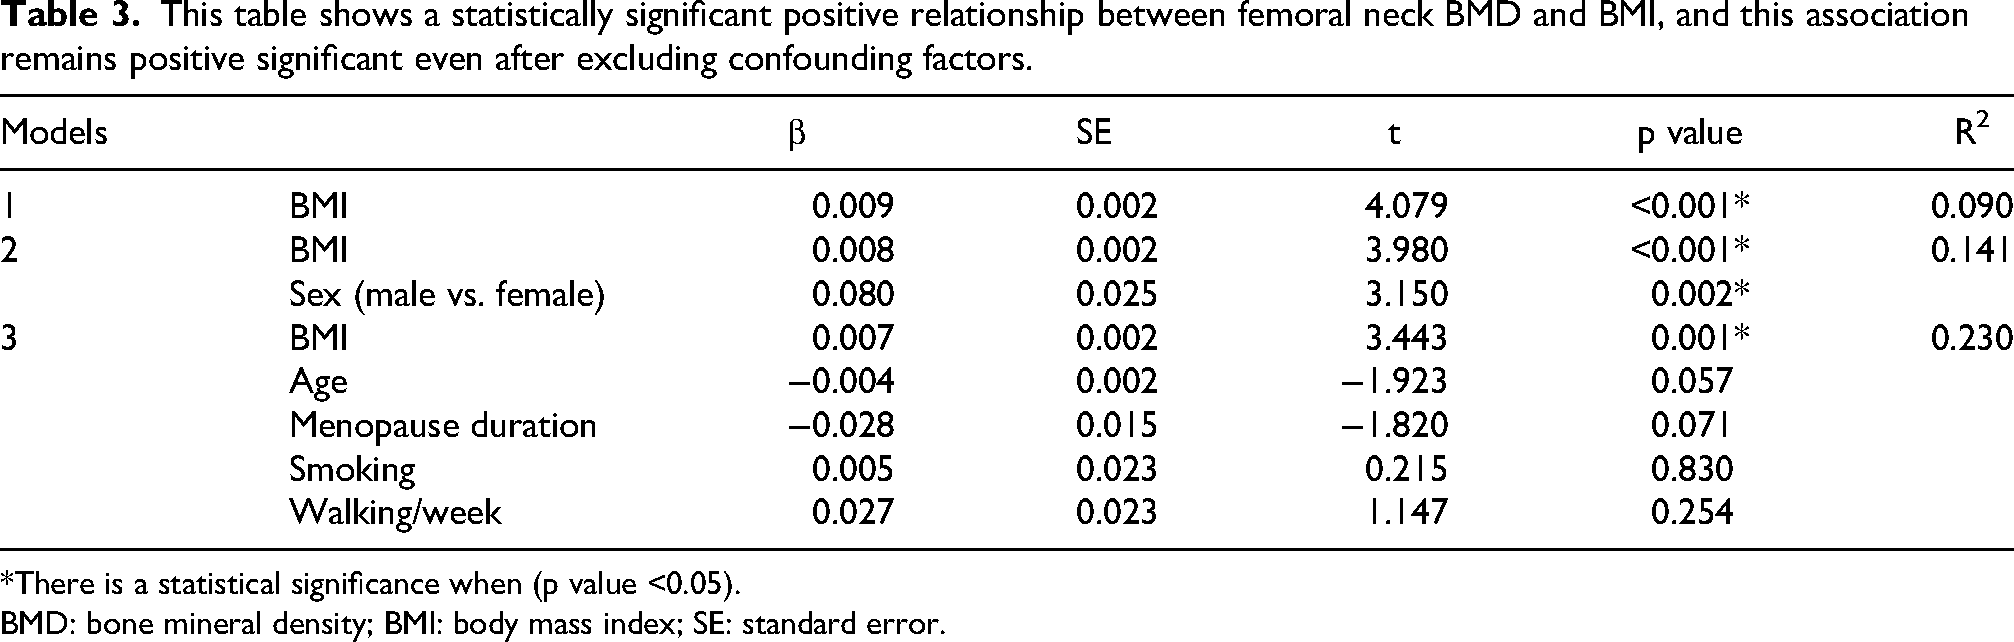
*There is a statistical significance when (p value <0.05).
BMD: bone mineral density; BMI: body mass index; SE: standard error.
Before this value, each unit increase in BMI was associated with a 0.018 g/cm2 increase in femoral neck BMD. After this value, each one-unit increase in BMI was associated with a 0.006 g/cm2 increase in femoral neck BMD.
Discussion
Our study included 170 apparently healthy Syrian adults (141 females and 29 males) aged ≥50 years. The results suggest that obesity plays an important protective role against osteoporosis.
A statistically significant positive relationship was observed between femoral neck BMD and BMI. This relationship did not differ by sex and demonstrated a saturation effect of BMI on femoral neck BMD. The BMI saturation value was 30.5 kg/m2.
Our results are consistent with those of the study by Zhang et al. 16 which was conducted in the USA in 2022 and included 2903 males and females aged ≥50 years over 4 years, and the study by Ma et al. 17 which was also conducted in the USA in 2021 and included 10,910 males and females aged ≥50 years over 10 years. Both studies showed a positive relationship between femoral neck BMD and BMI. However, our findings differed with respect to the BMI saturation value. The saturation value was 24.3 kg/m2 in the study by Zhang et al., 26.44 kg/m2 in the study by Ming et al., and it was 30.5 kg/m2 in our current study.
Our results were also consistent with those of the study by Alay et al. 18 conducted in Turkey in 2020 on 452 healthy postmenopausal females over 3 years; the study by Wu et al. 19 conducted in China in 2016 on 236 healthy postmenopausal females over 2 years; the study by Salamat et al. 11 conducted in Iran in 2016 on 5895 males and females aged 20–91 years; and the study by Fawzy et al. 20 conducted in the UAE in 2011 on 101 males and females aged 25–80 years. All of these studies showed that obesity has a protective role against osteoporosis and that there is a positive relationship between BMD and BMI.
However, the results of our study differ from those of several international studies reporting that obesity is associated with decreased BMD and an increased risk of fractures, including the study by Kim et al. 21 conducted in Korea in 2010 on 907 healthy females aged 60–70 years; the study by Greco et al. 22 conducted in Italy in 2011 on 398 males and females; and the study by Nielson et al. 23 conducted in the USA in 2010 on 5995 healthy males over 2 years.
In contrast, the study by Chan et al. 24 conducted in Australia in 2014 on 3550 males and females ≥60 years over a 22-year follow-up period, indicated that BMI had no direct or significant effect on fracture risk mediated by BMD in either males or females. 24
The discrepancy between the results of our study and those of some international studies may be explained by differences in study design, study variables, study populations, sample size, and ethnic, genetic, and geographic characteristics, all of which may influence BMD measurements. Environmental factors, such as sunlight exposure, clothing style, and sunscreen use; dietary factors, such as calcium and vitamin D intake; and behavioral factors, such as smoking, alcohol consumption, and physical activity, may also contribute. Other unidentified factors may vary among populations.
Finally, we hope that future studies will incorporate artificial intelligence and machine learning applications to develop predictive models for factors affecting BMD and the diagnosis of osteoporosis. For example, Carvalho et al. developed a model in 2025 using data from 7924 males and females that incorporated factors such as age, arm muscle circumference, body weight, sex, and BMI to predict the risk of osteoporosis. 25
Similarly, Carvalho et al. conducted another study in Portugal in 2024 involving 3132 males and females and developed a highly accurate model for predicting 1-year mortality after orthopedic hospitalization. The model demonstrated the important roles of age, emergency admission date/time, and the interval before surgical intervention in predicting mortality following orthopedic surgery. 26
In future clinical applications, phototherapy may serve as a noninvasive and safe therapeutic modality for obesity management, targeting an optimal BMI range of 30–35 kg/m2 to enhance BMD, as demonstrated in the study by Zhang et al. 27
One limitation of this study is the disproportionately small number of male participants compared with female participants. This imbalance was likely a consequence of the conflict in Syria, where recruiting apparently healthy individuals aged ≥50 years is challenging for both men and women. In addition, the inclusion of only a single center in Damascus University limits the generalizability of the results.
Future studies may further clarify the relationship between obesity and BMD by using agnostic statistical measures, such as Spearman’s rho, Kendall’s tau, mutual information, and total correlation, as highlighted by Carvalho et al. 28
Conclusion
A statistically significant positive relationship was observed between femoral neck BMD and BMI. This relationship was not linear; rather, a fitted curve indicated a turning point (saturation value) at which the positive effect of BMI on femoral neck BMD reached its peak and then gradually decreased. Maintaining a BMI within the range of 30–31 kg/m2 (30.5 kg/m2) may be associated with more favorable femoral neck BMD outcomes in individuals with obesity.
Supplemental Material
sj-docx-1-imr-10.1177_03000605261467848 - Supplemental material for The saturation effect of body mass index on femoral neck bone mineral density in a sample of apparently healthy older Syrians: A cross-sectional study
Supplemental material, sj-docx-1-imr-10.1177_03000605261467848 for The saturation effect of body mass index on femoral neck bone mineral density in a sample of apparently healthy older Syrians: A cross-sectional study by Raghad Alkhalaf, Yousef Saffaf and Zaynab Alourfi in Journal of International Medical Research
Footnotes
Acknowledgments
None.

Ethics approval and consent to participate
The Ethical Committee of the Faculty of Medicine at Damascus University, Syria, approved this study. All participants provided written informed consent to participate voluntarily before inclusion in the study. The study design and conduct were aligned with the ethical principles of the Declaration of Helsinki. 29
Consent for publication
Written informed consent was obtained from the patients for publication and any accompanying images. A copy of the written consent form is available for review by the Editor-in-Chief of this journal upon request.
Author contributions
Raghad Alkhalaf: Conceptualization, methodology, validation, investigation, writing – original draft, and writing – review & editing. Yousef Saffaf: Writing – original draft and writing – review & editing. Zaynab Alourfi: Writing – review & editing and supervision.
Funding
The authors received no financial support for the research, authorship, and/or publication of this article.
Declaration of conflicting interests
The authors declared no potential conflicts of interest with respect to the research, authorship, and/or publication of this article.
Availability of data and materials
The datasets used and/or analyzed during the current study are available from the corresponding author upon reasonable request.
Supplemental material
Supplemental material includes STROBE guidelines and is available online.
References
Supplementary Material
Please find the following supplemental material available below.
For Open Access articles published under a Creative Commons License, all supplemental material carries the same license as the article it is associated with.
For non-Open Access articles published, all supplemental material carries a non-exclusive license, and permission requests for re-use of supplemental material or any part of supplemental material shall be sent directly to the copyright owner as specified in the copyright notice associated with the article.
