






Abstract
Immunodeficient mouse strains are widely used in several fields of biomedical research. Despite that, no standardized system for evaluating immunodeficiency in mice currently exists, and an unbiased comparison of various immunodeficient mouse strains is difficult. The aim of our study was to develop a standardized multi-disciplinary protocol for the morpho-phenotypical assessment of immunodeficient mouse models. We selected 4 immunodeficient strains of mice (Cd40l-/-, Was-/-, Rag1 R972Q/R972Q , and Rag1-/-) on a C57BL/6J genetic background and a group of control C57BL/6J wild-type mice. The lymphoid organs were harvested, weighed, and analyzed by histology, immunohistochemistry, and flow cytometry. Hematology and bone marrow cytology were also performed. The main immune cell populations were investigated, including lymphocytes, monocytes/macrophages, neutrophils, and natural killer cells. Relative organ weights were lower in the strains with the highest level of immunodeficiency (Rag1 R972Q/R972Q and Rag1-/-). Histology revealed overall lower cellularity in the same strains, particularly in Rag1-/- mice. Tissue spatial distributions of the immune cell populations were confirmed by immunohistochemistry, while flow cytometry allowed for their relative quantification. Likewise, hematology detected moderate lymphopenia in the Rag1 R972Q/R972Q mice and more severe lymphopenia in Rag1-/- mice. Our protocol has proven itself effective for the morpho-phenotypical assessment of the immunodeficient mouse models under investigation and was useful in characterizing the type and severity of the defects. The different laboratory techniques were consistent in the characterization and confirmation of immunodeficiency in the different strains, providing different complementary insights.
Keywords
Immunodeficient mouse strains are widely used in biomedical research. Besides the study of their specific immunological defects as a model of human disease, immunodeficient mice find application in the fields of organ transplantation, oncology, and stem cell research and therapy.6,52 For some of these applications, the immunodeficiency of the model is not the objective of the study itself but rather the prerequisite for the establishment of a reliable and robust model. Athymic nude mice, SCID (severe combined immunodeficiency) mice, or Rag1-/- mice, for instance, can be successfully engrafted with xenogeneic human tissues without rejection, in light of their immunodeficiency.25,27,33,35,44
The immunodeficiency of these models needs to be periodically assessed and validated to guarantee optimal performance of engraftment and reliable experimental results, in order to avoid unnecessary experimental duplication. However, as previously reported by others, 51 no standardized system for evaluating immunodeficiency in mice currently exists, and an objective comparison of various immunodeficient mouse strains is therefore difficult. Ye and colleagues were the first to propose a quantitative evaluation of the immunodeficiency of mouse strains. 51 In that study, they evaluated the outcome of tumor engraftment in 6 representative immunodeficient mouse models by developing a tumor engraftment index as a method to quantify the immunodeficiency of mouse strains. 51 Nonetheless, this approach only represents an indirect evaluation of the overall immune status of the models, and it does not take into account the different components of the immune system.
The immune phenotype of a mouse with a newly discovered/induced mutation that affects the immune system typically undergoes a thorough examination by means of different methodologies. These include, among others, immunoglobulin quantification, flow cytometric (FC) analysis of the lymphoid organs, and, occasionally, histomorphology.24,32,34,37,45,47 Often, the genotypic assessment of the model is considered as the sole need to guarantee the expected immunological properties by downstream users. It is now widely acknowledged that genes are not the only factor contributing to the immune system phenotype, but several non-heritable factors are also involved.2,11,12,30,31 Therefore, the research community could benefit from a periodic assessment of the immune status of their mouse models, in order to confirm that the expected immune repertoire is maintained over time, and no unpredictable immune stimulations or changes in the immune phenotype of the models occur. The immune status evaluation is especially important in murine models carrying hypomorphic mutations (e.g., “leaky” phenotype in SCID mice) that could greatly change in different animal facilities or even over time in the same facility, depending on pathogen colonization.7,8,17 One of the most important factors is the environment. 43 It was demonstrated, for instance, that an altered light-dark cycle is associated with decreased splenic T-cells or decreased CD8+ and CD4+ cells in the thymus and lymph nodes.28,38,43,46 Microbiota is another relevant factor in the modulation of the immune system. 43 Although companies operating mouse breeding colonies can guarantee environments free from certain pathogenic or commensal organisms, strain-associated and vendor-dependent differences in the gut microflora of laboratory mice have been identified and are implicated in the variability of research results.13,14,21,23,26,43,49,50 Even the most advanced genetic engineering strategies do not come without pitfalls in terms of immune effects that may have unintended or unexpected consequences. The recent and sophisticated strategies for genome editing, such as the CRISPR/Cas9 system, have demonstrated experimental evidence of influencing the immune system.18,29,41,43 To support that, mice have demonstrated pre-existing adaptive immunity to Cas9 homologues expressed by common bacteria such as Staphylococcus aureus and Streptococcus pyogenes.18,29,43
The objective of our study was to develop a standardized multi-disciplinary protocol for the morpho-phenotypical assessment of immunodeficient mouse models that is aimed at becoming part of the periodic “quality assessment” of laboratories that work with these models. This protocol is also designed to investigate the phenotypes of strains in which unexpected immune alterations might be present. At the same time, this study was designed to evaluate the effectiveness of various laboratory techniques commonly used to investigate the type and severity of expected immunological deficiencies in mouse models.
Materials and Methods
Mice
A total of 5 mice per immunodeficient strain (Cd40l-/-, 45 Was-/-, 53 Rag1 R972Q/R972Q , 37 and Rag1-/-34) composed of a mix of males and females, 14 to 21 weeks of age, raised on the C57BL/6J genetic background, along with 5 control C57BL/6J wild-type (WT) mice were selected. Cd40l-/-mice (B6.129S2-Cd40lg tm1Imx /J) and Rag1-/- (B6.129S7-Rag1 tm1Mom /J) mice were purchased from The Jackson Laboratory. Was-/- and Rag1 R972Q/R972Q mice were previously described.37,53 The 4 strains were selected based on the type and severity of their immunodeficiency.
Cd40l-/-
Cd40l-/- mice recapitulate the X-linked hyper-IgM syndrome of humans, which is characterized by lack of expression of a functional CD40 ligand by T-cells. 45 Cd40l-/- mice display selective deficiencies in humoral immunity but contain normal percentages of B- and T-cell subpopulations. 45
Was-/-
Was-/- mice recapitulate Wiskott-Aldrich syndrome (WAS) resulting from mutations in the WASP gene encoding a cytoplasmic protein implicated in regulating the actin cytoskeleton. 53 The WASP-deficient mice have decreased peripheral lymphocyte and platelet numbers and have impaired T-cell proliferation in response to anti-CD3 stimulation and B-cell immunedysregulation.10,53
Rag1R972Q/R972Q
Rag1 R972Q/R972Q mice carry hypomorphic Rag1 mutations, which impair but do not abolish the V(D)J recombination activation of the gene, allowing some residual T- and B-cell development, along with persistence of some naive cells. 37 Depending on the level of residual function of the Rag1 gene, hypomorphic Rag1 mice are a model of Omenn syndrome and of the combined immunodeficiency associated with granulomas and/or autoimmunity. 37 This latter condition was the one specifically recapitulated by the strain used in our study.
Rag1-/-
The Rag1-/- mouse is one of the most immunodeficient mouse strain, and unquestionably the one with the most severe immunodeficiency in our study. Rag1-/- mice have a mutation in the V(D)J recombination activation gene Rag1, that leads to an arrest of B- and T-cell differentiation at an early stage, and a general lack of mature B- and T-cells. 34 Their immunological repertoire can be considered to be similar to that of SCID mice but without the leaking phenotype.9,34
All the mice were maintained in specific pathogen-free conditions at the San Raffaele Scientific Institute animal research facility in an individually ventilated caging system (GM500, Tecniplast S.p.a, Buguggiate, Italy) and were untreated control animals as part of other experiments. Environmental conditions were set at 20–24°C, a 12-hour/12-hour light/dark cycle, relative humidity of 45% to 65%, 75 air exchanges per hour in the individually ventilated caging, and 18 air exchanges per hour in the room. Mice were allowed to feed ad libitum, autoclaved standard rodent chow (SDS VRF1 (P) rodent maintenance diet) and were provided with filtered autoclaved water. The cages contained 150 g of autoclaved corncob bedding (Follador, Treviso, Italy). Periodic health monitoring was carried out in accordance with the Federation of European Laboratory Animal Science Associations recommendations. 42 More specifically, the following agents were excluded from all the colonies: minute virus of mice, mouse parvovirus, mouse hepatitis virus, pneumonia virus of mice, reovirus type 3, Sendai virus, Theiler’s virus, mouse rotavirus, ectromelia virus, Hantaan virus, lactic dehydrogenase virus, lymphocytic choriomeningitis virus, mouse adenovirus, K virus, polyoma virus, mouse thymic virus, mouse cytomegalovirus, mouse norovirus, Bordetella bronchiseptica, Citrobacter rodentium, Clostridium piliforme, Corynebacterium kutscheri, Mycoplasma spp., Klebsiella pneumoniae, Pasteurella spp., Salmonella spp., Streptobacillus moniliformis, Streptococci b-haemolytic, Streptococcus pneumoniae, Helicobacter spp., Carbacillus, ectoparasites, endoparasites, pathogen protozoa, and Encephalitozoon cuniculi. The Rag1-/- colony was additionally monitored for Corynebacterium bovis, Klebsiella spp., Staphilococcus aureus, Proteus spp., Pseudomonas aeruginosa, Pneumocystis carinii, and non-pathogen protozoa. All the animal procedures were designed and performed with the approval of the Institutional Animal Care and Use Committee of the San Raffaele Hospital (IACUC 818, IACUC 1125, IACUC 1024, LCIM 6E) and approved by the Ministry of Health and local authorities according to Italian law.
Sampling
The total body weight for each mouse was recorded at the time of tissue sampling. Peripheral blood from the tail vein was collected in Eppendorf tubes containing 15 μl of EDTA 0.15 M (Invitrogen, Life Technlogies, Carlsbad, California). Blood smears were also prepared. Mice were then euthanized by CO2 inhalation. Spleens and thymuses were harvested, and the organ weights were measured. Relative organ weights (%) were calculated as wet organ weight/total body weight. The following lymphoid organs were collected in Eppendorf tubes containing phosphate-buffered saline supplemented with 2% fetal bovine serum for later analysis: unilateral inguinal and axillary lymph nodes, half spleen, 1 thymic lobe, and unilateral femoral bone marrow. Bone marrow smears were also prepared. The remaining organs, including unilateral inguinal and axillary lymph nodes, half spleen, 1 thymic lobe, and sternal bone marrow, were fixed in 10% neutral-buffered formalin for 48 hours and washed and maintained in 70% ethanol until processing. After fixation, the sterna were decalcified in 10% EDTA for 10 days.
Hematology
A complete blood count (CBC) was performed on a laser-based hematology analyzer (IDEXX Procyte Dx, Westbrook, Maine). Differential leukocyte counts provided by the instrument were verified through microscopic evaluation on May-Grunwald Giemsa-stained smears. Bone marrow smears were stained with May-Grunwald Giemsa and microscopically analyzed in order to estimate the myeloid:erythroid ratio and the percentage of lymphocytes. All counts were performed by 2 independent blind operators counting at least 300 nucleated cells. The percentage of lymphocytes on the total number of counted cells was also recorded.
Flow Cytometry
Flow cytometric analysis of lymphoid and myeloid subpopulations was performed on all solid organs listed above, peripheral blood, and bone marrow. Single-cell suspensions were prepared from the lymphoid organs using 70 μm cell strainers and resuspended in phosphate-buffered saline supplemented with 2% fetal bovine serum for FC analysis. For peripheral blood and bone marrow, red blood cell lysis was performed with ACK lysing buffer (Gibco, Thermo Fisher Scientific, Fremont, California). Cells were counted using the Thermo Scientific Countess 3 Automated Cell Counter (Thermo Fisher Scientific, Fremont, California) and trypan blue, and the absolute number of cells recovered from each tissue of each mouse was recorded and used for the calculation of cell numbers to be analyzed via FC. The FC analysis was performed on a Bricyte E6 flow cytometer (Mindray, Shenzhen, China), equipped with 2 lasers and 4 fluorescence channels, and analyzed with MRFlow Software (Mindray, Shenzhen, China). The following antibodies were used for the labeling, with a multi-color approach: Alexa Fluor 488 hamster anti-mouse CD3ε (clone 145-2C11, BD Pharmingen, Franklin Lakes, New Jersey, Cat. No. 557666), PE rat anti-mouse CD4 (clone RM4-5, BD Pharmingen, Franklin Lakes, New Jersey, Cat. No. 553049), PerCP rat anti-mouse CD8a (clone 53-6.7, BD Pharmingen, Franklin Lakes, New Jersey, Cat. No. 561092), PerCP rat anti-mouse CD45R/B220 (clone RA3-6B2, BD Pharmingen, Franklin Lakes, New Jersey, Cat. No. 561086), APC mouse anti-mouse NK-1.1 (clone PK136, Biolegend, San Diego, California, Cat. No. 108710), Alexa Fluor 647 rat anti-mouse F4/80 (clone BM8, Biolegend, San Diego, California, Cat. No. 123122), and FITC rat anti-mouse Ly-6G (clone 1A8, Biolegend, San Diego, California, Cat. No. 127606). Propidium iodide (Thermo Fisher Scientific, Fremont, California) was included in the sample preparation for FC to assess cell viability. Unlabeled cells were used as a negative control to set the level of autofluorescence. For each sample, the percentage of total nucleated cells was recorded for the following cell subsets: CD3ε+ (T-cells), CD4+ (T-helper cells), CD8+ (cytotoxic T-cells), CD4+CD8+ (double positive T-cells), CD3ε+CD4-CD8- (double negative T-cells), NK-1.1+CD3ε+ (NK T-cells), NK-1.1+CD3ε- (NK cells), Ly-6G+ (neutrophils), CD45R/B220+ (B-cells), and F4/80+ (monocytes/macrophages). For peripheral blood samples, the percentages were coupled with the total leukocyte counts obtained via hematology to calculate the absolute concentration of each cellular population.
Immunoglobulin Quantification
Immunoglobulins of class G and M (IgG and IgM) were determined using commercially available ELISA kits specific for mouse IgG and IgM (Novus Biologicals, Littleton, Colorado) according to the manufacturers’ instruction. For both the kits, intra- and inter-assay precision were lower than 8% and 10%, respectively. Briefly, serum samples were diluted 1:10 000 with the diluent buffer included in the kit. Then 50 µL of each sample or of the standard solutions provided in each kit and 50 µL of horseradish peroxidase conjugated antibody specific for mouse IgG or IgM were placed in the wells of the plates precoated with mouse IgG or with mouse IgM, respectively. Both samples and standards were run in duplicate. After incubation for 1 hour at 37°C, the plates were washed using the appropriate wash buffer, and 90 μl of TMB substrate provided with the kit were added to each well. After incubation for 20 minutes at 37°C, 50 μl of the stop solution provided with the kit (0.16 M sulfuric acid) were added to each well. Each plate was read in a plate reader spectrophotometer using a 450-nm wavelength. A 540-nm wavelength was used for background correction. The optical densities recorded in the well containing standard solutions were used to build up a standard curve according to a 4-parameter logistic model. The mean optical density obtained by duplicate readings of each sample was then plotted in the graph to obtain IgG and IgM concentration in ng/ml.
Histology and Immunohistochemistry
Formalin-fixed organs were processed automatically using the Epredia Excelsior AS tissue processor (Epredia Laboratory Products Manufacturing Co., Shanghai, China), and paraffin embedded. Four-µm-thick sections were obtained from the paraffin blocks and stained with hematoxylin and eosin. For immunohistochemistry (IHC), serial sections were labeled automatically by means of the Thermo Scientific Autostainer 480S System (Thermo Fisher Scientific, Fremont, California). Dewaxing of tissue sections and heat-induced epitope retrieval (HIER) were simultaneously performed using the Dewax and HIER Buffer H pH 9 (Thermo Fisher Scientific, Fremont, California) at boiling temperature for 40 minutes. Endogenous peroxidase was blocked with 3% H2O2 for 10 minutes at room temperature. Nonspecific protein binding was prevented with 10% normal goat or rabbit serum for 30 minutes at room temperature. Sections were incubated for 1 hour at room temperature with the following panel of primary antibodies: rat anti-mouse CD45R/B220 (1:500, clone RA3-6B2, BD Pharmingen, Franklin Lakes, New Jersey, Cat. No. 557390) for B-cells, rat anti-human CD3 (1:1000, clone CD3-12, Bio-Rad, Hercules, California, Cat. No. MCA1477) for T-cells, rabbit anti-mouse IBA1 (1:2000, polyclonal, FUJIFILM Wako Pure Chemical, Osaka, Japan, Cat. No. 019-19741) for macrophages, rat anti-mouse Ly-6G (1:2000, clone 1A8, BD Pharmingen, Franklin Lakes, New Jersey, Cat. No. 551459) for neutrophils, and goat anti-mouse NKp46/NCR1 (1:400, polyclonal, R&D Systems, Minneapolis, Minnesota, Cat. No. AF2225) for NK cells. Sections were incubated with biotinylated goat anti-rabbit (Vector Laboratories, Burlingame, California, Cat. No. BA-1000-1.5), rabbit anti-rat (Vector Laboratories, Burlingame, California, Cat. No. BA-4000-1.5), or rabbit anti-goat IgG (Vector Laboratories, Burlingame, California, Cat. No. BA-5000-1.5) diluted 1:200. Labeling was performed with Vectastain Elite ABC-Peroxidase kit (Vector Laboratories, Burlingame, California) diluted 1:150, and the reaction was visualized with Peroxidase ImmPACT DAB Substrate (Vector Laboratories, Burlingame, California). Sections were counterstained with Mayer’s hematoxylin and mounted with Micromount (Diapath, Martinengo, Italy). Internal positive controls were used. Negative controls were the same sections but without primary antibody.
Histological Evaluation and Digital Image Analysis
Hematoxylin and eosin and IHC slides were digitalized at x 20 objective (N.A. 0.75; resolution 0.46 μm/pixel) using the NanoZoomer S60 Digital Slide Scanner C13210-01 (Hamamatsu Photonics K.K., Hamamatsu, Japan) and visualized using NDP.view2 Image viewing software (Hamamatsu Photonics K.K., Hamamatsu, Japan). In digitalized hematoxylin and eosin-stained sections, lymphoid organs were evaluated for presence and cellularity of their typical structures (e.g., follicles in spleen and lymph nodes), which were classified as “normal,” “increased,” “decreased,” or “absent.” The “freehand region” tool of the software was used to outline the borders of the lymph nodes and measure their area. Whole-slide images from digitalized immunolabeled sections were exported and analyzed with ImageJ software (v1.54k, NIH, U.S.). Briefly, the region of interest of the sample was outlined using the “polygon selections” tool, the blue channel was selected for the analysis using “Image>Color>Split Channels,” the best threshold was selected using “Image>Adjust>Threshold” and applied to all the groups, and the analysis was run using “Analyze>Measure” set on “Area fraction” and “Limit to threshold,” in order to determine the percentage of positive area for each marker. An exemplification of the process of digital image analysis is shown in Supplemental Figure S1.
Statistical Analysis
Statistical analyses were performed using GraphPad Prism v8 (GraphPad Software, San Diego, California, version 8.0). Data were analyzed using the Kruskal-Wallis test followed by post hoc analysis with Dunn’s multiple comparison test. P-values < .05 were considered statistically significant.
Results
The FC results for all organs and strains are summarized in Supplemental Table S1.
Spleen
The weight of the spleen was significantly lower in Rag1-/- mice as compared to WT mice (Table 1).
Spleen and thymus relative weight in wild-type (WT) control and immunodeficient mice.

Data are shown as median value (interquartile range).
P < .05.
The FC analysis of the spleen revealed low T-cells in all the 4 immunodeficient strains as compared to WT mice, but with statistical significance only in the Rag1-/-strain (Fig. 1). B-cells were more represented in Cd40l-/- mice and, along with CD3ε+-T-cells, they were almost absent in Rag1-/- mice. Variability among and within groups was found for F4/80+ macrophages, but the most striking finding was the lack of macrophages in Cd40l-/- mice. Low percentages of neutrophils were present in the Cd40l-/- strain (P = .0308). Lower NK cells were found in the Was-/- strain (P = .0209; Supplemental Figure S2).

Flow cytometric analysis of the spleen. (a) Flow cytometric density plots showing cell distributions based on CD3ε and NK-1.1 in a representative mouse from each strain. Note the marked decrease in NK cells in the Was-/- mouse and T-cells in the Rag1 R972Q/R972Q and Rag1-/- strains. (b) Graphs comparing percentages of CD3ε+, CD45R/B220+, and F4/80+ cells among strains. Note the virtual complete lack of lymphocytes in the Rag1-/- strain and macrophages in Cd40l-/- mice. Kruskal-Wallis test followed by post hoc analysis with Dunn’s multiple comparison test. *P < .05, ***P < .001. Median value with interquartile range. WT, wild-type; Cd40l, Cd40l-/-; Was, Was-/-; R972Q, Rag1 R972Q/R972Q ; Rag1, Rag1-/-.
Histologically, WT mice had normal periarteriolar lymphoid sheaths (PALS), follicles, and marginal zones (Supplemental Table S2). Follicular germinal centers were present in 2/5 mice. In Rag1 R972Q/R972Q mice, follicles were smaller and condensed, while PALS were hypocellular, and, in 2/5 Rag1 R972Q/R972Q mice, extramedullary hematopoiesis (EMH) was increased. No follicles nor PALS were evident in Rag1-/- mice, and all 5 mice also had increased EMH. Findings in Cd40l-/- mice were comparable to WT mice, with the only exception being a lack of follicular germinal centers. Two different histomorphological patterns were noted in the splenic white pulp of Was-/- mice. In 3/5 Was-/- mice, follicles were larger and with prominent but poorly cellular germinal centers, while the remaining 2/5 mice showed decreased size and cellularity of follicles, with less prominent germinal centers. The PALS and marginal zone were decreased in all immunodeficient mice. All the immunodeficient mice also had increased EMH as compared to WT mice.
The IHC was particularly useful in discriminating between germinal centers and poorly cellular PALS in Was-/- mice. Representative histological and IHC images of the spleen from the 5 groups are shown in Figs. 2, 3. Digital image analysis on immunolabeled sections revealed similar T- and B-cells results as were observed with FC (Supplemental Figure S3).

Spleen. (a, d, g, j) Wild-type mouse, (b, e, h, k) CD40l-/- mouse, and (c, f, i, l) Was-/- mouse. (a–c) Hematoxylin and eosin, (d–f) CD45R/B220 immunohistochemistry (IHC), (g–i) CD3 IHC, and (j–l) IBA1 IHC. Note the significant reduction in the B-cell compartment in the Was-/- mouse (f).

Spleen. (a, c, e, g) Rag1 R972Q/R972Q mouse and (b, d, f, h) Rag1-/- mouse. (a, b) Hematoxylin and eosin, (c, d) CD45R/B220 immunohistochemistry (IHC), (e, f) CD3 IHC, and (g, h) IBA1 IHC. Note the significant reduction in the B-cell compartment (c) and in the T-cell compartment (e) in the Rag1 R972Q/R972Q mouse. The Rag1-/- mouse lacks both compartments (d, f).
Lymph Nodes
A significant difference in the lymph node area was found between WT and Rag1 R972Q/R972Q mice, but only for the axillary lymph node. The inguinal lymph node was not detected histologically in 1 Was-/- mouse.
FC analysis of lymph nodes was unsuccessful in Rag1-/- mice, due to poor cellularity. No differences were found in the T- or B-cell populations between WT and immunodeficient strains. On the other hand, more B-cells were in the axillary lymph node of Cd40l-/- mice and fewer B-cells were in both lymph nodes of the Rag1 R972Q/R972Q strain as compared to controls. Macrophages were also elevated in the Cd40l-/- strain in the axillary lymph node (P = .0115). No differences in neutrophils or NK cells were found.
Histologically, all the main compartments of the lymph node including follicles and paracortex were easily identified in WT mice, 4/5 of which also contained follicular germinal centers. The most striking findings in the immunodeficient strains were found in the Rag1-/-, which lacked the normal nodal architecture due to a complete lack of follicles and paracortex. Follicles were also smaller in the Rag1 R972Q/R972Q strain, which had no germinal centers. No germinal centers were seen in Cd40l-/- mice either, while these were prominent in 3/5 Was-/- mice. The difference in the nodal architecture between strains was more evident in immunolabeled sections (Figs. 4, 5).

Axillary lymph node. (a, d, g, j) Wild-type mouse, (b, e, h, k) Cd40l-/- mouse, and (c, f, i, l) Was-/- mouse. (a–c) Hematoxylin and eosin, (d–f) CD45R/B220 immunohistochemistry (IHC), (g–i) CD3 IHC, and (j–l) IBA1 IHC. The lymph node from the Cd40l-/-mouse is morphologically normal, apart from the lack of follicular germinal centers (b, e). Germinal centers are visible in the Was-/- mouse (c, f).

Axillary lymph node. (a, c, e, g) Rag1 R972Q/R972Q mouse and (b, d, f, h) Rag1-/- mouse. (a, b) Hematoxylin and eosin, (c, d) CD45R/B220 immunohistochemistry (IHC), (e, f) CD3 IHC, and (g, h) IBA1 IHC. The lymph node from the Rag1 R972Q/R972Q mouse is morphologically normal apart from the lack of follicular germinal centers (a, c). Note the complete lack of follicles and paracortex in the Rag1-/- mouse (b, d, f), which are both replaced by numerous macrophages (h).
Digital image analysis on immunolabeled sections revealed a complete lack of both T- and B-cells in Rag1-/- mice (axillary lymph node: P < .0068 and P = .0007, respectively; inguinal lymph node: P < .0027 and P = .0016, respectively). Results for macrophages were overlapping for the 2 lymph nodes and were significantly lower in the inguinal lymph node of Was-/- mice (P = .0404). Neutrophils were significantly lower in the inguinal lymph node of Cd40l-/- mice (P = .0333). The NK cells were markedly lower in the inguinal lymph node of Was-/- mice (P = .0491; Supplemental Figures S4, S5).
Thymus
The weight of the thymus was significantly lower in the Rag1-/- strain as compared to the WT group only for the absolute weight.
No statistically significant differences were found between groups in the percentage of T-cells by FC (Fig. 6). While CD4-CD8-double-negative (DN) T-cells were virtually lacking in all the strains, they were higher in the Rag1 R972Q/R972Q strain (non-statistically significant).

Flow cytometric analysis of the thymus. (a) Flow cytometric density plots showing cell distributions based on CD4 and CD8 in a representative mouse from each strain. Note the marked decrease in both T-cell subpopulations in the Rag1 R972Q/R972Q and Rag1-/- strains. (b) Graphs comparing percentages of CD3ε+, double positive (DP; CD4+CD8+), and double negative (DN; CD4-CD8-) cells among strains. Note the relative high number of DN T-cells in Rag1R972Q/R972Q mice. Kruskal-Wallis test followed by post hoc analysis with Dunn’s multiple comparison test. Median value with interquartile range. WT, wild-type; Cd40l, Cd40l-/-; Was, Was-/-; R972Q, Rag1 R972Q/R972Q ; Rag1, Rag1-/-.
From the histomorphological point of view, no alterations in the thymus were seen in the Cd40l-/- and Was-/- strains as compared to the WT group (Fig. 7). Conversely, relevant changes were found in the Rag1 R972Q/R972Q and Rag1-/- strains. Both strains had overall low cellularity in the organ, with corticomedullary junctions that were barely recognizable in Rag1R972Q/R972Q mice and were not visible in Rag1-/- mice (Fig. 8).

Thymus. (a) Wild-type mouse, (b) CD40l-/-mouse, and (c) Was-/-mouse. No alterations are visible between strains. Hematoxylin and eosin.

Thymus. (a) Rag1 R972Q/R972Q mouse and (b) Rag1-/- mouse. Note the overall reduced cellularity, with the corticomedullary junction being vaguely visible only in the Rag1 R972Q/R972Q mouse (arrowheads). Hematoxylin and eosin.
Bone Marrow
FC analysis of the bone marrow revealed no statistically significant differences in any of the immune cell populations between groups (Fig. 9).

Flow cytometric analysis of the bone marrow. (a) Flow cytometric density plots showing cell distributions based on CD3ε and NK-1.1 in a representative mouse from each strain. All mice have similar numbers of cells. (b) Graphs comparing percentages of CD3ε+, CD45R/B220+, and F4/80+ cells among strains. No statistically significant differences are evident between groups. Kruskal-Wallis test followed by post hoc analysis with Dunn’s multiple comparison test. *P < .05, ***P < .001. Median value with interquartile range. WT, wild-type; Cd40l, Cd40l-/-; Was, Was-/-; R972Q, Rag1 R972Q/R972Q ; Rag1, Rag1-/-.
Histologically, no differences in the overall cellularity of the bone marrow were evident between strains. The quantitative evaluation of the myeloid:erythroid ratio performed on cytological smears revealed statistically significant higher ratios in Cd40l-/- and Was-/- mice as compared to WT mice (P = .0110 and P = .0265, respectively). No statistically significant differences were found between groups in the percentage of lymphocytes (Supplemental Table S3).
Regarding digital image analysis, contrary to FC results, the percentage of CD3+ T-cells in the bone marrow of Cd40l-/- mice was similar to the WT group. No relevant differences for macrophages and neutrophils were found. The NK cells were higher in the Cd40l-/- strain (P = .0073) and in the Was-/- strain (P = .0148; Supplemental Figure S6).
Peripheral Blood (Hematology and Immunoglobulin Quantification)
On the CBC, we found similar numbers of red blood cells between groups, except for the Was-/- strain that had a statistically significant lower number of red blood cells (P = .0007; Table 2). White blood cells were not significantly different between groups. Lymphocytes were lower in Rag1-/- mice compared to controls (P = .0397). No significant differences between groups were recorded in the number of neutrophils. Monocytes were significantly increased in the Was-/- strain (P = .0476).
Complete blood count in wild-type (WT) control and immunodeficient mice.
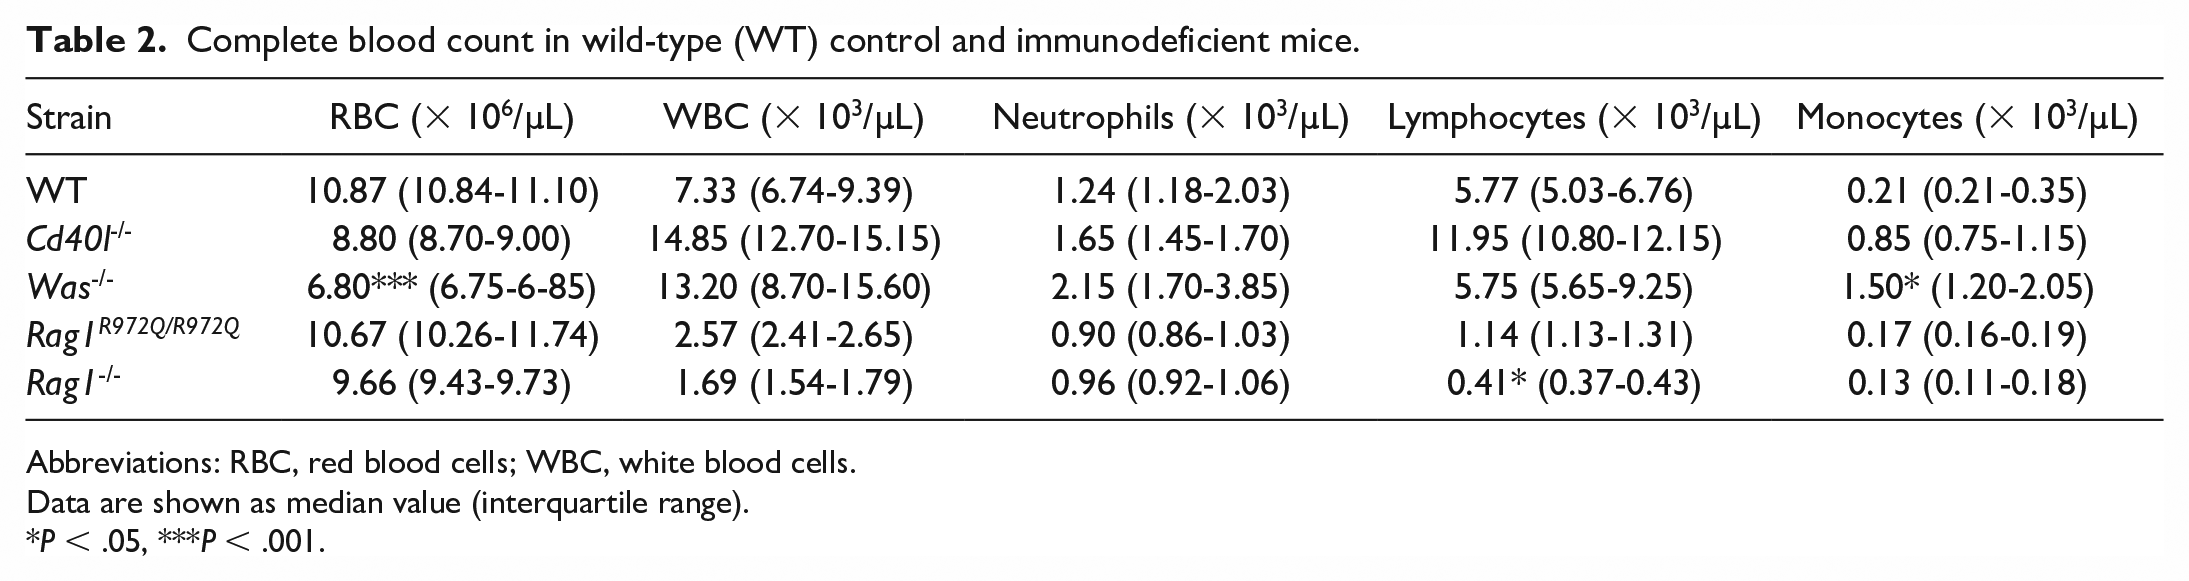
Abbreviations: RBC, red blood cells; WBC, white blood cells.
Data are shown as median value (interquartile range).
P < .05, ***P < .001.
The FC identified lower numbers of T-cells in the Rag1-/- strain (P = .0157; Table 3).
Flow cytometric analysis of peripheral blood in wild-type (WT) control and immunodeficient mice.

Data are shown as median value (interquartile range).
P < .05, **P < .01.
Immunoglobulin analysis revealed a significantly lower value of IgG in Rag1-/- and Cd40l-/- as compared to WT mice (P = .0006 and P = .0377, respectively; Fig. 10).

Serum immunoglobulin quantification. (a) IgG and (b) IgM. Note the very low levels of IgG in the Cd40l-/- strain and their complete lack in Rag1-/- mice. Kruskal-Wallis test followed by post hoc analysis with Dunn’s multiple comparison test. *P < .05, ***P < .001. Median value with interquartile range. WT, wild-type; Cd40l, Cd40l-/-; Was, Was-/-; R972Q, Rag1 R972Q/R972Q ; Rag1, Rag1-/-.
Discussion
There is a pressing need for an objective comparison of the immune system of various immunodeficient mouse strains that are used in biomedical research, which is motivated by the requirements for high standards of reproducibility across studies involving the usage of such strains. The variability in mouse studies still represents a major issue for translatability, with mouse-to-mouse differences in immune status probably being one of the largest sources of variation.40,43 This is well exemplified by oncological studies that demonstrated the variability of engraftment and growth of human cancer cells in different immunodeficient mouse models.16,51 Some extent of immune variation is expected within the same strain of mice depending on their environment or age. 43 For example, SCID mice develop a “leaky” phenotype as they age.7,8,17 To help fill this gap, in the present study, we applied a multi-approach protocol for the morpho-phenotypical assessment of immune defects in immunodeficient mouse models. The protocol was based on the evaluation of lymphoid organs (spleen, lymph nodes, and thymus), bone marrow, and peripheral blood through common laboratory methods (organ weights, hematology, FC, immunoglobulin quantification, histology, and IHC) that are expected to highlight alterations in immune cell populations in the strains under investigation. For this purpose, we selected 4 immunodeficient mouse strains with different types and severity of immunodeficiency.
The advantages and limitations of each method used in our protocol along with their utility in the characterization of the various strains are discussed below. Furthermore, a proposal for a tier-based application of our protocol based on the strengths and weaknesses of each method is reported in Fig. 11.

Tier-based application of the protocol for the characterization of the immunodeficiency in mouse strains.
Organ Weight
Despite the obvious limitations in respect to the ability to detect specific changes in immune cell populations, this very simple and fast procedure was readily informative of the type and severity of defects that we expected to see in the immunodeficient strains, as it showed lower values in the weight of both thymus and spleen in the Rag1 R972Q/R972Q and Rag1-/- mice. Higher values in the relative weight of the spleen in the Was-/- strains were recorded, corresponding to splenomegaly due to increased EMH recorded by histology. Splenomegaly due to increased EMH in Was-/- mice has been previously reported and interpreted as a compensatory thrombopoiesis in these mildly thrombocytopenic mice.4,39 For lymph nodes, it was not possible to measure the precise weights due to the small size and the high amount of extra-nodal fat tissue surrounding them.
Hematology and Bone Marrow Cytology
The CBC is an accessible, reliable, and fast method for the identification of the different peripheral blood cell types and their absolute and relative numbers. Therefore, variations within the leukogram provide quick information about the immunological status of the animal. This method succeeded in our study in showing the lymphopenia that characterizes the Rag1 R972Q/R972Q and, more severely, the Rag1-/- strain. Neutropenia is commonly seen in patients with X-linked hyper-IgM syndrome, and it was recently linked to an essential role played by CD40L signaling in the early stages of neutrophil generation and development in the bone marrow. 22 In the same study, low numbers of neutrophils and monocytes were found in the spleen and bone marrow of Cd40l-/- mice, but the peripheral blood was not investigated. 22 In our study, Cd40l-/- mice were found with levels of neutrophils that were comparable with the WT group, suggesting that additional studies are warranted to confirm if neutropenia is recapitulated in this mouse model. As a result of these findings, we consider basic hematology as a useful second-tier technique to study immunodeficiency in mouse models, especially in those strains where the defect is expected to be particularly severe, like Rag1-/- mice. Hematology is often coupled with bone marrow cytology for a complete evaluation of the circulating cells and their precursors. 36 The difference in the myeloid:erythroid ratio between strains generally matched the results from hematology and FC in our study (see Flow Cytometry). As for the percentage of lymphocytes, the evaluation of the bone marrow smears did not identify differences between strains, as confirmed by the other methods.
Flow Cytometry
The B- and T-cell defects in Rag1-/- mice were very well demonstrated in the spleen via FC, while they were less severe in Rag1 R972Q/R972Q mice, as expected. On the contrary, the lymph nodes were mostly characterized by less B-cells in the Rag1 R972Q/R972Q strain. No reliable results were obtained from lymph nodes of Rag1-/- mice via FC due to the lack of cells, reflecting the severe immunodeficiency of these mice. Those samples were therefore excluded from comparison. The overall lack of T-cells in Rag1-/- mice was, instead, evident in the thymus. Severely reduced macrophages were detected in the spleens of the Cd40l-/- strain. These mice were not reported to be deficient in this cell population in the first description of this model, although on that occasion FC for cells other than lymphocytes was performed only with the Mac-1 marker, whose expression is not exclusive to macrophages. 45 This could have masked the skewing of macrophages in this strain. A reduction in macrophages was recently reported in both the spleen and bone marrow of these mice, together with lower neutrophil numbers. 22 When performed on peripheral blood, FC allows for a more thorough characterization of immune cell subpopulations than a simple CBC. In our study, except for the characterization of B- and T-cells, we mostly limited our investigation to the same populations that were also identifiable by common hematology. Based on our results, we can conclude that the CBC was very useful in the quantification of lymphocytes, while it was a less specific method for their characterization in the peripheral blood as compared to FC, due to its inability to separate B- and T-cell subpopulations.
Histology and Immunohistochemistry
Histology is inconsistently and/or inadequately applied in studies reporting new mutant mice.34,37,45,53 This is likely due to the fact that a thorough histological phenotyping requires trained mouse pathologists. Nevertheless, histology is the golden standard for the evaluation of tissue architecture of lymphoid organs, and, by means of a simple semi-quantitative evaluation, it provided highly useful information on the type and severity of immunodeficiency in our study. Rag1-/- lymph nodes, for instance, which were unsuitable for FC evaluation because of the general lack of cells, were observable by histology and were shown to be devoid of all the major compartments that compose a lymph node. In addition, histology can detect secondary abnormalities that are typically overlooked but are associated with the general immunodeficient state (e.g., the increased percentage of EMH occupying the spleen of Was-/- mice). The surface area of lymph nodes was measured on digitalized hematoxylin and eosin-stained sections and was considered a measure of their size. Interestingly, no difference was observed between strains. On one hand, it is surprising that lymph nodes were not smaller, especially in the Rag1-/- strain. On the other hand, this reflects the misconception that lymph nodes should be reduced in size in immunodeficient mice. All axillary and inguinal lymph nodes, in fact, were easily identified and dissected from the Rag1-/- mice, indicating that no sensitive reduction in size was appreciable. Considering the limitations of histology for this type of evaluation, caution should be used when interpreting these data. Overall, we can conclude that the histological findings in our study supported the modifications that we expected in the strains under investigation.34,37,45
IHC for the main leukocyte populations is useful to clarify the actual composition of poorly cellular structures in lymphoid organs of immunodeficient mice (e.g., discrimination between follicular germinal centers and poorly cellular PALS in the spleen of Was-/- mice). Results of IHC generally overlapped with those obtained by FC. The 2 techniques are not simple to compare one with the other because, although they provide similar information on expression of cellular antigens, the methods are substantially different.1,3,19,20,48 While FC offers sensitive and faster detection of antigens for which antibodies may not be available for IHC on paraffin section, IHC preserves the tissue architecture and enables the study of the spatial distribution of cell subpopulations. 20 On the contrary, some cell populations can be identified by FC based on the high/low expression of certain surface antigens, whereas such fine discrimination is not possible with IHC. 19 It is generally accepted, in fact, that the 2 methods should be considered as complementary tools.
Immunoglobulin Quantification
Quantification of serum immunoglobulins is frequently used to assess the type and severity of immunodeficiency in mouse models, 32 especially at the time of characterization of new phenotypes. This investigation is essential following antigenic challenge/immunization (i.e., lipopolysaccharide [LPS]).37,45,47 Therefore, we consider this method as a bridge between a morpho-phenotypical characterization like the one we performed and a functional one. Measuring basal levels of immunoglobulins, however, could provide important information on the immunological characteristics of a specific strain. Our study found markedly lower levels of IgG in the Cd40l-/- mice associated with increasing of IgM, which are both typical features of the model. 45
Considering the specific features of the methodologies so far described, we can conclude that all of them retain certain strengths and weaknesses that make them useful at different levels for the characterization and confirmation of immunodeficiency in the murine strains, especially when they are applied as complementary tools. Other features of the models that are often neglected (e.g., percentage and distribution of populations other than lymphocytes in the Rag1-/- strain such as neutrophils, monocytes/macrophages, and NK cells) were also described in our study. For a more complete characterization and assessment of immunodeficient strains, more recent tools like transcriptomics and proteomics can be of further aid to identify genes and their products that may be unexpectedly dysregulated, thus spotting subtle modifications in certain mouse colonies that could help control the variability between experiments.
The protocol proposed herein, however, does not come without limitations. Probably the most important one is that it is limited to identifying morpho-phenotypical immunological defects in the mice, while functional immune defects could still be significant even without evident changes in the number of immune cell populations and their tissue organization. This aspect is well exemplified by the relative scant abnormalities detected in Cd40l-/- and Was-/- mice, as compared to the Rag1-/- and Rag1 R972Q/R972Q strains. In the case of Cd40l-/- mice, for instance, we previously characterized their pulmonary inflammatory response in case of fungal opportunistic infection, 15 and we observed that in the infiltrate, they deploy significant numbers of those cells that are supposed to be defective in the CD40/CD40L cell signaling (e.g., CD4+ T-helper cells). Likewise, immunological defects in Was-/- mice are mainly represented by impaired lymphocyte proliferation, whose assessment is dependent on the antigen receptor engagement. 53
Another limitation is represented by the small size of our experimental groups, which could have affected the statistical power of our analysis. On the other hand, proposing an appropriate sample size for this type of evaluation is not an easy matter and is very much dependent on the entity of the immune deviations one would expect to see in the murine strains under evaluation. Not to mention the obvious ethical implications of such decisions. It is worth noting, however, that our sample size was consistent with the methods adopted by the studies we referenced with the first description of the models34,37,45,53 and also supported by others. 5
Further Applications of the Protocol
Herein, we described the application of a standardized protocol to characterize and confirm immunodeficiency in 4 murine strains. Possible fields of application include new genetically engineered models with unknown immune statuses, models of experimental infection in which the role of immunity is seldomly investigated in relation to infection, or even sentinel mice that could not manifest clinical signs following infection, but in which the immune system appears to be stimulated, and therefore indicative of circulating opportunistic pathogens. It is important to highlight, however, that integrative methodologies (e.g., in vitro, in vivo assays) might be necessary to measure some functional defects that may not be translated into a certain phenotype detectable with the methodologies of our protocol.
Conclusions
The multi-approach protocol that we applied in our study has proven itself effective for the morpho-phenotypical assessment of the immunodeficient mouse models under investigation and was useful in characterizing the type and severity of the defects. This standardized protocol may be used to confirm or validate the phenotype in well characterized mouse models, which is highly recommended when acquiring mice from non-official sources or reputable vendors, as well as for a characterization of newly developed immunodeficient and non-immunodeficient mouse models. Furthermore, the protocol could also be useful to study the effects of environmental and experimental factors on the immune system of laboratory mice and to identify unexpected immune alterations in both immunodeficient and immunocompetent mice.
Supplemental Material
sj-pdf-1-vet-10.1177_03009858251361517 – Supplemental material for A standardized protocol for assessing immunodeficiency in mouse models
Supplemental material, sj-pdf-1-vet-10.1177_03009858251361517 for A standardized protocol for assessing immunodeficiency in mouse models by Andrea Cappelleri, Simone Canesi, Valentina Capo, Alessandra Zecchillo, Luigi D. Notarangelo, Elena Draghici, Virginia Bettoni, Valeria Martini, Pierangelo Moretti, Anna Villa, Saverio Paltrinieri, Eugenio Scanziani and Camilla Recordati in Veterinary Pathology
Footnotes
Correction (September 2025):
Article updated to correct terms and names in the Materials and Methods, Flow Cytometry, and Thymus sections, as well as in the captions of Figures 1, 6, 9, and 10. These corrections do not affect the study’s results or conclusions.
Declaration of Conflicting Interests
The author(s) declared no potential conflicts of interest with respect to the research, authorship, and/or publication of this article.
Funding
The author(s) disclosed receipt of the following financial support for the research, authorship, and/or publication of this article: This work was supported by the Italian Ministry for Universities and Research (grant no. PRIN 2017 Prot. 20175XHBPN).

Supplemental material for this article is available online.
References
Supplementary Material
Please find the following supplemental material available below.
For Open Access articles published under a Creative Commons License, all supplemental material carries the same license as the article it is associated with.
For non-Open Access articles published, all supplemental material carries a non-exclusive license, and permission requests for re-use of supplemental material or any part of supplemental material shall be sent directly to the copyright owner as specified in the copyright notice associated with the article.
