
Abstract
Magnetic resonance imaging (MRI) is one of the most common diagnostic modalities used in veterinary neurology and neurosurgery. MRI scans are an essential component of the comprehensive management of central nervous system neoplasms in companion animals. Because of the popularity and widespread use of MRI, veterinary pathologists and anatomic pathology trainees can benefit from understanding the fundamentals of MRI scans and how they can be applied to complement diagnostic neuropathology. Here, we review basic principles of MRI generation and terminology and discuss diagnostic imaging and correlative gross neuropathologic features of intracranial neoplasms of dogs and cats. As an exhaustive review of the MRI characteristics of the neoplasms reported to affect the central nervous system of dogs and cats is beyond the scope of this article, we will focus on the most commonly diagnosed intracranial tumors in these species.
Keywords
The clinical management of companion animals with neurologic disease has been transformed by the widespread availability and routine use of cross-sectional diagnostic imaging modalities, such as computed tomography (CT) and magnetic resonance imaging (MRI).21,24,34 MRI is preferred over CT for imaging of patients with intracranial disease because of its superior contrast resolution and generation of artifact-free images of the brain, allowing for detailed assessment of neural and extraneural tissues. 21 The reported sensitivity of MRI for the detection of intracranial lesions is 94%, with a similarly high specificity for the identification of tumors. 75 However, substantial overlap in MRI features across neoplasms limits its clinical utility in differentiating specific tumor types, underscoring the need for histologic examination of biopsy or autopsy specimens for a definitive diagnosis.59,60,75,78
MRI provides important data to assist the clinical management of patients with intracranial disease and complements the diagnostic neuropathology workflow. 55 High-resolution MRI scans can generate 3-dimensional whole brain atlases for precise determination of lesion location, size, and shape and assessment of secondary effects of tumors on surrounding tissues. 40 This information is crucial to correlate tumor location with clinical signs, refine the differential diagnoses, assist with surgical planning, and enable non-invasive guidance for tissue sampling. Contemporary brain MRI protocols may also include advanced techniques for insights into brain physiology, including perfusion studies to assess blood flow and vascular permeability, spectroscopy to assess tissue biochemical composition and metabolism, and diffusion sequences to examine tissue microarchitectural integrity and cellular density.34,40 Beyond histologic validation of radiologic findings, correlative MRI and neuropathologic investigations are critical to identify non-invasive imaging biomarkers of diseases. 20 Rapid advancements in digital image analysis and machine learning may ultimately support the performance of virtual autopsies. 3
Intracranial neoplasms, such as meningiomas and gliomas, are common causes of neurologic disease in dogs and cats.64,65,69,70 In a diagnostic pathology setting, these cases are often submitted from neurology services accompanied by MRI information or scans that may be available to pathologists, who may not have the necessary training and experience in MRI interpretation. Here, we provide a conceptual and technical MRI framework to assist veterinary pathologists with the diagnosis of intracranial neoplasms in dogs and cats. We discuss the physics of MRI, the fundamentals of MRI sequences and their terminology, and the approach to interpretation and application of MRI features for intracranial tumor diagnosis. We will focus on the most frequently diagnosed intracranial tumors, including meningiomas, gliomas, and choroid plexus tumors. Other less frequently encountered neoplasms that have similar imaging features to these entities will be briefly discussed. For descriptions of the MRI features of the wide spectrum of neoplasms that affect the central nervous system (CNS) of companion animals, readers are encouraged to consult comprehensive reviews on the topic.4,34,40,60,70,74
Basic Physics of MRI
The process of an MRI examination involves placing the patient in a magnetic field, sending radio waves into the tissues, turning the radio waves off, and receiving a subsequent signal emitted by the tissues, which is used to reconstruct an image (Fig. 1). The signal is based on the magnetization properties of atomic nuclei, which contain protons with a positive electrical charge. These protons have an intrinsic spin, which produces a magnetic moment and allows them to interact with magnetic fields. 7 Given their abundance in the water and fat in tissues, the most common data collected during clinical MRI examination are derived from signals arising from hydrogen protons.
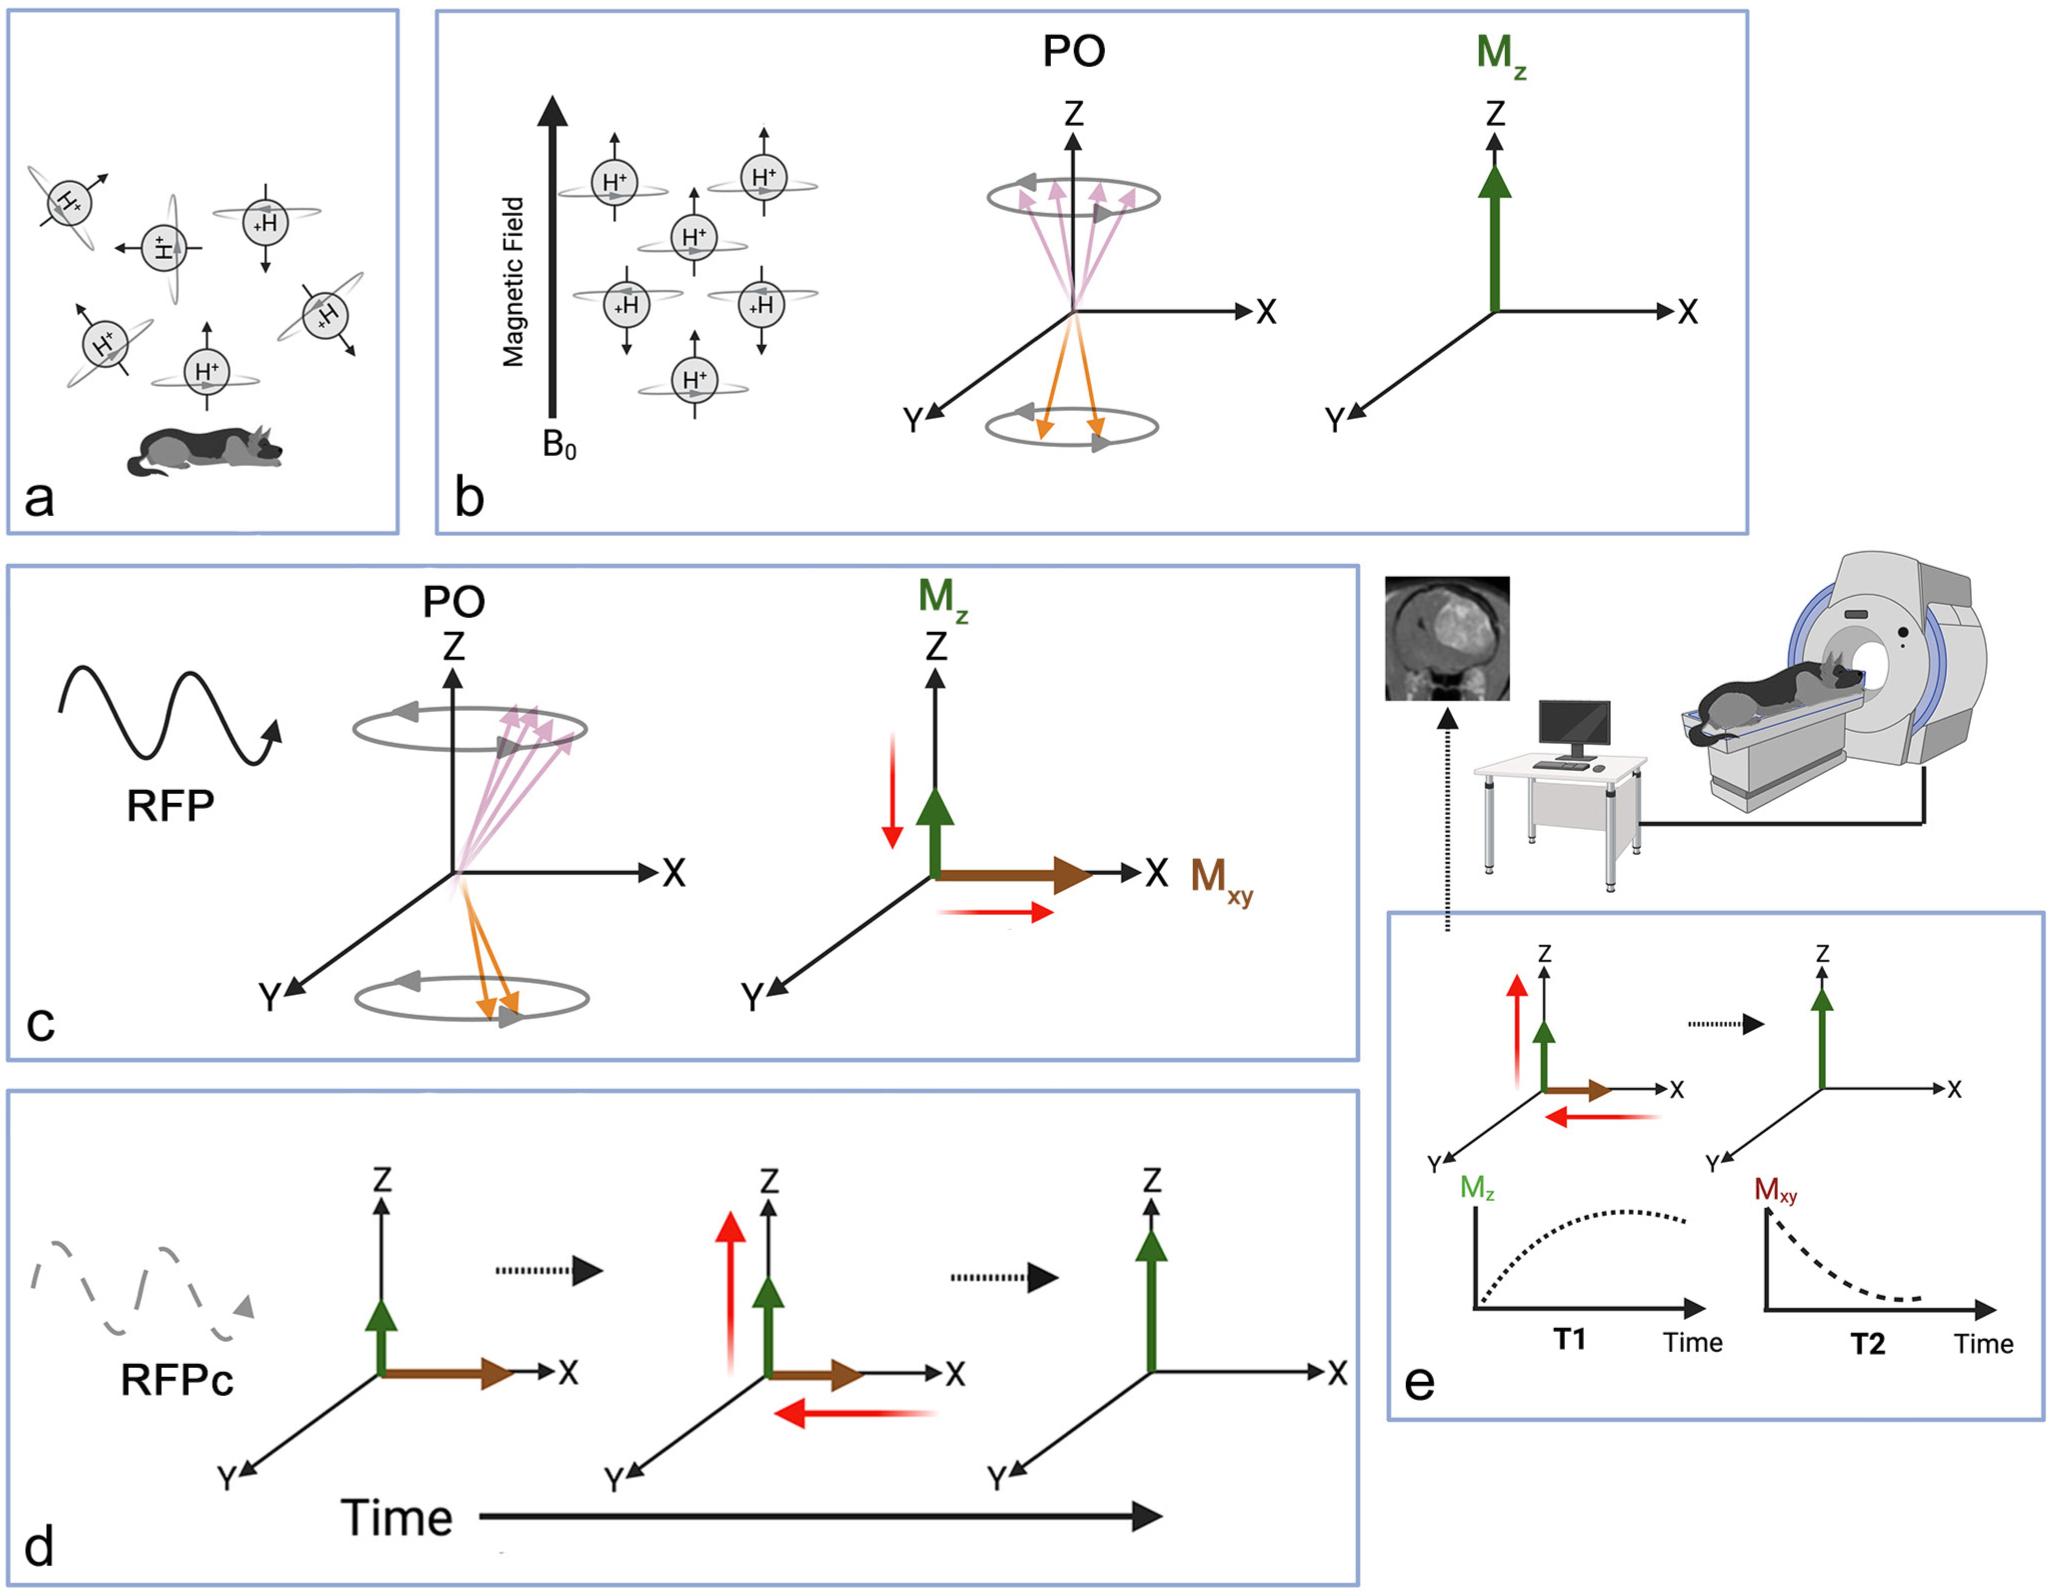
Overview of magnetic resonance imaging (MRI) physics and image generation. (a) Randomly oriented hydrogen protons in water molecules within tissues are the source of signals for image generation, as each proton generates its own electrical charge and magnetic field. (b) Placing an animal into the external magnetic field of the MRI scanner (B0) causes hydrogen protons in tissues to align parallel to the main magnetic field (net vector or Mz). PO, proton orientation. (c) Following delivery of a radiofrequency pulse (RFP), the net magnetization vector is tipped into the transverse (Mxy) plane (right). PO, proton orientation. (d) After RFP cessation (RFPc), protons undergo relaxation and return to equilibrium (right), with subsequent signal generation used to construct images. (e) Proton relaxation produces time-dependent signal curves, including longitudinal (T1) recovery and transverse (T2) decay that provide the foundation of image contrast. The purple and orange arrows (b and c) illustrate individual proton vectors; purple arrows are B0 parallel vectors and orange arrows are anti-parallel vectors. The thick green and maroon arrows (b–e) represent the net magnetization vectors resulting from the effects of parallel and anti-parallel vectors acting on each other (they largely cancel each other out with resulting net magnetization being in the direction of slightly more parallel-aligned protons). The longer of the 2 green or maroon arrows indicates the net magnetization vector in the presence of B0 magnetic field (b), during RFP application (c), and after cessation of RFP (d). The thin red arrows emphasize the dynamic changes in magnetization vectors that occur in the various stages of proton excitations and relaxation. Image created in BioRender. Rossmeisl J. (2026) https://BioRender.com/3v1wmdv.
A core component of an MRI scanner is a powerful superconducting magnet, which typically ranges in strength from 0.25 to 3 Tesla in clinical practice. This magnet produces a static homogeneous magnetic field (B0) that creates a detectable net longitudinal magnetization vector (Mz) along the scanner z-axis.7,50 When the body of the animal is placed into this strong magnetic field, hydrogen protons in tissues, which are naturally randomly oriented, align parallel to B0. 50 Thus, when placed into an external magnetic field, the animal itself becomes a magnet, because the vectors of the protons that do not cancel each other out add up. The alignment of the hydrogen protons can be compared to placing a magnet in front of a table full of compasses. When the magnet is brought near the compasses, it causes the needles to swing and point directly toward the magnet’s south pole.
The next step involves introducing radiofrequency pulses (RFPs) into the animal. The RFPs cause protons to move out of their previously achieved parallel alignment with net magnetization occurring in the transverse plane. In this process, the protons gain energy and precess in phase (the protons synchronously rotate or precess and wobble around the magnetic field). 50 These RFPs are electromagnetic waves that can be interpreted as magnets that are stronger than the B0 field acting on the compass needles, causing them to deviate from pointing at the south pole. When the RFPs are turned off, the protons undergo relaxation, emitting signals as they return to their state of equilibrium parallel to B0. These signals are detected by receiver coils in the scanner and are used to generate the MRI scan. Proton relaxation involves 2 simultaneously occurring processes, T1 and T2 relaxation, and produces time-dependent signal curves that provide the foundation of image contrast.7,50
T1 relaxation (longitudinal relaxation/recovery) involves recovery of magnetization along the B0 axis. T1 relaxation occurs by energy transfer from protons to their surrounding environment (ie, lattice), which is governed by the molecular structure and composition of tissue. 19 T2 relaxation (transverse relaxation/decay) involves the gradual loss of precession phase coherence among protons in the transverse plane following cessation of the RFP. Over time, tissue microstructural and local magnetic interactions cause the precessing protons to become desynchronized, which results in signal decay. 46
The Many Shades of Gray in MRI
The versatility of MRI arises from its ability to manipulate biophysical tissue properties and generate a wide range of signal contrasts, as well as to acquire images in any orientation, including transverse, sagittal, dorsal planar, and oblique planes. The type of signal generated (the shades of gray) is dependent on specific tissue relaxation times (how fast or slow the energy is released by a tissue). The T1 and T2 relaxation times are dependent on the amount and arrangement of hydrogen protons in the tissue. 45 Two tunable timing settings are the primary determinants of MRI tissue contrast. Repetition time (TR) is how frequently the scanner excites the tissue with RFPs, while echo time (TE) is the time elapsed before collection of the signal emitted by the tissue following RFP excitation. Short TR and TE emphasize differences in tissue T1 relaxation and result in T1-weighted (T1W) images, whereas longer TR and TE emphasize T2 relaxation and contrast, resulting in T2-weighted (T2W) images.7,45 Thus, by altering the manner and timing in which energy (in the form of RFPs) is introduced into and collected from the hydrogen protons in tissues, sequential images of different contrasts are generated. 45
An MRI sequence is a timed series of RFPs and magnetic gradient changes that govern how the scanner excites protons in the body, reads their signals, and builds an image, creating different contrasts to highlight specific tissue compositions (eg, bone, fat, water) or lesions (eg, edema, inflammation, neoplasia). Sequences are akin to recipes, with each sequence having specific settings for modifiable parameters (TR, TE, pulse direction, pulse intensity, flip angle, etc) designed to interrogate and highlight different tissue properties.45,50 The information gathered by these sequences is then plotted via gray scale in varying degrees of brightness, representing distinct tissue compositions, to generate the image. Typical clinical MRI examinations consist of multiple sequences to determine if and what types of lesions may be present. Each imaging sequence can be compared to a chapter in a novel that supplies a unique set of information and context necessary to connect and comprehend other chapters, with all chapters contributing to the final interpretation of the story (the imaging diagnosis).
The visual appearance of anatomic structures on MRI is described based on their relative shades of gray compared to normal control tissues and according to the particular image sequence (Supplemental Table S1). In the CNS, normal gray matter serves as the internal control to which comparisons of relative color intensity are made. 40 Tissues with high signal intensity are white (hyperintense), tissues with intermediate signal intensity are gray (isointense), and tissues with low signal intensity are black (hypointense).24,34
T1W (short TR and TE), T2W (long TR and TE), and T2-fluid-attenuated inversion recovery (T2-FLAIR; similar to T2W but longer TR and TE) imaging are the most common sequences used for brain tumor evaluation, although diffusion-weighted imaging (DWI) and susceptibility-weighted imaging (SWI) sequences may provide additional data and facilitate tumor diagnosis and therapeutic response evaluation. 48 Collectively, these sequences provide complementary information on tissue composition and tumor type and extent, as well as secondary changes in the surrounding tissues.34,40,74
In general, tissues with high water content have a low signal (hypointensity) on T1W images and a high signal (hyperintensity) on T2W images. For example, cerebrospinal fluid (CSF) will be hypointense (black) on a T1W MRI scan and hyperintense (white) on a T2W MRI scan. T1W sequences are predominantly used for the visualization of normal anatomic structures and as reference anatomic maps for the co-registration of other sequences.40,45 However, as only fat appears hyperintense on T1W sequences, T1W images provide an excellent background for contrast studies. The most commonly performed contrast studies involve acquisition of a baseline (pre-contrast) T1W sequence followed by the intravenous injection of a paramagnetic contrast agent (typically gadolinium-based), followed by acquisition of another post-contrast T1W sequence. 48 As an intact blood-brain barrier prevents entry of contrast into the neuroparenchyma, accumulation of contrast within a lesion is indicative of blood-brain barrier disruption and appears as a conspicuous region of hyperintensity on T1W images. 24 The pituitary gland, choroid plexus, trigeminal ganglia and nerves, and short linear segments of dura mater normally have contrast enhancement following gadolinium administration. 31
T2W sequences are considered the standard for the identification of lesions, as they highlight water and other fluids.4,24,34 Thus, the detection of inflammation, edema, cysts, and neoplasms is facilitated with T2W imaging, as these lesions increase water content in tissues and appear hyperintense. However, although T2W sequences are sensitive for lesion detection, they also demonstrate the limited biological specificity of MRI, as different pathologic processes share overlapping imaging features. 40 The T2-FLAIR sequence uses a technique similar to T2W images but with longer TR and TE, intentionally suppressing CSF signal (causing CSF to appear as hypointense). 45 This makes lesions such as ischemic infarcts, inflammation, and neoplasms appear as hyperintense areas against a predominantly dark background. T2-FLAIR is particularly valuable for identifying lesions in the white matter and periventricular areas.
Other frequently utilized sequences include T2W gradient recall echo (T2*-GRE), SWI, and DWI techniques. 48 T2*-GRE and SWI detect local magnetic field distortions caused by substances such as air, mineral deposits, or blood products. These distortions are not always visible on standard T1W or T2W images. The T2*-GRE sequences display signal loss (hypointensity) in areas with hemosiderin, deoxyhemoglobin, or mineral, assisting with the detection of hemorrhage or mineralization.9,45 However, it has limited resolution and sensitivity.9,45 SWI is an evolution of T2*-GRE imaging, incorporating high-resolution 3-dimensional imaging with phase mapping to increase sensitivity in detecting lesions and vascular anatomy and distinguishing paramagnetic (hemorrhage and iron, weakly attracted to the external magnetic field) from diamagnetic (calcification, weakly repelled by the external magnetic field) substances. 9
DWI is a method of signal generation based on the measurement of differences in the random molecular motion (diffusion) of water molecules in tissue.26,45 DWI provides qualitative and quantitative (apparent diffusion coefficient or ADC maps) information about tissue diffusion properties, adding functional data about tissue microstructure to the anatomical information provided by other standard MRI sequences. 34 Within a perfectly homogeneous medium, water diffusion is random and isotropic (equal movement in all directions). However, tissues within the body are heterogeneous, each having a specific cellular architecture and distribution of water within intra- and extracellular compartments. 26 Extracellular water molecules experience free diffusion, while intracellular molecules have diffusion restriction. Furthermore, pathologic processes alter tissue composition by changing cellularity as well as the proportion of water within each compartment. Thus, each tissue has characteristic diffusion properties that can be mapped using DWI. Tissues with restricted diffusion appear hyperintense on trace DWI images, hypointense on ADC maps, and have lower ADC values than normal tissues.26,45 Simplistically, restricted diffusion can be observed in tissues with high cellular density (such as high-grade neoplasms) or those with increased intracellular water (cytotoxic edema), making DWI particularly useful for evaluating cellularity and identification and discrimination of ischemic stroke from other intraparenchymal lesions such as gliomas or granulomas.8,14,17,34,40 DWI imaging can also define areas of facilitated diffusion, which have a low signal (iso- to hypointense) on trace DWI images and appear hyperintense on ADC maps. Facilitated diffusion often reflects the presence of necrosis, cysts, or vasogenic edema.26,45 Finally, some lesions may have a T2 shine-through artifact on DWI images, because DWI images are inherently T2W. T2-shine through occurs when tissues with long T2 relaxation times, such as cystic fluid or edema, artifactually appear hyperintense (shining through of the intrinsic T2W lesion signal) on both DWI and the corresponding ADC map and thus does not indicate true restricted diffusion.26,45
MRI Diagnosis of Intracranial Neoplasms
The approach to MRI interpretation is similar to that used during autopsy.4,34,40,55 First, the number of lesions is quantified by reviewing the T2W, FLAIR, T2*-GRE, and post-contrast T1W images to guide subsequent sectioning of the brain by the pathologist. 55 The entire MRI study is reviewed to determine the anatomic location of the tumor or tumors (eg, extraparenchymal, intraparenchymal, intraventricular, multiple compartments).4,34,40,74 Tumor location is the primary factor driving the generation of differential diagnoses (Fig. 2), with some diagnoses prioritized after consideration of other lesion features such as inherent signal characteristics, shape, patterns of contrast enhancement, and secondary changes in the surrounding neuroparenchyma.4,40 Secondary changes may include peritumoral edema, hemorrhage, obstructive hydrocephalus, peritumoral inflammation, dural tail sign, meningeal enhancement, herniations, and calvarial changes (hyperostosis or lysis).4,34,40,43,74
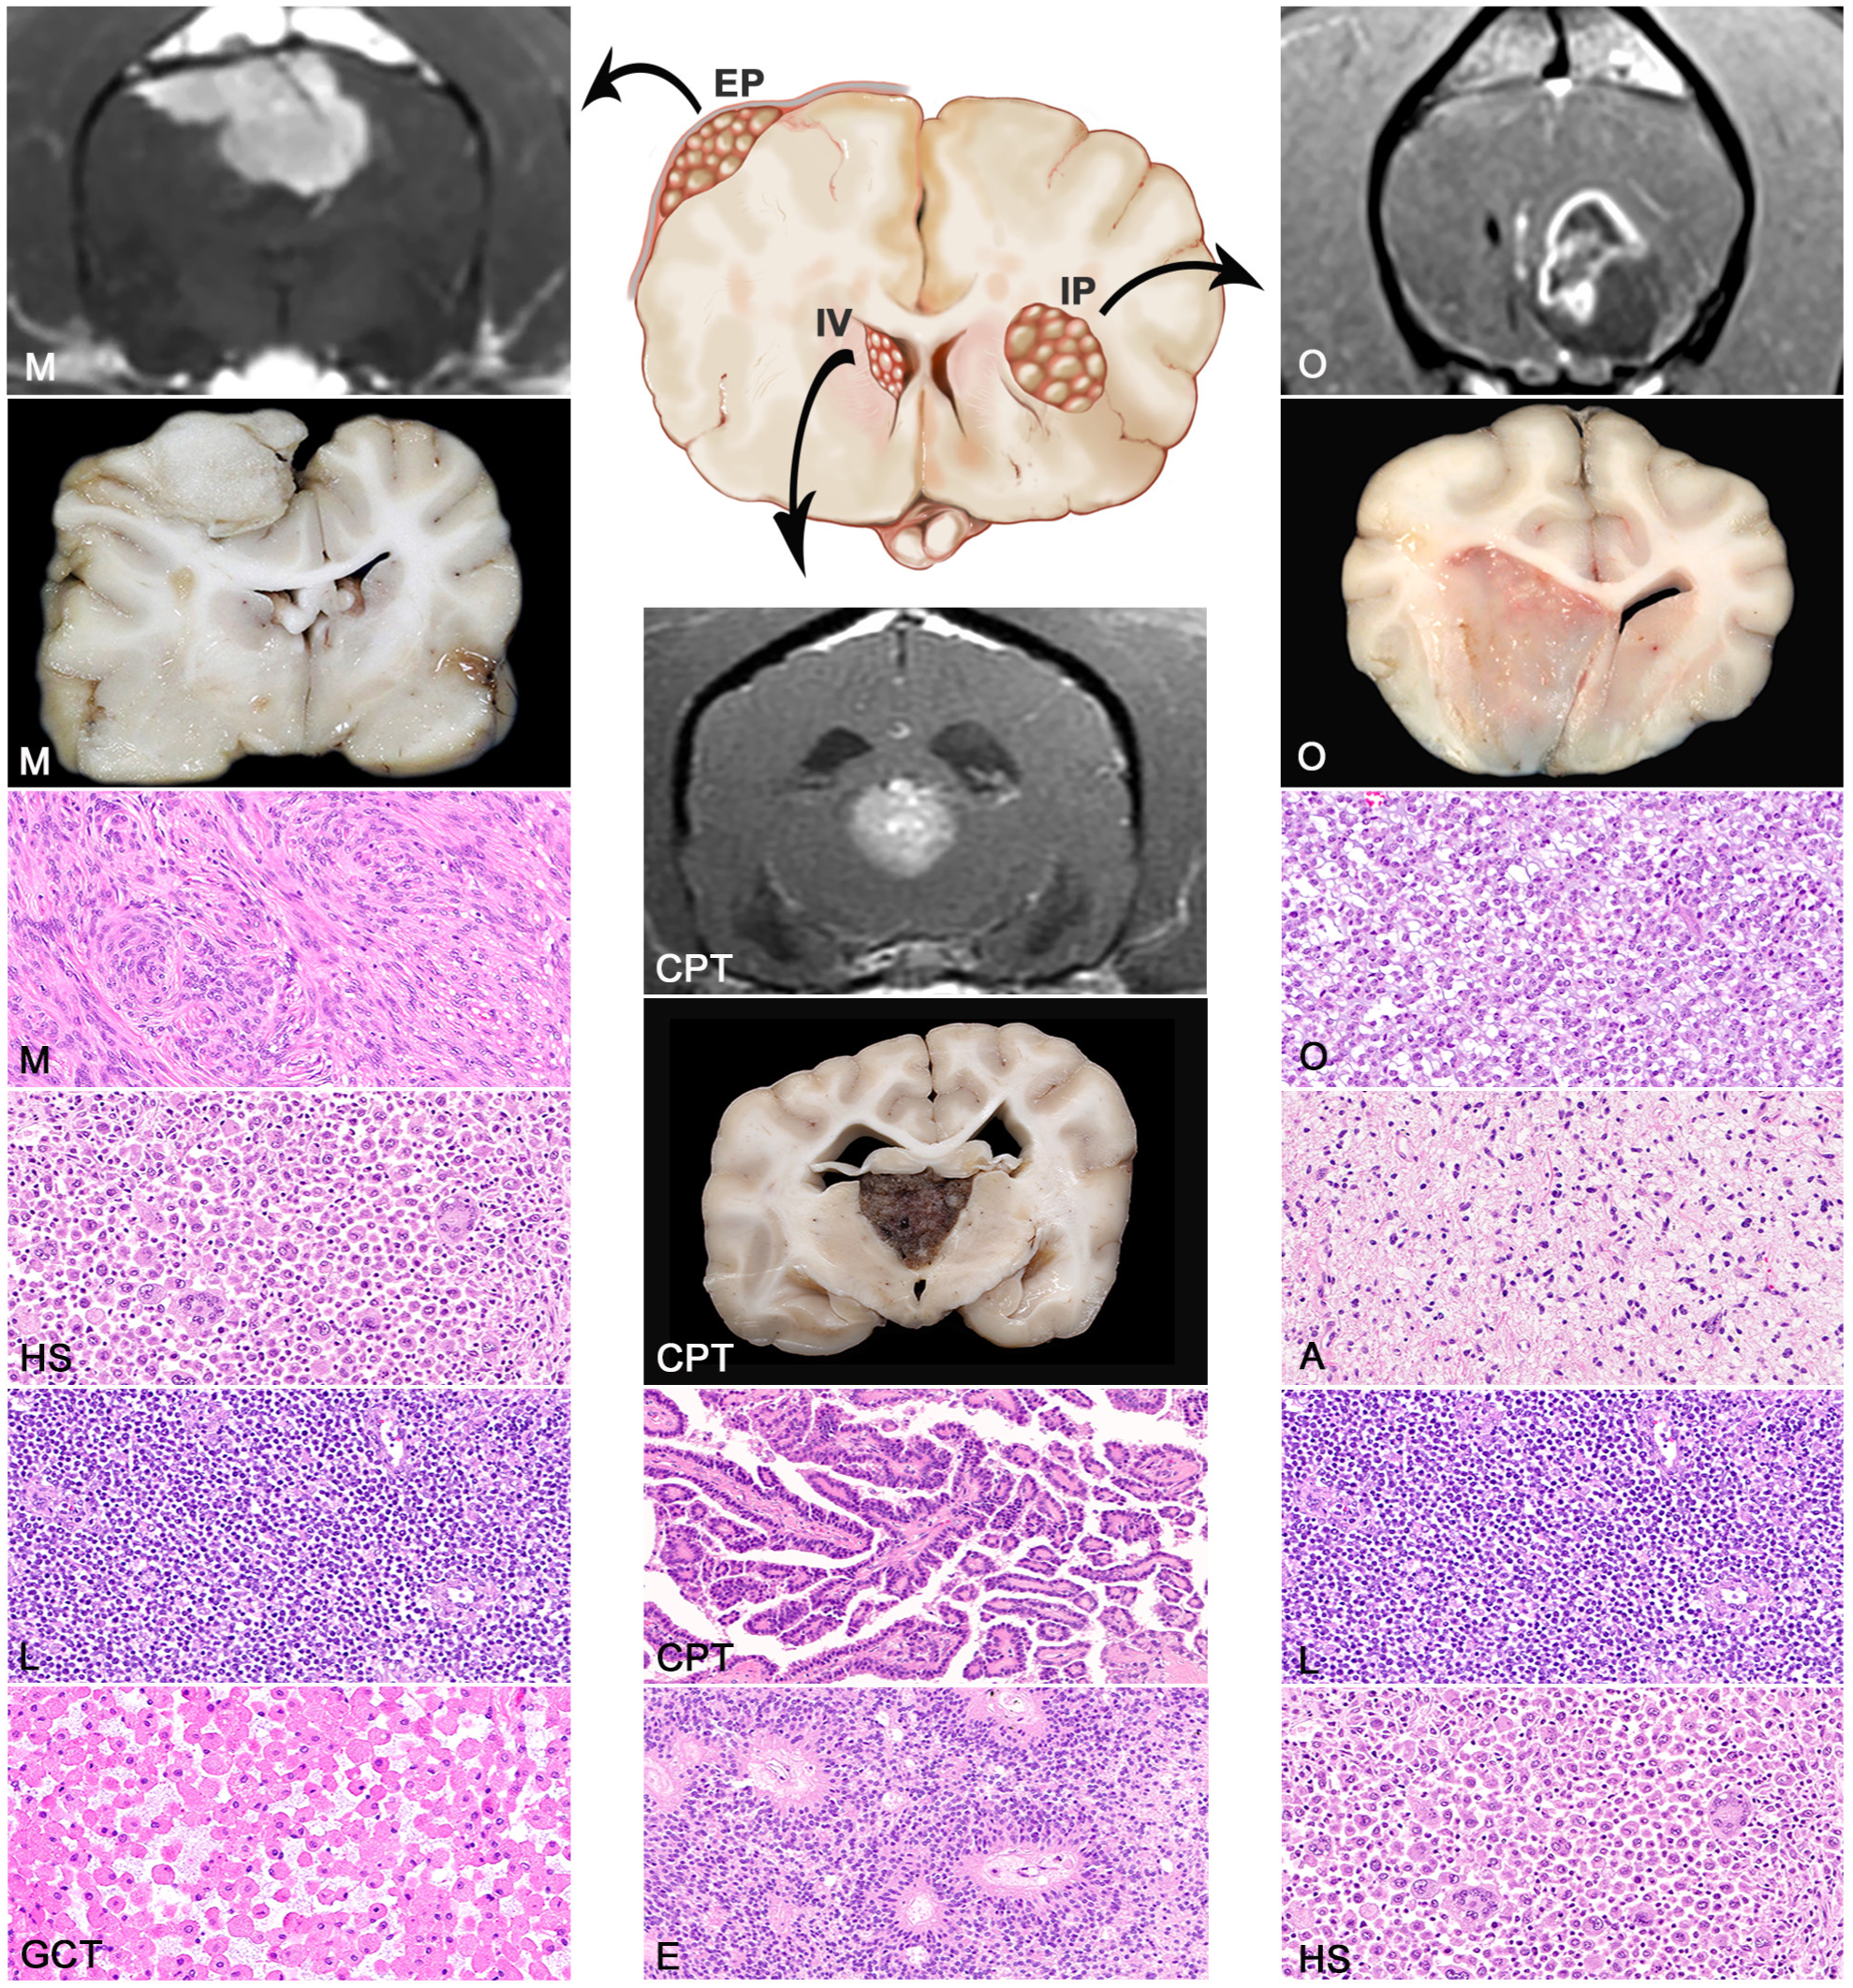
Differential diagnoses based on tumor location for solitary primary intracranial tumors. The primary differential diagnoses for extraparenchymal (EP) tumors are meningioma (M), histiocytic sarcoma (HS), lymphoma (L), and granular cell tumor (GCT). Differential diagnoses for an intraparenchymal (IP) tumor are oligodendroglioma (O), astrocytoma (A), lymphoma (L), and histiocytic sarcoma (HS). Differential diagnoses for intraventricular (IV) tumors include choroid plexus tumors (CPT), ependymoma (E), meningioma in cats (not shown), and oligodendroglioma in dogs (not shown).
Extraparenchymal intracranial tumors arise from tissues outside of the brain (Fig. 2). Primary extraparenchymal CNS tumors are most frequently meningeal-based, including meningiomas, meningeal granular cell tumors, histiocytic sarcomas, and lymphomas.4,34,40,55,74 In the neuroimaging literature, extraparenchymal lesions are also referred to as extra-axial.34,40,43 As extraparenchymal tumors are not protected by the blood-brain barrier, most are strongly contrast-enhancing.4,34,40 Typical extraparenchymal tumor locations include the superficial meningeal surfaces and parasellar or sellar regions.4,40 Extraparenchymal tumors are frequently associated with pathologic changes in surrounding tissues, including a dural tail sign and calvarial hyperostosis.16,23 A dural tail is characterized by a thickened and contrast-enhancing meningeal segment that is contiguous with and extends from the extraparenchymal lesion. 23 Differential diagnostic considerations for non-neoplastic extraparenchymal lesions with these MRI features include infectious or non-infectious granulomas, subdural hematomas, and hypertrophic pachymeningitis.4,40
Intraparenchymal neoplasms are located within the neuroparenchyma and are often surrounded by brain tissue (Fig. 2). Neuroimaging convention frequently refers to intraparenchymal lesions as intra-axial. The primary differential diagnoses for intraparenchymal neoplasms are neuroepithelial tumors, primarily oligodendroglioma, astrocytoma, undefined glioma, and less often lymphoma and histiocytic sarcoma.1,30,38,78 As intraparenchymal masses arise within tissues normally protected by the blood-brain barrier, these typically have either variable degrees of contrast enhancement or no contrast enhancement on MRI.1,30,78 The definitive localization of an intraparenchymal tumor may be challenging for superficial tumors in close contact with the meninges or ventricles, as these may resemble extraparenchymal tumors. The identification of a claw sign on brain MRI may assist with this differentiation. 22 The claw sign is associated with intraparenchymal lesions and consists of an acute angle at the border between the tumor and its narrow base of contact with the meningeal surface. Intraparenchymal neoplasms that involve multiple locations, such as paraventricular oligodendrogliomas with ventricular involvement, may also complicate their characterization with MRI. 56 The MRI features of ischemic and hemorrhagic strokes, infectious and non-infectious granulomas, and brain abscesses can have substantial overlap with those displayed by neuroepithelial tumors and should be considered as differential diagnoses in cases with intraparenchymal mass lesions.8,34,40
Intraventricular tumors are technically extraparenchymal lesions (Fig. 2). However, they are approached as a distinct entity on MRI because the ventricular location carries a specific list of differential diagnoses, including choroid plexus tumors (CPTs), meningiomas (especially in cats), and gliomas (particularly ependymoma). In the brain, intraventricular tumors comprise those found within the lateral ventricles, interventricular foramina, third ventricle, mesencephalic aqueduct, fourth ventricle, or lateral apertures. 40 Because of their intraventricular location, many of these tumors cause secondary obstructive hydrocephalus, which may be associated with a lack of normal suppression of the CSF signal on FLAIR images, and have significant contrast enhancement on MRI.4,34,40,74 Intracranial cholesterol granulomas; choroid plexus, ependymal, or epidermoid cysts; and intraventricular hematomas may have MRI features that can mimic those of intraventricular tumors.35,36,40,47
MRI and Gross Neuropathology of Intracranial Neoplasms
Extraparenchymal (Meningeal-Based) Tumors
Meningiomas are the most commonly diagnosed extraparenchymal intracranial neoplasm of dogs and cats, accounting for 50% and 85% of all primary brain tumors in these 2 species, respectively.64,65,69,71 Meningeal granular cell tumors and histiocytic sarcomas are also described in this section, as these frequently manifest as solitary extraparenchymal meningeal lesions and may have MRI features that mimic those of meningioma,2,40,68 including the tendency to be solitary, strongly contrast-enhancing masses, which typically have a dural tail sign.4,34,40 CNS lymphomas may also manifest as extraparenchymal masses in dogs and cats, but these are most often part of multicentric lymphoma and are reviewed elsewhere.15,18,38,57 However, each of these neoplasms often has distinct MRI features that allow for refinement of prioritized differential diagnoses.
MRI features of meningioma
Most canine and feline meningiomas consist of solitary masses or plaques (Fig. 3a–p), but multiple tumors may occasionally occur, particularly in cats (Fig. 4a–l).16,60,67,70 Approximately 75% of canine and 90% of feline meningiomas occur in the prosencephalon (olfactory lobes, cerebral convexity, and parasagittal locations). Skull base and brainstem locations are less common.16,54,60,64,67,69,70
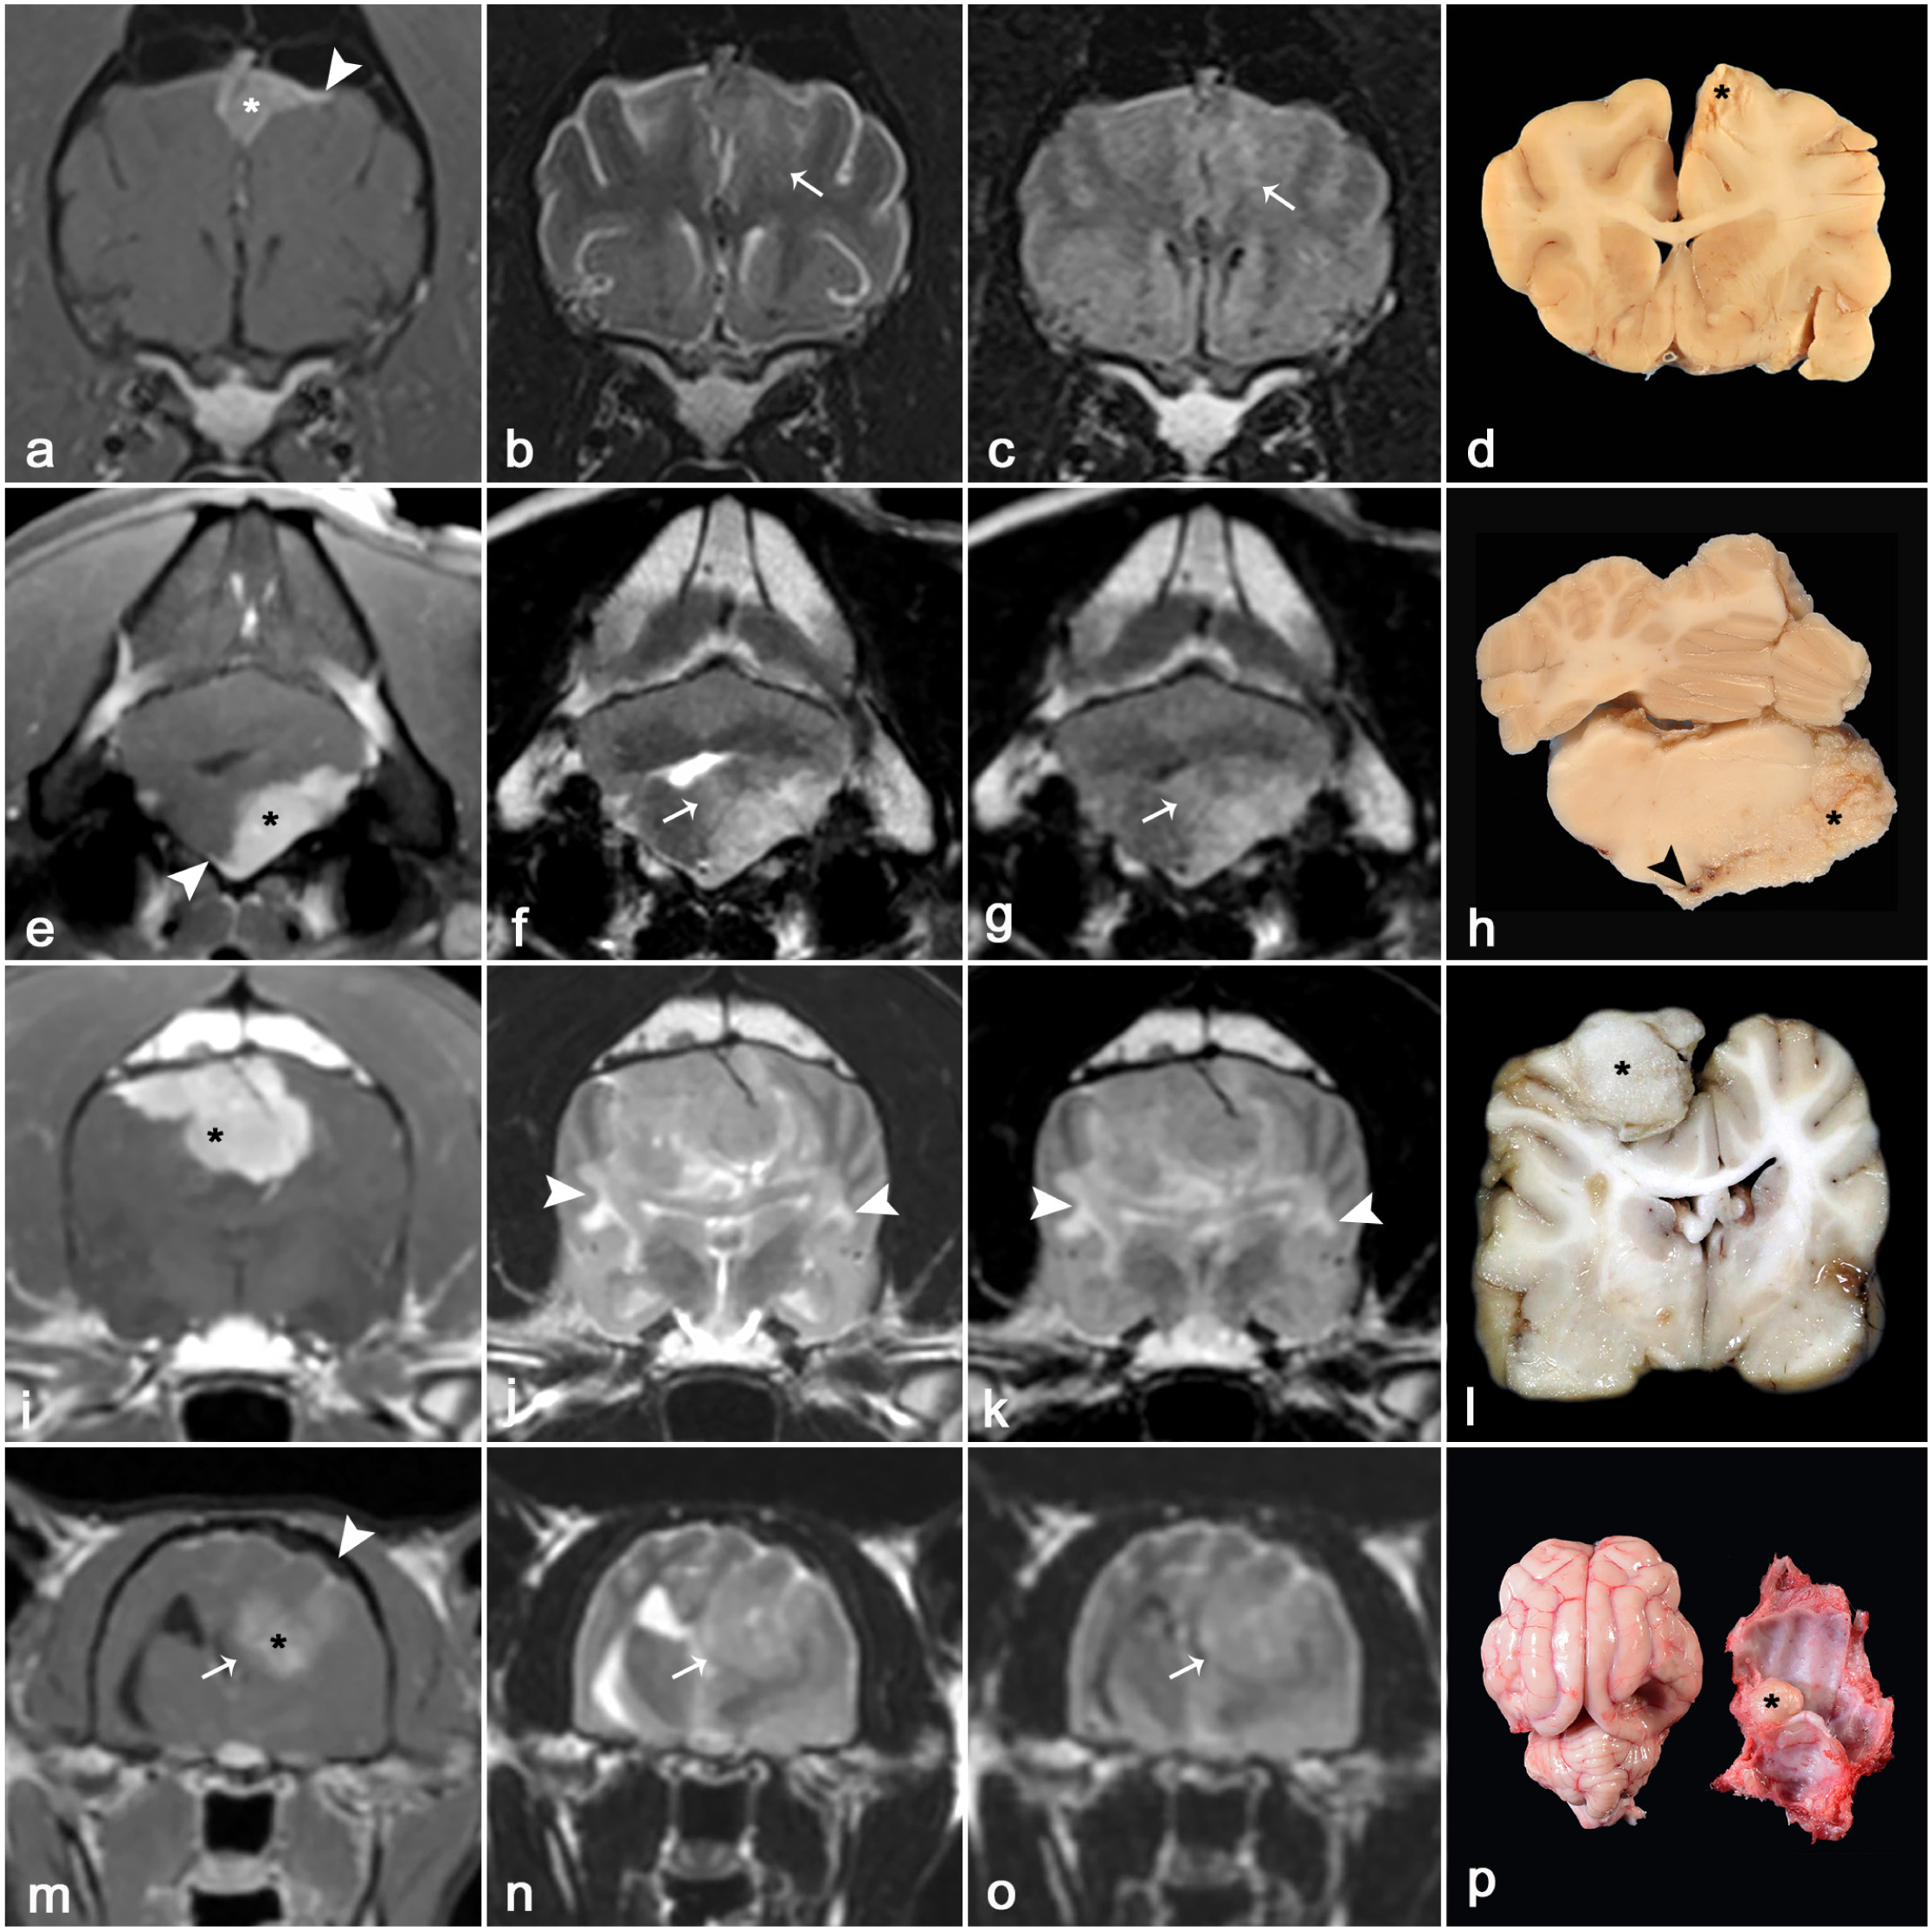
Magnetic resonance imaging (MRI) and gross features of extraparenchymal neoplasms in dogs and cats. (a–d) Meningothelial meningioma (left parietal lobe) in a dog. The tumor (asterisk) is uniformly and strongly contrast-enhancing on the post-contrast T1-weighted (T1W) image (a), displays a dural tail sign (arrowhead) (a), and is heterogeneously hypo- to isointense on T2-weighted (T2W) (b) and FLAIR (c) images. There is a mild mass effect characterized by a midline shift to the right and mild T2W and FLAIR hyperintense peritumoral edema (arrows). (d) The neoplasm (asterisk) is nodular and pale yellow. (e–h) Fibroblastic meningioma (left ventral pons and cerebellopontine angle) in a dog. The tumor (asterisk) is uniformly and strongly contrast-enhancing on the post-contrast T1W image (e), displays a scant dural tail sign adjacent to its ventral and medial aspect (arrowhead), and is heterogeneously hyperintense on T2W (f) and FLAIR (g) images. There is dorsolateral displacement of the brainstem and compression of the fourth ventricle, with T2W and FLAIR hyperintense peritumoral edema (arrows). (h) The neoplasm (asterisk) is pale yellow and expands the ventrolateral leptomeninges on the left ventral brainstem and cerebellopontine angle. The infiltration into the adjacent leptomeninges (arrowhead) corresponds to the dural tail sign observed on MRI. (i–l) Papillary meningioma (right parietal lobe) in a dog. The tumor (asterisk) is uniformly contrast-enhancing on the post-contrast T1W image (i) and heterogeneously iso- to hyperintense on T2W (j) and FLAIR (k) images. There is a midline shift to the left, compression of the lateral ventricles, and regionally extensive T2W and FLAIR hyperintense peritumoral edema predominantly involving the subcortical white matter of both cerebral hemispheres (arrowheads). (l) The neoplasm (asterisk) is nodular, white, and granular and compresses the surrounding neuroparenchyma. (m–p) Transitional meningioma (left occipital lobe) in a cat. The tumor (asterisk) is heterogeneously contrast-enhancing on the post-contrast T1W image (m), and the calvaria overlying the tumor is sclerotic and thickened due to hyperostosis (arrowhead) (m). The tumor is heterogeneously hyperintense on T2W (n) and FLAIR (o) images. There is a marked mass effect with compression of the dorsal aspect of the third and left lateral ventricles (arrows). (p) The tumor (asterisk) is adhered to the calvarium and tentorium, with compression and atrophy of the underlying neuroparenchyma.
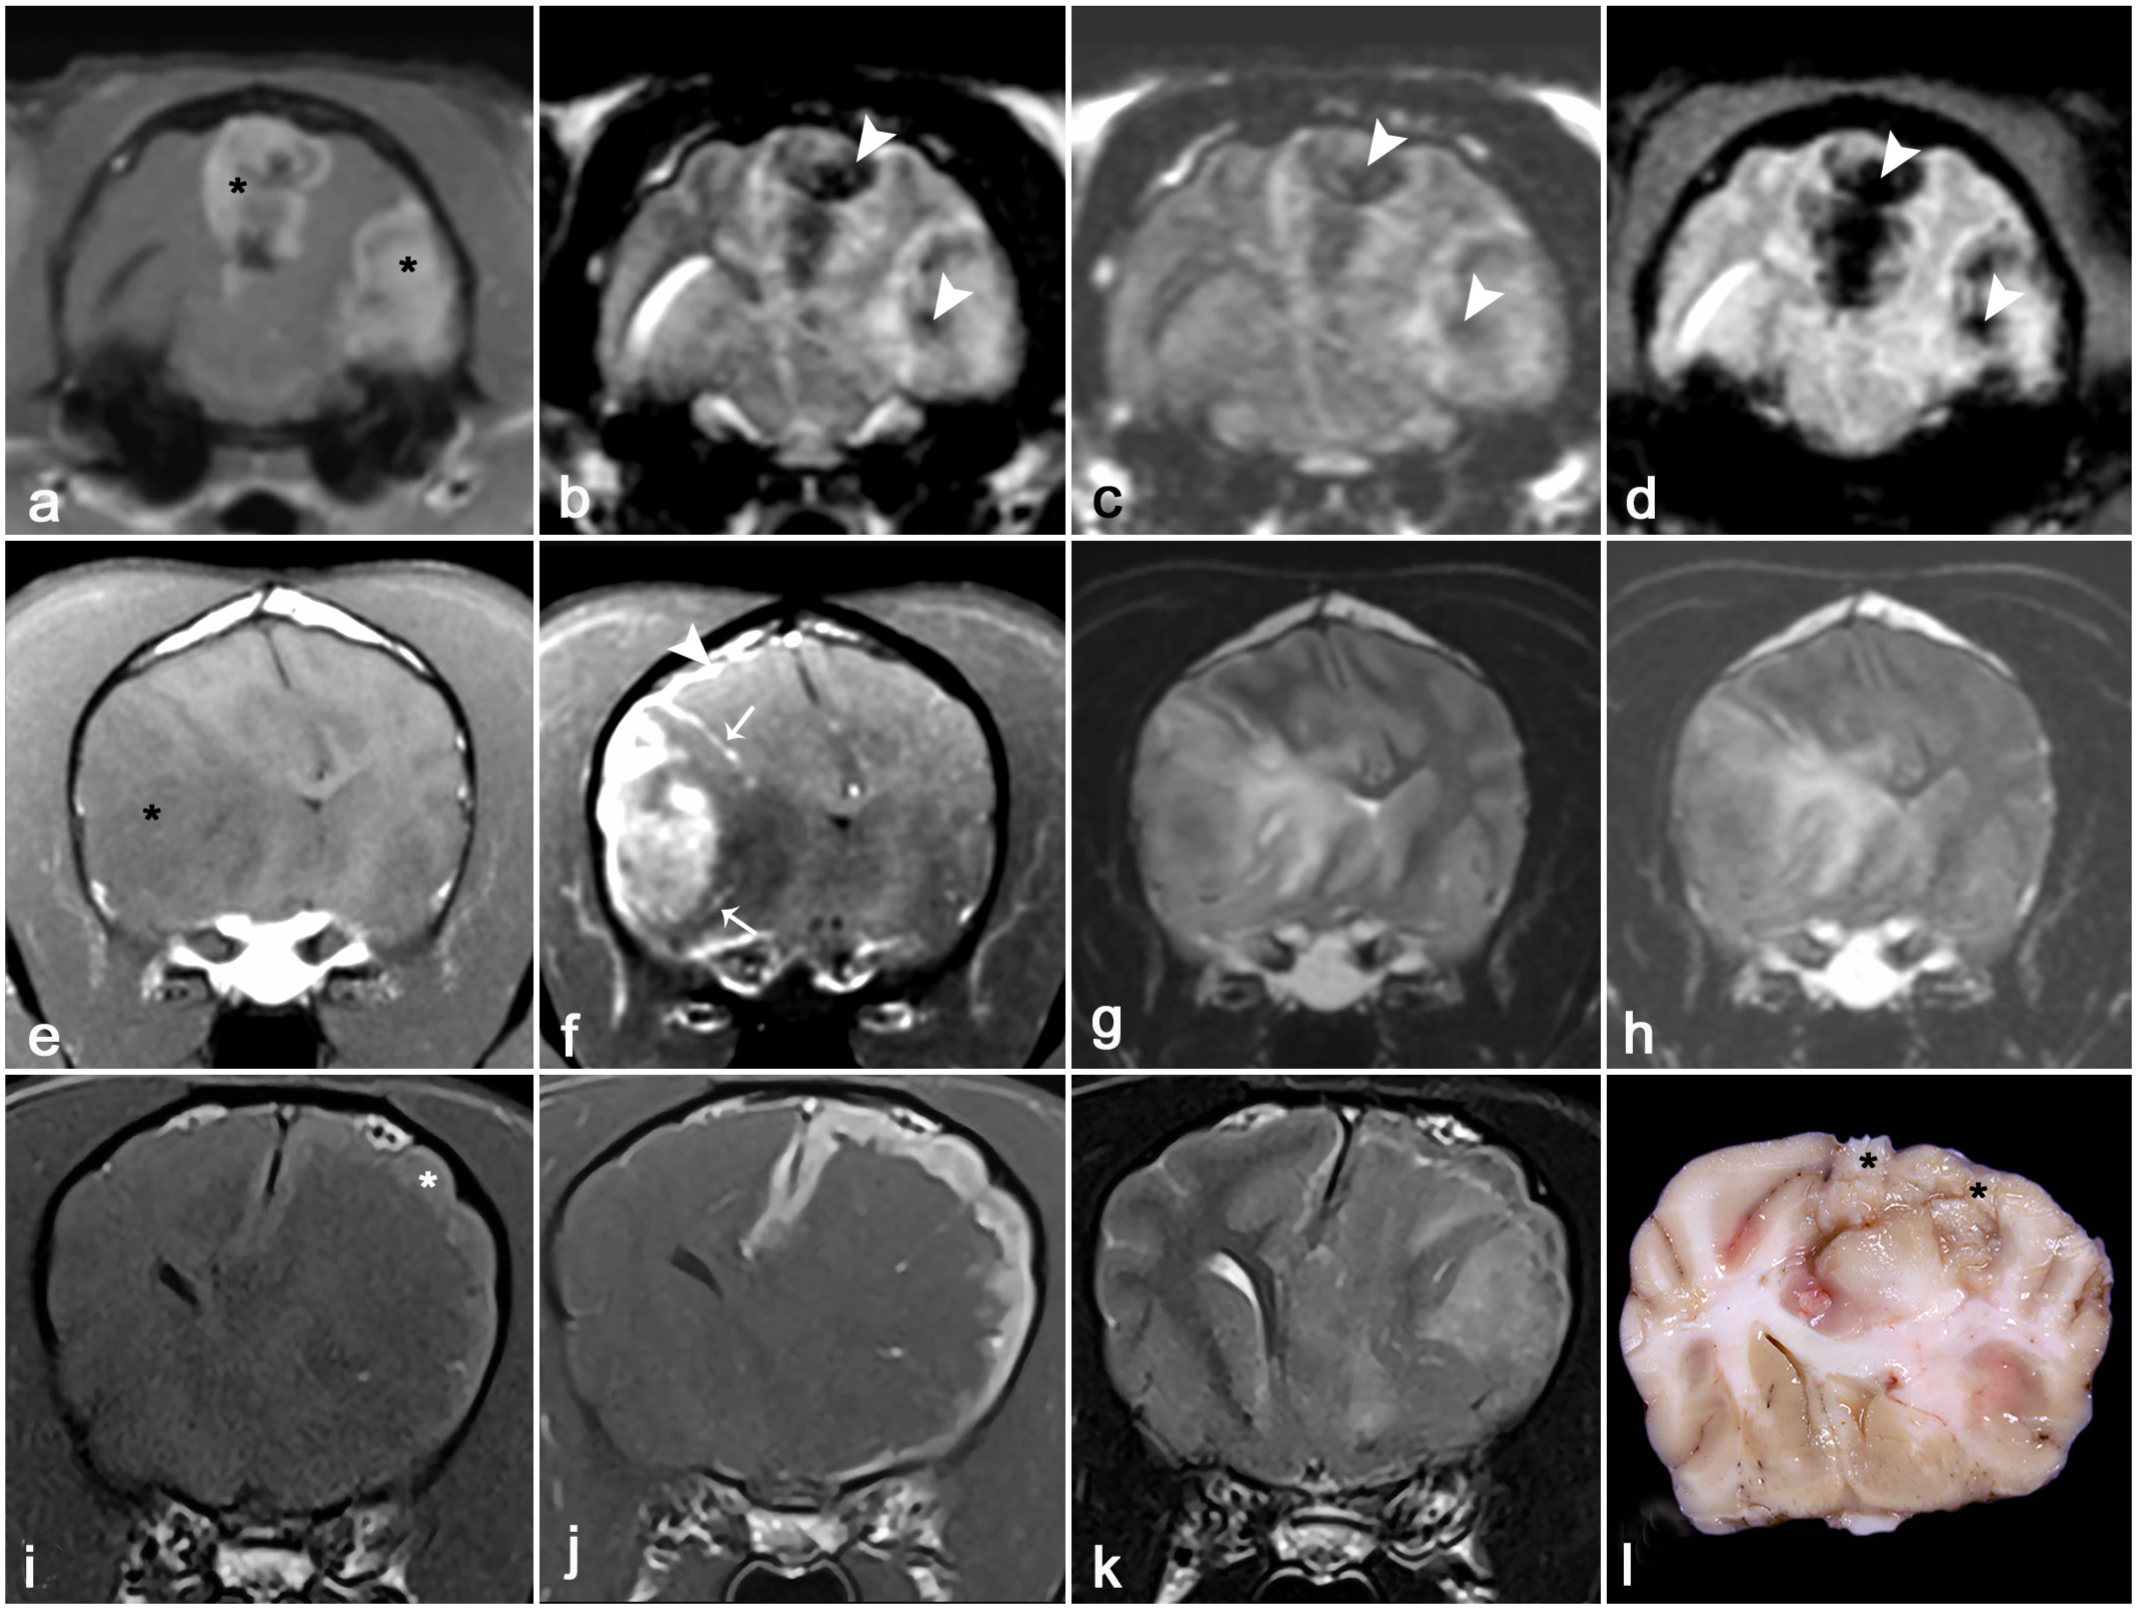
Magnetic resonance imaging (MRI) and gross features of extraparenchymal neoplasms in dogs and cats. (a–d) Psammomatous meningiomas (left occipital lobe and longitudinal cerebral fissure) in a cat. Both tumors (asterisks) display markedly heterogeneous signal intensities (hypo-, iso-, and hyperintensity) in T1-weighted (T1W) post-contrast (a), T2-weighted (T2W) (b), FLAIR (c), and T2*-GRE (d) images because of the presence of hypointense intratumoral mineralization (arrowheads) and hemorrhage. There is a mass effect causing a midline shift to the right and a left transtentorial brain herniation. (e–h) Primary histiocytic sarcoma (right parietal temporal lobe) in a dog. The tumor (asterisk) is predominantly T1W hypointense (e), heterogeneously T1W contrast-enhancing, with meningeal contrast enhancement extending distantly from the main tumor mass (arrowhead) as well as deep into the sulci (arrows) (f), and heterogeneously T2W (g) and FLAIR (h) hyperintense. The tumor is associated with severe T1W hypointense (e), T2W (g), and FLAIR (h) hyperintense perilesional edema and mass effect with midline shift to the left. (i–l) Meningeal granular cell tumor (left parietal lobe) in a dog. The neoplasm (asterisk) consists of a mildly T1W hyperintense (i) and uniformly T1W contrast-enhancing (j) plaque-like lesion that expands the meninges overlying the left cerebral hemisphere. The tumor is heterogeneously T2W iso- to hypointense (k). The tumor is associated with extensive T2W hyperintense perilesional edema (k) and marked mass effect, as evidenced by the right midline shift, effacement of gyri, and complete attenuation of the left lateral ventricle. (l) The neoplasm (asterisks) forms a pale-yellow plaque that expands the leptomeninges and compresses the underlying left parietal lobe and lateral ventricle, leading to the midline shift observed on MRI.
Meningiomas are round, lobular extraparenchymal masses or plaques that are typically well-marginated, especially on post-contrast T1W images (Figs. 3a, e, i, 4a). Most meningiomas are iso- to hypointense on T1W images, with T1W hyperintense tumors being uncommon. 67 Most meningiomas have some degree of enhancement on post-contrast T1W images, although the enhancement may appear homogenous (Fig. 3a, e, i) or heterogeneous (Figs. 3m, 4a).16,60,64,67,69,70 The contrast-enhancing margin of meningiomas corresponds well with the histologic tumor margins. 29 A dural tail sign is frequently associated with meningiomas (Fig. 3a). Meningiomas are most commonly heterogeneously hyperintense on T2W and FLAIR images (Fig. 3f, g, n, o) and may have heterogeneous signal intensities on multiple sequences if intratumoral cysts, hemorrhage, or mineralization are present (Fig. 4a–c).16,60,64,67,69,70 Identification of intratumoral hemorrhage and mineralization may be facilitated by the use of T2*-GRE (Fig. 4d) or SWI imaging.
Most meningiomas have a broad base of contact with the overlying bone and may cause some degree of mass effect, including midline shift, displacement of surrounding neuroparenchyma, attenuation of ventricles, and brain herniations (Figs. 3i–p, 4a–d).4,34,40,74 Peritumoral edema and inflammation are observed in over 85% of canine and feline meningiomas and appear as a T2W/FLAIR hyperintensity (Fig. 3f, g, j, k), with a predilection to affect the perilesional white matter.16,60,67,69,70 As a result of these secondary changes, brain herniations are observed in approximately 67% and 100% of canine and feline meningiomas, respectively (Figs. 3i–l, 4a–d). 44 Approximately 25% of meningiomas may also have single or multiple cystic areas (T2W hyperintense and T1W/FLAIR hypointense).28,67 The presence of cystic regions is a useful feature to discriminate meningioma from histiocytic sarcoma, as cystic change is not associated with histiocytic sarcoma.27,37,39
Changes in the bone adjacent to the tumors are also frequently observed in meningiomas.16,67,70 The most commonly reported change is calvarial hyperostosis, which occurs more frequently in cats than dogs. 16 Calvarial hyperostosis commonly manifests in a transdiploic form, appearing as thickened and hypointense areas in the skull bones overlying the tumor (Fig. 3m). Hyperostosis may also manifest as areas of calvarial lysis and thickening from which the tumor may herniate through. 16 Less commonly, the bones adjacent to the neoplasm may be thinned due to compression atrophy by the mass. 70
Gross pathology of meningioma
Most meningiomas are well-demarcated, white to yellow or gray, intradural, and extraparenchymal, firm multilobulated masses that often compress the underlying encephalic neuroparenchyma (Fig. 3d, h, l, p), leading to edema and compressive-ischemic atrophy. 16 The cut surface of meningiomas is firm and slightly granular. Tumors may also have fluid-filled cysts or red areas of hemorrhage. Calvarial hyperostosis (Fig. 3p), and tumor infiltration into the adjacent skull bones or nasal cavity may occur. Intraventricular meningiomas arising from the tela choroidea of the third ventricle are infrequently reported in cats, and these are reviewed in the section on intraventricular tumors. 71
MRI features of histiocytic sarcoma
Intracranial histiocytic sarcoma may be extraparenchymal, intraparenchymal, or a combination of extra- and intraparenchymal lesions.27,37,39,64,68,72 In dogs, tumors commonly consist of a solitary extraparenchymal mass and are the second most likely neoplastic lesion after meningioma to have this MRI presentation.4,37,39,40 Although histiocytic sarcomas occur in cats, their MRI features have not been described. Compared with meningiomas, in which T2W tumor hypointensity is uncommon to rare, approximately 50% of canine intracranial histiocytic sarcomas are T2W hypointense.27,37,39,64,67,68,72 Canine histiocytic sarcomas are significantly more likely than meningioma to have leptomeningeal contrast enhancement that extends into and expands the sulci (Fig. 4f) or spreads distantly from the main tumor mass.27,37,68,72 The histologic tumor margin of histiocytic sarcoma is also best represented by the contrast-enhancing lesion margin on MRI. 29 Some studies suggest that histiocytic sarcomas are associated with more extensive peritumoral edema (Fig. 4e–h) than meningiomas, but edema is common (Figs. 3i–l, 4e–h) with both these tumors.37,67,68 Both DWI and magnetic resonance angiographic sequences have also demonstrated some utility in discriminating canine histiocytic sarcomas from meningiomas. Histiocytic sarcomas have significantly lower ADC values than meningiomas and are not associated with vascular displacement on angiographic studies.27,72 One report indicated that the accuracies of experienced radiologists to discriminate histiocytic sarcomas from meningioma on MRI ranged from 76% to 92%. 37
Gross pathology of histiocytic sarcoma
Intracranial histiocytic sarcomas consist of solitary or rarely multiple masses that involve the leptomeninges but may infiltrate into the underlying neuroparenchyma.39,53 Although the meningeal growth may mimic meningiomas on MRI, histiocytic sarcomas lack the firm texture of meningiomas on gross examination.
MRI features of granular cell tumors
Meningeal granular cell tumors are rare in dogs and cats. 49 Tumors typically consist of extraparenchymal plaques with strong contrast enhancement that closely resemble en plaque meningiomas (Fig. 4i–l).2,41 In dogs, granular cell tumors are often slightly hyperintense on pre-contrast T1W images (Fig. 4i) and may have any type of T2W signal.2,41 However, an extraparenchymal lesion with both hyperintensity on pre-contrast T1W images and T2W hypointensity (Fig. 4k) is a feature of granular cell tumors that is not present in other neoplasms. 41 Granular cell tumors are often associated with evidence of mass effect and perilesional edema.
Gross pathology of granular cell tumors
Granular cell tumors consist of pale-yellow meningeal plaques or less often nodules involving the meninges of cerebral convexities or less commonly other locations (Fig. 4l). 2 Tumors may infiltrate the underlying neuroparenchyma and frequently cause perilesional edema.
Intraparenchymal Tumors
The main differential diagnoses for intraparenchymal tumors are glioma (astrocytoma, oligodendroglioma, ependymoma), lymphoma, and histiocytic sarcoma.30,64,65,69,71,76 Oligodendrogliomas and astrocytomas account for approximately 35% of all primary brain tumor in dogs and 12% of all primary brain tumors in cats.64,65,69,71 Most canine gliomas are high-grade tumors with oligodendrogliomas accounting for 70% of all gliomas. 32 In cats, astrocytomas are more common than oligodendrogliomas.69,71 Ependymomas are rare ventricular tumors and will be discussed in the intraventricular tumor section.
MRI features of gliomas
Most oligodendrogliomas and astrocytomas appear as solitary lesions that can range from well-demarcated and nodular or lobular to amorphous and infiltrative neoplasms (Fig. 5).70,78 Subsets of glioma such as butterfly glioma, widespread neuroparenchymal glioma (gliomatosis cerebri), and widespread leptomeningeal glioma (leptomeningeal gliomatosis) may be associated with evidence of multifocal or diffuse neuroparenchymal involvement.6,30,61,63 Butterfly gliomas consist of tumors that involve both cerebral hemispheres, with the tumor spread through the corpus callosum.30,61 Widespread neuroparenchymal glioma consists of gliomas that involve more than two contiguous regions of the brain with or without a primary mass.30,63 The MRI lesion burden has been shown to underestimate the histologic tumor extent in these cases, especially infiltrative cases without a primary mass and with minimal or no distortion of the neuroparenchyma, with regions of brain appearing normal on MRI often being histologically infiltrated by neoplastic cells.30,63 It can be challenging to discriminate peripherally located, contrast-enhancing intraparenchymal tumors from extraparenchymal lesions on MRI. In these cases, careful assessment for the presence of a dural tail sign, claw sign, or calvarial changes can assist in correct lesion localization. The presence of a dural tail sign has been shown to be an accurate and reliable indicator of the presence of an extraparenchymal tumor (meningioma), while the claw sign has 85% sensitivity and 80% specificity for localizing a tumor to the intraparenchymal compartment.22,25 Changes in the calvarium adjacent to a lesion are also more commonly associated with extraparenchymal tumors, although they may occasionally be associated with intraparenchymal neoplasms.16,52
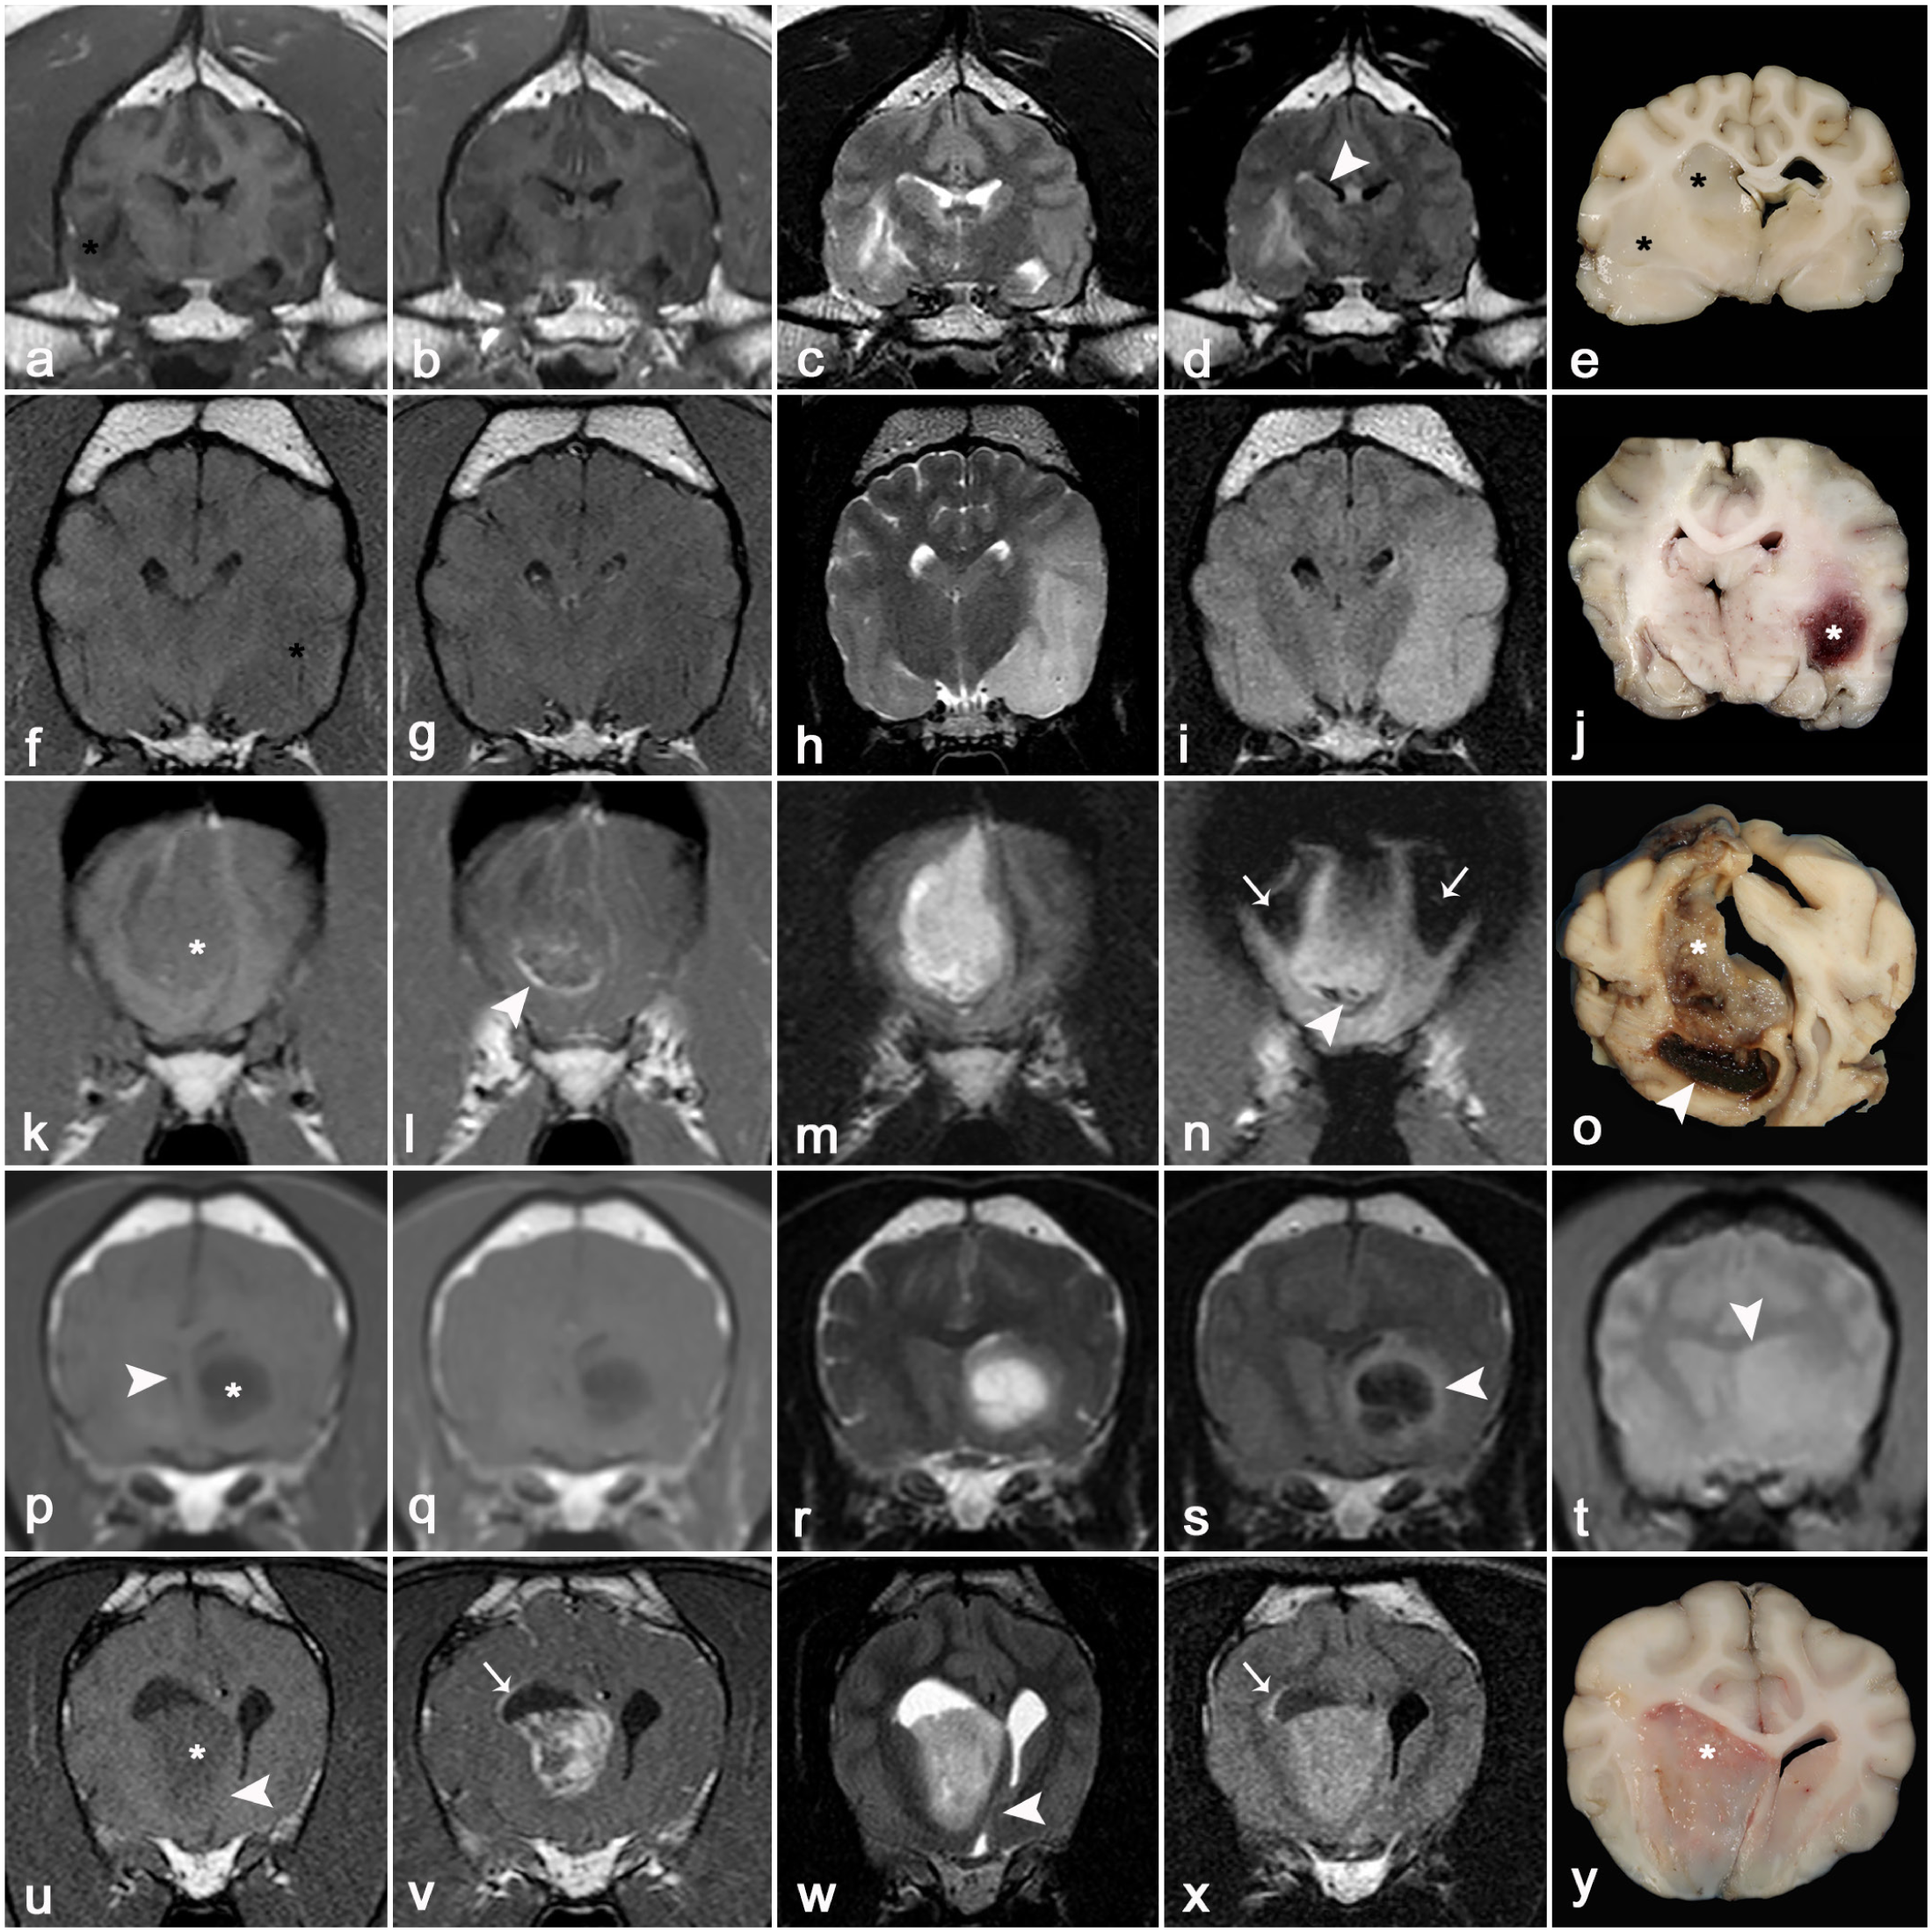
Magnetic resonance imaging (MRI) and gross features of intraparenchymal neoplasms in dogs and cats. (a–e) Low-grade oligodendroglioma (right piriform lobe, basal nuclei, and thalamus) in a dog. The tumor (asterisk) is poorly defined, heterogeneously iso- to hypointense on T1-weighted (T1W) images (a, b), and heterogeneously hyperintense on T2-weighted (T2W) (c) and FLAIR (d) images, with no enhancement on the post-contrast T1W (b) image. The tumor compresses the right lateral ventricle (arrowhead). (e) The neoplasm (asterisks) is poorly demarcated, white, and gelatinous and compresses the right lateral ventricle, causing a midline shift to the left. (f–j) High-grade astrocytoma (left piriform lobe) in a dog. The tumor (asterisk) is predominantly and mildly T1W hypointense (f, g), heterogeneously T2W (h), and FLAIR hyperintense (i) and is non-enhancing on the post-contrast T1W image (g). (j) The red (hemorrhagic) tumor (asterisk) expands the left piriform lobe, resulting in a mild midline shift to the right. (k–o) High-grade astrocytoma (right frontal lobe) in a dog. The tumor (asterisk) is predominantly T1W isointense with some peripheral T1W hyperintensity in the dorsal aspect of the lesion (k). It has mild, heterogeneous, ring-like enhancement (arrowhead) on the post-contrast T1W image (l) and is heterogeneously T2W hyperintense (m). The region of hypointensity (arrowhead) in the ventral aspect of the tumor on the T2*-GRE image (n) corresponds to one of the hemorrhagic foci identified at autopsy. The symmetrical hypointense areas (arrows) in the T2*-GRE image (n) are expected artifacts on this sequence, resulting from the air-bone interface at the frontal sinuses. (o) The tumor (asterisk) is white and gelatinous with extensive red areas of hemorrhage (arrowhead). (p–t) Low-grade oligodendroglioma (left basal nuclei) in a dog. The tumor (asterisk) is non-enhancing and has the T2W-FLAIR mismatch sign. It appears as a smoothly marginated T1W hypointense (p), non-enhancing on the post-contrast T1W image (q), and T2W hyperintense (r) lesion. On the FLAIR sequence (s), the tumor has a null (hypointense) central signal surrounded by a hyperintense rim (arrowhead). The mass is isointense on T2*-GRE (t). The tumor causes midline shift to the right and distortion of the left lateral ventricle (arrowhead) (t). (u–y) High-grade oligodendroglioma (right basal nuclei) in a dog. The tumor (asterisk) expands the right caudate nucleus and is hypointense on the pre-contrast T1W image (u), has strong but heterogeneous enhancement on the post-contrast T1W image (v), and is heterogeneously T2W (w) and FLAIR hyperintense (x). The tumor causes a midline shift to the left (arrowhead) and distorts both lateral ventricles (w). There is an area of contrast enhancement and FLAIR hyperintensity (v, x) extending along the dorsolateral surface of the right lateral ventricle (arrows). This tumor has the T2W (w) and FLAIR (x) hyperintense signal pattern that predominates among gliomas when compared to the oligodendroglioma displaying the T2W-FLAIR mismatch sign (r, s). (y) The white to pink gelatinous neoplasm (asterisk) expands the right basal nuclei and compresses the lateral ventricle, causing a midline shift to the left.
The signal intensities displayed by gliomas on T1W, T2W, and FLAIR MRI sequences demonstrate tremendous variability and are generally non-specific for the diagnosis.4,34,40,43,74 The large degree of overlap of imaging features among gliomas is the reason that oligodendrogliomas and astrocytomas cannot be reliably differentiated or graded on MRI.4,30,62,66,78 The predominant signal characteristics include iso- to hypointensity on pre-contrast T1W images (Fig. 5a, f, p, u), iso- to hyperintensity on T2W (Fig. 5c, h, m, r, w) and FLAIR (Fig. 5d, i, x) images, and hyperintensity on DWI/ADC sequences. For gliomas, tumor histologic margins are best represented by the extent of the T2W hyperintense lesion burden observed on MRI. 29 Intratumoral signals are frequently heterogeneous because of cysts, hemorrhage, mineralization, or necrosis (Fig. 5j, n, o).5,30,66,78 Gliomas have highly variable degrees and patterns of contrast enhancement on post-contrast T1W sequences (Fig. 5b, g, l, q, v), with homogeneous, heterogeneous, or ring-type patterns.1,5,66,78 Manifestations of mass effect and peritumoral edema are reported in more than 85% of gliomas.30,62,66,70,78
There are certain MRI features that have been variably associated with specific types and grades of gliomas, but these have not been consistently demonstrated across multiple studies. 40 Astrocytomas are reportedly more likely to be T1W iso- to hyperintense than oligodendrogliomas, whereas oligodendrogliomas are more likely to be T1W hypointense and smoothly marginated (Fig. 5p, u).5,30 Oligodendrogliomas are reported to more frequently contact or distort the ventricles than astrocytomas.30,78 Histologically high-grade gliomas are significantly more likely to have contrast enhancement and spread to surrounding brain structures.1,30,78 The T2W-FLAIR mismatch sign (lesions that appear homogeneously T2W hyperintense and have a hypointense FLAIR signal with hyperintense peripheral rim) has been identified as an MRI marker for oligodendrogliomas in dogs (Fig. 5p–t). 20 Although uncommon in canine glioma, the T2W-FLAIR mismatch sign has a reported 100% specificity for the diagnosis of oligodendroglioma and is more often seen in non-enhancing, low-grade oligodendrogliomas. 20
Gross pathology of gliomas
In dogs and cats, most oligodendrogliomas and astrocytomas occur in the telencephalon (Fig. 5), particularly in the olfactory, frontal, temporal, and piriform lobes, and the diencephalon, with infratentorial brain structures much less frequently involved.30,32,64,65,69,70,71 Oligodendrogliomas tend to be well-demarcated, white, soft gelatinous tumors (Fig. 5y), whereas most astrocytomas are poorly demarcated, white to pale yellow or red (Fig. 5j) neoplasms.32,58 However, some astrocytomas may be nodular and well-demarcated. High-grade oligodendrogliomas and astrocytomas may have extensive red to brown areas of necrosis and/or hemorrhage (Fig. 5j, o) and may occasionally have local meningeal or ventricular involvement.32,58
Intraventricular Tumors
In the brain, intraventricular tumors (Fig. 2) may arise from or secondarily involve the lateral ventricles, interventricular foramina, third ventricle, mesencephalic aqueduct, or fourth ventricle.4,40 CPTs are the most commonly diagnosed intraventricular tumor in dogs, whereas intraventricular gliomas are uncommon and ependymomas are rare.4,10,40,42,56,73 In cats, meningiomas of the third ventricle, ependymoma, glioma, and CPT are the main differentials for intraventricular tumors, although their frequency is currently unknown.11,12,71 Confirmed CPTs have not been described in the brain of cats. 13 Common MRI features associated with intraventricular tumors include their propensity to cause obstructive hydrocephalus (Fig. 6) and their failure to suppress CSF signal (intraventricular hyperintensity) on FLAIR sequences due to severe CSF pleocytosis or increased protein content. 11
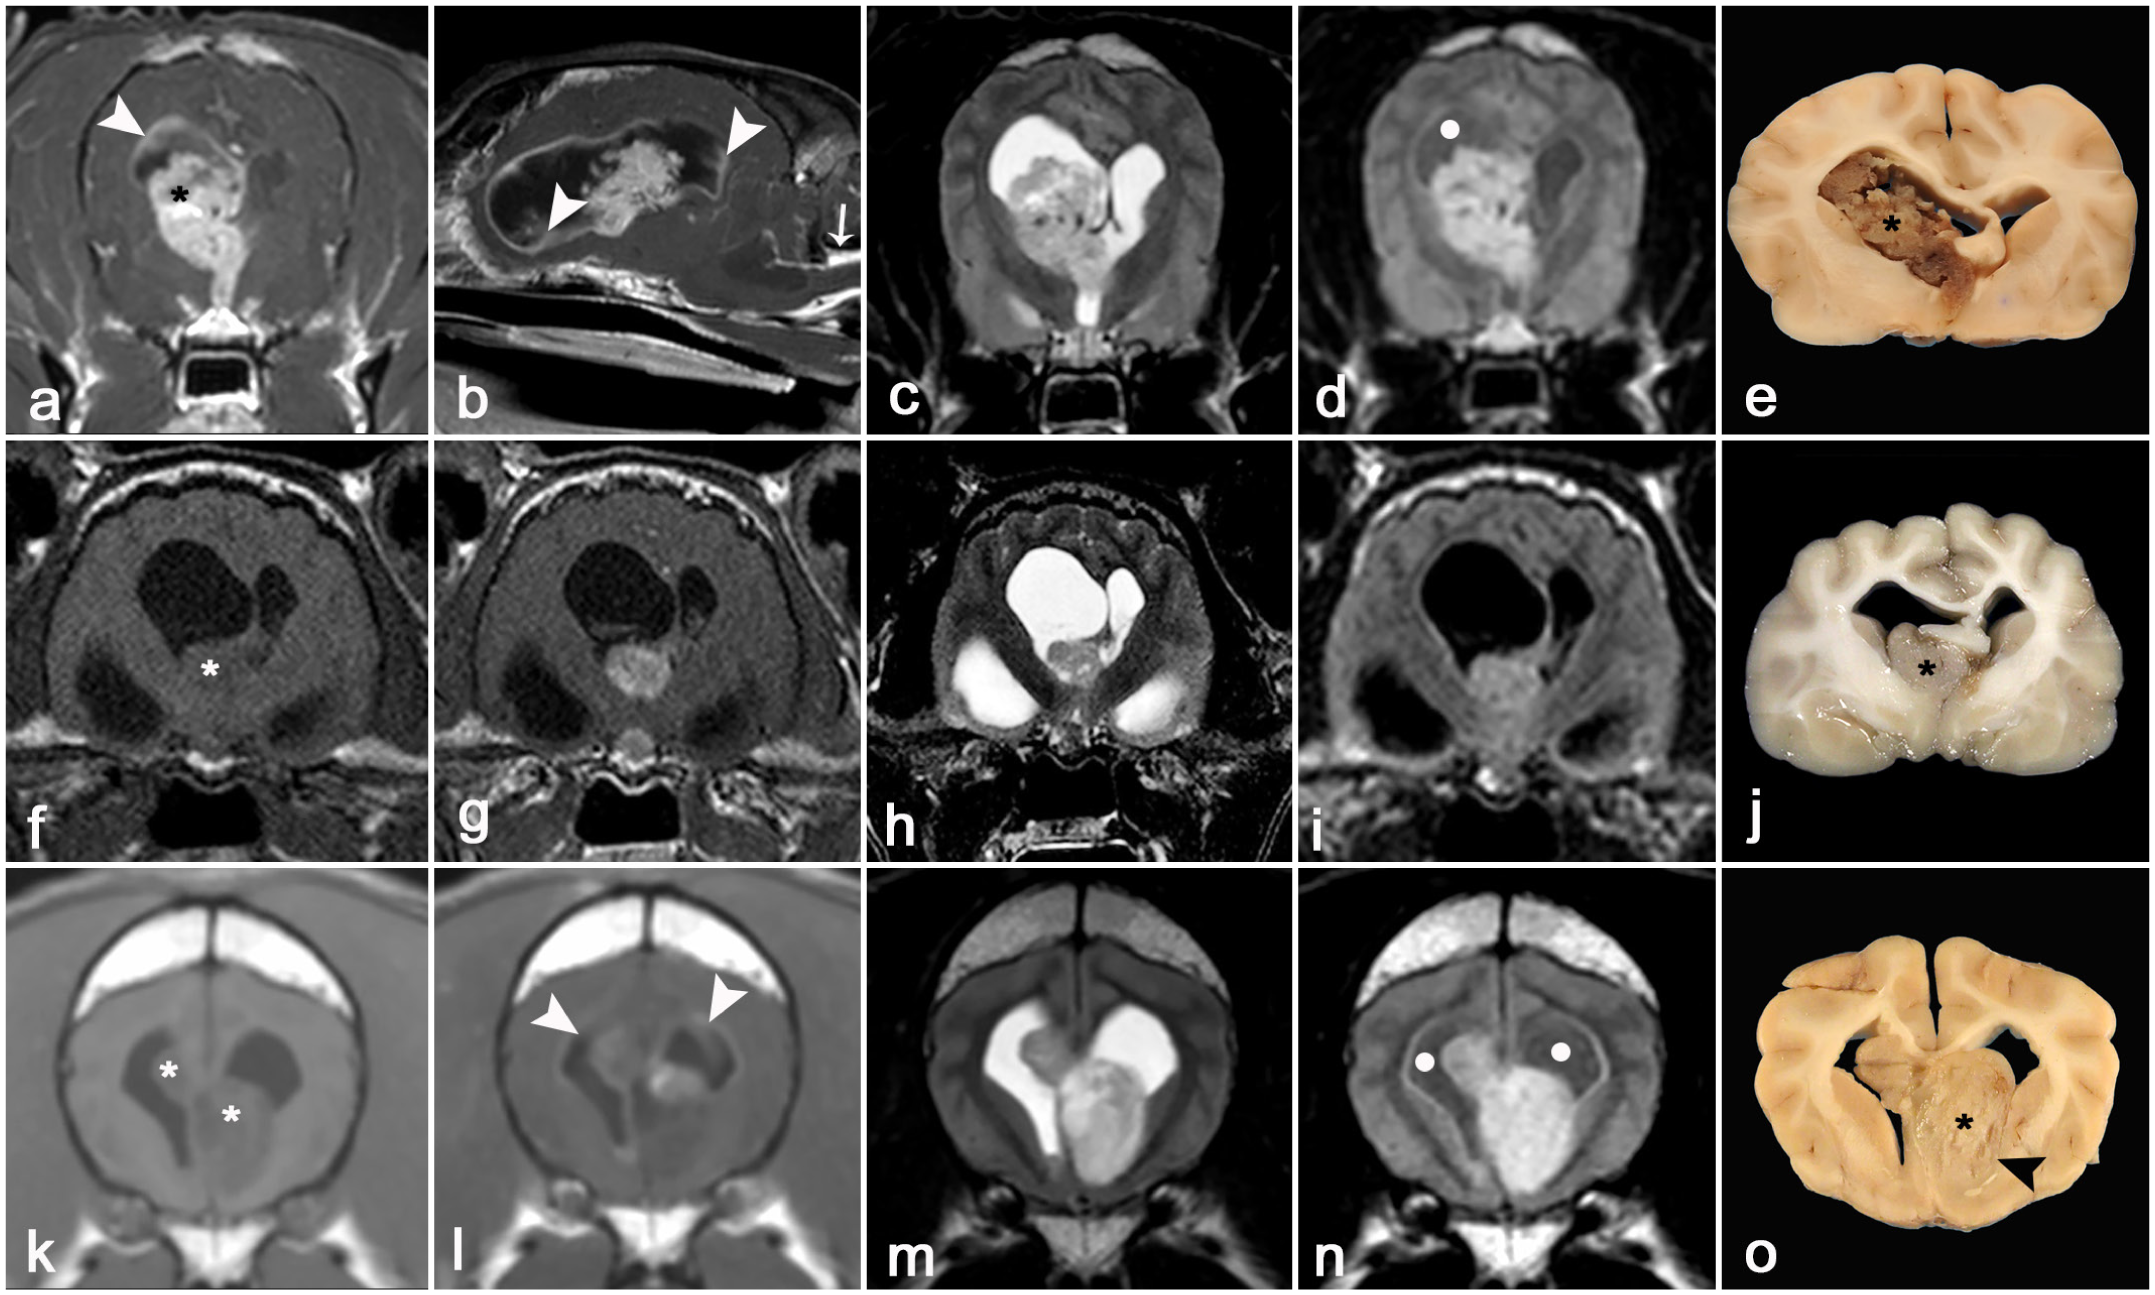
Magnetic resonance imaging (MRI) and gross features of intraventricular neoplasms of dogs and cats. (a–e) Choroid plexus carcinoma (right lateral ventricle) in a dog. The tumor (asterisk) expands the right lateral ventricle, extends through the interventricular foramen into the rostral aspect of the third ventricle, and causes lateral ventriculomegaly. The tumor has marked, heterogeneous contrast enhancement on post-contrast transverse (a) and sagittal T1-weighted (T1W) images (b), with abnormal contrast enhancement of the entire lining of the right lateral ventricle, including discrete ependymal nodules (arrowheads, histologically confirmed as drop metastatic implants). There is marked circumferential meningeal contrast enhancement of the cranial cervical spinal cord segments, representing meningeal carcinomatosis (arrow, b). The tumor is heterogeneously T2-weighted (T2W) (c) and FLAIR (d) hypo- to hyperintense, with punctate hypointense regions representing intratumoral hemorrhage. The ependymal surface of the lateral ventricles has mild FLAIR hyperintensity (d), and the FLAIR cerebrospinal fluid signal within the lateral ventricles demonstrates incomplete suppression and appears abnormally hyperintense (dot, d). This is more apparent in the right lateral ventricle and indicates increased protein or cellular content of the cerebral spinal fluid (CSF). (e) The right lateral ventricular neoplasm (asterisk) is pale brown and extends into the left lateral and third ventricles. The lateral ventricles are asymmetrically dilated, and there is a midline shift to the left. (f–j) Papillary ependymoma (right lateral ventricle) in a cat. The tumor (asterisk) is isointense on the pre-contrast T1W image (f), well-defined and T1W contrast-enhancing (g), and heterogeneously T2W (h) and FLAIR (i) hyperintense. The mass expands the ventral and medial aspect of the right lateral ventricle, displacing the septum pellucidum toward the left and resulting in obstructive hydrocephalus. The CSF signal within both ventricles is appropriately suppressed on the FLAIR image (i). (j) The right lateral ventricular neoplasm (asterisk) is pale tan and leads to displacement of the septum pellucidum toward the left with obstructive hydrocephalus. (k–o) High-grade oligodendroglioma with bilateral ventricular involvement in a dog. The tumor (asterisks) appears hypointense on pre-contrast T1W images (k) and has mild and heterogeneous T1W contrast enhancement (l). The largest portion of the multilobular mass is in the left lateral ventricle but extends into the right lateral ventricle. Both lateral ventricles are dilated, and their surface is seeded by drop metastatic deposits (arrowheads, l) of contrast-enhancing tumor. The mass is heterogeneously T2W (m) and FLAIR (n) hyperintense. The ependymal surface of the lateral ventricles is FLAIR hyperintense, and the FLAIR CSF signal within the lateral ventricles demonstrates incomplete suppression (dots, n). (o) The neoplasm (asterisk) is pale yellow, arises from the subependymal neuroparenchyma (arrowhead), and occupies the right and left lateral ventricles.
MRI features of choroid plexus tumors
CPTs comprise approximately 7% to 10% of all primary brain tumors of dogs.64,65 CPTs are identified most frequently in the fourth ventricle, followed by the third and lateral ventricles, 73 and often assume a papilliform to globular shape (Fig. 6a–e). The T1W, T2W, and FLAIR signal intensities of CPTs on MRI are often heterogeneous (Fig. 6a–d). However, tumors are frequently reported as iso- to hyperintense on T1W and T2W sequences because of intratumoral cysts, hemorrhage, necrosis, or mineralization.73,77 Most CPTs have strong contrast enhancement on post-contrast T1W images. Secondary changes associated with CPTs include herniation, obstructive hydrocephalus, and periventricular edema, which appears as T2W and FLAIR periventricular hyperintensities (transependymal migration of CSF). Distinguishing between a choroid plexus papilloma and carcinoma on MRI can be challenging. A papillary morphology is frequently associated with choroid plexus papilloma, whereas intraventricular or subarachnoid contrast-enhancing drop metastases are much more suggestive of choroid plexus carcinoma (Fig. 6a, d).73,77 Drop metastases are tumor implants located anywhere within the brain or spinal cord CSF pathways distant from the primary tumor.73,77
Gross pathology of choroid plexus tumors
Most CPTs are well-demarcated, white to red, and often granular or papilliform intraventricular masses that are frequently associated with midline shift and ventricular dilation (Fig. 6e).10,73 Choroid plexus carcinomas may infiltrate the surrounding neuroparenchyma or leptomeninges, or disseminate to distant CNS sites via the ventricular system or subarachnoid space.10,73 Although most tumors are single, multiple tumors may occur.
MRI features of ependymomas
Most ependymomas are intraventricular tumors that affect primarily the lateral ventricles but may also occur in the third or fourth ventricles and rarely in the central spinal canal (Fig. 6f–j).70,76 Ependymomas are uncommon in cats and rare in dogs.42,70,76 On MRI, ependymomas usually appear as well-delineated, oval intraventricular masses that are heterogeneously iso- to hyperintense on pre-contrast T1W images and have some degree of contrast enhancement and hyperintensity on T2W and FLAIR images (Fig. 6f–i). 11 Mass effect, periventricular edema, and obstructive hydrocephalus are frequent secondary changes observed on MRI studies of ependymomas (Fig. 6f–i). 11
Gross pathology of ependymomas
Ependymomas arise from the ventricular wall and typically appear as well-demarcated, tan to white, soft intraventricular masses that expand the affected ventricle and cause obstructive hydrocephalus (Fig. 6j).42,76 Extraventricular (intraparenchymal) ependymomas involving the subarachnoid space and adjacent neuroparenchyma are described rarely in cats. 76
MRI features of intraventricular gliomas
Here, we discuss oligodendrogliomas and astrocytomas that also arise within or infiltrate the ventricular system from their periventricular location (particularly oligodendrogliomas and astrocytomas).51,56 Histologic evidence of intraventricular invasion occurs in approximately 32% of canine gliomas. 30 In dogs and cats, oligodendrogliomas are the most frequently reported intraventricular glioma (Fig. 6k–o), whereas astrocytomas with ventricular involvement rarely occur.6,12,30,33,56 The MRI features and neuropathologic features of intraventricular gliomas are similar to those described for intraparenchymal gliomas, although intraventricular gliomas are frequently associated with drop metastases and are typically not as markedly or uniformly contrast-enhancing as CPTs (Fig. 6l, o).6,30 On MRI, it can be difficult to discriminate gliomas with ventricular involvement (those that infiltrate the ventricle) from those that arise from subependymal neuroparenchyma and that are only in intimate contact with the ventricular system.
Gross features of intraventricular gliomas
These tumors arise from the periventricular neuroparenchyma and extend into the ventricular system, typically resembling their purely neuroparenchymal counterparts.51,56
Conclusions
MRI is a crucial component in the pathologic evaluation of intracranial tumors in dogs and cats, as it provides additional clinical context in which tissue changes can be assessed and interpreted by the pathologist. MRI accurately determines the tumor location, extent, margins, and secondary effects, allowing meaningful correlation with gross and histologic findings. However, because diagnostic pathologists may not be familiar with diagnostic imaging and its terminology, this review is intended to serve as a concise source of information summarizing the main diagnostic features of MRI findings found in the most common intracranial neoplasms of dogs and cats.
Supplemental Material
sj-pdf-1-vet-10.1177_03009858261461763 – Supplemental material for Magnetic resonance imaging of primary central nervous system neoplasms of dogs and cats: Basic concepts for diagnostic pathologists
Supplemental material, sj-pdf-1-vet-10.1177_03009858261461763 for Magnetic resonance imaging of primary central nervous system neoplasms of dogs and cats: Basic concepts for diagnostic pathologists by John H. Rossmeisl, Daniel Cimino, Taryn A. Donovan and Daniel R. Rissi in Veterinary Pathology
Footnotes
Acknowledgements
We thank Dr Mario A Neto for the brain illustration in Fig. 2. We also thank Dr Jamie Haddad (image 3l, also part of Fig. 2), Dr Heather Daverio (image 5y, also part of Fig. 2), Dr John Robertson (image 5o), and the late Dr Robert Duncan (image 3p) and Dr Bernard Jortner (images 4h, 6e, and 6o) for allowing us to use their autopsy images. Select MRI studies appearing in this manuscript were supported by NCI R01CA276233 and NCI P01CA207206 to JHR.
Supplemental Material for this article is available online.
Declaration of Conflicting Interests
The authors declared the following potential conflicts of interest with respect to the research, authorship, and/or publication of this article: Authors DRR and TAD are members of the Editorial Board of Veterinary Pathology and have no further conflicts to declare.
Funding
The authors received no financial support for the research, authorship, and/or publication of this article.
References
Supplementary Material
Please find the following supplemental material available below.
For Open Access articles published under a Creative Commons License, all supplemental material carries the same license as the article it is associated with.
For non-Open Access articles published, all supplemental material carries a non-exclusive license, and permission requests for re-use of supplemental material or any part of supplemental material shall be sent directly to the copyright owner as specified in the copyright notice associated with the article.