
Abstract
Processing the spatial frequency components of an image is a crucial feature for visual perception, especially in recognition of faces. Here, we study the correlation between spatial frequency components of images of faces and neuronal activity in monkey amygdala while performing a visual recognition task. The frequency components of the images were analyzed using a fast Fourier transform for 40 spatial frequency ranges. We recorded 65 neurons showing statistically significant responses to at least one of the images used as a stimulus. A total of 37 of these neurons (n = 37) showed significant responses to at least three images, and in eight of them (8/37, 22%), we found a statistically significant correlation between neuron response and the modulus amplitude of at least one frequency range present in the images. Our results indicate that high spatial frequency and low spatial frequency components of images influence the activity of amygdala neurons.
Introduction
Human ability to distinguish faces is mostly based on spatial frequency information. Low spatial frequency (LSF) components contain information about location and appearance (Costen, Parker, & Craw, 1996; Schyns & Oliva, 1994), whereas high spatial frequency (HSF) components contain information about specific facial characteristics (Hayes, Morrone, & Burr, 1986; Liu, Collin, Rainville, & Chaudhuri, 2000).
There is common consensus that the magnocellular and the parvocellular pathways of the visual system are responsible for sending information about the spatial frequency components in an image to different areas of the brain, one of them being the amygdala (Vuilleumier, Armony, Driver, & Dolan, 2003). The magnocellular system is composed of neurons that are poor at detecting spatial information but which provide high temporal resolution, thus contributing to the temporal domain information of the images. On the other hand, the parvocellular system processes information about both LSF and HSF components, providing a detailed spatial domain analysis of the images (Livingstone & Hubel, 1987, 1988).
There is some evidence that spatial frequency components in visual images have modulatory effects on amygdala neurons (Hayes et al., 1986; Holmes, Winston, & Eimer, 2005; Inagaki & Fujjita, 2011; Morawetz, Baudewig, Treue, & Dechent, 2011; Nasanen, 1999; Ottaviani et al., 2012; Said, Baron, & Todorov, 2009; Vuilleumier et al., 2003).
Several studies suggest that amygdala neurons increase their firing rate to signal the LSF component of the images (Inagaki & Fujita, 2011; Vuilleumier et al., 2003), suggesting that facial information is represented in the amygdaloid complex using LSF information. It has been reported that facial images with strong LSF components are recognized more quickly than those which have predominantly HSF components (Vlamings, Goffaux, & Kemner, 2009; Winston, Vuilleumier, & Dolan, 2003).
In an fMRI study (Vuilleumier et al., 2003) using images with emotional components, the authors observed that predominantly LSF-weighted images produced more activation in the amygdala than those with more HSF components. However, other studies suggest that facial representation in amygdala depends equally on both LSF and HSF components (Costen, Parker, & Craw, 1996; Nasanen, 1999; Said et al., 2009), while a recent study found no significant differences between amygdala neuron responses to LSF and HSF components of filtered facial images (Morawetz et al., 2011).
In our study, images of faces were presented to monkeys so they may perform a facial recognition task. We analyzed the activity of amygdala neurons to look for a relationship between neuronal activity and the LSF and HSF components of the images. The aim was to determine whether amygdala neurons are sensitive to SF components of facial images and subsequently establish if they respond equally to both LSF and HSF components.
Materials and Methods
Two male monkeys (Macaca Mulatta, body weight 5.4 and 6.3 kg) were used in this study. All the animal procedures were approved by the Institutional Animal Care Committee of the University of Santiago de Compostela. The experimental setup was similar to that described previously (Gonzalez, Krause, Perez, Alonso, & Acuna, 1993; Perez, Castro, Justo, Bermudez, & Gonzalez, 2005). A rigid post to fixate the head to a head-holder system and a cylindrical stainless steel chamber were implanted on the skull in order to access the right amygdala. A portion of the skull within the chamber was removed (5 mm diameter craniotomy) to gain access to the brain with microelectrodes. Microelectrode penetrations were made using an electrohydraulic microdriver mounted on the chamber (Narishige, Tokyo, Japan). For surgical procedures, the monkeys were sedated with ketamine i.m. (10 mg/kg), followed by sodium pentobarbital i.v. (27 mg/kg) to achieve deep anesthesia. Analgesics and antibiotics (noramidorpirine i.m. 150 mg/kg and penicillin i.m. 50,000 IU/kg) were administered postsurgery. The implant was cleaned and sterilized as and when required.
The monkeys were required to perform a visual recognition task. We used a total of 11 images, 3 were associated with a reward and 8 had no reward association (Figure 1(a)). The monkeys sat, with their heads fixed, on a primate chair in a dark room and faced a conventional color cathode ray tube monitor placed 57.7 cm directly in front of them. Ocular movements were monitored with an infrared camera system. A frame grabber attached to a conventional personal computer was used to detect the corneal reflex in the left eye. Images were randomly presented for a period of 750 ms, followed by a variable intertrial interval ranging from 300 to 600 ms (Figure 1(b)). Each image had 480 × 480 pixels and subtended 18.5° × 18.5° of visual angle. During the stimulus period, the monkey was required to keep visual fixation at the center of the screen and press a key only when reward-associated images appeared. If the key was pressed while a reward-associated image was presented, a drop of water was given and the task continued with the next image randomly chosen. If the key was pressed when a nonreward image was present, the trial was aborted and restarted beginning with a nonreward image. When the key was not pressed while a reward image was presented, the task continued with another randomly chosen image. Pressing the key within the first 120 ms after the onset of the image presentation caused the trial to be aborted and restarted with a new image. All images were equated for a mean luminance of 21.6 cd/m2 using a photometer (Sekonic Digi-Spot, Model L488 Sekonic Corporation, Tokyo, Japan).
Scheme and cronograme of the task. (a) Visual stimuli and task. Images of human neutral faces in different views combined with images of complex stimuli. A total of 11 images were used, 3 of them were associated to reward and the other 8 images were not associated with reward. We used a blank image as control. The images were presented randomly on a computer screen, and the animal had to press the lever in order to obtain a reward, exclusively with reward associated images. Cronograme showing the time intervals of the task (b).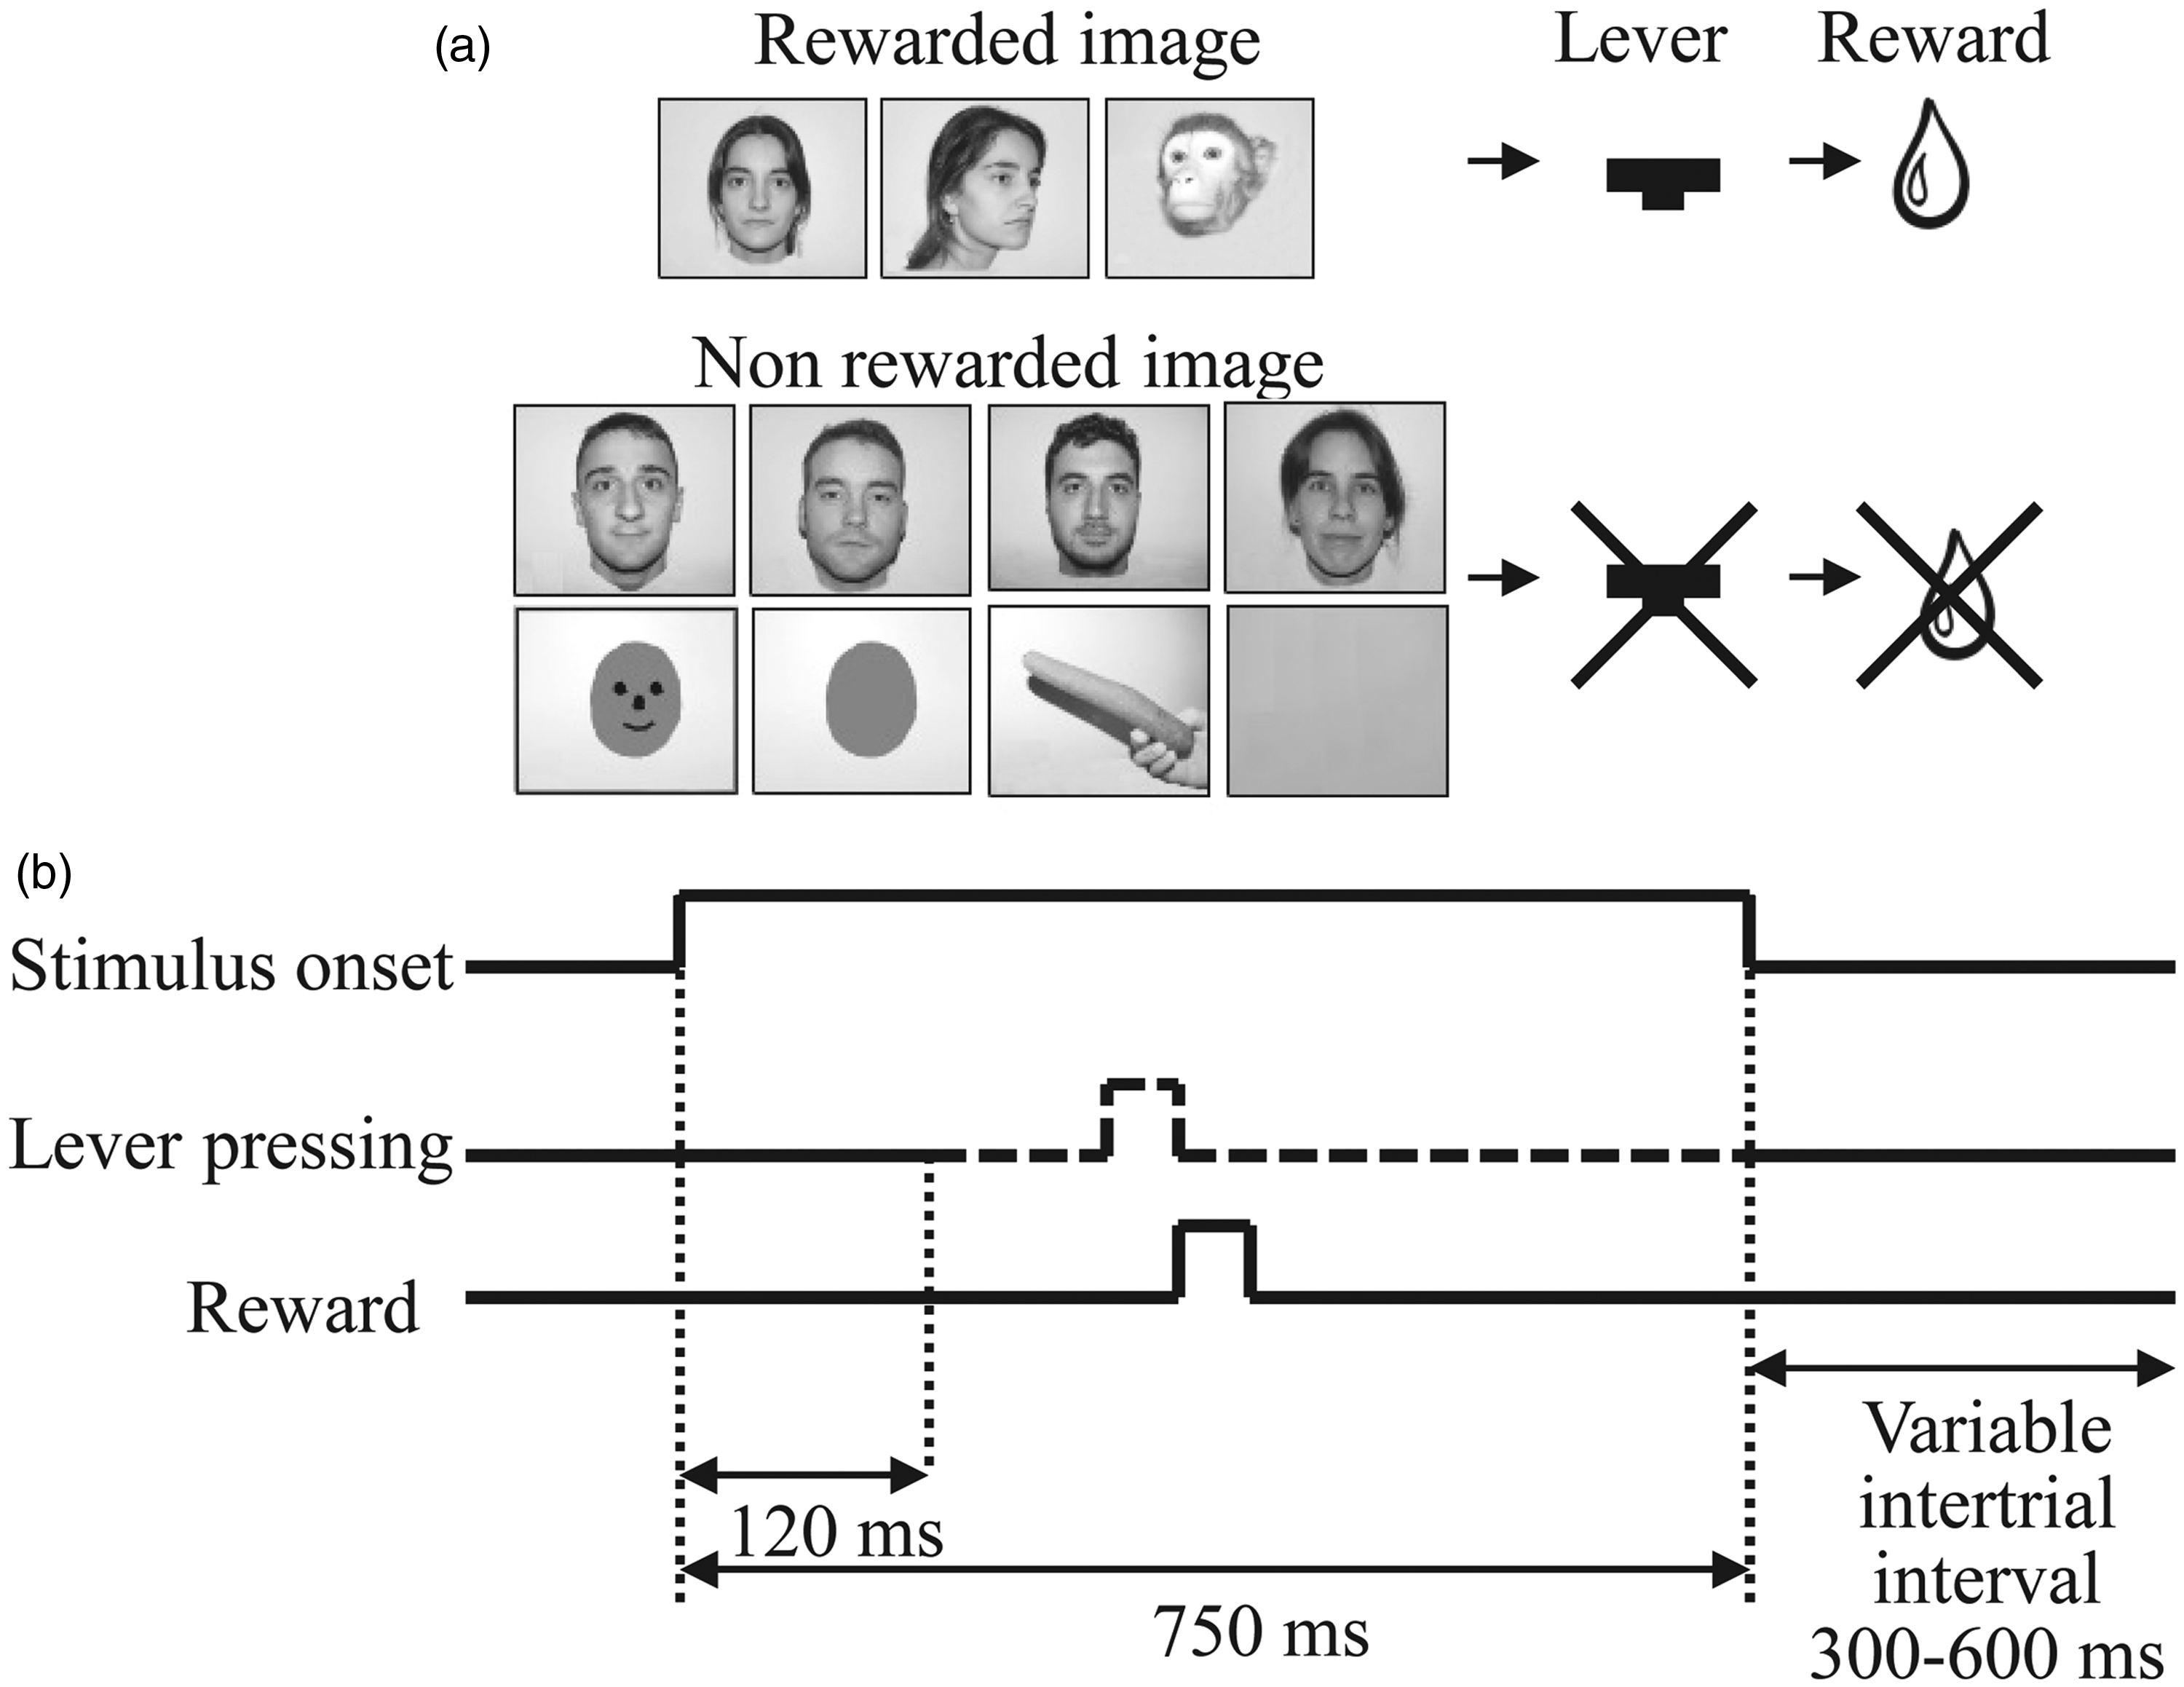
Visual stimuli (shown in Figure 1(a)) were created from seven photographs of five different people and one monkey showing a different facial profile. These images were mixed with a further four photographs: a blank image (used as control), a carrot, a gray circle, and a simple drawing of a face. Three of these 11 images were always associated with a reward, while the remaining 8 were not associated with any reward.
Neuronal activity was recorded using metal microelectrodes (AM-Systems Inc., Washington DC, USA). The voltage signals were amplified and filtered through conventional electronic equipment (Bak Electronics, Rockville, MD, USA), sampled at 1 kHz, stored with stimulus and event markers, and monitored on an oscilloscope. At the end of each experiment, we isolated single action potentials from the digitized recording by using a time-amplitude window.
The neuronal responses and image frequency characteristics were quantitatively analyzed off-line by our own Matlab scripts (Matlab; The Mathworks Inc., Natick, MA, USA). We quantified the neuronal response to each image to compare the basal response rate of the neuron (neuronal activity during the 250 ms prior to stimulus onset) with the poststimulus response rate (neuronal activity during the 300 ms after stimulus onset) for each image presentation (spikes/s). Then, the mean firing rate for each neuron was calculated using data from at least 25 image presentations. The neuronal responses to each image were assessed according to the analysis of variance test (p < .05). We focused our analysis on neurons with a statistically significant response to at least three images. The responses of these neurons were studied for a possible correlation between the neuronal response and the spatial frequencies of each image. To characterize the relationship between spatial frequency and neuronal activity, we performed a fast Fourier transform for each image and calculated the mean modulus amplitude of 40 frequency ranges from 0.3 to 11.1 cycles/deg (approximately 0.3 cycle steps; Figure 2(a)). The correlation index between each mean modulus and the neuron mean response rate was calculated for each image. Thus, we obtained 40 correlation indexes for each neuron and each image. A statistically significant correlation (p < .05) indicates that the neuronal activity is related to a particular frequency range (Figure 2(b)).
Data analysis. (a) A fast Fourier transform were used in our experiment to determine the frequency components of each image, from 0.3 to 11.1 cycles/deg. We selected 40 ranges of frequency. Representation of correlation indexes plotted against each frequency range. Blank points mean correlation indexes with p < .05 (b).
The monkeys were sacrificed at the end of the experiments with a high dose of pentobarbital i.v. The animals’ brains were perfused with 10% formaldehyde, removed, and fixed in the same solution for several days. They were then cut into 50 micron sections and stained with toluidine blue. Recording tracks were reconstructed using the marks left by the electrode lesions, the readings in the microdriver manipulator and the location of the electrode penetrations relative to the center of the craniotomy.
Results
All neuronal activity was recorded from the right amygdala in both animals. In these nuclei, we observed that 65 neurons had a statistically significant response (p < .05) to at least one facial image used as a stimulus. A total of 37 neurons (n = 37, 57%) responded to three or more facial images and were selected for a possible correlation between the neuronal response and the spatial frequencies of each image presented.
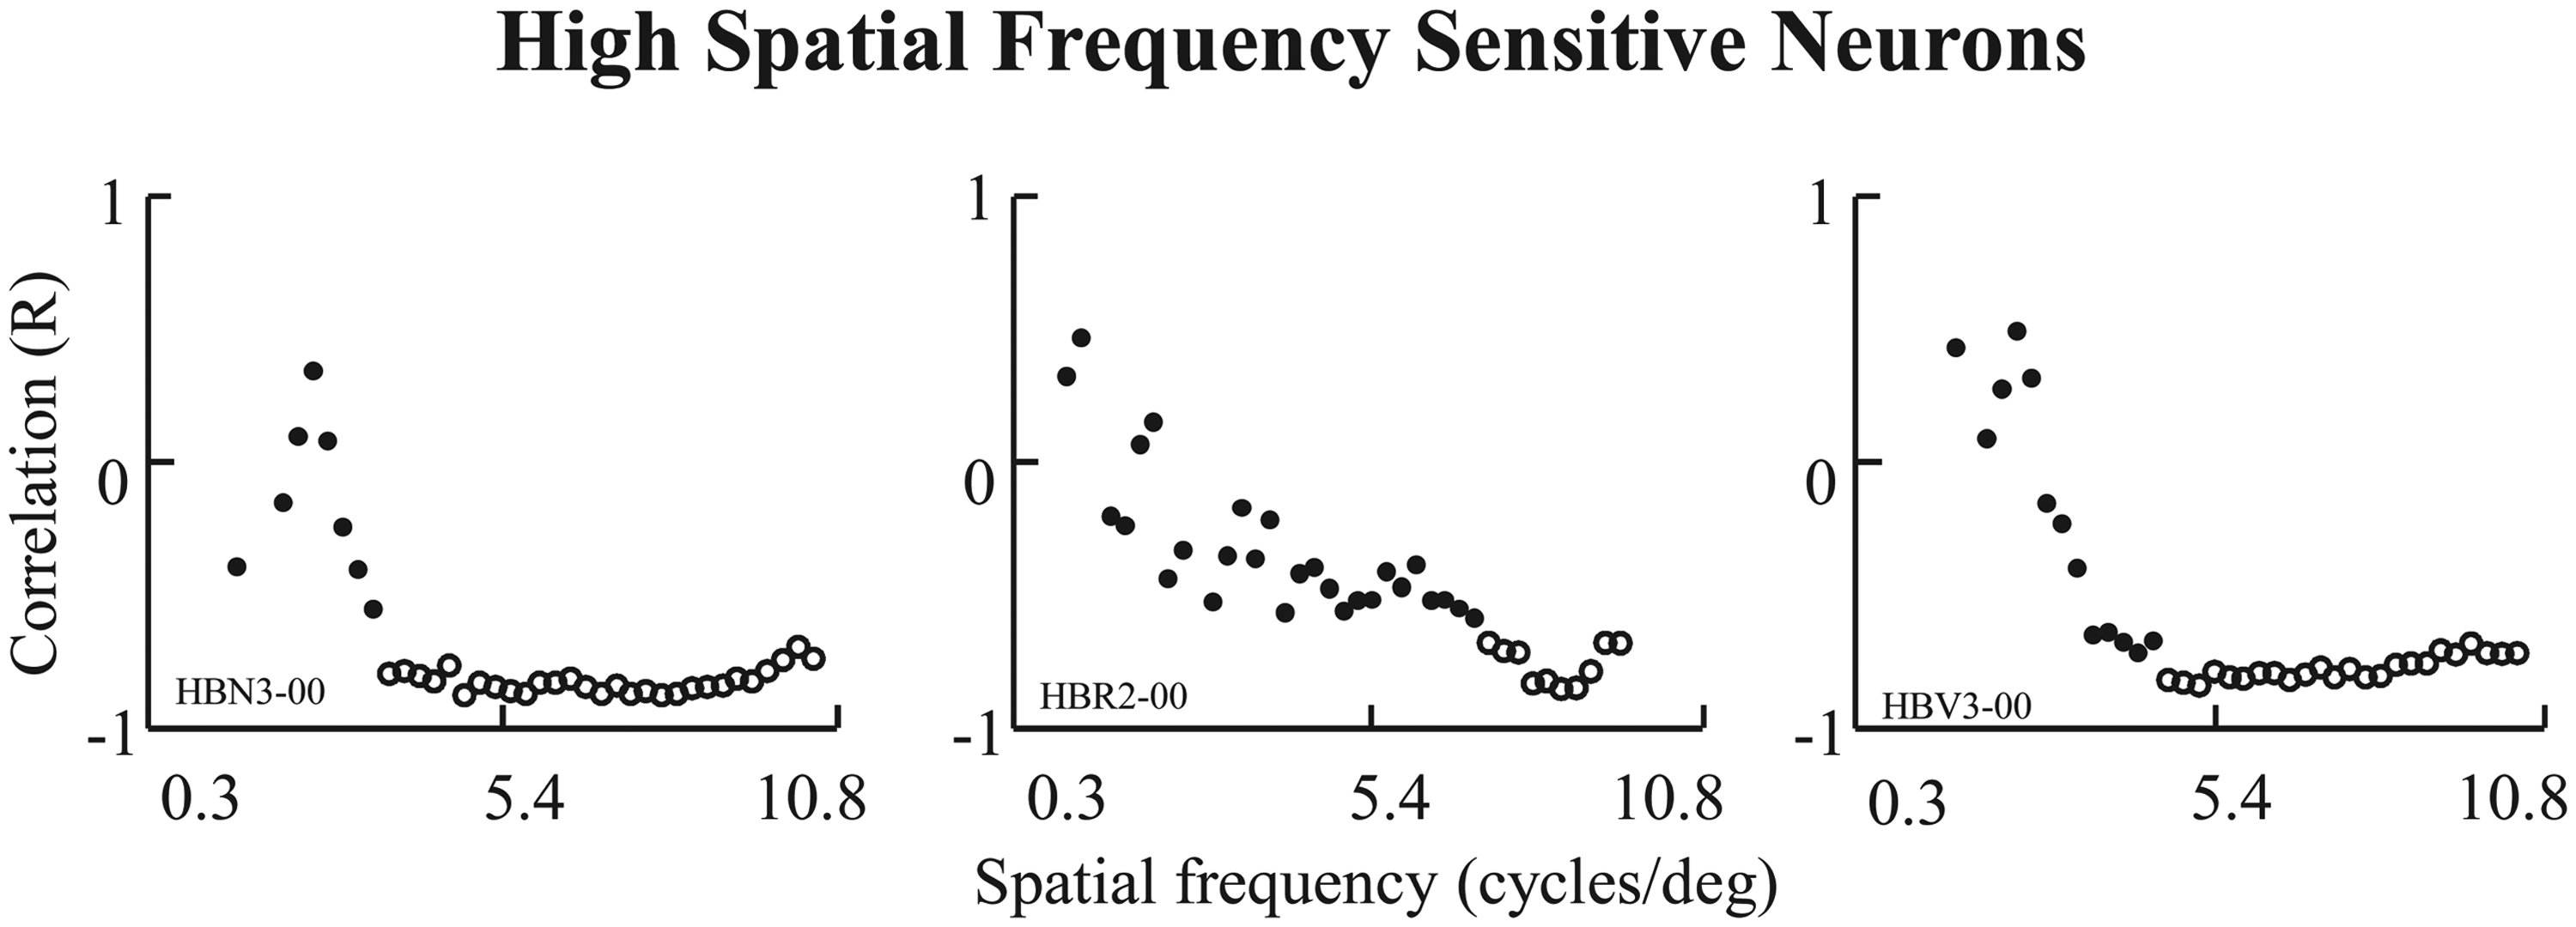
Eight of these multiresponse neurons (8/37, 22%) revealed neuronal activity that correlated significantly with the mean modulus amplitude of at least one frequency range. These neurons typically showed a high correlation for either LSF or HSF, with no abrupt transition between both. There were no statistically significant responses to the blank image used as a control (p < .05). The high correlation was related to the LSF components in five neurons (62%) and the HSF components in three neurons (38%). Figures 3 and 4 show the range of spatial frequency components for which amygdala neurons presented statistically significant correlations between neuronal responses and spatial frequency components of the stimuli (p < .05). Figure 3 shows three neurons with a high correlation (p < 0.05) for LSF components, which are restricted to spatial frequencies of less than 3 cycles/deg. On the contrary, the neurons shown in Figure 4 display a high correlation (p < .05) between neuron discharges and the HSF components of the stimuli.
Low spatial frequency sensitive neurons. Results of correlation indexes against spatial frequency. This three neurons show a significant correlation for LSF components. Blank points means correlation indexes with p < .05. High spatial frequency sensitive neurons. Results of correlation indexes against spatial frequency. This three neurons show a significant correlation for HSF components. Blank points means correlation indexes with p < .05.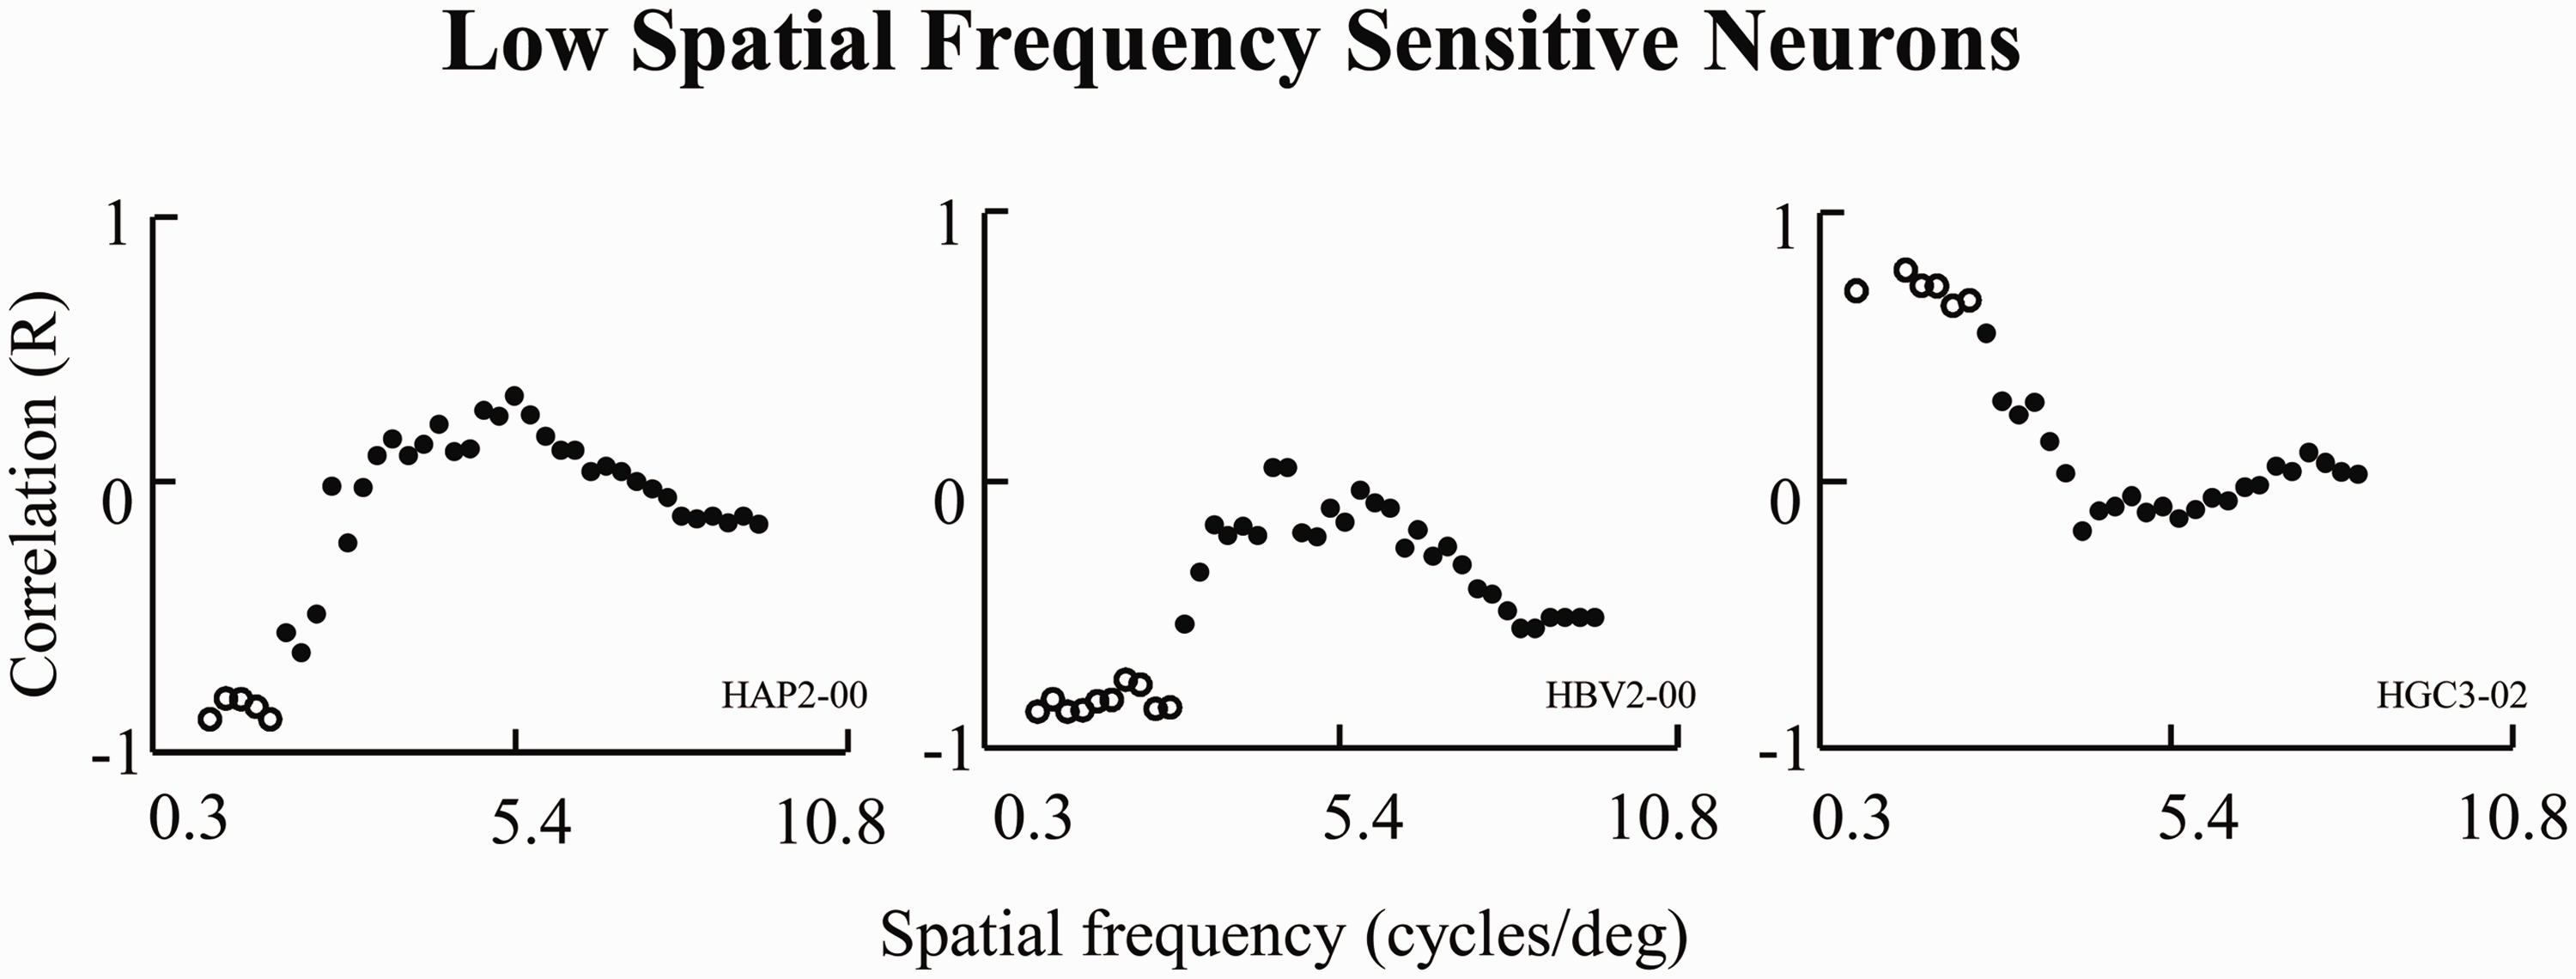
Discussion
In our study, amygdala neurons increased their firing activity in response to the presentation of visual stimuli. The change in activity of these neurons was not related to other elements of the task. Many studies have shown that amygdala neurons play an important role in the processing of visual information (Aggleton, Burton, & Passingham, 1980; Amaral, Price, Pitkanen, & Carmichael, 1992; Kuraoka & Nakamura, 2007; Malkova, Graffan, & Murray, 1997; Sah, Faber, Lopez De Armentia, & Power, 2003), and it has been observed that the emotional component of the visual stimuli influences the activity of amygdala neurons (Amaral, 2002; Vuilleumier, 2005; Vuilleumier et al., 2003). A novelty in our results is that neural responses were elicited by neutral and not by emotional faces. Fusiform gyrus, a structure known to be related to face recognition (Damasio, Damasio, & Van Hoesen, 1982), and amygdala are both connected (Amaral, 2002). It may be possible that our neurons are the first target of the fusiform input providing information on facial features with no emotional component.
The amygdala receives information from visual cortical areas (LeDoux, 1995, 2003). Visual cortical inputs originating from the anterior part of the inferotemporal (IT) cortex and the temporal pole (Tanaka, 1996) reach the dorsal part of the lateral amygdala (McDonald, 1998). These cortical areas are sensitive to complex visual stimuli, a feature also observed in the amygdala (Leonard, Rolls, Wilson, & Baylis, 1985; Nakamura, Mikami, & Kubota, 1992; Wilson & Rolls, 1993). It is well known that faces provide a relevant stimulus for amygdala neurons (Gothard, 2014; Inagaki & Fujjita, 2011; Kuraoka & Nakamura, 2007; Leonard et al., 1985; Morecraft et al., 2007).
We used a set of neutral faces as stimuli and a blank image as a control. Our experiments revealed neuronal activity changes when different faces were used as visual stimulus. Many of our recorded neurons showed clear responses to a given face, but a number of them also responded to more than one face. These neurons presented a response profile dependent on the spatial frequency components displayed in the image. Sensitivity toward different frequency components of visual stimuli is a known feature in the visual pathway, mostly in the first stages of the visual pathway (Graham, 1994; Malone, Kumar, & Ringach, 2007; Olzak & Thomas, 2003; Pasupathy, 2006).
The spatial frequency components of images have also been reported as having an influence on neuronal activity in the IT (Bermudez, Vicente, Romero, Perez, & Gonzalez, 2009; DiCarlo & Maunsell, 2003; Pasupathy, 2006; Pollen, Nagler, Daugman, Kronauer, & Cavanagh, 1984; Sripati & Olson, 2009), a high level area of the visual pathway. A recent study carried out in our laboratories found that a relevant number of IT neurons display a significant correlation with the spatial frequency of the images used as stimuli (Bermudez, Vicente, Romero, Perez, & Gonzalez, 2009). Since the amygdala receives inputs from the temporal cortex (Tanaka, 1996), it is possible that the sensitivity we observed to spatial frequencies could be mediated by these inputs.
A basic feature of the visual neurons is that they function as tuned spatial filters, preserving the information about the spatial frequency components of the images. There are experimental and theoretical reports in the literature supporting the hypothesis that the visual system uses Gabor filters (Jones & Palmer, 1987; Jones, Stepnoski, & Palmer, 1987) or difference-of-Gaussians filters (Rodieck, 1965).
There is evidence that the retinal image is initially processed through visual filters (Campbell & Robson, 1968; Irvin, Casagrande, & Norton, 1993) that the neurons in the primary visual cortex are sensitive to spatial frequency (Campbell & Robson, 1968; De Valois, Albrecht, & Thorell, 1982) and that the visual system carries a frequency-related code (Georgeson, 1980).
It has been suggested (Vuilleumier et al., 2003) that subcortical tecto-pulvinar pathways provide the amygdala with coarse, but rapid, fear-related information based on LSF components. On the other hand, cortical pathways would provide slower conscious analysis based on HSF. The response profile of our neurons did not show differences in response latency. It is possible that latency differences may be determined by the emotional component of the image. Since we have used neutral images, latency differences in neurons may not have been evident. fMRI studies showed that emotional properties of visual stimuli influence amygdala neural activity (Vuilleumier, 2005; Vuilleumier et al., 2003). Spatial frequency components of a visual stimulus seem to contribute to its cognitive evaluation and are important for visual perception (Rotshtein, Schofield, Funes, & Humphreys, 2010). Some reports suggest that HSF information is used to detect facial expression, whereas LSF is used to indentify emotions (Schyns & Oliva, 1994; Vuilleumier et al., 2003). However, other studies indicate that the perception of emotional expressions actually involves both coarse and fine information, and the amygdala seems use this information to decode facial expression (Pessoa & Adolphs, 2010).
Our findings show that a population of amygdala neurons is sensitive to LSF of visual stimuli, whereas other population is sensitive to HSF components. This dual sensitivity may indicate that frequency information is used for facial processing in this nucleus, probably to detect facial expressions and eventually generate different emotional situations. This is in line with previous studies that reported sensitivity to the spatial components of the images in the amygdala (Morawetz et al., 2011; Vuilleumier et al., 2003), in such a way that responses to fearful expressions were greater for low-frequency than for high-frequency faces. This is related with the hypothesis that amygdala neurons sensitive to LSF components of images contribute to detect possible dangers whereas HSF components provide precise and detailed information for other purposes (Morris, Ohman, & Dolan, 1999). In our experiments, we did not use fear faces; therefore, we are not able to confirm that neurons sensitive to LSF were more related to fear than to neutral faces. However, our results provide neurophysiological evidence that amygdala neurons are sensitive to the spatial frequency components of visual stimuli.
It is known that the amygdala is related to reward (Bermudez & Schultz, 2010; Everitt, Morris, O’Brien, & Robbins, 1991; Pratt & Mizumori, 1998) and that influences behavior on the basis of reward expectation (Baxter & Murray, 2002; Bermudez & Schultz, 2010). Studies with animals have shown that the amygdala processes reward information and encodes reward predictive stimuli during reinforcement learning (Bermudez & Schultz, 2010; Bermudez, Gobel, & Schultz, 2012; Nishijo, Ono, & Nishino, 1988; Sanghera, Rolls, & Roper-Hall, 1979; Zhang et al., 2013). In a recent study (Montes-Lourido, Vicente, Bermudez, & Gonzalez, 2015), we found a group of amygdala neurons that increased their firing rate after reward delivery, and this reward-related activity was independent of the stimulus sensory modality. However, the responses of the neurons we report here were not related to reward as they showed similar response profile for reward than for non-reward images. This is agreement with other authors who found visual responses in the amygdala that were unrelated to expected reward (Peck, Peck, & Salzman, 2014). Reported data on amygdala activity suggest that most amygdala neurons are selective for a particular stimulus or task element (Montes-Lourido et al., 2015 Nakamura et al., 1992). Probably, our neurons are selective to visual stimuli and receive visual information from the IT cortex, where sensitivity to LSF and HSF components of the images has been reported (Bermudez, Vicente, Romero, Perez, & Gonzalez, 2009). It is possible that, in the amygdala, these neurons represent the first stage involved in visual processing, which in further stages may lead to a particular emotional context.
Footnotes
Declaration of Conflicting Interests
The author(s) declared no potential conflicts of interest with respect to the research, authorship, and/or publication of this article.
Funding
The author(s) disclosed receipt of the following financial support for the research, authorship, and/or publication of this article: This work was partially supported by grants BFU-2010/14968 from the Ministerio de Ciencia e Innovacion, RETICS Oftared RD12/0034/0017.