






Abstract
Autism spectrum disorder (ASD) refers to neurodevelopmental disorders characterized by symptoms such as social deficits and restricted interests and behavior. Several studies have investigated specific sensory processing in relation to ASD traits. However, findings appear to be inconsistent and inconclusive because of variation in ASD traits among participants and differences in the tasks adopted. In this study, we investigated relationships between sensory thresholds in visual, auditory, and tactile modalities and various ASD traits to account for individual variability of traits in typically developing adults using the same experimental tasks. We estimated detection and discrimination thresholds for brightness, sound pressure, and vibrotactile stimulus strength. We also estimated the degree of ASD traits in each participant with a questionnaire. We found that higher tactile detection and visual discrimination thresholds were related to ASD traits in difficulty of communication. A lower tactile discrimination threshold and higher visual detection threshold was also related to the ASD trait of strong focus of attention. These findings suggest the existence of unique relationships between particular low-level sensory processing and specific ASD traits, indicating that irregularities in sensory processing may underlie variation in ASD traits.
Keywords
Introduction
Autism spectrum disorder (ASD) refers to a group of neurodevelopmental disorders characterized by symptoms such as deficits in social communication and social interaction as well as restricted and repetitive interests and behavior patterns (American Psychiatric Association, 2013). Within the subcriteria of restricted and repetitive interests and behavior patterns, behaviors associated with difficulties in sensory processing (e.g., hyper- or hyposensitivity) are frequently observed in people with ASD (Tomchek & Dunn, 2007).
ASD characteristics are not regarded as unique to people diagnosed with ASD, but as traits that can be observed in typically developing (TD) people (Baron-Cohen, 1995; Frith, 1991). Indeed, ASD traits have been defined as laying on a continuum from autism to TD (Baron-Cohen et al., 2001; Wheelwright et al., 2010; Woodbury-Smith et al., 2005). The autism-spectrum quotient (AQ) was developed to measure these traits among individuals with typical intelligence (Baron-Cohen et al., 2001). In addition to total scores reflecting overall tendencies of ASD, the AQ includes five subscales: social skills, communication, attention switching, attention to detail, and imagination.
It has been pointed out that the atypical sensory characteristics like hyper–hypo sensitivity are related to the difficulties in social communication and the repetitive behavior or interests in ASD (Baum et al., 2015; Jeste & Nelson, 2009; Leekam et al., 2011; Wallace & Stevenson, 2014) among multiple sensory modalities (e.g., tactile, auditory, and vision; Dunn, 1997; Tomchek & Dunn, 2007). For example, specific relationships between social abilities and tactile processing are reported: Sensitivity of touch in daily life as measured with a questionnaire was associated with difficulties in social communication in people with ASD (Hilton et al., 2010). A positive correlation between social communication difficulties and brain activities to tactile stimuli was also reported in a functional magnetic resonance imaging study (Cascio et al., 2012). A unique relationship was also shown for visual processing. For instance, training using a visual cue was shown to improve communication skills in children with ASD (Lal & Bali, 2007; Shane, 2006). For auditory modality, Kargas et al. (2015) showed that people with ASD with more restricted and repetitive behaviors or interests showed a greater ability to discriminate intensity and pitch of auditory stimuli. These findings clearly suggest that atypical sensory processing could underlie higher cognitive irregularities in ASD.
Although studies of ASD have investigated irregularities in processing within each sensory modality, the findings are not always consistent (Marco et al., 2011). On tactile modality, for instance, Blakemore et al. (2006) reported hypersensitivity in people with an diagnosed with ASD. They delivered vibrotactile stimuli to the fingertips of individuals both with and without ASD and estimated detection thresholds. They showed that individuals with ASD had lower thresholds (i.e., were more sensitive) for 200 Hz vibration than those without ASD. In contrast, Puts et al. (2014) reported that individuals with ASD showed higher detection thresholds (i.e., were less sensitive), when 25 Hz stimuli were presented to the participants’ fingers. Other studies have reported no differences in the detection thresholds of people with and without ASD with tactile stimulations of 33, 40, and 250 Hz to the participants’ fingers or palms (Cascio et al., 2008; Güçlüü et al., 2007). Similar discrepancies were reported for auditory processing (Haesen et al., 2011; Kellerman et al., 2005). Kargas et al. (2015) measured auditory discrimination thresholds for sound pressure, reporting that these were higher for people with ASD compared with TD people. In contrast, Jones et al. (2009) reported no difference in discrimination thresholds between individuals with and without ASD. As for atypical aspects of visual processing in ASD (Wang et al., 2007), Bertone et al. (2005) estimated contrast discrimination thresholds for grating patterns and found that they were lower in people with ASD than in TD people. However, other studies using similar methods have shown no difference in discrimination thresholds between people with and without ASD (Rivest et al., 2013).
One of the most plausible reasons for these discrepancies among the studies investigating atypical lower level sensory processing in ASD is that they did not take individual differences in ASD characteristics into consideration. As has been reported, characteristics of ASD can vary among individuals (Baron-Cohen et al., 2001). However, previous studies investigating atypical sensory processing in ASD have mainly compared sensory processing between people with and without ASD not focusing on individual differences of ASD characteristics. Recent studies have consistently reported that some unique relationships exist between particular ASD characteristics, higher visual processing (Lowe et al., 2018; Stevenson et al., 2018), and audiovisual interactions (Donohue et al., 2012; Hidaka & Yaguchi, 2018; Stevenson et al., 2017; Yaguchi & Hidaka, 2018). Therefore, it is highly likely that lower level processing in each sensory modality would also have unique relationships with particular ASD characteristics.
This study aimed to explore the relationships between the various ASD traits and low-level sensory processing patterns. Here, we recruited TD adults to participate in this study. As mentioned earlier, ASD traits have been defined as laying on a continuum from autism to TD (Baron-Cohen et al., 2001; Wheelwright et al., 2010; Woodbury-Smith et al., 2005). The various dimensions of ASD traits can be measured with the five subscales of the AQ (Baron-Cohen et al., 2001). It has been reported that sensory sensitivity (i.e., visual, auditory, tactile, gustatory, olfactory, and proprioceptive) measured with self-reported questionnaires (Horder et al., 2014; Robertson & Simmons, 2013), multisensory integration (Donohue et al., 2012), and functional connectivity in the brain (Jung et al., 2014) all differ depending on AQ scores in TD people. Palmer et al. (2015) also investigated the pattern of ratings for all items in the AQ with cluster analysis. They reported that TD adults could be divided into two subgroups in terms of their ASD traits; the first showed higher social difficulties and lower attention to detail while the second showed the opposite tendency. These results indicate that ASD traits are highly variable even among TD adults. In fact, studies investigating higher visual (Lowe et al., 2018; Stevenson et al., 2018) and multisensory processes (Donohue et al., 2012; Hidaka & Yaguchi, 2018; Stevenson et al., 2017; Yaguchi & Hidaka, 2018) showed that these sensory processes have some unique relationships with particular ASD characteristic. Thus, investigations of TD participants are useful to uncovering the relationships between patterns of low-level sensory processing and specific ASD characteristics.
In addition, concerning the instabilities or inconsistencies in the findings of the previous studies for the people with ASD, experimental stimuli, procedures, and tasks could be considered. Generally, it is difficult for participants with ASD to complete precise psychophysical tasks in which there is continuous testing across numerous trials such as the method of constant stimuli. Therefore, previous studies investigating atypical lower level sensory processing in ASD have mainly adopted tasks with lesser loads, such as using the staircase method. The method of constant stimuli can randomly introduce a range of stimuli, which allow us to exclude possible order effects including predictions of stimuli that the people with ASD show a certain characteristic (Pellicano & Burr, 2012). In addition, each previous study has focused on a different index of sensory sensitivity (i.e., detection threshold or discrimination threshold) with inconsistent stimuli dimensions. The method of constant stimuli enables us to reliably provide multiple measurements (point of subjective equality (PSE), just noticeable difference (JND), and intercept) for detection and discrimination tasks, which allow us to estimate participants’ sensory and response characteristics. Here, we used the method of constant stimuli with TD adults who are capable of completing continuous psychophysical tasks across relatively large numbers of trials, whereas this is typically difficult for individuals with ASD. In addition to precise estimation of participants’ sensory abilities, our experiment measured multiple sensory modalities in the same person during the same experimental session. By using TD adult participants, we can precisely estimate relationships between sensory processing and multiple ASD traits among a relatively large number of participants, while the limited number of individuals with ASD (approximately 6–30 ASD participants) was used in most of the previous studies.
In our experiment, we estimated the magnitude of participants’ ASD traits with the Japanese version of the AQ (Wakabayashi et al., 2004) focusing on the five-subscale scores. We also measured visual, auditory, and tactile detection and discrimination thresholds at once to investigate which sensory indices are well related to ASD traits. We predicted that subscale scores concerning social communication (social skill, communication, and imagination) would be related to tactile and visual thresholds (Cascio et al., 2012; Hilton et al., 2010; Lal & Bali, 2007; Shane, 2006). We also predicted that subscale scores concerning restricting and repetitive behavior (attention to detail or attention switching) would be related to the auditory threshold (Kargas et al., 2015).
Methods
Participants
In this study, we included data from 53 participants (13 males and 40 females, Rikkyo University students, mean age = 19.04 years, standard deviation [SD] = 0.85 years) with reportedly normal or corrected-to-normal vision and hearing. An additional 19 people participated but were excluded from later analysis because their data were regarded as being poorly fitted to a psychometric function (see “Data Analysis” section for further details).
The local ethics committee of Rikkyo University approved the experimental procedures. The experimental procedures were performed in accordance with the approved guidelines and the Declaration of Helsinki. Informed consent was obtained from each participant before conducting the experiments.
Apparatus
We presented visual stimuli on a CRT display (EIZO FlexScan T776, 19-in., 1,280 × 1,024 pixels, refresh rate 60 Hz) and auditory stimuli via an audio interface (Roland, EDIROL UA-25 EX) and noise isolating, airtight headphones (Sennheiser, HDA200). Tactile stimuli were presented via an attachable speaker (Eishin, M-PZT-02) and stereo amplifier (Eishin, ED-PZT01B) to the participants’ left index fingers. The distance between the CRT display and participants was 57.3 cm fixed by a chin rest, and the luminance of the display was measured with a luminance meter (Cambridge Research Systems; ColorCAL MKII Colorimeter). The Psychophysics Toolbox (Brainard, 1997; Pelli, 1997) of MATLAB (MathWorks Inc.) was used to control the experiment. Participants responded with a keyboard, and the experiments were conducted in a dark room. After the experimental task, participants completed the Japanese version of the AQ (Wakabayashi et al., 2004) to measure ASD traits.
Stimuli
For the visual detection task, the luminance of the display was gamma-corrected to linearize from black (grayscale value 0; 0.08 cd/m2) to white (grayscale value 255; 71.04 cd/m2). The visual stimulus was a white disk (1° in diameter) presented for 100 milliseconds on a gray background (35.42 cd/m2) at 5° below a red fixation cross (14 cd/m2) with different grayscale values (estimated luminance values) of 129 (35.98 cd/m2), 130 (36.26 cd/m2), 131 (36.53 cd/m2), 132 (36.81 cd/m2), 133 (37.09 cd/m2), 134 (37.37 cd/m2), or 135 (37.65 cd/m2). For the auditory detection task, a beep (2000 Hz) was presented for 50 milliseconds with different sound pressure levels (15, 19, 23, 27, 31, 35, or 39 dBA). For the tactile stimulus, a vibration (200 Hz) was presented for 50 milliseconds to participants’ left index fingers with different amplitudes (37, 43, 46, 47, 48, 51, or 57 dB).
For the visual discrimination task, a white disk was presented for 180 milliseconds against a gray background at 5° below a white fixation cross. The disk appeared twice separated by a 530-millisecond interstimulus interval (ISI). The luminance of the standard stimulus was set at 143 (39.87 cd/m2) of the grayscale value (estimated luminance values). The comparison stimuli were presented at 143, 145 (40.43 cd/m2), 147 (40.99 cd/m2), 149 (41.54 cd/m2), 151 (42.10 cd/m2), 153 (42.66 cd/m2), or 155 (43.21 cd/m2) of the grayscale value (estimated luminance values). For the auditory task, a 150-millisecond beep was presented twice with a 500-millisecond ISI. The sound pressure level of the standard stimulus was set at 50 dBA. The comparison stimuli were presented at 50, 53, 56, 59, 62, 65, or 68 dBA. For the tactile stimuli, the vibration was presented twice with an 800-millisecond ISI. The amplitude of the standard stimulus was set at 65 dB, with comparison stimuli presented at 65, 66, 67, 68, 69, 70, or 71 dB.
These stimulus parameters were determined based on our pilot experiments in order to obtain psychometric functions for each task. We also confirmed that each participant could not hear a noise delivered from the tactile stimuli during the tactile detection and discrimination tasks.
Procedure
In the detection tasks, a stimulus at one of the seven different magnitudes was presented with fixation for each sensory task. The participants were asked to report whether the stimulus was perceived as presented or not when the fixation point disappeared (Figure 1a). The stimuli were presented 10 times at each intensity such that participants performed 70 trials in each sensory task.

Panel A: Schematic illustrations of the experimental design for the detection task. A stimulus at one of the seven different magnitudes was presented with fixation for each sensory task. Participants were asked to report whether the stimulus was perceived as presented or not when the fixation point disappeared. Panel B: Schematic illustrations of the experimental design for the discrimination task. The standard stimulus and a comparison stimulus at one of the seven different magnitudes were sequentially presented with fixation. Participants were asked to report which stimulus was perceived as stronger when the fixation point disappeared.
In the discrimination tasks, two stimuli were sequentially presented with fixation. One stimulus was the standard stimulus, and the other was the comparison stimulus at one of the seven different magnitudes. Participants were asked to report which stimulus was perceived as stronger when the fixation point disappeared (Figure 1b). Each comparison stimulus was presented 10 times such that participants performed 70 trials in each sensory task. The presentation order of the standard and comparison stimuli was randomized in each trial and counterbalanced among each task.
Stimuli at different magnitudes were randomly presented in each task and modality for each participant and were counterbalanced among the participants. The detection and discrimination tasks were conducted consecutively in each sensory modality. The order of the tasks and the tested sensory modalities were randomized for each participant and counterbalanced among the participants.
We introduced a relatively small number of trials for detection and discrimination tasks, because, we needed to prevent the participants from being too fatigued when performing six sensory tasks. In our detection tasks, we also did not include the trials without targets to keep the number of the trials as small as possible. We asked the participants to take a short break between the tasks. It took 8 minutes per task, and the testing session took a total of about 55 minutes including breaks.
Evaluation of ASD Characteristics
After the experimental session, we asked participants to complete the Japanese version of the AQ. The results of the AQ have been confirmed to be similar between Japan and the United Kingdom, suggesting sufficient reliability and validity of the Japanese questionnaire (Wakabayashi et al., 2004). The AQ is a self-reported questionnaire comprising 50 items describing ASD traits. Participants are asked to evaluate the degree to which they fit the descriptions of each item on a 4-point scale. As in the original studies (Baron-Cohen et al., 2001), items that participants scored as 1 or 2 (3 or 4 points for reverse items) were given 1 point. Higher scores indicate a greater magnitude of ASD traits with a score of over 33 as the cutoff for a diagnosis of ASD (Baron-Cohen et al., 2001). We also calculated scores for the five subscales (social skills, attention switching, communication, attention to detail, and imagination) with the same method used to calculate the total score. According to Baron-Cohen et al. (2001), the 50 items were divided into five subscales with 10 items each. Higher scores indicated poorer social skills, communication, imagination, lower tendency to engage in attention switching, and a higher tendency for attention to detail.
Data Analysis
The method of constant stimuli enabled us to obtain psychometric functions of detection and discrimination performances. We fitted functions to each participant’s psychometric function using the psignifit version 2.5.6 (Wichmann & Hill, 2001) and the curve fitting toolbox in MATLAB. We fitted a sigmoid function for the visual and auditory detection and discrimination tasks and the tactile detection task. We fitted a linear function for the tactile discrimination task because it showed better fitting results compared with the sigmoid function. We analyzed data for which the determination coefficient R2 was above .25. We adopted this criterion because our participants were naive to psychophysical experiments and the tasks were difficult for some of them. Data not meeting this criterion were excluded from the later analyses (we used the same number of the data for the sensory indices because our regression analyses set these sensory indices as explanatory variables). We estimated the 50% point of stimuli detection as the detection threshold and the 75% point of responses as the discrimination threshold. We also estimated the slopes and intercepts of psychometric functions in order to check whether or not response biases were involved in our results (Morgan et al., 2012).
We confirmed that the correlations among the threshold, slope, or intercept values were not significant with a corrected alpha level (p = .003, the alpha .05 was divided by 15 correlation analyses) except correlation between auditory detection threshold and tactile detection threshold (ρ = .42, p = .002; Supplemental Tables 1, 3, and 4). We also confirmed that one of the correlations among the AQ subscale scores was significant with corrected alpha level (p = .005, the alpha .05 was divided by 10 correlation analyses; Supplemental Table 2). Taking these correlations into consideration, we performed multiple regression analyses (step-down method) by assigning all estimated threshold, slope, and intercept values as explanatory variables and the total AQ score or each AQ subscale score as a target variable. Because the same threshold values were used as the explanatory variables in six multiple regression analyses, we used a corrected alpha level (p = .008 (.05/6)) for the determination of statistical significance for each multiple regression equation. The AQ subscale scores were not normally distributed (Ws < .95, ps < .03), although the total AQ score was normally distributed (W = .98, p = .65). Thresholds also were not normally distributed (Ws < .93, ps < .05) except the auditory discrimination (W = .98, p = .61) and visual discrimination (W = .96, p = .08) tasks. The slopes and intercepts were also not normally distributed (Ws < .93, ps < .005) except the tactile discrimination task (slope, W = .97, p = .19; intercept, W = .98, p = .42). However, we confirmed that the residuals of the multiple regression analyses were normally distributed based on the normalized Q–Q plots. These analyses were performed by JASP (JASP-Team, 2019).
Results
Individuals’ AQ scores ranged from 7 to 34 with a mean of 22.23 (SD = 5.83; Figure 2a). Higher scores indicated more severe autistic symptoms. The means (SD) for the subscales were as follows: social skills, 4.45 (2.66); attention switching, 5.83 (1.63); attention to detail, 4.49 (2.39); communication, 4.51 (1.91); and imagination, 2.94 (1.52).
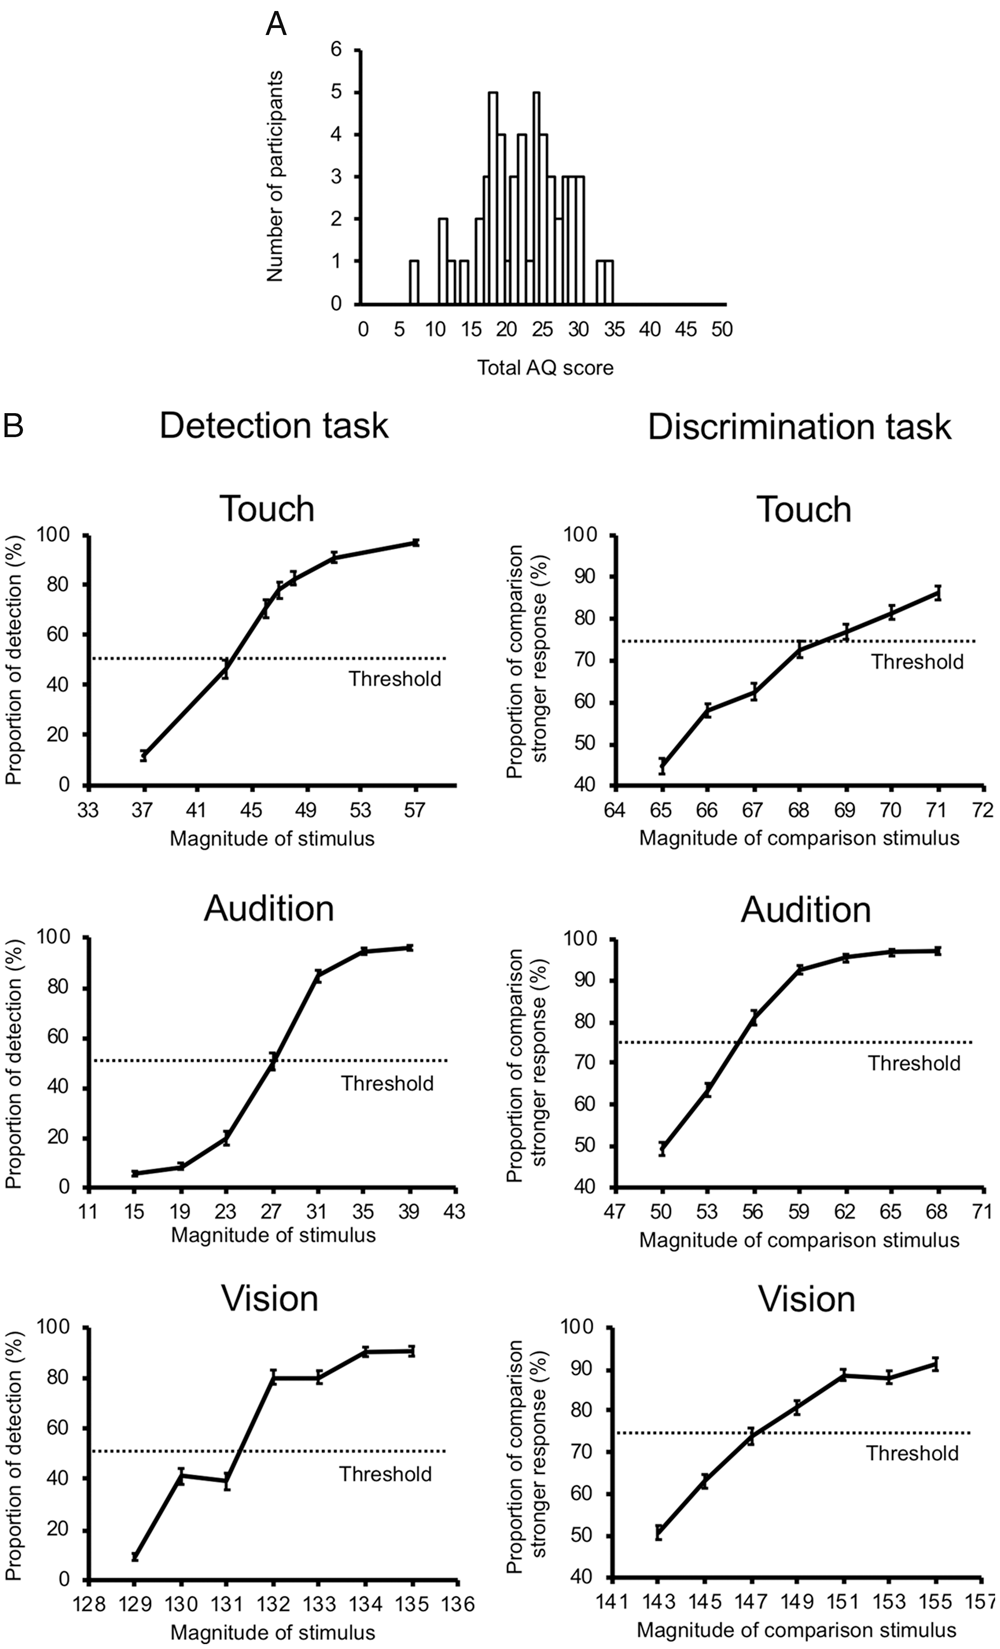
Panel A: Distribution of participants’ total AQ scores. The horizontal axis represents the total AQ scores, which ranged from 0 to 50. The vertical axis represents the number of participants (N = 53). Panel B: Psychometric functions. Each panel shows the mean percentage of participants of responses against stimulus intensity in each task (N = 53). The left panels show the results of the detection task for each sensory modality. The horizontal axis represents the target stimulus intensity, and the vertical axis represents the mean percentage of correct stimulus detections. The right panels show the results of the discrimination task for each sensory modality. The horizontal axis represents the comparison stimulus intensity, and the vertical axis represents the mean percentage of responses on which participants answered that the comparison stimulus was stronger. The error bars represent the standard errors of the mean.
With regard to the estimated detection and discrimination thresholds for each sensory task (Figure 2b), we conducted the multiple regression analyses by assigning all thresholds as the explanatory variables and each AQ score as the target variable at the corrected alpha level (p = .008) for each multiple regression equation. A significant regression equation was observed for the communication score, F(2, 50) = 5.88,
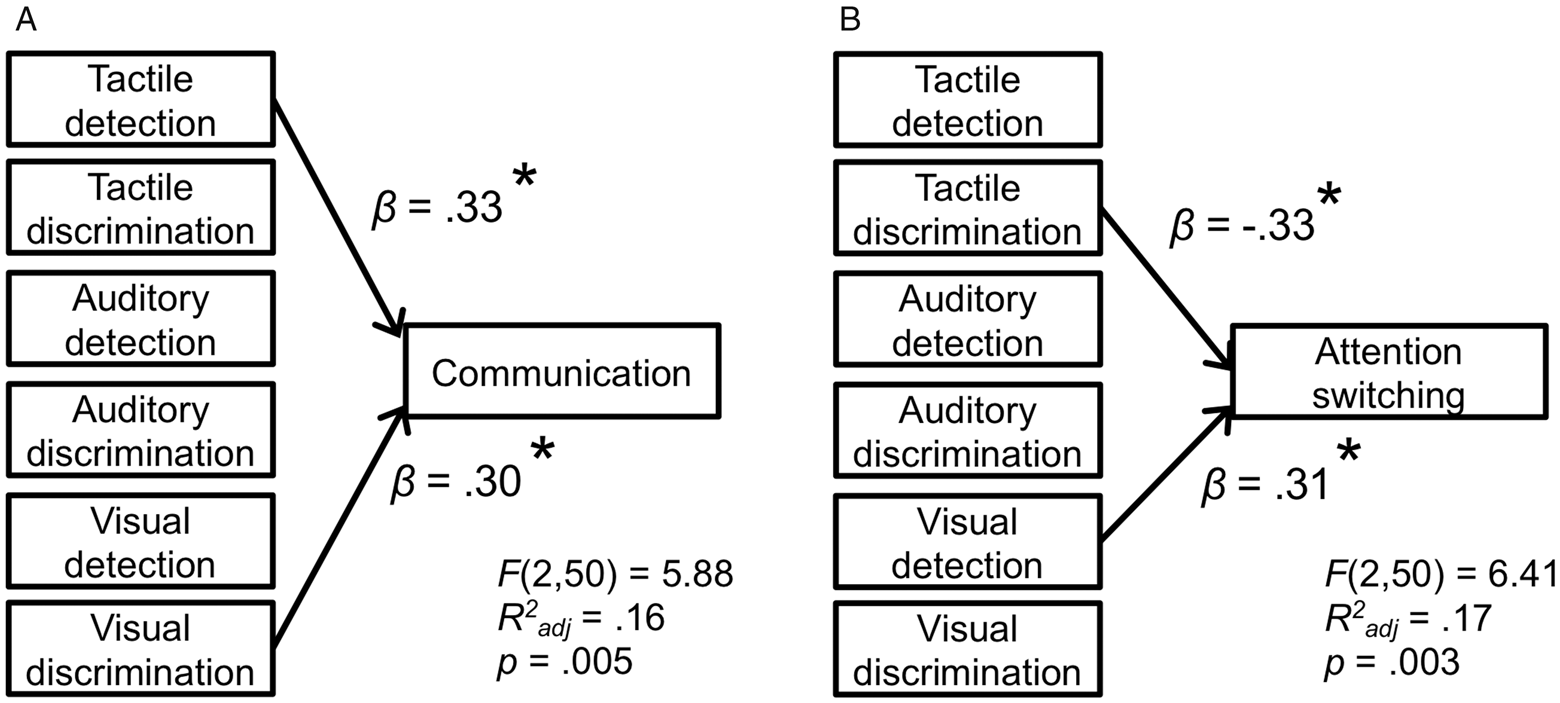
Results of multiple regression analyses. Panel A: Significant relationships between the tactile detection and visual discrimination threshold and the communication score. Panel B: Significant relationships between the tactile discrimination threshold and visual detection threshold and the attention switching score. Asterisks denote statistical significance (p < . 05).
Result of Multiple Regression Analyses for Thresholds, Slopes, and Intercepts.
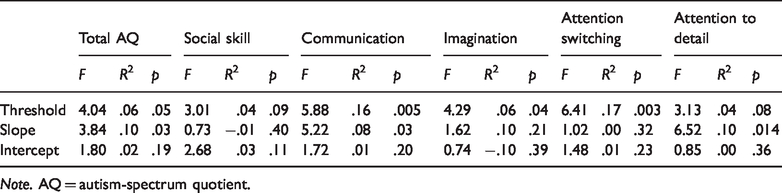
Note. AQ = autism-spectrum quotient.
We also performed multiple regression analyses to investigate relationships between the slopes and intercepts of psychometric functions and each AQ score in order to check whether or not our data could be explained by these indices of response biases (Morgan et al., 2012). We found no significant regression equations for the slopes and intercepts (Table 1).
We further performed Bayesian multiple regression analyses between the AQ total/subscale scores and the threshold/slope/intercept. Consistent with the above-mentioned results, we found that the relationships between the tactile detection and visual discrimination thresholds and the communication score were more likely to occur under the alternative hypothesis than under the null hypothesis (BF10 = 3.40, R2 = .19). Also, the relationships between the tactile discrimination and visual detection thresholds and the attention switching score were more likely to occur under the alternative hypothesis than under the null hypothesis (BF10 = 12.14, R2 = .20). We observed no positive evidence of the alternative hypothesis for the other relationships between the sensory indices and AQ scores (Table 2). For the slopes and intercepts, almost all relationships had no positive evidence for the alternative hypothesis. Some relationships showed positive evidence (BF10 < 3.75), but these were inconsistent with our original interference statistic results (Table 2).
Result of Bayesian Multiple Regression Analyses for Thresholds, Slopes, and Intercepts.

Note. AQ = autism-spectrum quotient; BF = Bayes factor.
Discussion
Our purpose was to explore the relationships between various ASD characteristics and low-level sensory processing. We estimated tactile, visual, and auditory detection and discrimination thresholds with precise psychophysical methods (the method of constant stimuli) as well as ASD traits measured with the AQ in TD people.
We did not observe a significant relationship between the thresholds and the total AQ score. Previous studies have reported that people with ASD show higher (Puts et al., 2014), lower (Blakemore et al., 2006), or intact (Cascio et al., 2008; Güçlü et al., 2007) vibrotactile detection thresholds. Similarly, investigations of visual sensitivity in ASD have also shown lower (Bertone et al., 2005) or intact (Rivest et al., 2013) luminance discrimination thresholds. Researchers have also suggested that individuals with ASD had higher (Kargas et al., 2015) or intact (Jones et al., 2009) sound pressure discrimination thresholds. As mentioned in “Introduction” section, we assume that these discrepancies are caused by differences in ASD traits. In this study, we considered these factors by using a particular population (TD adults) and focusing on the relationships of the AQ scores with low-level sensory performance as measured with a valid psychophysical method. Whereas significant relationships were not observed between the threshold values and AQ total score, we found some unique relationships between sensory thresholds and AQ subscale scores.
Our results showed that the visual discrimination thresholds were positively related to the communication score of the AQ. The communication score is considered to reflect difficulties in verbal communication during conversation (e.g., “Other people frequently tell me that what I have said is impolite, even though I think it is polite”). Our findings thus indicate that individuals less sensitive to differences in the magnitude of visual inputs in luminance domain had higher difficulties in communication. Discriminating between differences in luminance or detecting contrasts in a scene largely contributes to recognizing objects in a scene (Basu, 2002; Marr & Hildreth, 1980). Needless to say, the recognition of visual objects plays an important role in communicating situations in terms of facial recognition (Haxby et al., 2002; Schultz, 2005), and the proper use of visual information is reported to improve communication abilities in people with ASD (Lal & Bali, 2007; Shane, 2006). We could speculate that less sensitivity to differences in luminance or contrast may be one of the contributing factors for difficulties of communication in autistic traits.
We also found positive relationships between the tactile detection threshold and the communication score of the AQ. Tactile information has been reported to contribute to developments of social communication ability (Harlow & Harlow, 1962). Moreover, it has been reported that difficulties in social communication are related to irregularities of tactile sensation in daily life situations (Hilton et al., 2010) and to particular brain activities in response to tactile stimuli (Cascio et al., 2012) for individuals with ASD. In line with these findings, our results show that less sensitivity to detecting the presence of tactile inputs is associated with difficulties of communication in autistic traits.
Our results further showed that the tactile discrimination threshold was negatively related to the attention switching score of the AQ. The attention switching score is considered to reflect a strong persistence toward sameness, which is related to the restricted and repetitive behaviors seen in ASD (e.g., “I prefer to do things the same way over and over again” and “I frequently get so strongly absorbed in one thing that I lose sight of other things”). Our findings therefore may suggest that the individuals more sensitive to differences in vibro-tactile intensities have stronger attentional and behavioral persistency to sameness. Vibro-tactile inputs are one of the fundamental properties for our tactile sensation, and the stimulation around 200 Hz is assumed to specifically contribute to perceiving finer textural information (Lederman & Klatzky, 2009). Intriguingly, individuals with ASD have been reported to show unpleasant feelings to differences in cloth textures (Dunn, 1997; Tomchek & Dunn, 2007). It could also be noted that the greater magnitude of sensory hyperreactivity in daily life, such as an unpleasant feeling for particular cloth, is reported to predict higher repetitive behaviors in ASD (Boyd et al., 2010). Based on these findings, we could assume that high sensitivity in discrimination performance in tactile modality could be related to difficulties in attention switching or a strong persistence toward sameness in autistic traits.
We also found the visual detection threshold was positively related to the attention switching score. The individuals with ASD are reported to have difficulties with regard to awareness of presence of visual information (e.g., they do not notice when people come into the room/they miss street sign), and these behavior are regarded as one of hyporeactivity in daily life (Brown et al., 2001). The magnitude of hyporeactivity in ASD is also related to the frequency of repetitive behaviors including repeated, stereotypic behaviors (Di Renzo et al., 2017). Based on these findings, we could assume that the individuals with high difficulties in attention switching or strong persistence of attention tend to have low sensitivity for the existence of visual inputs.
One might assume that response or decisional bias was involved in the current findings specifically for our detection tasks because these did not include catch trials. If our results for the thresholds were based on response biases instead of sensory processes, the relationships between the slopes and intercepts of psychometric function and the AQ scores could also be found (Morgan et al., 2012). However, we found no significant relationships for these indices of response biases. We could also note that our results for the thresholds showed some unique relationships among each task and modality. If our participants adopted a specific response or decisional strategy across tasks, the observed relationships could be very similar among the sensory modalities. Thus, we may assume that the current findings could not be simply explained by response biases.
We should note that there was no relationship between the thresholds and social skill, imagination, and attention to detail subscale scores. Studies have consistently reported that different sensory processes have unique relationships to particular AQ subscale scores. For example, audiovisual temporal binding performances are reported to be related with social skill, communication, imagination, and attention switching (Donohue et al., 2012). Also, the perceptual performances for an audiovisual illusion (double flash illusion) have a unique relationship to social skill and communication (Yaguchi & Hidaka, 2018). Audiovisual associative learning performances are reported to be related with attention to detail (Hidaka & Yaguchi, 2018; Stevenson et al., 2017). Thus, it is likely that various unique relationships can exist among different sensory processing and AQ subscale scores. This study suggests that there are some unique relationships between detection and discrimination sensitivities for visual and tactile modalities and particular AQ subscale scores.
We should note that auditory detection and discrimination thresholds were not related to any AQ score. While this study measured sensitivity to the presence of or differences in sound pressure, it is the pitch of sound that is considered to be important for the comprehension of verbal stimuli. For example, vocal frequency is reported to play a key role in expressing emotions (Shigeno, 2004). Individuals with ASD show unusual prosody (Hubbard & Trauner, 2007; McCann & Peppé, 2003), and this is suggested to be a critical feature of communication difficulties (Baltaxe & Simmons, 1985). Whereas we used sound pressure as the stimuli attribute comparable to those used in the visual and tactile domain, future studies should manipulate pitch in sounds to investigate the relationship between auditory processing and ASD traits related to communication skills. The effects of individual characteristics other than ASD traits may also be considered. Kargas et al. (2015) reported that people with ASD showing more restricted and repetitive behaviors or interests showed lower discrimination thresholds for sound pressure. However, they argued that there exist some confounding effects other than ASD traits that affected their findings. They noted that some participants with ASD showed exceptionally higher threshold values and that participants’ IQ scores were negatively correlated with their discrimination performances. This study measured the variability of ASD traits as an individuals’ characteristic. However, the effects of individual differences in variables such as IQ should be considered in future research. Moreover, several recent studies pointed out that the components of AQ subscales are variable among different samples (Hoekstra et al., 2008; Lau et al., 2013; Lundqvist & Lindner, 2017; Stewart & Austin, 2009). Further studies should also investigate the relationship between ASD characteristics and the unimodal sensory sensitivity, including investigations of the components of AQ with a larger sample size.
Recent studies focus on the altered function of gamma-aminobutyric acid (GABA) neurons in ASD (e.g., Braat & Kooy, 2015). GABA works as an inhibitory neurotransmitter in the adult brain, and reduced concentration of GABA or density of GABAergic receptors has been observed in the broad area of the brain with ASD, suggesting an imbalance between excitation and inhibition balance in neural circuits (Cellot & Cherubini, 2014). It has been reported that lower GABA concentration was observed for children with ASD compared with TD, and lower tactile detection threshold was observed for lower GABA concentration of the individuals with ASD (Puts et al., 2017). ASD adults with low GABA concentration were reported to have moderate sensitivity for various sensory stimuli in daily life (Sapey-Triomphe et al., 2019). These findings indicate that individuals with ASD have low GABA level and this induces irregularities in sensory processing. This study found some relationships between AQ subscales and sensory processing and neurobiological background of these relationships might be related to GABAergic mechanisms.
In this study, we investigated the relationships between low-level perceptual performances and various ASD traits among individuals without an ASD diagnosis based on the AQ questionnaire. It has been reported that AQ score was higher for individuals with ASD than TD people (Baron-Cohen et al., 2001; Woodbury-Smith et al., 2005), but AQ score is reported not to predict the diagnosis of ASD (Ashwood et al., 2016; Bishop & Seltzer, 2012). Other studies showed that the high AQ score was associated with severe concurrent symptoms of the ASD (e.g., atypical sensory experience and state of anxiety) in both participants with ASD and those without ASD (Horder et al., 2014). Studies with TD individuals also reported that high AQ subscale scores are related to altered sensory characteristics which are typically observed in individuals with ASD (Donohue et al., 2012; Yaguchi & Hidaka, 2018). Therefore, we could consider that the measurement of AQ score and the investigations of the relationships between AQ score and sensory performances can contribute to further understanding of sensory irregularities specific to ASD. We observed relationships between tactile/visual perceptual thresholds and the ASD traits of communication and attention switching. Although we focused on ASD traits in TD adults, the current findings increase our understanding of the unique characteristics of sensory processing related to specific ASD traits. Our current study unfortunately needed to exclude some data and adopt relatively low criterion of fitting due to the difficulty of the tasks even for TD participants. With solving these issues, future studies could contribute to further understanding of sensory characteristics related to ASD. Moreover, sensory processing is reported to be malleable with training or treatment, and researchers have proposed that sensory training or treatment can improve daily living difficulties in people with ASD (Cascio et al., 2016; Wallace & Stevenson, 2014). Consideration of the effects of individual variability in ASD subtraits could provide a further understanding of unique aspects of sensory processing in individuals with ASD and possible training or treatment.
Supplemental Material
PEC907827 Supplemental Material - Supplemental material for Unique Relationships Between Autistic Traits and Visual, Auditory, and Tactile Sensory Thresholds in Typically Developing Adults
Supplemental material, PEC907827 Supplemental Material for Unique Relationships Between Autistic Traits and Visual, Auditory, and Tactile Sensory Thresholds in Typically Developing Adults by Ayako Yaguchi and Souta Hidaka in Perception
Footnotes
Declaration of Conflicting Interests
The author(s) declared no potential conflicts of interest with respect to the research, authorship, and/or publication of this article.
Funding
The author(s) disclosed receipt of the following financial support for the research, authorship, and/or publication of this article: This research was supported by a Grant-in-Aid for Challenging Exploratory Research from the Japan Society for the Promotion of Science (No. 15K12615) and a Grant-in-Aid for Scientific Research (C) (No. 17K00214) from the Japan Society for the Promotion of Science.

Supplemental Material
Supplemental material for this article is available online.
References
Supplementary Material
Please find the following supplemental material available below.
For Open Access articles published under a Creative Commons License, all supplemental material carries the same license as the article it is associated with.
For non-Open Access articles published, all supplemental material carries a non-exclusive license, and permission requests for re-use of supplemental material or any part of supplemental material shall be sent directly to the copyright owner as specified in the copyright notice associated with the article.
