
Abstract
Does the brightness of an approaching vehicle affect a pedestrian’s crossing decision? Thirty participants indicated their street-crossing intentions when facing approaching light or dark vehicles. The experiment was conducted in a real daylight environment and, additionally, in a corresponding virtual one. A real road with actual cars provides high face validity, while a virtual environment ensures the scenario’s precise reproducibility and repeatability for each participant. In both settings, participants judged dark vehicles to be a more imminent threat—either closer or moving faster—when compared with light ones. Secondary results showed that participants accepted a significantly shorter time-to-contact when crossing the street in the virtual setting than on the real road.
Keywords
Motivation
Autonomous vehicles—or more specifically, the software piloting them—rely on real-time data provided by the vehicle’s sensors and also on sophisticated algorithms that process respective sensory input. The algorithms are also supposed to predict the behavior of human traffic participants who interact with the vehicle. A more comprehensive understanding of human behavior in traffic and related decision-making processes may lead to better performance of the predictive algorithms, ultimately increasing the safety of the vehicle occupants and other road users. Such algorithms require an understanding of pedestrians’ road-crossing behavior.
Numerous factors have been identified that affect pedestrians’ perception and judgment of approaching vehicles, including individual variability, compositional parameters, and environmental aspects (see a review by Feldstein, 2019). Such factors should be considered when designing the software piloting autonomous vehicles, or even earlier when designing road-crossing studies for the collection of pedestrian behavior data. In the course of the preparation of a road-crossing experiment, a pilot study resorted, for organizational reasons, to two different experimental vehicles, one light and one dark. The pilot-study results suggested that the road-crossing behavior varied with the vehicle, which motivated us to investigate if the brightness was the cause. A recent study by Díaz-Román et al. (2015), who used a computer simulator, further supported the same hypothesis. They reported that participants reacted significantly earlier to black than to white vehicles in various hazardous vehicle–vehicle encounters. Interestingly, that difference in response time went unnoticed by the participants, who judged all encounters of different vehicle brightnesses to be equally risky. Here, we set up to test that effect in virtual and in real-world environments.
Related Work
Little is known about the impact of the vehicle’s brightness on the pedestrian’s judgment of the vehicle’s approach. Some relevant factors and parameters that should be considered when setting up a road-crossing experiment that allows for the investigation of our brightness-related hypothesis are summarized in this section. See a detailed literature review of factors and parameters that affect road-crossing decisions in Feldstein (2019).
The literature referring to the remaining time between an observer and an approaching object uses time-to-contact, time-to-collision, or time-to-arrival interchangeably. In the study presented here, we resort to the term time-to-contact, abbreviated with TTC. Studies that investigated pedestrians’ ability to judge an approaching vehicle’s TTC found TTCs to be consistently underestimated. Pedestrians have a sensible tendency to err in the direction of safety. An analysis across numerous studies suggests the estimated TTC to be, on average, at about 75% of the actual TTC (Feldstein, 2019).
When comparing results across studies, investigators need to be aware that age (Andersen & Enriquez, 2006; Dommes & Cavallo, 2011; Dommes et al., 2013; Hancock & Manser, 1997; Schiff et al., 1992) and sex (Caird & Hancock, 1994; Manser & Hancock, 1996; McLeod & Ross, 1983; Schiff & Oldak, 1990) have been shown to affect TTC judgments. The vehicle’s approaching parameters may also influence pedestrians’ perception, with the approaching velocity (Kappé & Korteling, 1995; Petzoldt, 2014) and observation distance (Caird & Hancock, 1994) having been shown to affect TTC judgments disproportionally. In addition, the retinal eccentricity may be relevant (Manser & Hancock, 1996; Regan & Vincent, 1995).
The presence of pictorial distance cues in the experimental environment, such as occlusion, relative size, relative density, and height in visual field, will support pedestrians’ TTC judgments (DeLucia, 2004; DeLucia et al., 2003; Vincent & Regan, 1997). The vehicle size may affect pedestrians’ crossing choices: Larger vehicles, such as vans, have been shown to lead to relatively lower TTC estimations when compared with smaller vehicles, such as compact cars (Caird & Hancock, 1994; DeLucia et al., 2003; Horswill et al., 2005; Mathieu et al., 2017; Petzoldt et al., 2017). A within-subject design and the use of similar-size vehicles substantially reduce the impact of any of these confounding factors on the question investigated in our experiment.
Method
The impact of the brightness of approaching vehicles on pedestrians’ street-crossing decisions was investigated in two environments: a real street with actual cars and a virtual environment, displaying a replication of the real-street setting. While the realism of the scenario on the real street ensured high ecological validity, the scenario’s reproducibility in the real environment was hard to maintain (e.g., due to changing light and weather conditions). The investigation in the virtual environment used an immersive virtual-reality (VR) system, involving full-body motion capture and a stereoscopic head-mounted display; for technical details regarding the setup, see Feldstein et al. (2016, 2018) and Lehsing and Feldstein (2018).
Thirty participants (19 male), average age 21.1 years old (SD = 2.1 [17–27 years old]), took part in the study, all completing the experiment in both environments. Participants were recruited at the university, resulting in a relatively homogenous group. Participants were not compensated for their participation.
The participants were standing on the edge of a single-lane, one-way street—ready to cross—while a vehicle approached from the right. The participants signaled the instant in which they felt the approaching vehicle was too close to permit safely crossing the road. They indicated their judgment through the step-back method (i.e., by stepping backward off the street onto the sidewalk). In the real environment, participants crossed a photoelectric sensor line when stepping back, triggering a calibrated lidar speed-detection device, a Riegl FG21-P (Riegl Laser Measurement Systems GmbH, Horn, Austria). The device, which is capable of measuring the precise velocity and distance of an approaching vehicle, was borrowed from the local police and also used to calibrate the adaptive cruise controls of the experimental vehicles. This ensured the vehicles’ accurate speed for any experimental trial. The virtual environment used a programmed invisible virtual plane behind the participant that recorded the vehicle’s virtual position and speed when the participant crossed the plane. The distance and speed recorded were used to calculate the TTC, which is the ratio of distance to speed.
The experimental vehicles included one dark and one light passenger car of comparable body types and dimensions. A black BMW 3 Series (BMW AG, Munich, Germany) and a gray Mercedes-Benz E-Class (Daimler AG, Stuttgart, Germany) were used in the real environment. In the virtual environment, the vehicles were black and white, both being the same BMW 3 Series model.
The vehicle approached the participant at velocities of 30 km/h, 35 km/h, or 40 km/h, which are typical urban velocities. The participants confronted each velocity five times in pseudorandomized order, resulting in a total of 15 crossing decisions per participant in each environment. The dark and the light vehicle appeared in alternating order. The variation of the vehicle speed was designed to avoid potential bias of the participants: If the same speed was maintained for all encounters, participants might tend to make their crossing decisions based on a specific spatial distance of the vehicle during its approach. By varying the vehicle speed, participants are obliged to incorporate the perceived speed in their decisions and vary the chosen spatial distance for their TTC choices (see Feldstein & Dyszak, 2020).
The experimental design in the virtual environment resembled the one in the real environment, displaying a virtual replica of the real street and using vehicles of similar characteristics and identical approaching parameters (see Figure 1). All participants completed the experiment in both environments in a counterbalanced order, with half of the participants starting in the real environment, while the other half began in the virtual environment.
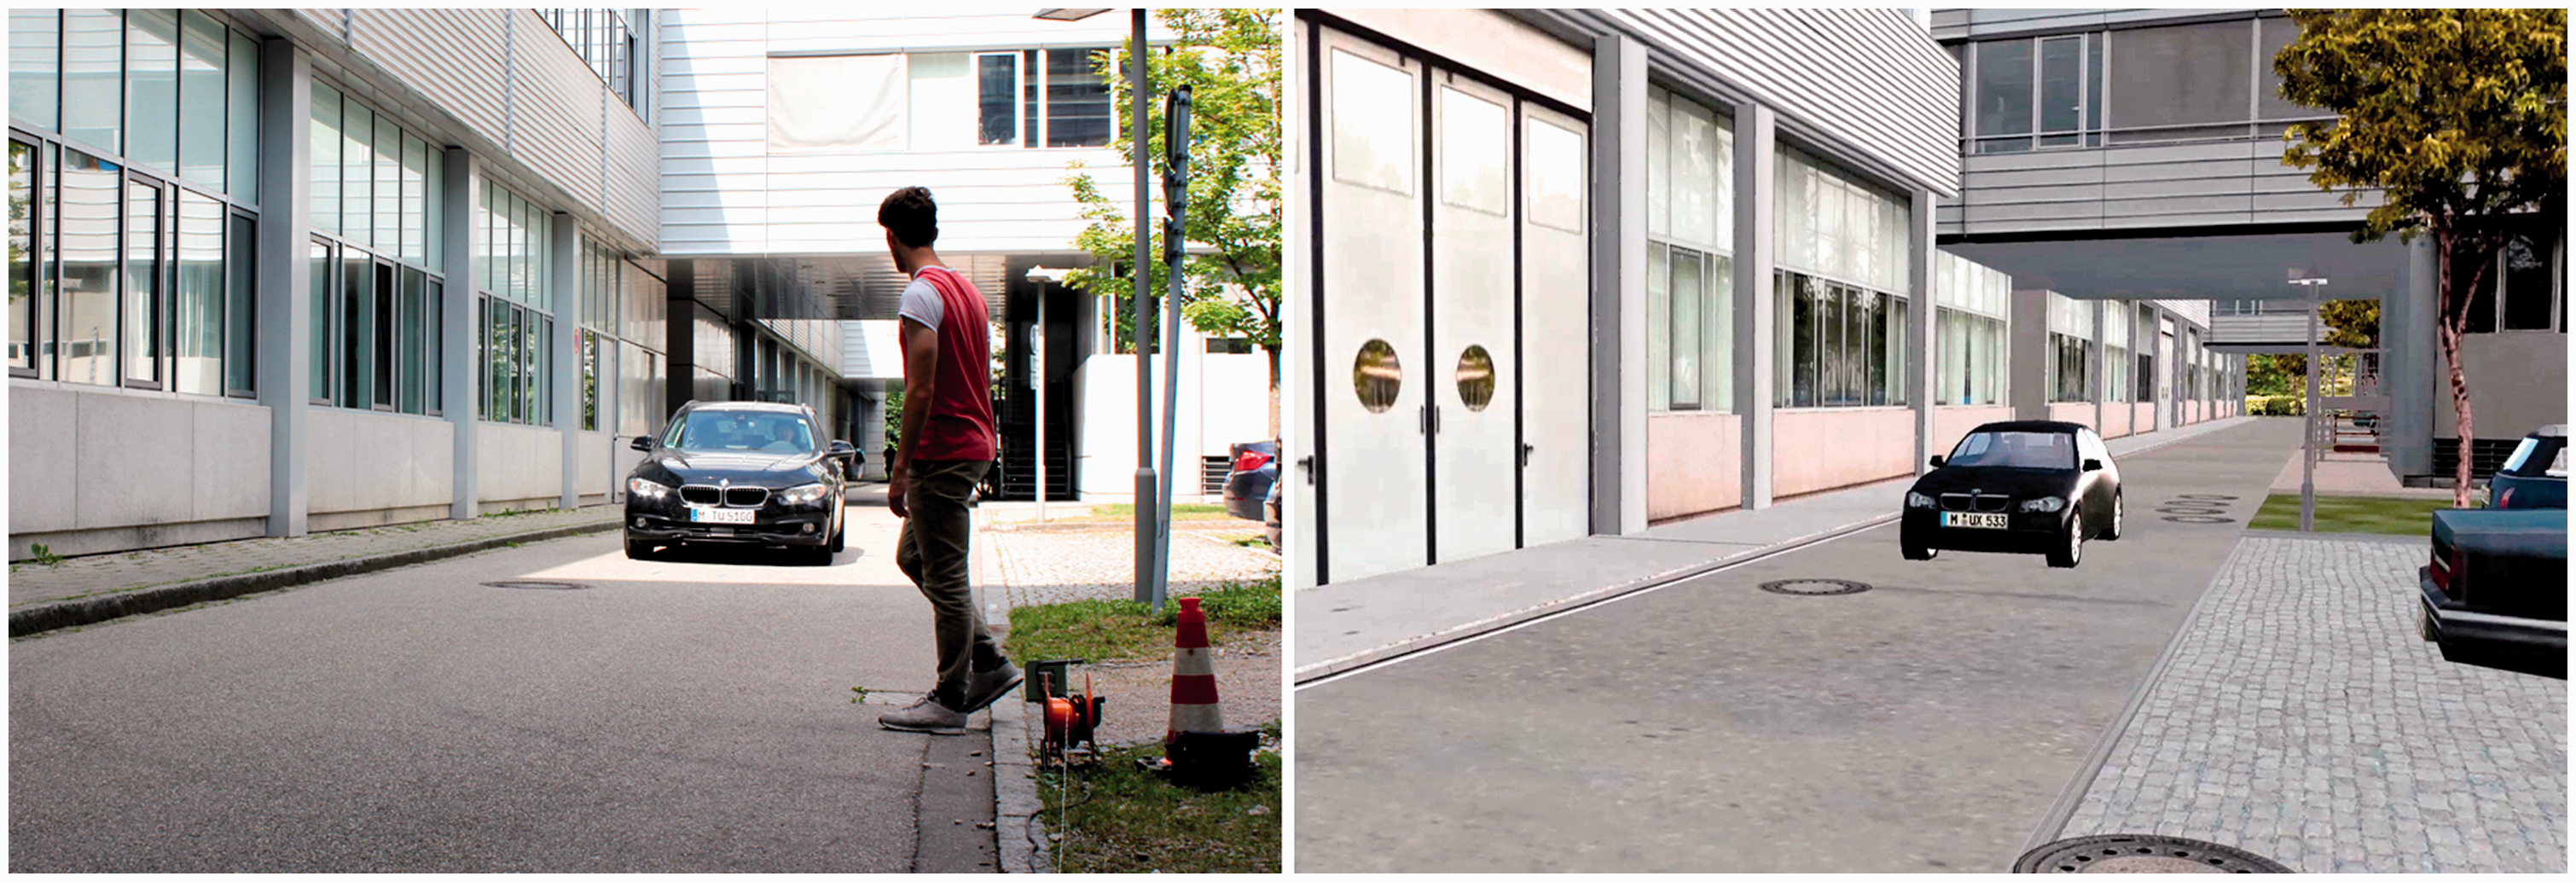
Experimental Environments.
In both environments, the TTC between the approaching vehicle and the pedestrian (i.e., the ratio of the measured spatial distance to approaching speed) was calculated at the moment the participant stepped back. The TTC may be considered as the decisive parameter on which pedestrians base their decision whether to cross the street or not, reflecting the answer to the question “Do I have enough time?”
Results
Prior to statistical analyses, the collected TTC values were found to be normally distributed, and no outliers were found (Field, 2013). Associated effect sizes were reported through Pearson’s correlation coefficient r. Note that in the presented analyses, Pearson’s r equals the square root of the η2 size-effect measure (Field, 2013).
A 2 × 2 (vehicle brightness × environment) repeated-measures analysis of variance revealed a small but significant main effect of vehicle brightness: F(1, 29) = 13.51, p = .001, r = .564. The marginal mean TTC was 2.3 s (SD = 1.0) for the light vehicle and 2.5 s (SD = 1.1) for the dark one. The pairwise within-subject comparison showed the difference in TTC choice between the two vehicles to be significant in both the real (p = .003, r = .063) and the virtual environment (p = .020, r = .065). The interaction effect between environment and vehicle brightness was not significant: F(1, 29) = 0.02, p = .882.
Figure 2 compares the average TTC value for the light vehicle to the average TTC value for the dark vehicle for each of the 30 participants, for the real and the virtual environment. The graph shows a slight difference in the TTC values that pedestrians accepted for the light vehicle when compared with their choices for the dark one. A linear regression (R2 = .95) suggests the light vehicle’s TTC to be at approximately 91% of the dark vehicle’s TTC, with the regression’s slope having a standard error of 0.028.
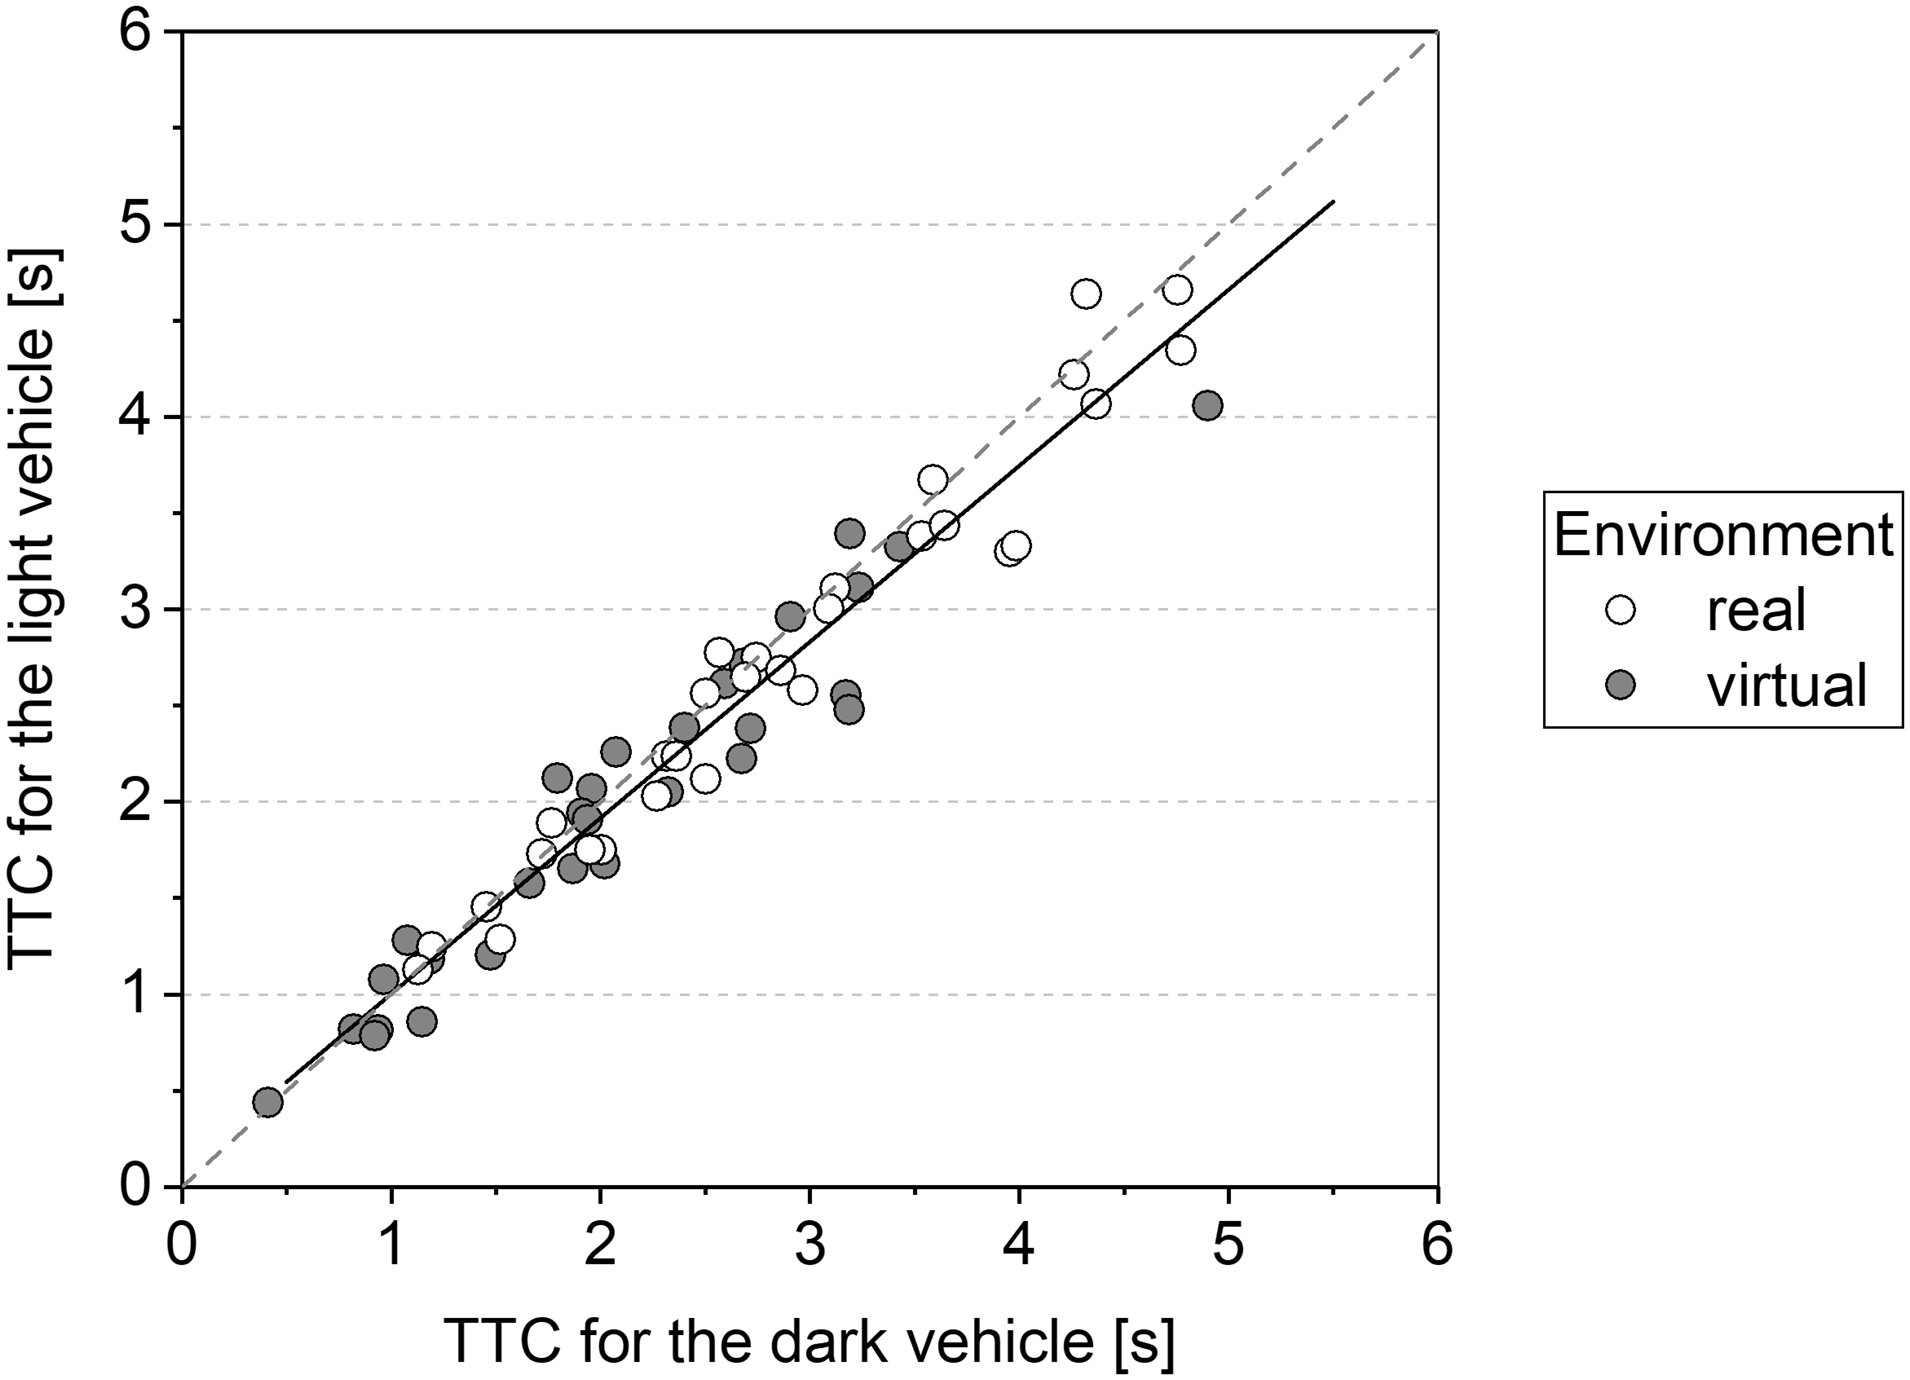
Average TTC Values When Facing the Dark Vehicle Compared With the Light One.
The significant main effect of environment—comparing the decisions made in the real environment to those in the virtual one—is also noteworthy: F(1, 29) = 63.23, p < .001, r = .828. The average TTC values in the real environment were 2.7 s (SD = 1.0) for the light vehicle and 2.9 s (SD = 1.0) for the dark one, while accepted TTC values in the virtual environment were on average 2.0 s (SD = 0.9) for the light vehicle and 2.1 s (SD = 1.0) for the dark one. Pairwise within-subjects comparisons between the two environments confirm significant differences for the light vehicle (p < .001, r = .359) as well as the dark one (p < .001, r = .341).
Figure 3 shows that accepted TTC values were consistently smaller in the virtual environment when compared with the real environment. A linear regression (R2 = .74) suggests the TTC values in the virtual environment to be at approximately 78% of the TTC values in the real environment, with the regression’s slope having a standard error of 0.061.
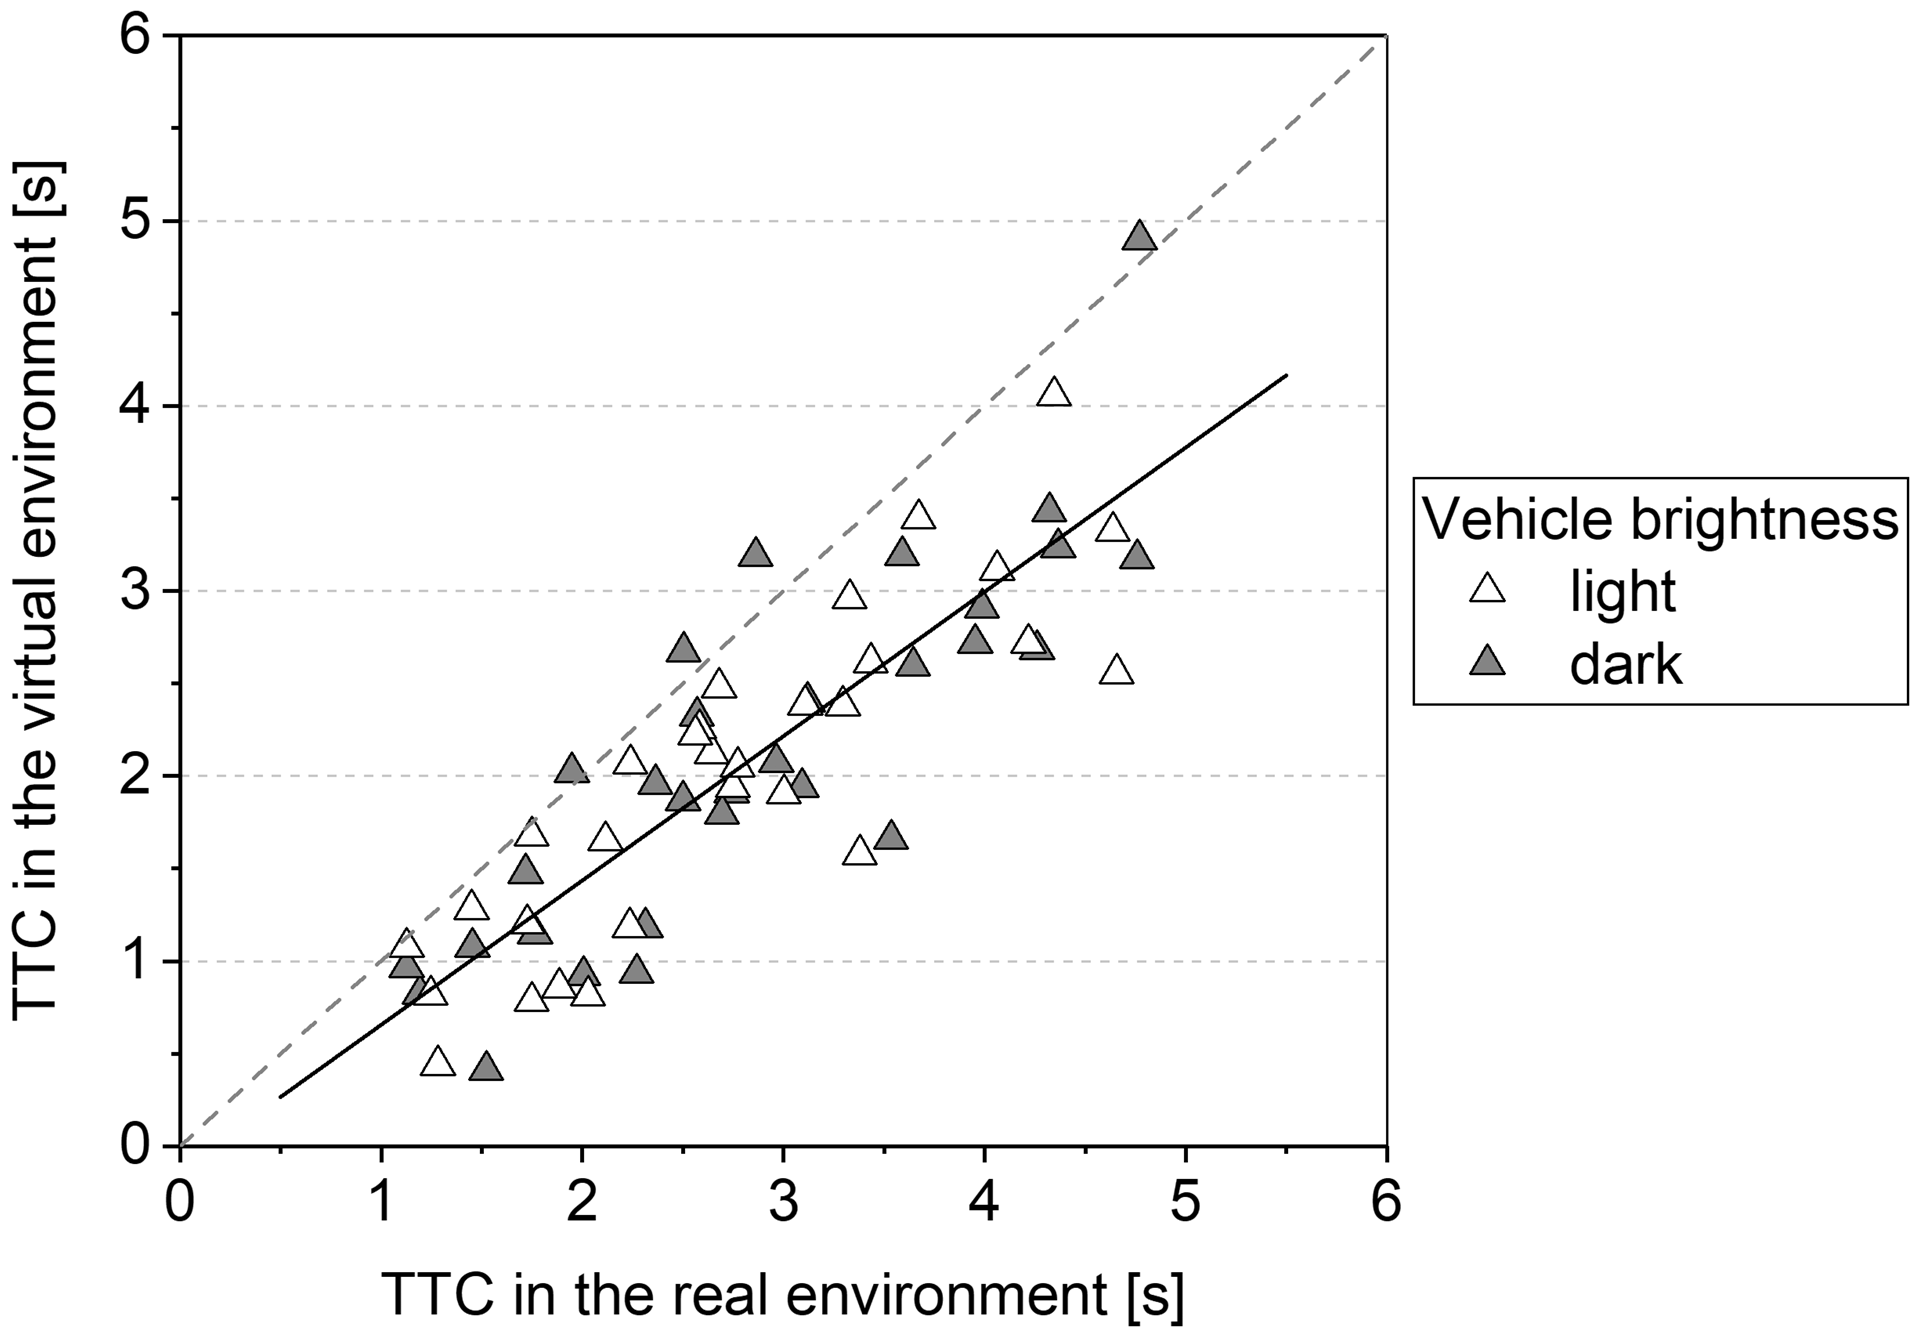
Average TTC Values in the Real Environment Compared With the Virtual One.
Discussion
The results demonstrate that pedestrians’ crossing decisions depend at least to some extent on the approaching vehicle’s brightness, though the effect is modest. The vehicle’s contrast against the background can play an essential role because dark vehicles, when compared with light ones, have a higher contrast against a typically bright background in urban environments in daylight. Therefore, it can be postulated that the vehicle’s contrast against the background might have been the decisive factor and not the brightness of the vehicle itself. Parallels can be drawn to studies that investigated the effect of visual contrast on depth and speed perception, with both parameters being directly related to the judgment of an approaching object’s TTC: Objects with a lower contrast against the background appear to be farther than those with a higher contrast (Ashley, 1898; Coules, 1955; Egusa, 1983; Farnè, 1977; Fry et al., 1949; Ichihara et al., 2007; Mount et al., 1956; O’Shea et al., 1994), while relative velocities are estimated to be slower when the visual contrast is reduced, be it the subjects’ own speed or that of an approaching object (Anstis, 2003; Blakemore & Snowden, 1999; Snowden et al., 1998; Stone & Thompson, 1992; Thompson, 1982). Both phenomena are consistent with our findings, assuming the background to be relatively bright (which is the case in our experiment, as seen in Figure 1). Thus, it might be assumed that the lower contrast between the light vehicle and the environment may have led to the approaching vehicle being perceived to move relatively slower and its distance being judged to be relatively farther. That in turn led to an acceptance of lower TTC values when crossing the street in front of the light car. In view of this discussion, autonomous vehicles may need to incorporate their own contrast relative to the instantaneous environment when predicting pedestrian behavior.
People associate the color black with threat (Adams & Osgood, 1973; Elliot & Maier, 2014; Frank & Gilovich, 1988; Williams et al., 1970). For example, it has been shown that opponents in sports were subconsciously perceived as more aggressive when being dressed in black than in white (Frank & Gilovich, 1988; Webster et al., 2012). Past studies demonstrated that traffic participants chose larger gaps when the approaching vehicle appeared to be more threatening, although these studies investigated the effect of car size, not brightness (Horswill et al., 2005; Mathieu et al., 2017; Petzoldt et al., 2017).
In our experiment, the vehicle’s brightness was not precisely specified but merely categorized into light and dark. Future investigations may consider determining a dose-dependent effect for the brightness values and also varying contrast against the background in a controlled manner to be able to distinguish whether brightness or contrast is the critical variable. The numerical specification of the brightness and contrast, as well as the brightness variation of the experimental vehicle, may be easily achieved in digital virtual environments. Future research investigating the impact of vehicle brightness may be predominantly conducted in VR settings: Our study suggests this phenomenon is observable equally in real and virtual environments, although absolute TTC values differed between the two environments.
The same participants experienced both environments (in counterbalanced order) that contained similar pictorial depth cues and used similar vehicle types and approaching parameters. Despite these efforts to avoid factors that have been shown in the past to affect TTC judgments (see the Related Work section), the results of our experiment showed that participants accepted substantially lower TTC values in the virtual environment. The observed riskier behavior when being exposed to virtual vehicles when compared with real ones may have various reasons. Recarte et al. (2005) also reported differences in human judgments of videotaped vehicles that were displayed on a screen when compared with identical encounters in real environments. A discussion on perceptual differences between real and virtual vehicles may be found in Feldstein (2019) and Feldstein and Dyszak (2020). The observed differences between behaviors in real and virtual environments emphasize once more that although VR systems present a very effective solution for conducting many experimental investigations, researchers must be cautious when interpreting data collected from virtual environments. For example, the vehicle’s brightness has a very similar effect on the crossing decision in both environments, and therefore, both environments are suitable for answering the original research question. However, the virtual environment would not have been suitable for addressing the question of what TTC participants are willing to accept when crossing the street.
The step-back method was considered to be a safe alternative to actual road crossings that would have put participants at risk in the real-world scenario. Other signaling methods such as the shout task where participants communicate a crossing intention verbally (e.g., Demetre et al., 1992, 1993) were rejected in favor of the action-based step-back method: Vision and attention that require actions, such as crossing the street or stepping back off the street, may be dissociated from vision and attention for perceptual purposes (see Goodale & Milner, 1992). The importance of action-based assessments for this kind of experiment is supported by the study of te Velde et al. (2005), who compared verbally expressed crossing intentions with actual road crossings and identified significant differences in the crossing behavior between these two modalities.
Footnotes
Acknowledgements
The authors thank Georg N. Dyszak and Felix M. Kölsch, who assisted in the experiment and participated in discussions. Thanks also go to Cécile Boudot and Viola Cavallo, who provided valuable input on the article. The authors also thank the Technical University of Munich, which provided the necessary equipment.
Declaration of Conflicting Interests
The author(s) declared no potential conflicts of interest with respect to the research, authorship, and/or publication of this article.
Funding
The author(s) disclosed receipt of the following financial support for the research, authorship, and/or publication of this article: I.T.F was supported in part by the Fulbright Program and the Studienstiftung des Deutschen Volkes. E.P. was supported in part by NIH Grant #R01EY024075.