
Abstract
With the continued growth of digital device use, a greater portion of the visual world experienced daily by many people has shifted towards digital environments. The “oblique effect” denotes a bias for horizontal and vertical (canonical) contours over oblique contours, which is derived from a disproportionate exposure to canonical content. Carpentered environments have been shown to possess proportionally more canonical than oblique contours, leading to perceptual bias in those who live in “built” environments. Likewise, there is potential for orientation sensitivity to be shaped by frequent exposure to digital content. The potential influence of digital content on the oblique effect was investigated by measuring the degree of orientation anisotropy from a range of digital scenes using Fourier analysis. Content from popular cartoons, video games, and social communication websites was compared to real-life nature, suburban, and urban scenes. Findings suggest that digital content varies widely in orientation anisotropy, but pixelated video games and social communication websites were found to exhibit a degree of orientation anisotropy substantially exceeding that observed in all measured categories of real-world environments. Therefore, the potential may exist for digital content to induce an even greater shift in orientation bias than has been observed in previous research. This potential, and implications of such a shift, is discussed.
Detection of oriented line segments has long been understood to be an important factor in supplying basic feature information to contour detection and integration processes that construct a representation of the visual world (Baker et al., 2005; Field et al., 1993; Gerhardstein et al., 2012; Gilbert, 1996; Kovacs & Julesz, 1993; Yacoub et al., 2008). The human visual system is known to be differentially sensitive to orientation, a finding called the oblique effect (Appelle, 1972). This term denotes the fact that adults are highly sensitive to horizontal lines, somewhat less so to vertical, and substantially less still to obliquely oriented lines or contours. This effect has been noted to differ across populations such that a smaller effect is seen in those living in naturalistic environments as compared to a proportionally larger difference in people from “carpentered” areas (Segall et al., 1966) and has been argued to correlate with known anisotropic distribution differences in contours in these various environments (Coppola et al., 1998). Artist's renderings appear to reflect this differential distribution (Schweinhart et al., 2011) and to some extent exacerbate the naturally occurring anisotropy (Schweinhart & Essock, 2013). The oblique effect has been found across multiple tests (Heeley & Timney, 1988; McMahon & MacLeod, 2003; Mikellidou et al., 2015; Westheimer, 2003) and appears to reflect the experience of the visual system with the external visual environment (Girshick et al., 2011; Taylor & Bays, 2018). Cross-cultural differences in the oblique effect have also been established, pointing to experience, possibly across development, as a meaningful factor in the instantiation of the effect (Annis & Frost, 1973; Fang et al., 1997).
The set of regularities in images represented by the oblique effect is reflected in the distribution of orientation-sensitive cells in the cortex, with more allocation to horizontal and vertical than to oblique orientations (Furmanski & Engel, 2000; Haynes & Rees, 2005; Himmelberg et al., 2020, 2022; Roth et al., 2018; Taylor & Bays, 2018; Yacoub et al., 2008). The mapping between the external world and the perceived image that the visual system constructs is clearly, in part, a product of this distribution. Multiple researchers (Baddeley & Hancock, 1991; Essock et al., 2009; Hansen & Essock, 2005) have noted a relationship between the orientation statistics of images and the behavioral sensitivity of the system in terms of orientation tuning curves. Indeed, the development of the visual system may itself be influenced by the statistics of the environment (Field, 1987; Geisler et al., 2001; Geisler & Perry, 2009; Hess et al., 2003; Tversky et al., 2004; see also Wei & Stocker, 2015) which are ubiquitously present and thus likely to influence the system during important developmental periods. Multiple studies have demonstrated the plasticity and sensitivity of the system to alterations of orientation-based information early in development (Braddick & Atkinson, 2011; Daw & Wyatt, 1976; Frégnac & Imbert, 1978; Kiorpes, 2016; Leventhal & Hirsch, 1977; Mitchell et al., 1973).
Extensive research has shown the potential for long-term cognitive changes to arise from sustained digital content consumption (Basak et al., 2008; Cardoso-Leite et al., 2015; Spence & Feng, 2010; Swing et al., 2010). Action video games in particular have been shown to improve subjects’ performance in visual attention tasks (Castel et al., 2005; Feng et al., 2007; Green & Bavelier, 2003). Correlational studies and video game training tasks have provided insight into the systems that modulate our attentive processes (Bediou et al., 2018). Accounts of the mechanism underlying these changes suggest that this phenomenon is caused by modifications in top-down processing (Föcker et al., 2019; Green & Bavelier, 2006), yet it cannot be ruled out that some effect of lower-level perceptual learning (particularly in the realm of attention) is derived from repeated stimulation of orientation or configuration-sensitive (contour detection) cells or systems in the visual cortex. These studies are limited in scope, however, and control specifically for the content of digital games rather than the contour distribution of their environments.
The onset of an immersive digital culture has substantial implications for the types of images that many members of W.E.I.R.D cultures (Henrich et al., 2010), both adults and children, are exposed to for elongated time periods as part of multiple activities (office work, social media use, digital gaming, and others). Vizcaino et al. (2019) report that the average adult spends the majority of their waking day interacting with a digital device. As a result, the nature of images that saturate our environment on a regular basis has changed substantially from previous generations (Common Sense Media & Rideout, 2011; Perrin & Anderson, 2019) without a clear understanding of the basic contour differences between these digital environments and nature-based or cityscape visual environments. Likewise, there is little discussion of any implications of this change in the visual environment. It is possible that this change in the experienced visual environment may affect the nature of visual development and perception to such an extent that the oblique effect and related aspects of visual perception are fundamentally different for those with extensive exposure. Differences in the level of environmental anisotropy may impact the neural structure and functioning subserving low-level contour detection, a point underscored by findings demonstrating effects of such differences using deprivation conditions (Chapman & Stryker, 1993; Crair et al., 1998; Espinosa & Stryker, 2012). An examination and comparison of differences between digital content and “real-world” images is needed in order to assess the potential impact of this change in exposure. That examination is the purpose of this investigation.
To supply this information and determine whether the shift to an increasingly digital world has implications for differential sensitivity to anisotropy in visual perception, images from across a swath of the digital landscape were sampled for analysis, including television cartoons, social communication websites (e.g., Facebook, Twitter, Zoom), and video games. Images of natural, suburban, and urban landscapes were also sampled for comparison. Orientation amplitude was calculated using Fourier analysis across orientation from horizontal to oblique to vertical (Melmer et al., 2013; Schweinhart & Essock, 2013; van der Schaaf & van Hateren, 1996). It was expected that digital content categories would vary broadly in terms of contour composition, some possessing higher levels of orientation anisotropy than real-world environments, with others showing similar content. No content, however, was predicted to exhibit lower orientation anisotropy (i.e., to exhibit less of a difference in amplitude—see below–between oblique and horizontal orientations, for example) than that of a set of natural scenes.
Methods
Images were gathered from a variety of digital and real-world sources. Images were captured in full screen from publicly available videos (YouTube) using an automatic screen capture tool at a rate of once every 5 or 10 s depending on the length of the video. Videos were taken in full screen avoid unnecessary visual elements derived from the video platform and computer interfaces. No additional compression or preprocessing was added. At least 250 images were captured per source (except for Instagram, with 233). Images of real scenes were taken from publicly available videos showcasing three types of outdoor environments: urban cities, suburban neighborhoods, and natural scenery. Natural environments encompassed a variety of biomes, including forests, mountains, and tundras and did not contain any man-made constructs, humans, or animals. Suburban images were taken in various US neighborhoods and occasionally included humans. Urban images were taken in downtown Manhattan (New York City) and Rome, which often contained people, but rarely any elements of nature. Full episodes and compilations of select cartoons were found online and were used for image capture. Facebook images were captured through a single person's Facebook feed. The other websites were captured through publicly posted videos. Video games were chosen by popularity and fitness to the category of “nature-based games,” “urban-based games,” and “pixel-games” (based on the authors’ knowledge). All images were captured at 1920 × 1080 p. See Figure 1, for the examples of measured categories.
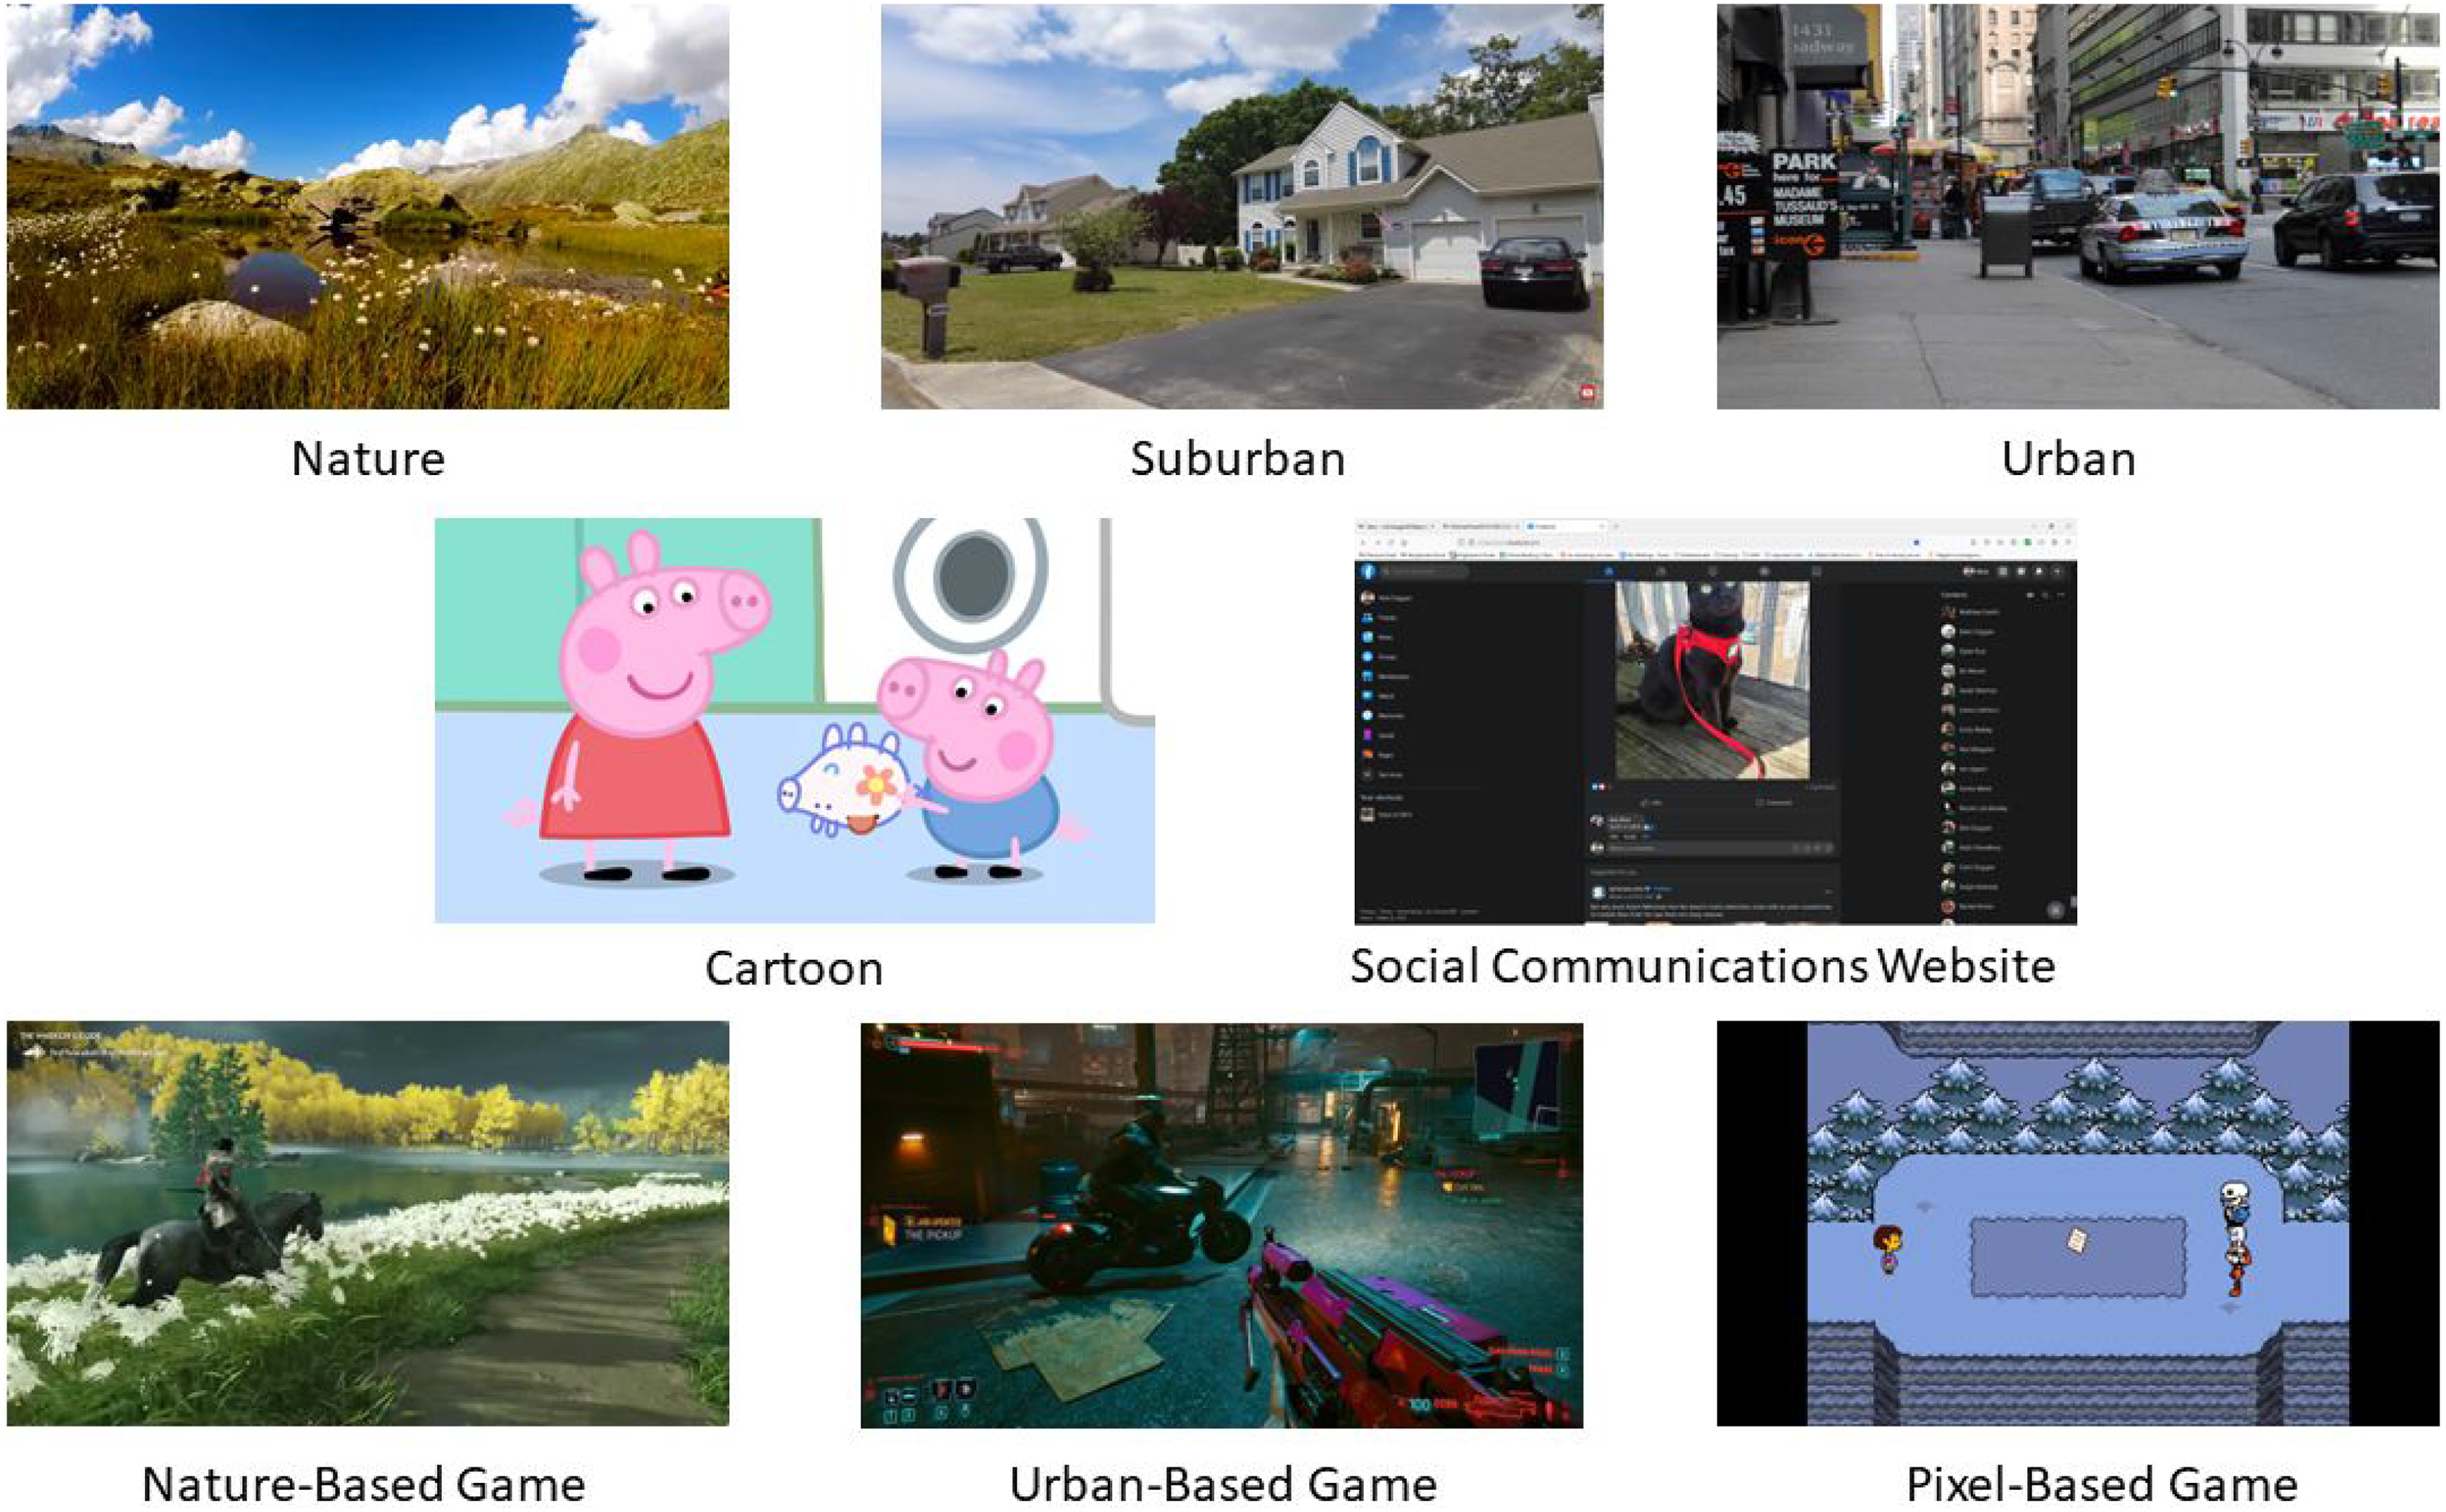
Categories analyzed for orientation analysis. Natural images consisted of a variety of natural biomes without carpentered features. Suburban images consisted of neighborhoods of natural and carpentered features. Urban images were chosen to display mostly man-made structures, with a low density of natural elements. Digital categories included cartoons (Peppa Pig shown here), social communications platforms (example image from Facebook), nature-based games (Ghost of Tsushima image shown), urban-based games (Cyberpunk 2077 image shown), and pixel-based games (Undertale image shown).
Before analysis, images were removed if they contained any additional artifacts related to image capture such as an advertisement banner, unless appearing in regions that would be subsequently cropped from the image. Additionally, images were removed if they did not reflect the content that was being captured (e.g., a black transition screen). Images were converted to grayscale (using RGB2gray function in MATLAB) and cropped to a circle 800 pixels in diameter to eliminate border effects (Figure 2; also see Schweinhart & Essock, 2013). The fast Fourier transform (FFT) was applied in MATLAB using the FFT2 function which sampled vertical and horizontal (canonical) content from the image. After a pass, the image was rotated 3° and the image was sampled again at the new horizontal and vertical, until the image had been rotated 90°.
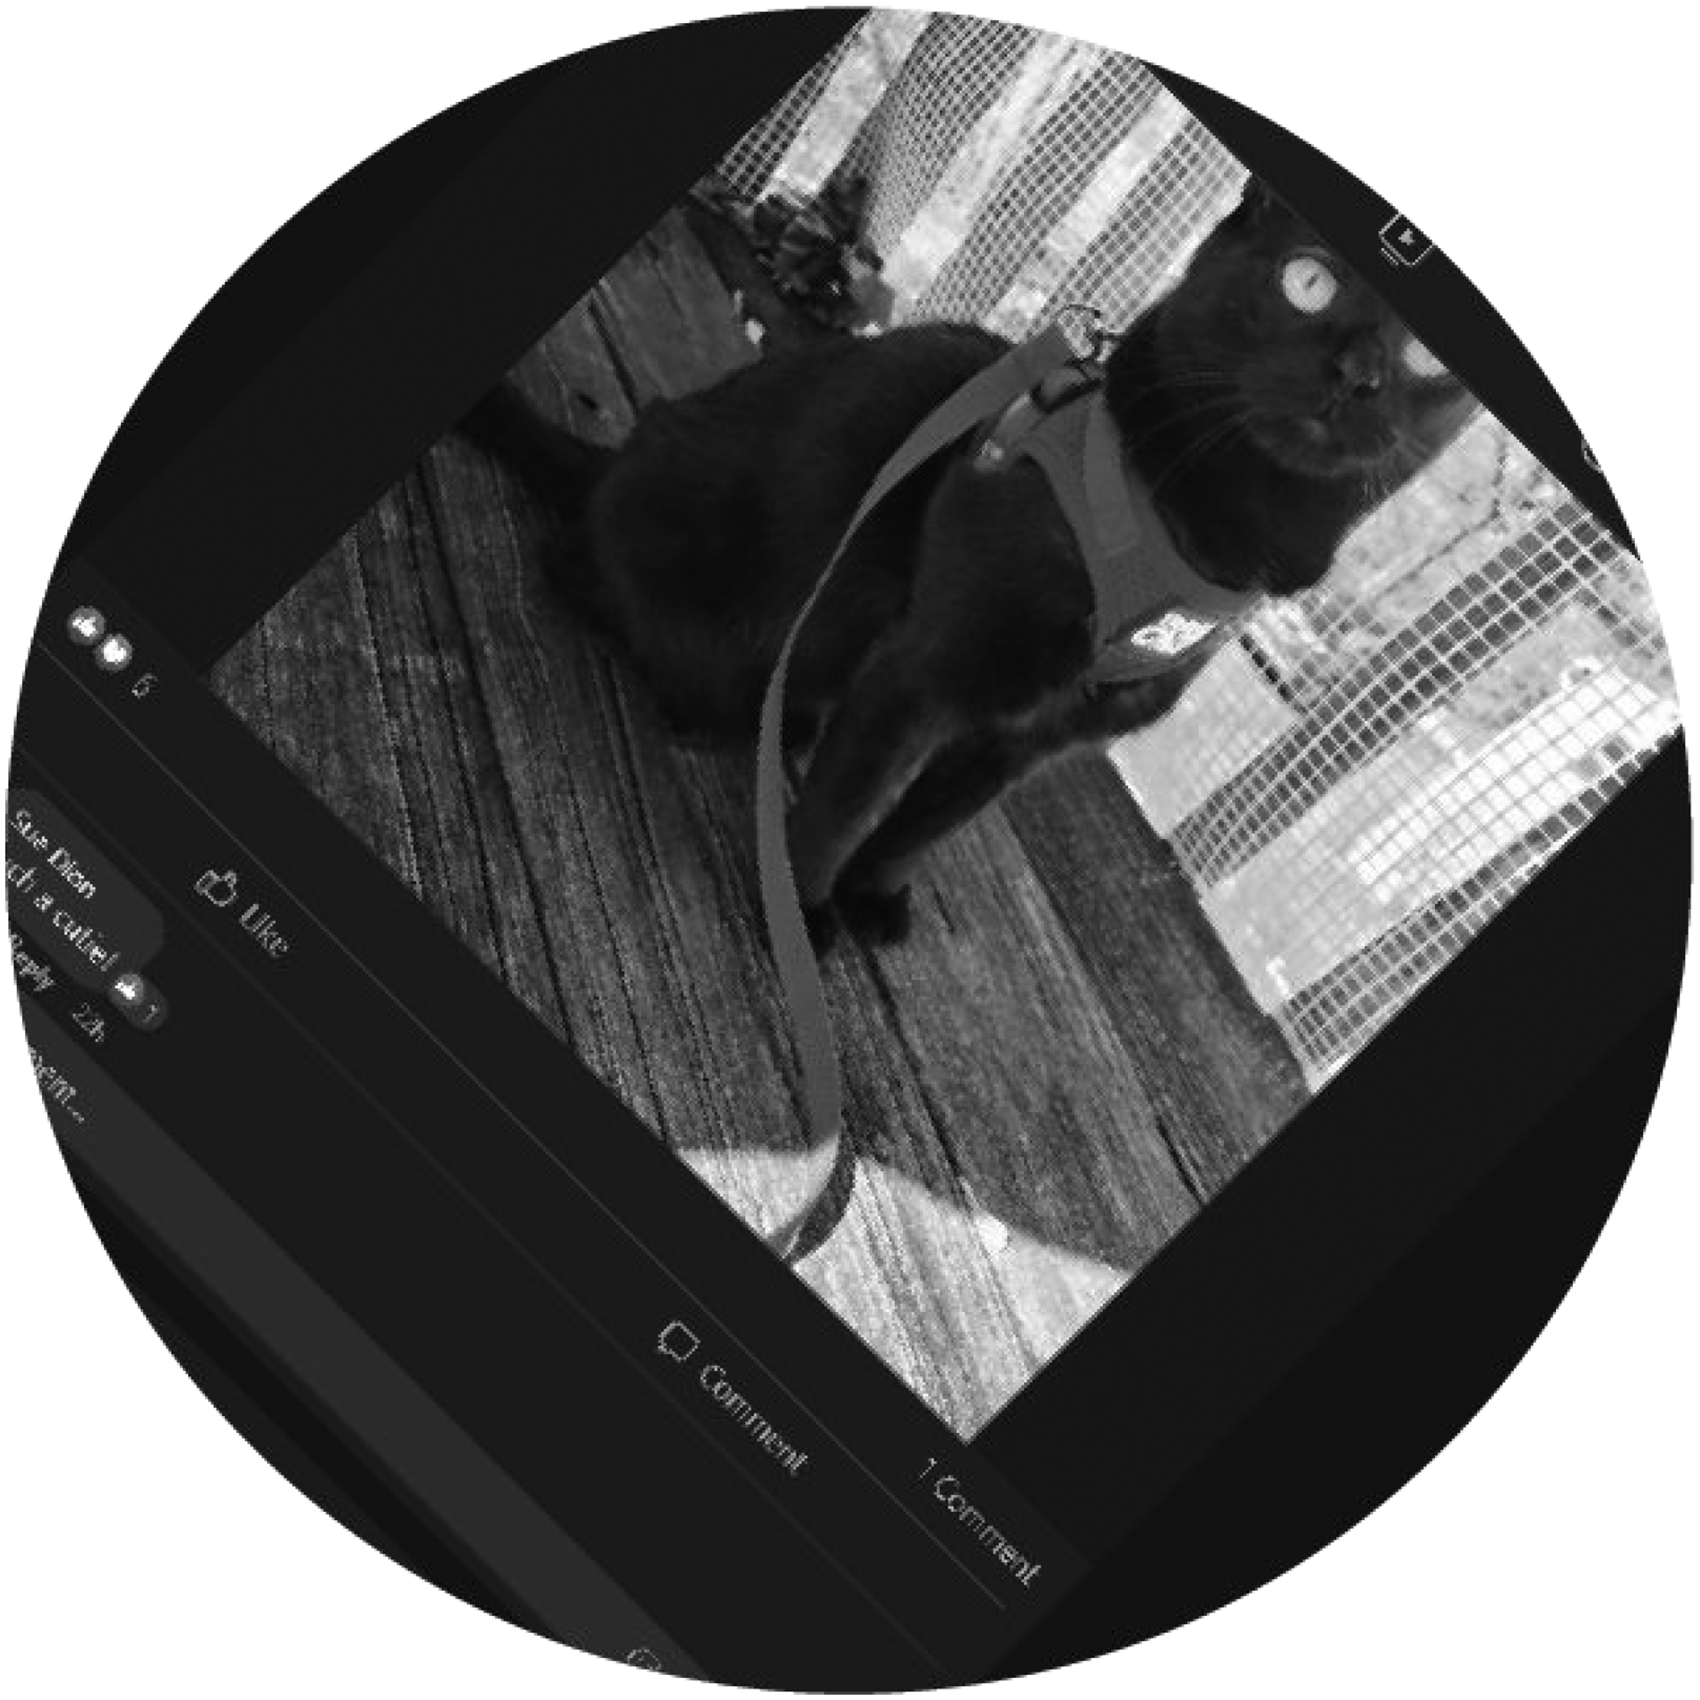
An example cropped stimulus image (at 45° rotation) before being processed through a Fourier analysis. Images were converted to grayscale and cropped into an 800-pixel diameter circle following Schweinhart and Essock (2013). After each pass, the image was rotated 3° and re-analyzed until the image reached 90° of rotation.
Results
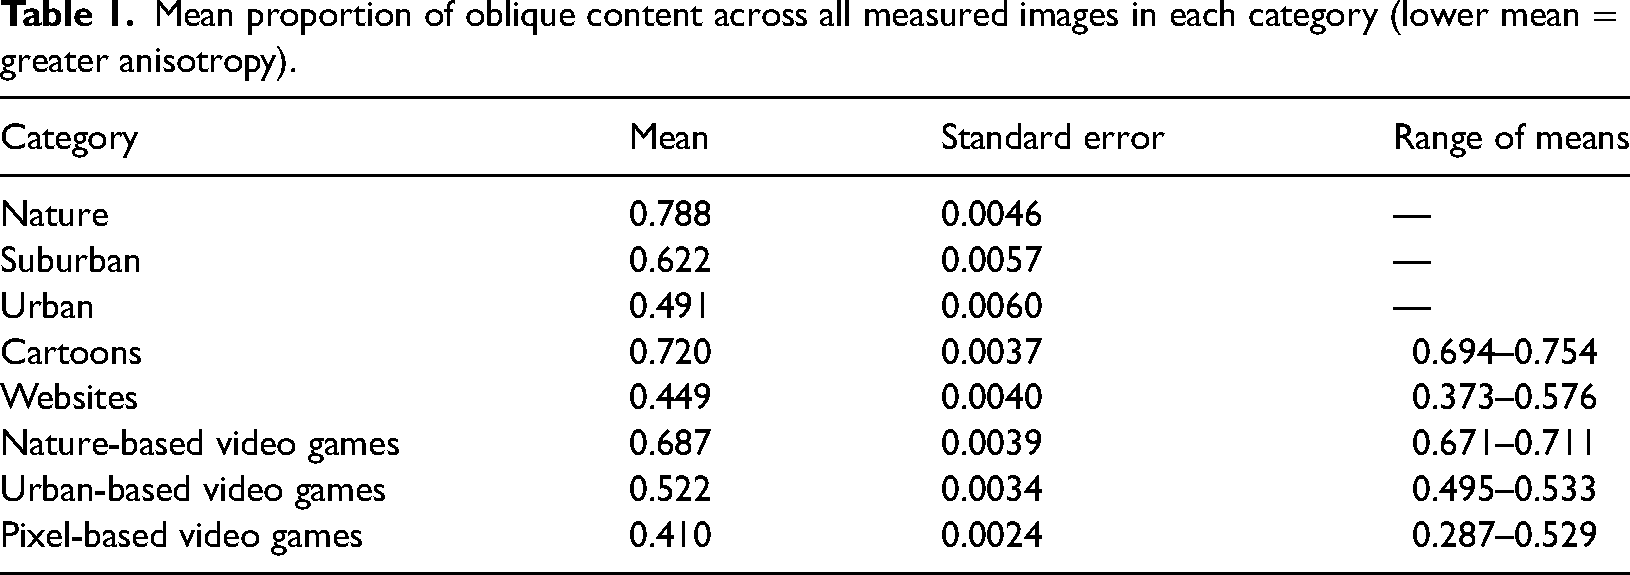
Images were analyzed for orientation amplitude. The analysis compared average amplitudes at a range of ±21° from 0°/180° (horizontal), 45° (oblique), and 90° (vertical), at intervals of 3°, following the approach of Coppola et al. (1998). The oblique range occurring at 135° ± 21° was not significantly different from the 45° oblique range across all images sampled, t(13,368) = 1.365, p = .17, and so data surrounding 135° were not considered in the analyses. Mean image amplitudes differed between individual photos and across image sources, so orientation amplitudes were normalized as proportions of the highest value among all orientations (which slightly varied between vertical and horizontal depending on the source, in agreement with Harrison, 2022). Means and standard errors for all comparisons are reported in Table 1.
Mean proportion of oblique content across all measured images in each category (lower mean = greater anisotropy).
Overall Analysis
A one-factor ANOVA was conducted to test for differences in the representation of horizontal (M = 0.653, SE = 0.001), vertical (M = 0.607, SE = 0.002), and oblique contours (M = 0.539, SE = 0.002). Across all categories, 13,694 images were evaluated (1342 came from digital content that were not used in further analyses). There was an overall effect across all three orientation categories, F(1.6744, 22,748.63) = 13,237, p < .0001, ηp2 = 0.49 (departure from sphericity was detected, so a Greenhouse–Geisser correction was applied to the degrees of freedom). Horizontal oriented contours occurred in greater proportion than vertical, t(13,684) = 53.16, p < .0001, ηp2 = 0.17, and oblique contours, t(13,684) = 180.01, p < .0001, ηp2 = 0.72. Vertical orientations were also observed in greater proportions than oblique orientations, t(13,684) = 113.02, p < .0001, ηp2 = 0.42.
Real Environments
Orientation anisotropy was measured by normalizing the proportion of contours at each orientation to the most represented orientation (almost always horizontal) within individual images. An overall ANOVA on real environments including nature scenes (N = 562, M = 0.687, SE = 0.005), suburban scenes (N = 384, M = 0.622, SE = 0.006), and urban scenes (N = 359, M = 0.491, SE = 0.006) revealed a difference between categories for normalized oblique orientations, F(2, 1302) = 806.89, p < .0001, ηp2 = 0.55. There was more oblique representation in suburban environments compared to urban environments, t(1302) = 16.022, p < .0001, ηp2 = 0.16, natural environments compared to urban environments, t(1302) = 39.47, p < .0001, ηp2 = 0.52, and natural environments compared to suburban environments, t(1302) = 22.52, p < .0001, ηp2 = 0.28. Thus, the ordering predicted by prior findings (Coppola et al., 1998) was confirmed.
Cartoon Images
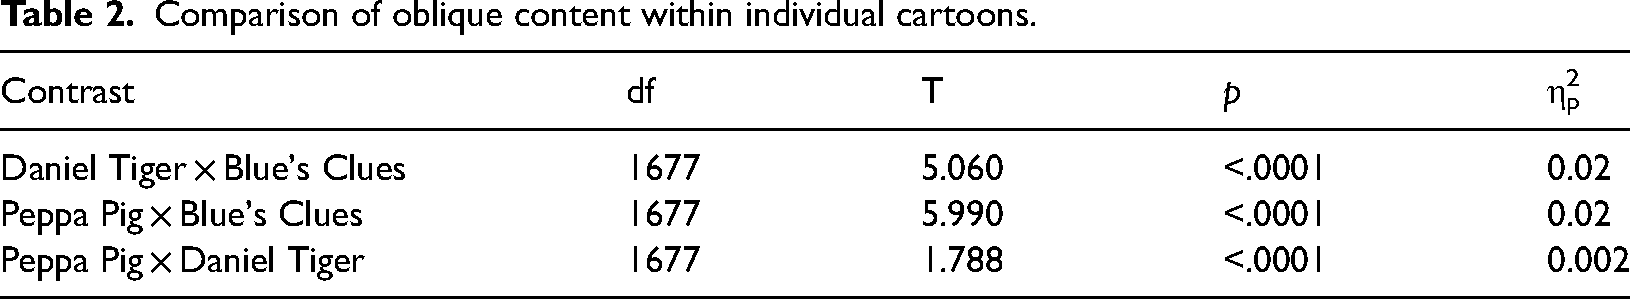
Three different children's cartoons were used in the following analysis: Blue's Clues (N = 784), Daniel Tiger (N = 586), and Peppa Pig (N = 310). While an ANOVA showed a significant difference in oblique proportion among specific cartoons, F(2, 1677) = 22.98, p < .0001, the effect size was negligible (ηp2 = 0.02) (see Table 2). Cartoons, M = 0.720, SE = 0.004, were found to have more oblique representation than urban, t(660.42) = 32.28, p < .0001, ηp2 = 0.61, and suburban scenes, t(751.42) = 14.43, p < .0001, ηp2 = 0.18, but less oblique representation than natural scenes, t(1332.9) = −11.51, p < .0001, ηp2 = 0.07 (see Table 1). Cartoons appear to project a profile more similar to nature scenes than to other real-world images (see Figure 3).
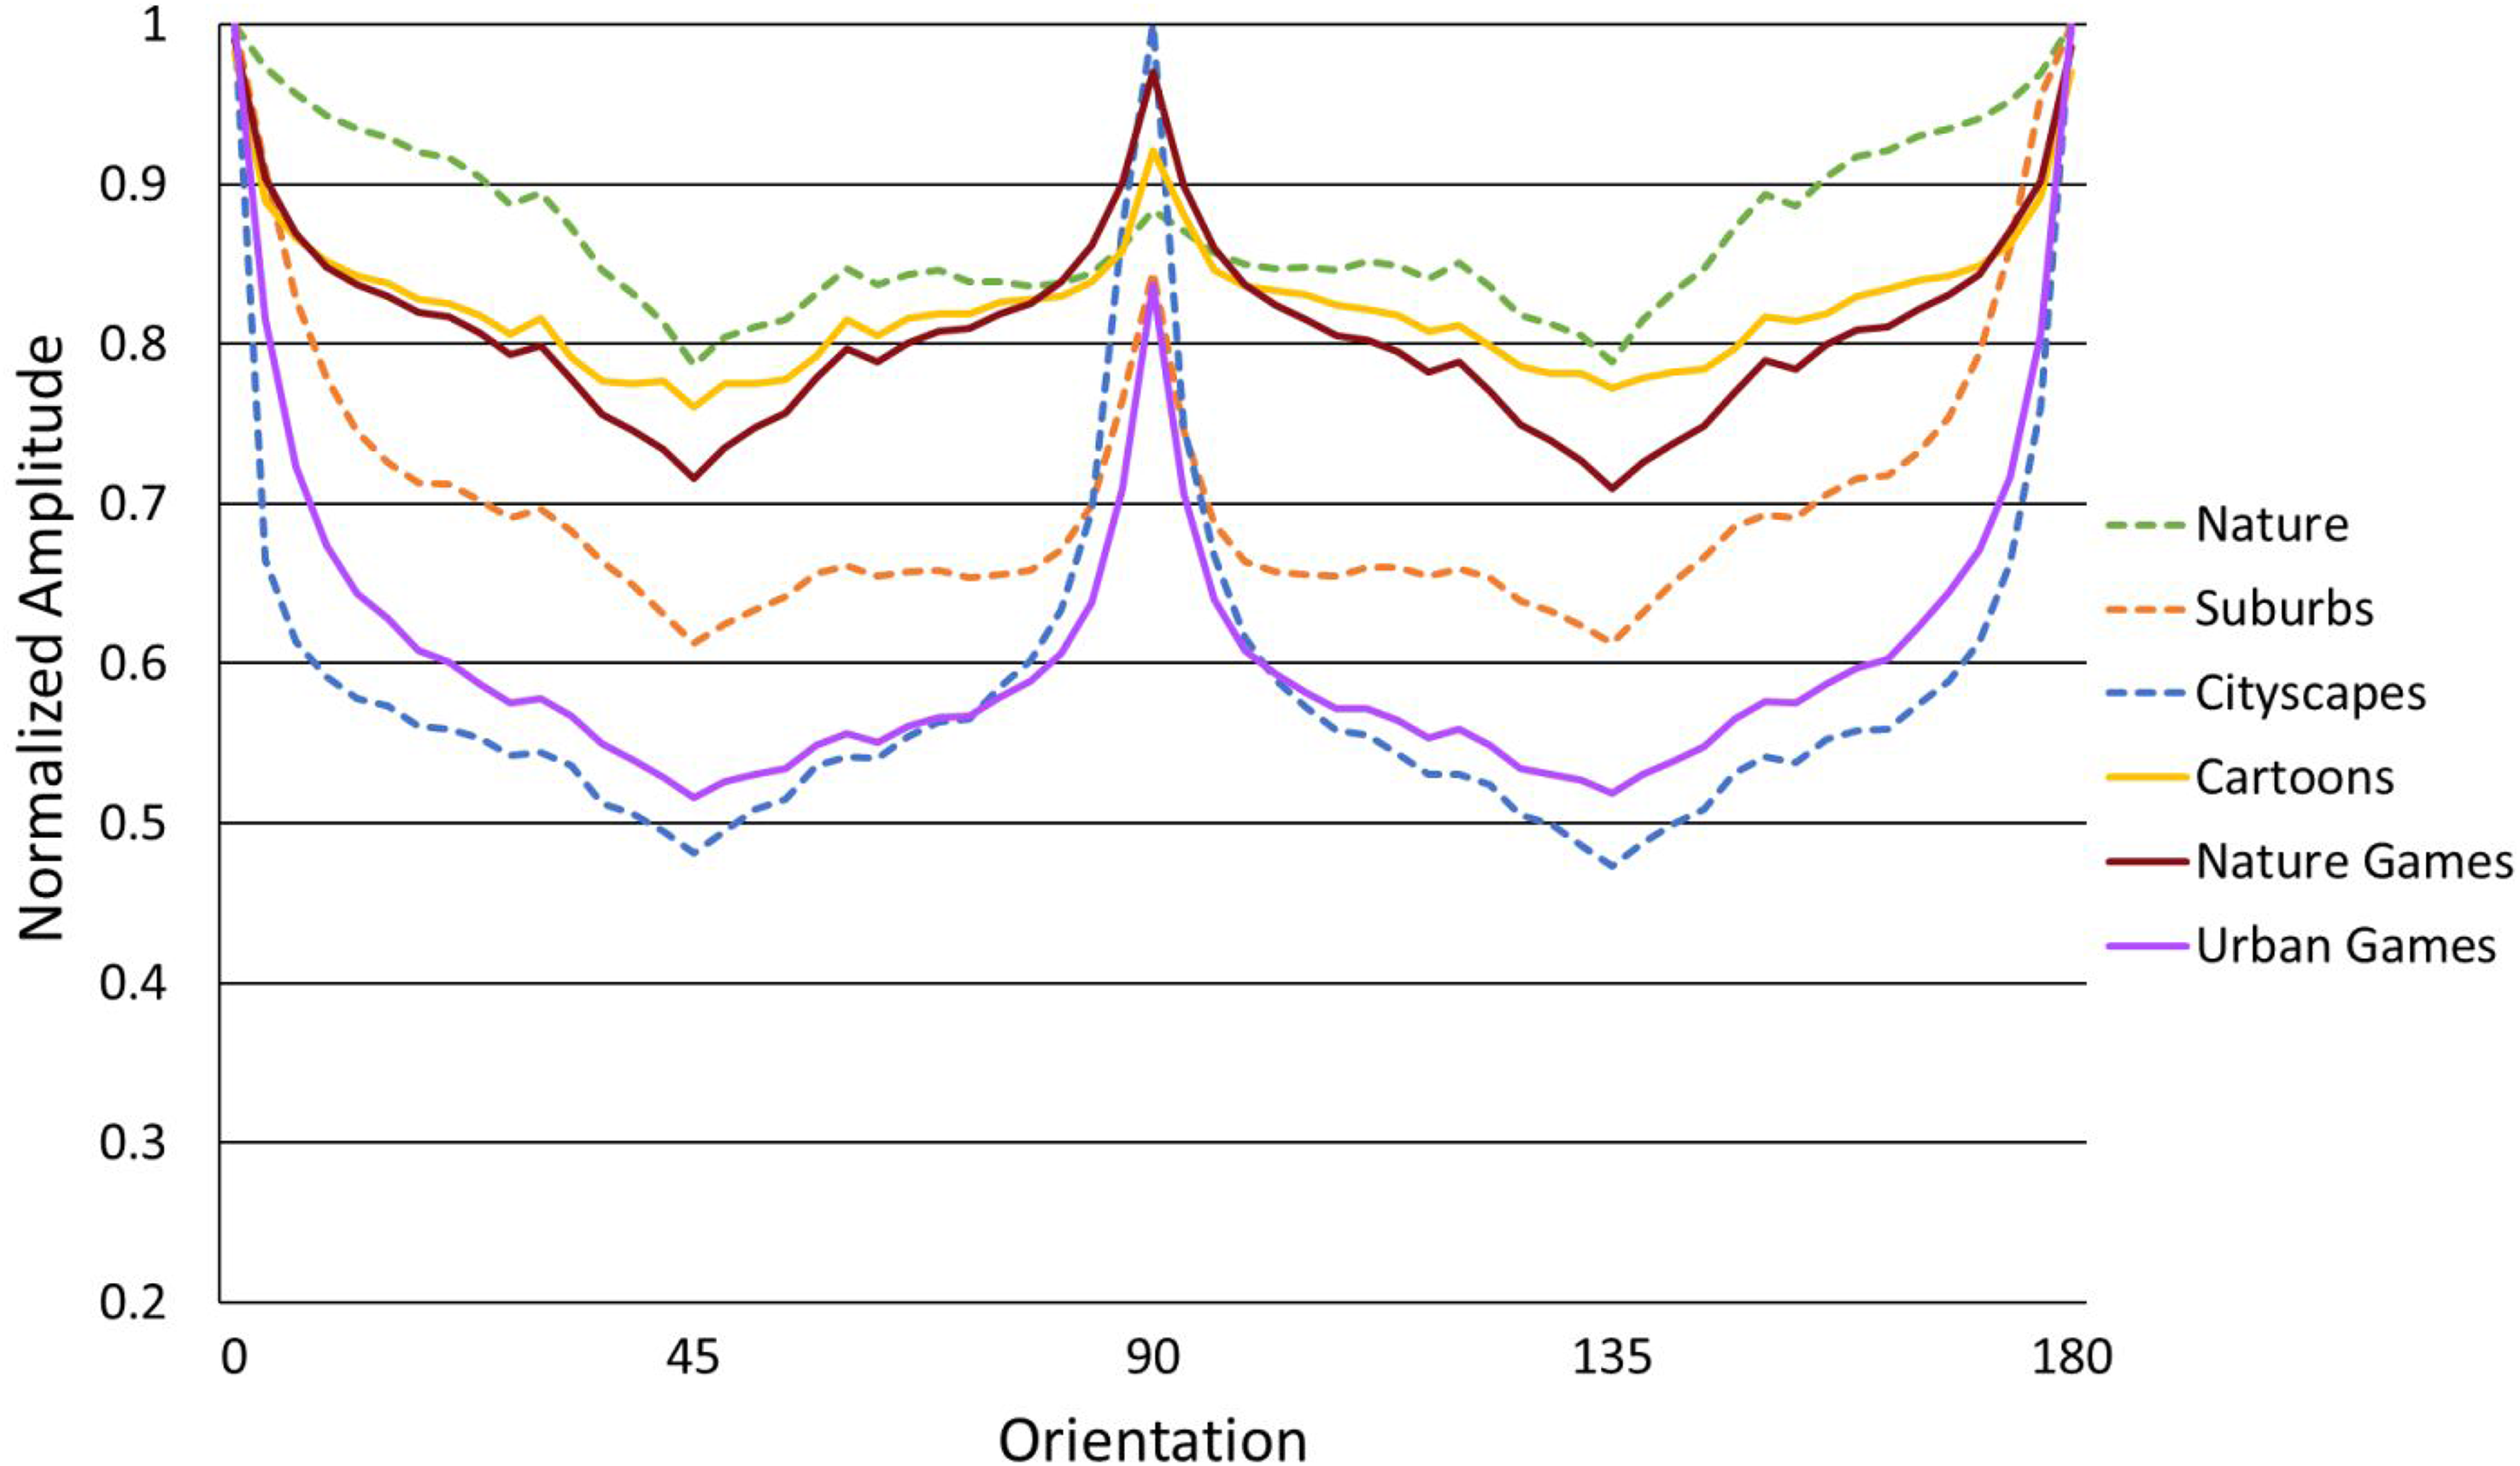
Digital content reflecting anisotropic proportions within the anisotropy range of real-world scenes.
Comparison of oblique content within individual cartoons.
Social Communication Websites
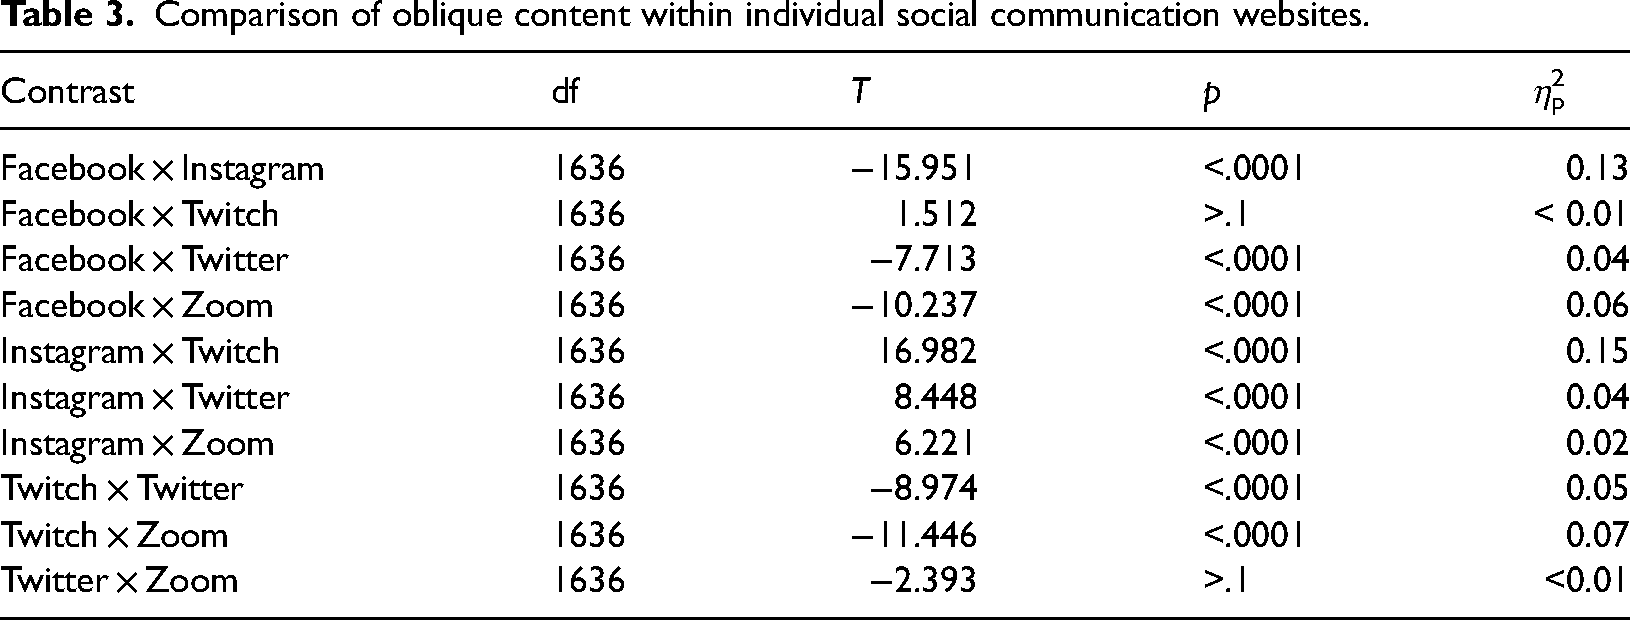
Content from five social communication websites, Facebook (N = 409), Instagram (N = 233), Zoom (N = 312), Twitch (N = 376), and Twitter (N = 314) were analyzed for this category. Significant differences were found between individual websites; F(4, 1636) = 101.69, p < .0001, ηp2 = 0.20, with individual effect sizes ranging from <0.01 to 0.15 (see Table 3). Social communication websites (M = 0.449, SE = 0.003) as a whole were significantly more anisotropic than real-world content from any of the three sources: Nature scenes, t(1421.1) = −55.79, p < .0001, ηp2 = 0.69, suburban scenes, t(802.54) = −25.104, p < .0001, ηp2 = 0.44, or urban scenes, t(703.04) = −5.88, p < .0001, ηp2 = 0.05. See Figure 4 for an illustration of the category's anisotropy profile.
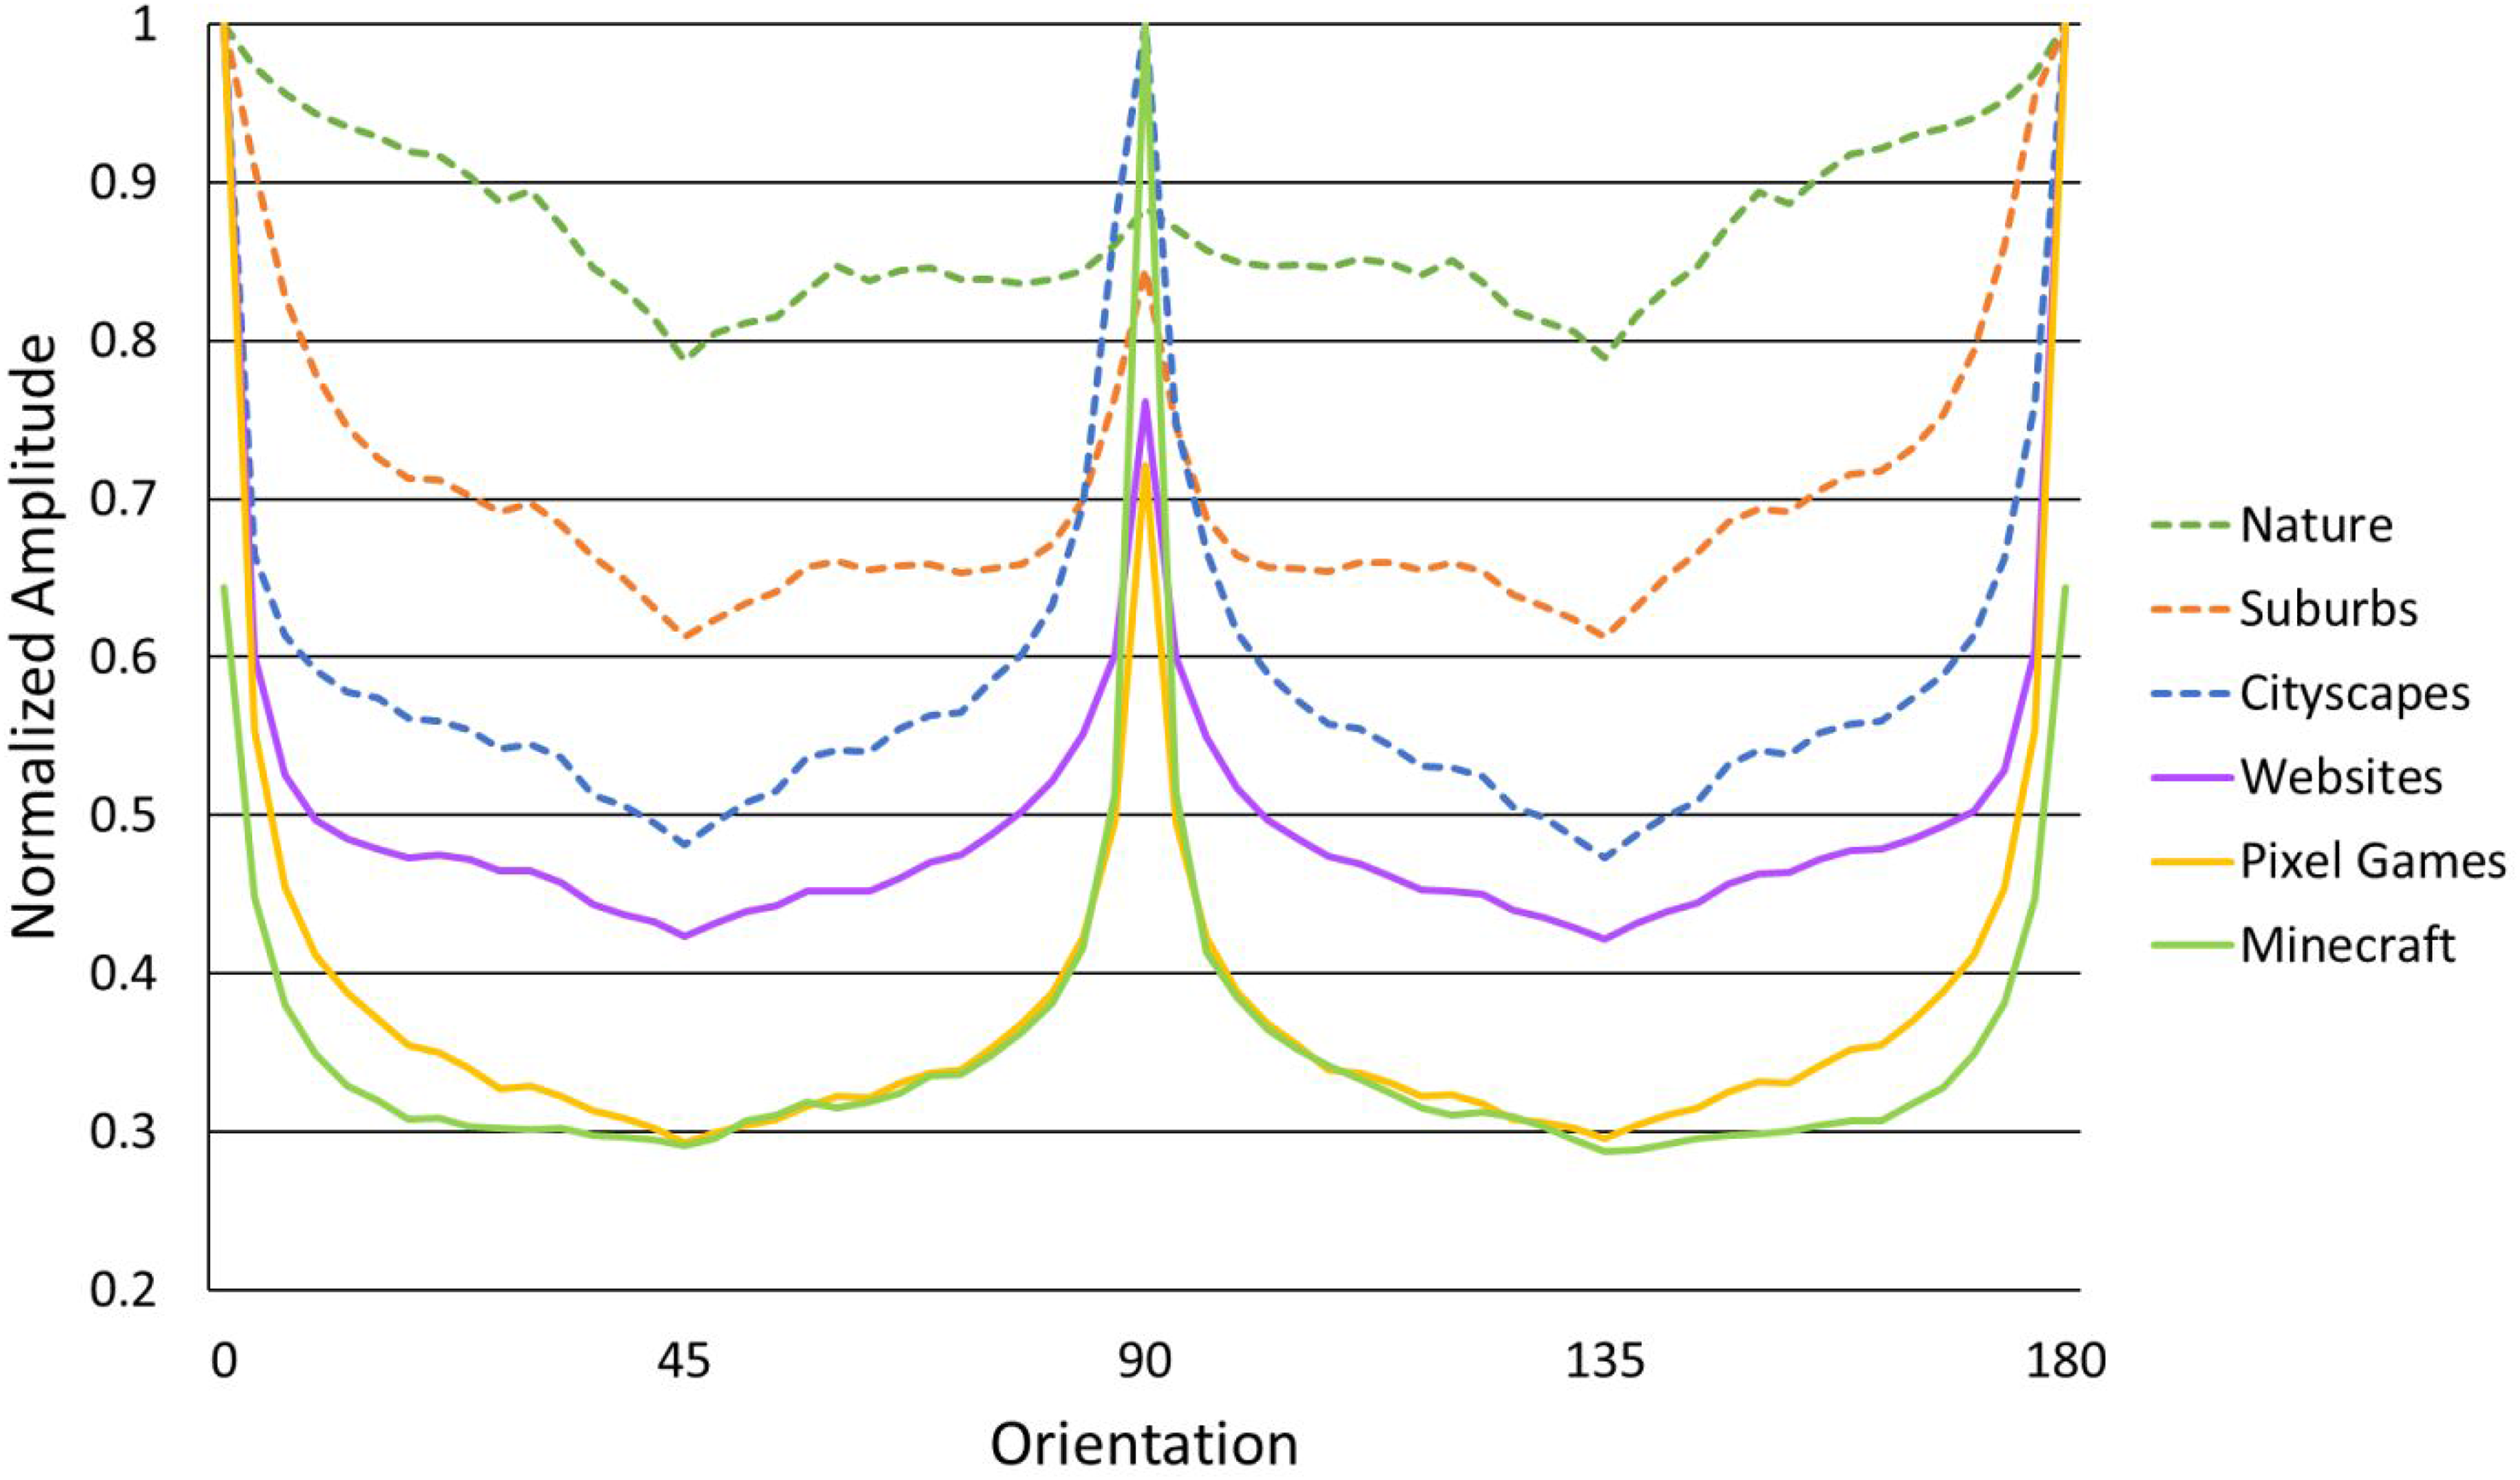
Digital content exceeding the anisotropy of real-world scenes.
Comparison of oblique content within individual social communication websites.
Video Game Images
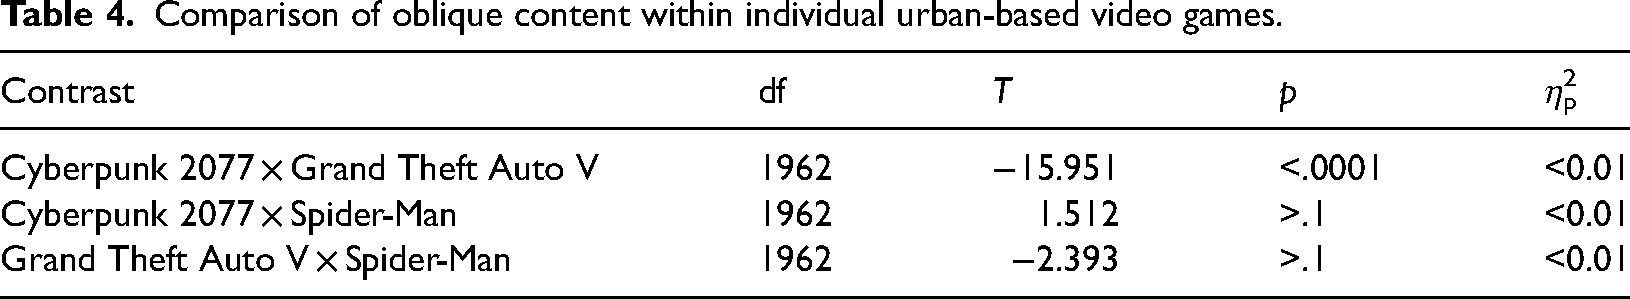
Video game images were selected from three categories chosen for comparison with the images collected from real-world sources: games set primarily in urban environments (Marvel's Spider-Man [N = 828], Grand Theft Auto V [N = 679], Cyberpunk 2077 [N = 459]; see Table 4) games set in natural environments (Ghost of Tsushima [N = 472], The Witcher 3 [N = 461], Red Dead Redemption 2 [N = 613]; see Table 5), and games with pixelated graphics (Stardew Valley [N = 357], Undertale [N = 331], Binding of Isaac [N = 373], Celeste [N = 799], Loop Hero [N = 440], Shovel Knight [N = 507], Sonic Mania [N = 488], Terraria [N = 599]; see Table 6). While urban-centered video games differed significantly from one another; F(2, 1962) = 9.93, p < .0001, the effect size was small, ηp2 < 0.01 (see Table 4). Digital games set in urban environments, M = 0.522, SE = 0.003, contained less oblique content (i.e., these images were more anisotropic) than nature images, t(1232.1) = −46.35, p < .0001, ηp2 = 0.64, and suburban images, t(692.76) = −15.16, p < .0001, ηp2 = 0.21, but contained comparable amounts of oblique content relative to actual urban environments. The comparison was reliable, t(611.48) = 4.434, p < .0001, ηp2 = 0.03 but the differences again were small, Murban games = 0.52, Murban scenes = 0.49. See Figure 3 for illustration of the urban-setting digital gaming category's anisotropy profiles.
Comparison of oblique content within individual urban-based video games.
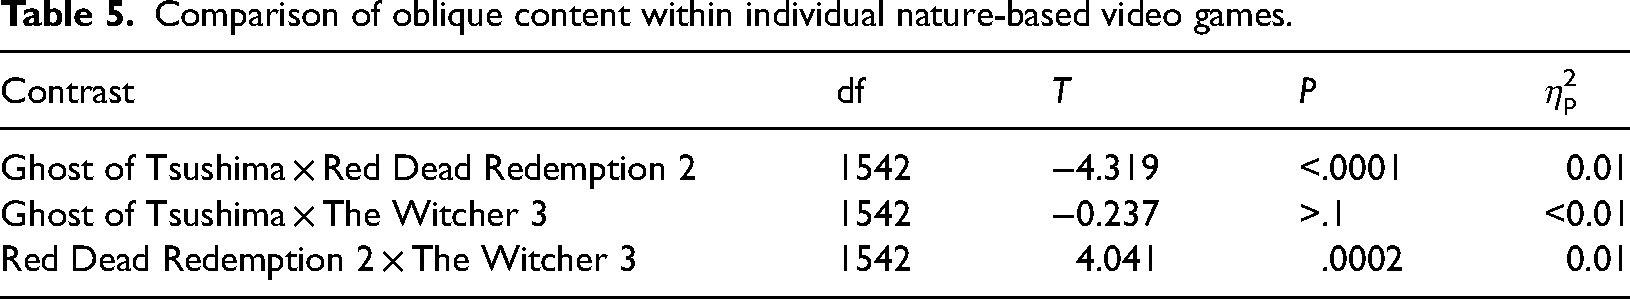
Comparison of oblique content within individual nature-based video games.
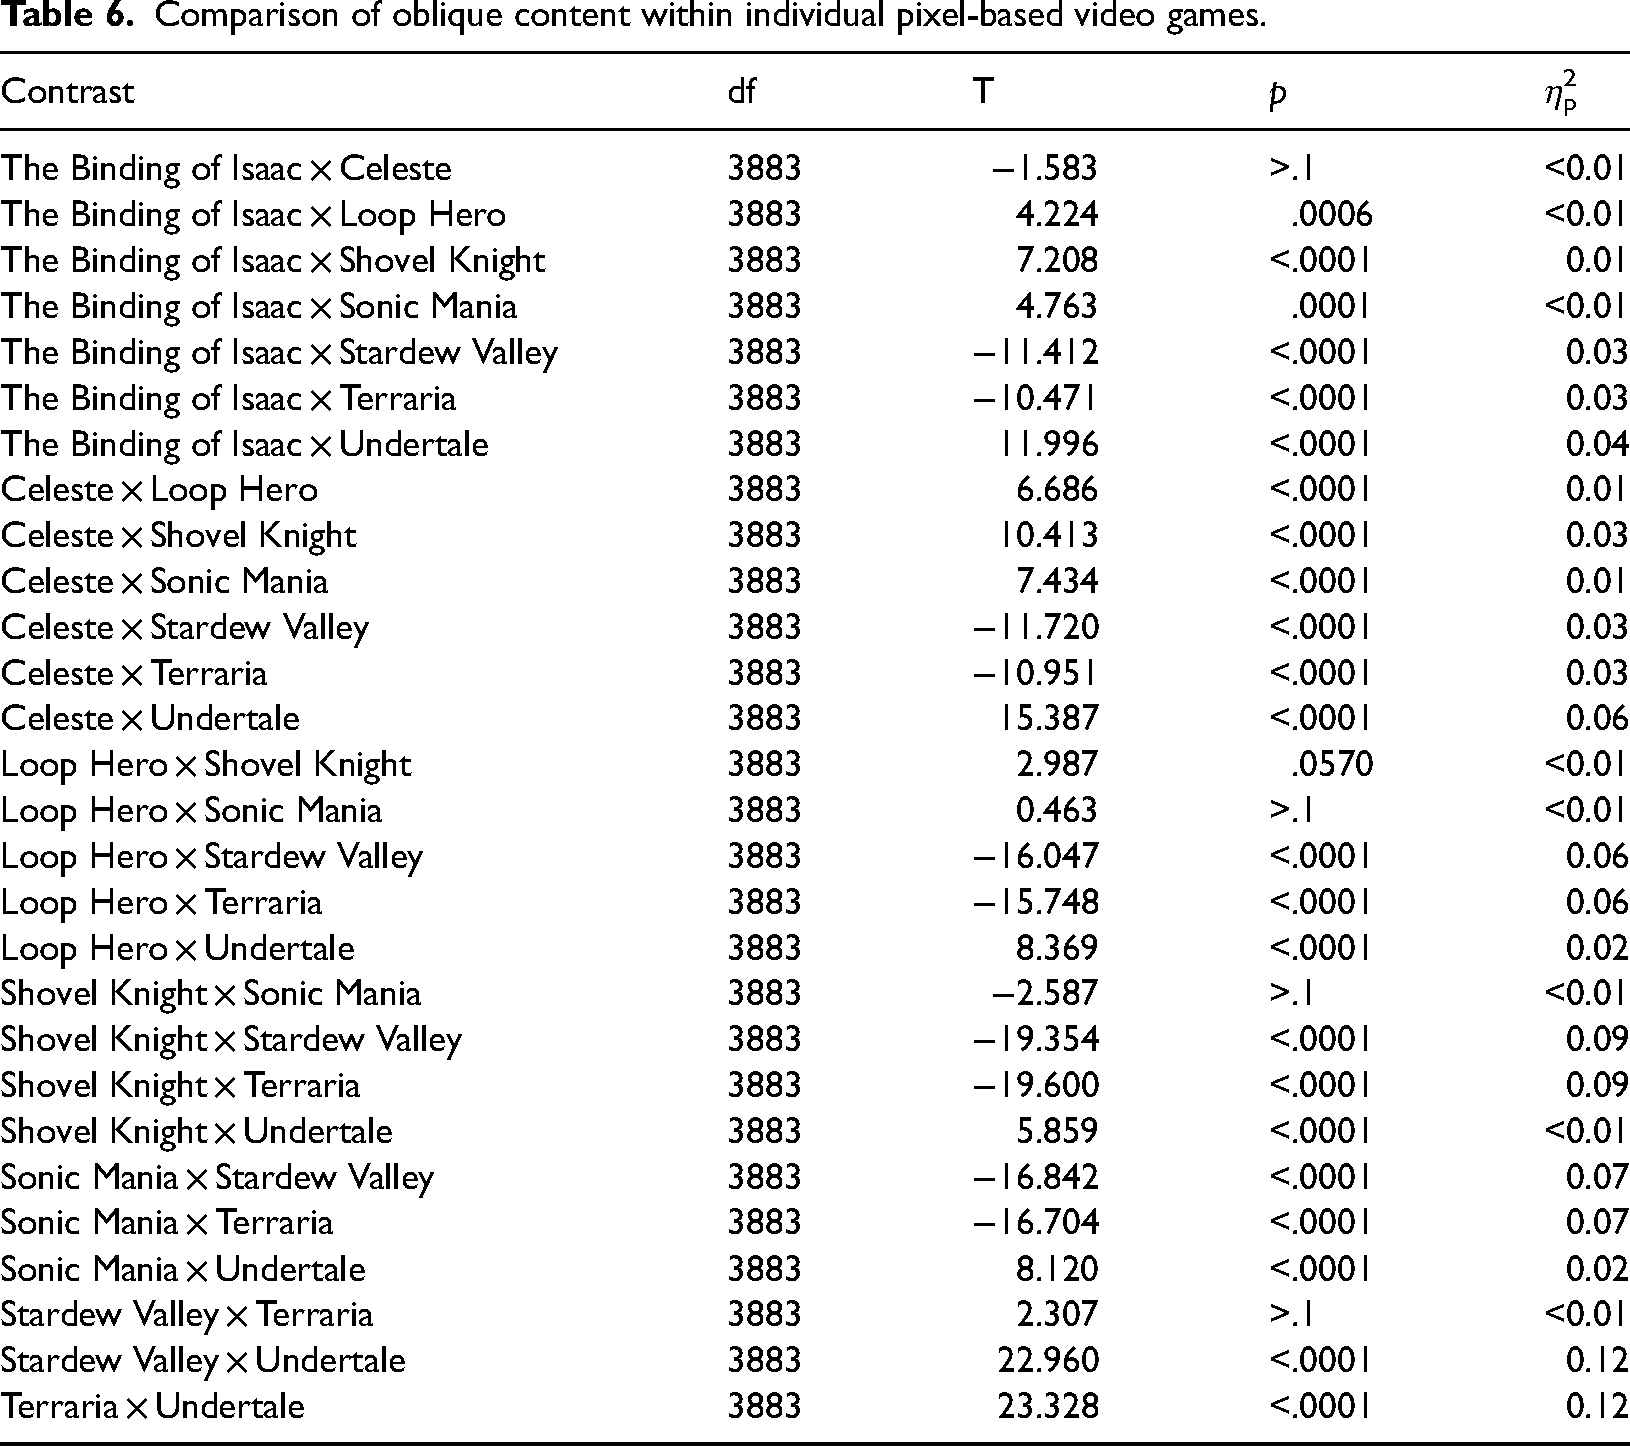
Comparison of oblique content within individual pixel-based video games.
Similarly, nature-based games differed from one another, but as above, effect sizes of these differences were small, F(2, 1542) = 12.24, p < .0001, ηp2 = 0.01 (see Table 5). Nature-based games, M = 0.687, SE = 0.004, had less oblique content than nature images, t(1382.8) = −16.67, p < .0001, ηp2 = 0.17, but more oblique content than suburban, t(785.32) = 9.51, p < .0001, ηp2 = 0.10, and urban scenes, t(689.15) = 27.35, p < .0001, ηp2 = 0.52. See Figure 3 for illustration of the nature setting digital gaming category's anisotropy profiles.
Pixelated games reflected a significant difference in oblique content within-category, F(7, 3883) = 147.81, p < .0001, with a substantial effect size, ηp2 = 0.22 (see Table 6). Following an initial finding revealing this effect size, the number of pixelated games examined was increased from 4 to 8 to explore this difference. Pixel-based games, M = 0.41, SE = 0.002, were significantly more anisotropic than nature images, t(920.37) = −71.91, p < .0001, ηp2 = 0.84, suburban images, t(542.47) = −34.19, p < .0001, ηp2 = 0.68, and urban images, t(488.31) = −12.33, p < .0001, ηp2 = 0.24 (see Figure 4). Minecraft, a three-dimensional game with a pixelated design (N = 316), was evaluated independently from other pixel-based games (see also Hipp et al., 2020). Minecraft exhibited a strikingly low level of oblique representation, M = 0.41, SE = 0.007, compared to nature images, t(585.55) = −56.79, p < .0001, ηp2 = 0.85, suburban images, t(636.58) = −34.53, p < .0001, ηp2 = 0.65, and urban images, t(643.29) = −19.50, p < .0001, ηp2 = 0.37. When compared with other pixelated games, Minecraft exhibited an even larger degree of anisotropy, t(643.29) = −19.50, p < .0001, ηp2 = 0.31.
Discussion
This study sought to characterize the relative distribution of oriented contours in digital images in comparison with images of real scenes. In order to accurately represent the content resulting from the experience of exploring an environment (real or digital) for a prolonged period of time, a Fourier analysis was applied to extracted contour-based information from hundreds of images within each source. Three categories of real images were considered as benchmarks: urban scenes, suburban scenes, and natural scenes. Previous studies have found that environments containing man-made structures contain more canonical contours than natural environments (Coppola et al., 1998; Segall et al., 1966; see also Field, 1987). Our results confirm this finding; urban landscapes had a significantly increased level of orientation anisotropy compared to natural scenes. Suburban scenes, which contained some natural content and some man-made structures, fell between urban and nature scenes.
The primary findings from analysis of digital content confirmed our prediction that the composition of contours would vary widely across digital domains. Samples of cartoons and nature-focused games were most similar in composition to real nature images. Urban digital gaming environments aligned closely with real-life urban scenes. These findings contradict prior speculation that digital content contains uniformly high anisotropy (Hipp et al., 2020). In fact, video games contain a sizable degree of variability in the amount of anisotropy in their digital content. The orientation composition of the scenes found within video games appears to be derived from their artistic design and the environments that are intended to be emulated, as suggested by the analyses above.
Two specific categories of digital content measured, however, substantially exceeded the range of anisotropy established by real-world images: Pixel-based games and social communication websites. Pixel-based games are a unique class of digital games which are artistically designed to create complex scenes using only canonical lines. Social communication websites show similar levels of anisotropy but are more complex environments that may contain various forms of real-world content. The abnormally high levels of anisotropy expressed in social communication websites are likely a reflection of the organized design used to appear aesthetically pleasing and keep viewers engaged on these platforms.
These findings are important because the degree of orientation anisotropy within these categories does not match to typical real-life contexts, carpentered or natural, giving rise to the possibility that prolonged internet and pixel-based game use may induce an exaggerated sensitivity for canonical contours over oblique contours. Note that this may not be unique to the digital environment as such; Pollnac (1977) reported evidence that alteration of sensitivity to anisotropy does occur with (altered) nondigital exposure (see also Annis & Frost, 1973). How might such an alteration affect visual perception? It is likely that perception of low-level features in early vision affects neuro-aesthetics in perception (Conwell et al., 2021; Jacques, 2021; Strijbosch et al., 2022), affective cognition (de Borst & de Gelder, 2015; Elliott et al., 2011; Zadra & Clore, 2011), and more basically, perceptual salience and attention (Boynton, 2005; Polat, 1999; Taylor & Bays, 2018; Vedechkina & Borgonovi, 2021; Yen & Finkel, 1998). Any of these may be affected by altering the visual environment in this manner. This could, for example, result in a perceptual salience hierarchy of orientation that does not match the distribution of orientation in the visual world, possibly affecting attention capture, altering percepts of beauty and normal appearance, and impacting the extent to which specific stimuli affect one's mood. Long-term exposure to unnaturally anisotropic content, such as that which may occur in digital contexts, holds potential to shift this salience hierarchy, altering the way that observers perceive the world, but the nature of such effects is not well understood.
Note that the unequal distribution of neuron sensitivity early in the visual pathway appears to be in part counterbalanced; that is, the visual system also appears to employ a correction, the “horizontal effect” (Essock et al., 2003; Hansen & Essock, 2005; Schweinhart & Essock, 2013), in which more predominant orientations (horizontal, vertical) are suppressed by the visual system in proportion to their representation in complex scenes (Essock et al., 2009; Haun & Essock, 2010; Kim et al., 2010). A shift in the experienced proportion of canonical and oblique orientations may well affect this mechanism in particular, leading to potential effects in each of the arenas listed above. If prolonged exposure results in an adaptation in which canonical orientations are more strongly suppressed, then when attention is shifted back to the “real” world, excessive suppression of these orientations may occur.
This study sought to establish categories of digital content that would exhibit consistent patterns of orientation anisotropy within-category and reveal differences across categories. In most cases, there was a significant difference in orientation anisotropy across individual digital sources used in a category. These effects, however, are likely due to the substantial number of images analyzed; the small effect sizes support this interpretation. Qualitatively, most image sources align with other sources within a given category. One notable exception appears for pixel-based games (see Table 6). Among the eight pixel-based games that were sampled for this study, there appears to be a bimodal distribution of orientation anisotropy. Some games produced an orientation anisotropy akin to real-life urban scenes while others produced anisotropy that surpassed any real-life setting. During the exploratory part of this study, this trend became apparent, resulting in selection of additional sources for pixel-based games in an attempt to resolve this conflict. The apparent grouping was still present despite inclusion of these additional sources. Note that this difference is not particularly perceptible from casual inspection, contrary to examination of samples across some of the other image categories.
In order to provide a robust examination of video game content, we selected games that mimicked the representation of real-life natural and real-life urban imagery. From our analysis, it appears that some digital environments contain orientation biases similar to their real-life counterparts. Schweinhart and Essock (2013) report that artists often subconsciously reproduce real imagery with statistical regularities that exaggerate the anisotropy present in the real image. Indeed, even skilled oil painters, who demonstrate the ability to produce photo-realistic replications of natural vistas, add orientation biases to their work that may not be noticeable to an observer (Essock & Schweinhart, 2016). Video game art designers similarly attempt to produce photorealistic imagery using computer graphics. In some cases, these efforts attempt to produce recreations of real locations (e.g., the Spider-Man game, used in our analysis, contains realistically rendered sections of Manhattan). Our findings, in contrast, did not find any clear evidence of additional statistical biases included in either our sample of nature-centered or urban-centered games. As the computer used in rendering the scenes does not contain the artist's bias, however, this is not an unexpected outcome.
It is possible, however, that the effect may be hidden by additional variables. For example, while a game may primarily take place in a natural environment, there may be moments where the player is exploring a town composed of carpentered structures. Indeed, it is challenging to quantitatively assess the influence that a digital game may have on orientation sensitivity as environments often vary substantially in composition. For this study, we chose games that could be categorized as primarily taking place in urban or natural environments. The majority of the most popular games, however, cannot be easily categorized in this fashion. Therefore, we cannot draw any clear conclusion about the orientation composition of video games as a general category, and the outcome of this analysis suggests that attempting to do so would conceal important differences between specific content types within the category. Likewise, there are known disparities of information at low spatial frequencies compared to high spatial frequencies (Field & Brady, 1997; van der Schaaf & van Hateren, 1996). It is possible, but currently unknown, if orientation composition is influenced by spatial frequency. This question is worth exploring in the future; however, this study was primarily interested in the phenomenological experience of orientation and therefore did not manipulate the spatial frequency of the image sample.
The orientation composition of the environment is reflected by a cortical orientation bias (Li et al., 2003; Mannion et al., 2010) and a behavioral bias (Annis & Frost, 1973; Hipp et al., 2020; Schweinhart et al., 2017). Indeed, one of the fundamental goals of this study was to examine the capacity of digital content to influence orientation sensitivity beyond that of the carpentered environment. This exploratory sweep of the digital landscape has provided strong evidence that digital content does not convey a ubiquitous perceptual bias, but certain subtypes (in some cases representing highly popular content) do hold this capacity. It remains to be seen if high levels of digital content consumption within these specific subtypes can lead to an enhanced sensitivity of canonical contours over oblique contours. Our findings indicate that among the five categories of digital content examined, only pixel-games and social communication websites have the potential to invoke a perceptual bias more extreme than that provided by carpentered environments. That is, video game use or television in general over extended periods of time are unlikely to lead to a greater shift in orientation sensitivity than simply looking around your living room, unless the observer is interested in and over-exposed to specific types of content (e.g., pixel-based video games).
The same cannot be said for computer use, in which the most popular applications and websites appear to possess an exaggerated anisotropy. The degree of anisotropy found in pixelated games may mirror that of other computer applications and websites, including many that comprise a substantial part of the daily visual experience of a significant proportion of adults (e.g., spreadsheets or desktop displays). If so, then the findings discussed above may generalize more widely and potential affects stemming from a shift in experienced anisotropy likewise become more broadly applicable.
What might be the consequences of such a shift? A substantially altered environment might affect the distribution of sensitivities across development, particularly as neural development is clearly understood to progress across a substantial range of childhood (Lenroot & Giedd, 2006). Adaptation from one content type to another when switching activities is certainly likely to take place, but the influence of environmental factors has been noted to have strong effects, especially during critical periods (Crair et al., 1998; see Levi, 2005 for discussion regarding human critical periods). Lewis et al. (2007) found that the development of orientation sensitivity overall is clearly immature at 5 years, a point at which most children in the United States are significantly engaged with digital content, meaning that there is substantial room for an altered visual environment to influence development. This certainly should not be taken as an argument that mature observers would be completely unaffected, but rather that heavily biased environments might be particularly influential to developing visual systems.
To what extent is this a real concern? Many popular games contain pixelated art styles. Pixel-based games used in our analysis are known or are estimated to have sold millions of copies worldwide, and in some cases, many more. Games such as Stardew Valley, Terraria, and Minecraft (games with “blocky graphics” that are highly anisotropic) have sold at least tens of millions of copies and are particularly attractive games for children (active monthly user counts of Minecraft exceed 100 million). Thousands of different pixel-based games exist across digital marketplaces such as Steam (Valve Corp.), Nintendo, and PlayStation (Sony). The “pixel-based games” line in Figure 4 is an average of multiple such games; all of them collectively reflect substantively more anisotropic content than a sample of cityscapes (again, children's TV shows, by comparison, reflect an anisotropy profile closer to nature scenes). Note that estimates of exposure to these pixel-based games are likely understated, as many children watch prerecorded gaming episodes with commentary on YouTube, which may exacerbate their anisotropy without actually playing these games. While these findings show the potential for behavioral consequences that stem from prolonged exposure to highly anisotropic content, we are not aware of any research that has described the practical consequences of exposure to extreme anisotropic content, nor is there good data on actual usage, which requires much more that survey responses. Approaches such as that of the Comprehensive Assessment of Family Media Exposure (CAFE) consortium (Barr et al., 2020), employing passive-sensing applications and time-use diaries, can address this need, but these approaches are relatively new.
The analysis used is a valid and effective way to measure contour representation in real and digital images that has been applied in multiple previous studies (Coppola et al., 1998; Koch et al., 2010; van der Schaaf & van Hateren, 1996). As noted, this method crops a circle in the center of the image in order to effectively rotate the image, however, that means that the entire image is not analyzed. In some cases, important information can be missing from the resulting analysis. In many video games, important information is placed along the edges of the screen (such as a map or the health bar of your character). Much of this information is not seen in our analysis and therefore our methods may not perfectly capture the contour distribution of the images we used in these categories. However, the majority of the image is present, and the content absent from the analysis comprises only a small amount of the screen. In a future analysis, this sort of information should be considered, as an observer may regularly attend to it during gameplay.
It has become apparent that digital environments exhibit various magnitudes of anisotropy, and in some cases, produce greater anisotropy than what can be observed in nondigital environments. The establishment of these differences has provided a motivation to measure the orientation sensitivity of individuals who consume high and low levels of highly anisotropic digital content. While it is clear that these forms of digital content have the capacity to reach a wide audience, it is unclear how much influence these types of digital content play a role in one's orientation sensitivity with respect to other digital and real environments one might be exposed to regularly. Future research should seek to incorporate all aspects of one's visual environment to postulate its influence on the visual system.
Footnotes
Data Availability Statement
Images and Matlab code for this project are available at Open Science Framework: https://osf.io/xgaet/.
Declaration of Conflicting Interests
The authors declared no potential conflicts of interest with respect to the research, authorship, and/or publication of this article.
Funding
The authors received no financial support for the research, authorship, and/or publication of this article.