
Abstract
Aphantasia and prosopagnosia are both rare conditions with impairments in visual cognition. While prosopagnosia refers to a face recognition deficit, aphantasics exhibit a lack of mental imagery. Current object recognition theories propose an interplay of perception and mental representations, making an association between recognition performance and visual imagery plausible. While the literature assumes a link between aphantasia and prosopagnosia, other impairments in aphantasia have been shown to be rather global. Therefore, we assumed that aphantasics do not solely exhibit impairments in face recognition but rather in general visual recognition performance, probably moderated by stimulus complexity. To test this hypothesis, 65 aphantasics were compared to 55 controls in a face recognition task, the Cambridge Face Memory Test, and a corresponding object recognition task, the Cambridge Car Memory Test. In both tasks, aphantasics performed worse than controls, indicating mild recognition deficits without face-specificity. Additional correlations between imagery vividness and performance in both tasks were found, suggesting that visual imagery influences visual recognition not only in imagery extremes. Stimulus complexity produced the expected moderation effect but only for the whole imagery-spectrum and only with face stimuli. Overall, the results imply that aphantasia is linked to a general but mild deficit in visual recognition.
Visual imagery is the visual representation in the mind's eye without corresponding external stimuli (Pearson et al., 2015). Intuitively, it may seem to make sense that people who cannot imagine the faces of their parents and friends have also trouble recognising them, yet, a study by McKelvie (1994) could not find an association between vividness of visual imagery and facial recognition memory performance. However, there are initial findings that people without mental imagery (= people with aphantasia; Keogh & Pearson, 2018; Zeman et al., 2015) report poorer face recognition than people with mental imagery (Milton et al., 2020; Zeman et al., 2020) and, conversely, people with particularly poor face recognition (= people with prosopagnosia; Behrmann & Avidan, 2005) report poorer mental imagery than controls (Grüter et al., 2009). There is even some literature (e.g., Keogh et al., 2021; Tween, 2019) already associating aphantasia and prosopagnosia due to this preliminary evidence and some individual cases (e.g., Charcot, 1889). Interestingly, however, the self-reported recognition deficits in people with aphantasia do not hold up in face recognition tests like the Warrington Recognition Memory Test for faces (RMT-F; Warrington, 1984) or the Famous Face Recognition Test (Milton et al., 2020), whereas a study on the relationship between visual imagery and eyewitness accuracy by Riske et al. (2000; as cited in Grüter et al., 2009) might at least be interpreted as evidence for an association between visual imagery and face recognition. Nevertheless, Roldan (2017) emphasises the double dissociation between mental imagery and perceptual recognition shown in previous literature (Bartolomeo, 2008; Zeman et al., 2015) with only few subsequently published studies showing an association between general recognition deficits and aphantasia (e.g., Monzel, Vetterlein et al., 2021).
Theories regarding object recognition can be divided into bottom-up hierarchical recognition models (DiCarlo & Cox, 2007) and top-down facilitation models (Bar, 2003). In bottom-up hierarchical recognition models, processing follows the ventral visual pathway in a strictly hierarchical order from the visual cortex to the inferior temporal lobe to transform the sensory information so that these can be compared with memory content. Top-down facilitation models assume the projection of early visual inputs directly to the prefrontal cortex (PFC), which interprets the preliminary image – thereby potentially generating visual representations – and then sends the information back to the inferior temporal lobe, where they are integrated with the bottom-up information to limit the number of representations which otherwise would have been required. Since visual imagery is also interpreted as the top-down process of visual perception (see Reverse Hierarchy Model, Pearson, 2019), both top-down processes might overlap within the framework of top-down facilitation models, leading to recognition impairments in people with aphantasia. The framework is further supported by studies showing slower response times for participants with PFC lesions, indicating that they use only bottom-up strategies instead of top-down facilitation (Richer & Boulet, 1999). Interestingly, further support comes from extreme imagery research, showing that people with aphantasia do not only show impaired imagery but also reduced sensory sensitivity (Dance et al., 2021) which is likely due to the presumed overlap of the processes of visual imagery and visual perception. However, even the bottom-up hierarchical recognition models provide potential for the involvement of visual imagery due to viewpoint-invariance (Wright & Barton, 2008) which implies the generation of visual representations (“3D-Models”) enabling us to transform the visual input to recognise objects and faces from different angles (cf. Bruce & Young, 1986). Either way, considering that other cognitive impairments found in people with aphantasia (e.g., in memory, Milton et al., 2020; Monzel, Vetterlein et al., 2021; Zeman et al., 2015) are not limited to faces, there is no obvious rationale as to why recognition deficits in people with aphantasia should be limited to faces, although such deficits are focused on in previous literature (e.g., Keogh et al., 2021; Milton et al., 2020; Zeman et al., 2020).
An explanation for the lack of differences between people with aphantasia and controls in previous (face) recognition tests could be the use of tasks which were too easy and, hence, not sensitive enough to show deficits (e.g., Jacobs et al., 2018; see Monzel, Vetterlein et al., 2021, for a discussion). For example, the Famous Face Test used in the study by Milton et al. (2020) showed a ceiling effect and, thus, might be unable to detect differences between people with aphantasia and controls. Furthermore, the RMT-F has been criticised in the past for containing substantial non-face information (e.g., hair, clothing, posture, emotional expression and image imperfections), which allowed prosopagnosic participants to score normally (Duchaine, 2000; Nunn et al., 2001), although when this information was occluded their performance was close to random chance (Nunn et al., 2001; see Duchaine & Nakayama, 2006). This is plausible considering the findings that artefacts (e.g., clothing) are easier to recognise than natural objects as they have higher semantic relevance (Mechelli et al., 2006) due to less similar structural properties in comparison to natural objects (Gerlach, 2009).
Importantly, faces are more complex stimuli than most objects, thus, most likely increasing the demands on recognition performance, resulting in the superficial appearance that only facial stimuli might be affected. Instead, however, the complexity of the stimuli (as a proxy for item difficulty), might moderate the relationship between visual imagery and recognition performance, which would manifest as general visual agnosia in people with aphantasia when objects become generally more complex. Similar approaches of an overlap between face recognition and object recognition have already been considered in the study of prosopagnosia where only a small proportion of previous cases can actually be dissociated from general visual agnosia (for acquired prosopagnosia see Farah, 1991, for congenital prosopagnosia see Geskin & Behrmann, 2018). On this basis, Corrow et al. (2016) suggest that general visual agnosia should be an exclusion criterion for prosopagnosia, although one could certainly argue for a classification into isolated (i.e., a selective deficit in face recognition) and secondary prosopagnosia (i.e., a deficit in face recognition embedded in other recognition deficits).
However, the findings presented above raise the question whether aphantasia and prosopagnosia are related at all and if they are related, whether recognition deficits in aphantasia are actually selective for faces (cf. Keogh et al., 2021; Milton et al., 2020; Zeman et al., 2020). Regarding the previously mentioned evidence, three alternative models need consideration when investigating face recognition in aphantasia: (1) people with aphantasia show no objectively measurable impairments in face and object recognition at all (Milton et al., 2020; for a discussion on the possible limitations of retrieval conditions in measuring memory deficits in people with aphantasia, see Monzel, Vetterlein et al., 2021), (2) people with aphantasia show objectively measurable, selectively stronger impairments in face recognition than in object recognition but previous instruments were not sensitive enough to show these deficits (see criticism on the RMT-F; Duchaine & Nakayama, 2006) and (3) people with aphantasia show objectively measurable impairments in face and object recognition which might only be evident in more difficult recognition tasks (e.g., due to stimulus complexity, see Monzel, Vetterlein et al., 2021). We expected to find impairments in both, face and object recognition, probably moderated by item complexity (model 3), thereby underlining the assumption that memory deficits in aphantasia are related to task difficulty (Jacobs et al., 2018; Monzel, Vetterlein et al., 2021). This would reject model 2 which is often focused on in previous literature (e.g., Keogh et al., 2021; Milton et al., 2020; Zeman et al., 2020). To test this hypothesis, people with aphantasia and controls are examined using the Cambridge Face Memory Test (CFMT; Duchaine & Nakayama, 2006), which was specially developed to solve the problems encountered when using the RMT-F (e.g., the presence of non-face information) and has been widely used to diagnose prosopagnosia (e.g., Bate, Bennetts, Tree et al., 2019; Cattaneo et al., 2016; Shah et al., 2014; Yardley et al., 2008). Another advantage of the CFMT is that it distinguishes between three different levels of stimulus complexity (identical, novel and novel + noise) and, allows therefore the investigation of a moderation hypothesis for item difficulty. In addition, there is a matched object recognition test, that is, the Cambridge Car Memory Test (CCMT; Dennett et al., 2012), which can be used to assess impairments in object recognition (= object agnosia).
Overall, the aim of our study was to investigate whether face recognition is impaired in aphantasia at all, whether this recognition impairment is specific to faces, and whether the severity of this impairment is comparable to face recognition deficits found in prosopagnosia.
Method
Participants
A total of 65 people with aphantasia (VVIQ ≤ 23; criterion according to Zeman et al., 2020) and 55 controls (VVIQ > 32; criterion according to Dawes et al., 2020; and Wicken et al., 2021) participated in the study, as well as 16 participants who were not assigned to any group. 1 The groups did not differ in age, sex or level of education (see Table 1).
Descriptive statistics and test for differences between the groups in sociodemographic variables.
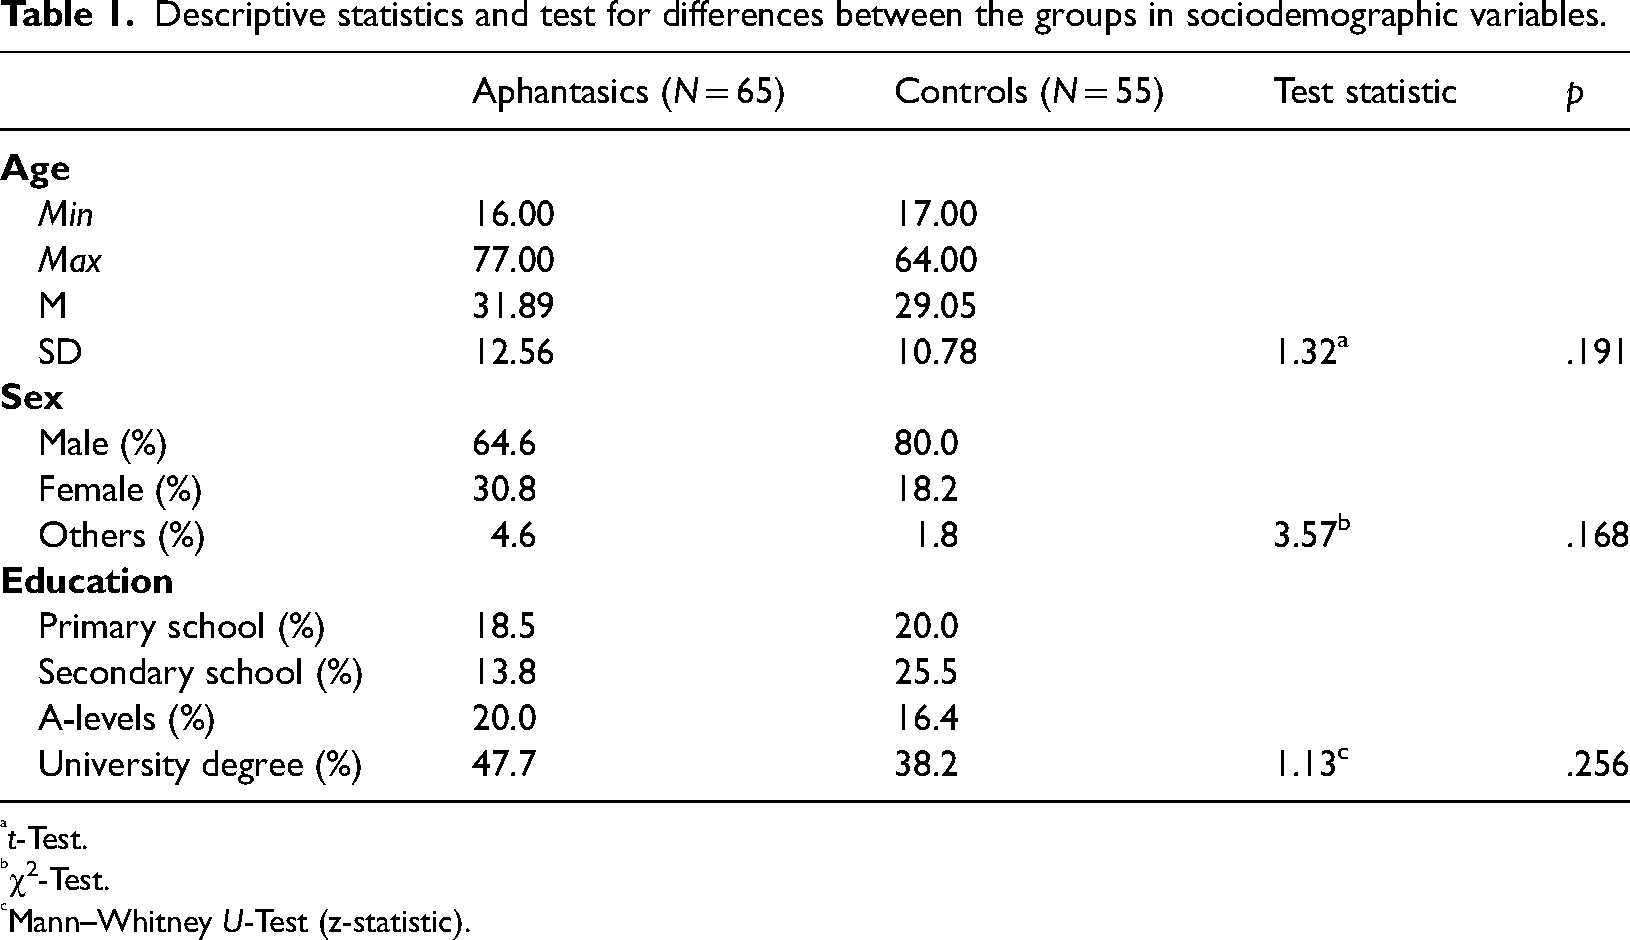
t-Test.
χ2-Test.
Mann–Whitney U-Test (z-statistic).
Measures
Vividness of visual imagery was assessed via the Vividness of Visual Imagery Questionnaire (VVIQ; Marks, 1973, 1995), a well-validated questionnaire (McKelvie, 1995) used to classify people with aphantasia in many studies before (e.g., Milton et al., 2020; Pounder et al., 2022; Zeman et al., 2020). The VVIQ consists of 16 situations which are to be visualised by the participants to assess the vividness of the mental images that arise on a 5-point Likert scale ranging from No image at all, you only ‘know’ that you are thinking of the object to Perfectly clear and as vivid as normal vision. Despite the limitations in the self-report of visual imagery due to limitations in introspection (Schwitzgebel, 2002), sufficiently high correlations between VVIQ and objective tasks measuring visual imagery (e.g., through priming effects of mental imagery on perception) have previously been demonstrated (Monzel, Keidel et al., 2021; Pearson et al., 2011; Rademaker & Pearson, 2012), justifying the use of the VVIQ as a reliable and valid instrument.
To assess face recognition, the CFMT (Duchaine & Nakayama, 2006) was used in combination with the CCMT (Dennett et al., 2012) as a control condition of object recognition with matched complexity. The implementation was strictly based on the information in the original papers (e.g., no time limit for responses, display of a review image for 20 s after each stage, etc.). Response times were acquired via keypress (1, 2 or 3). Items of both instruments are three-dimensional real-world objects which share the same first-order structure, that is, all faces and all cars share the same spatial relations among similar parts (e.g., the fixed relationships of eyes, nose and mouth or the fixed relationships of wheels, doors and headlights; see Diamond & Carey, 1986). Both tasks start with a study phase in which a target is presented in three different perspectives (1/3 left profile, 1/3 frontal view, 1/3 right profile) for three seconds each (see viewpoint-invariance, Wright & Barton, 2008). Hereafter, the test consists of three stages of increasing difficulty: the recognition of the targets embedded in identical images as already presented in the study phase (18 items, fixed order), the recognition of the targets embedded in novel images (see object constancy, Ellis et al., 1989) (30 items, fixed order) and the recognition of the targets embedded in novel images with noise (24 items, fixed order), thereby enabling the investigation of the role of stimulus complexity (for an example, see Figure 1). Moreover, prosopagnosic participants have already been investigated using the CFMT (e.g., Duchaine & Nakayama, 2006) and CCMT (e.g., Gray et al., 2019) providing values that can be compared with those obtained from people with aphantasia.
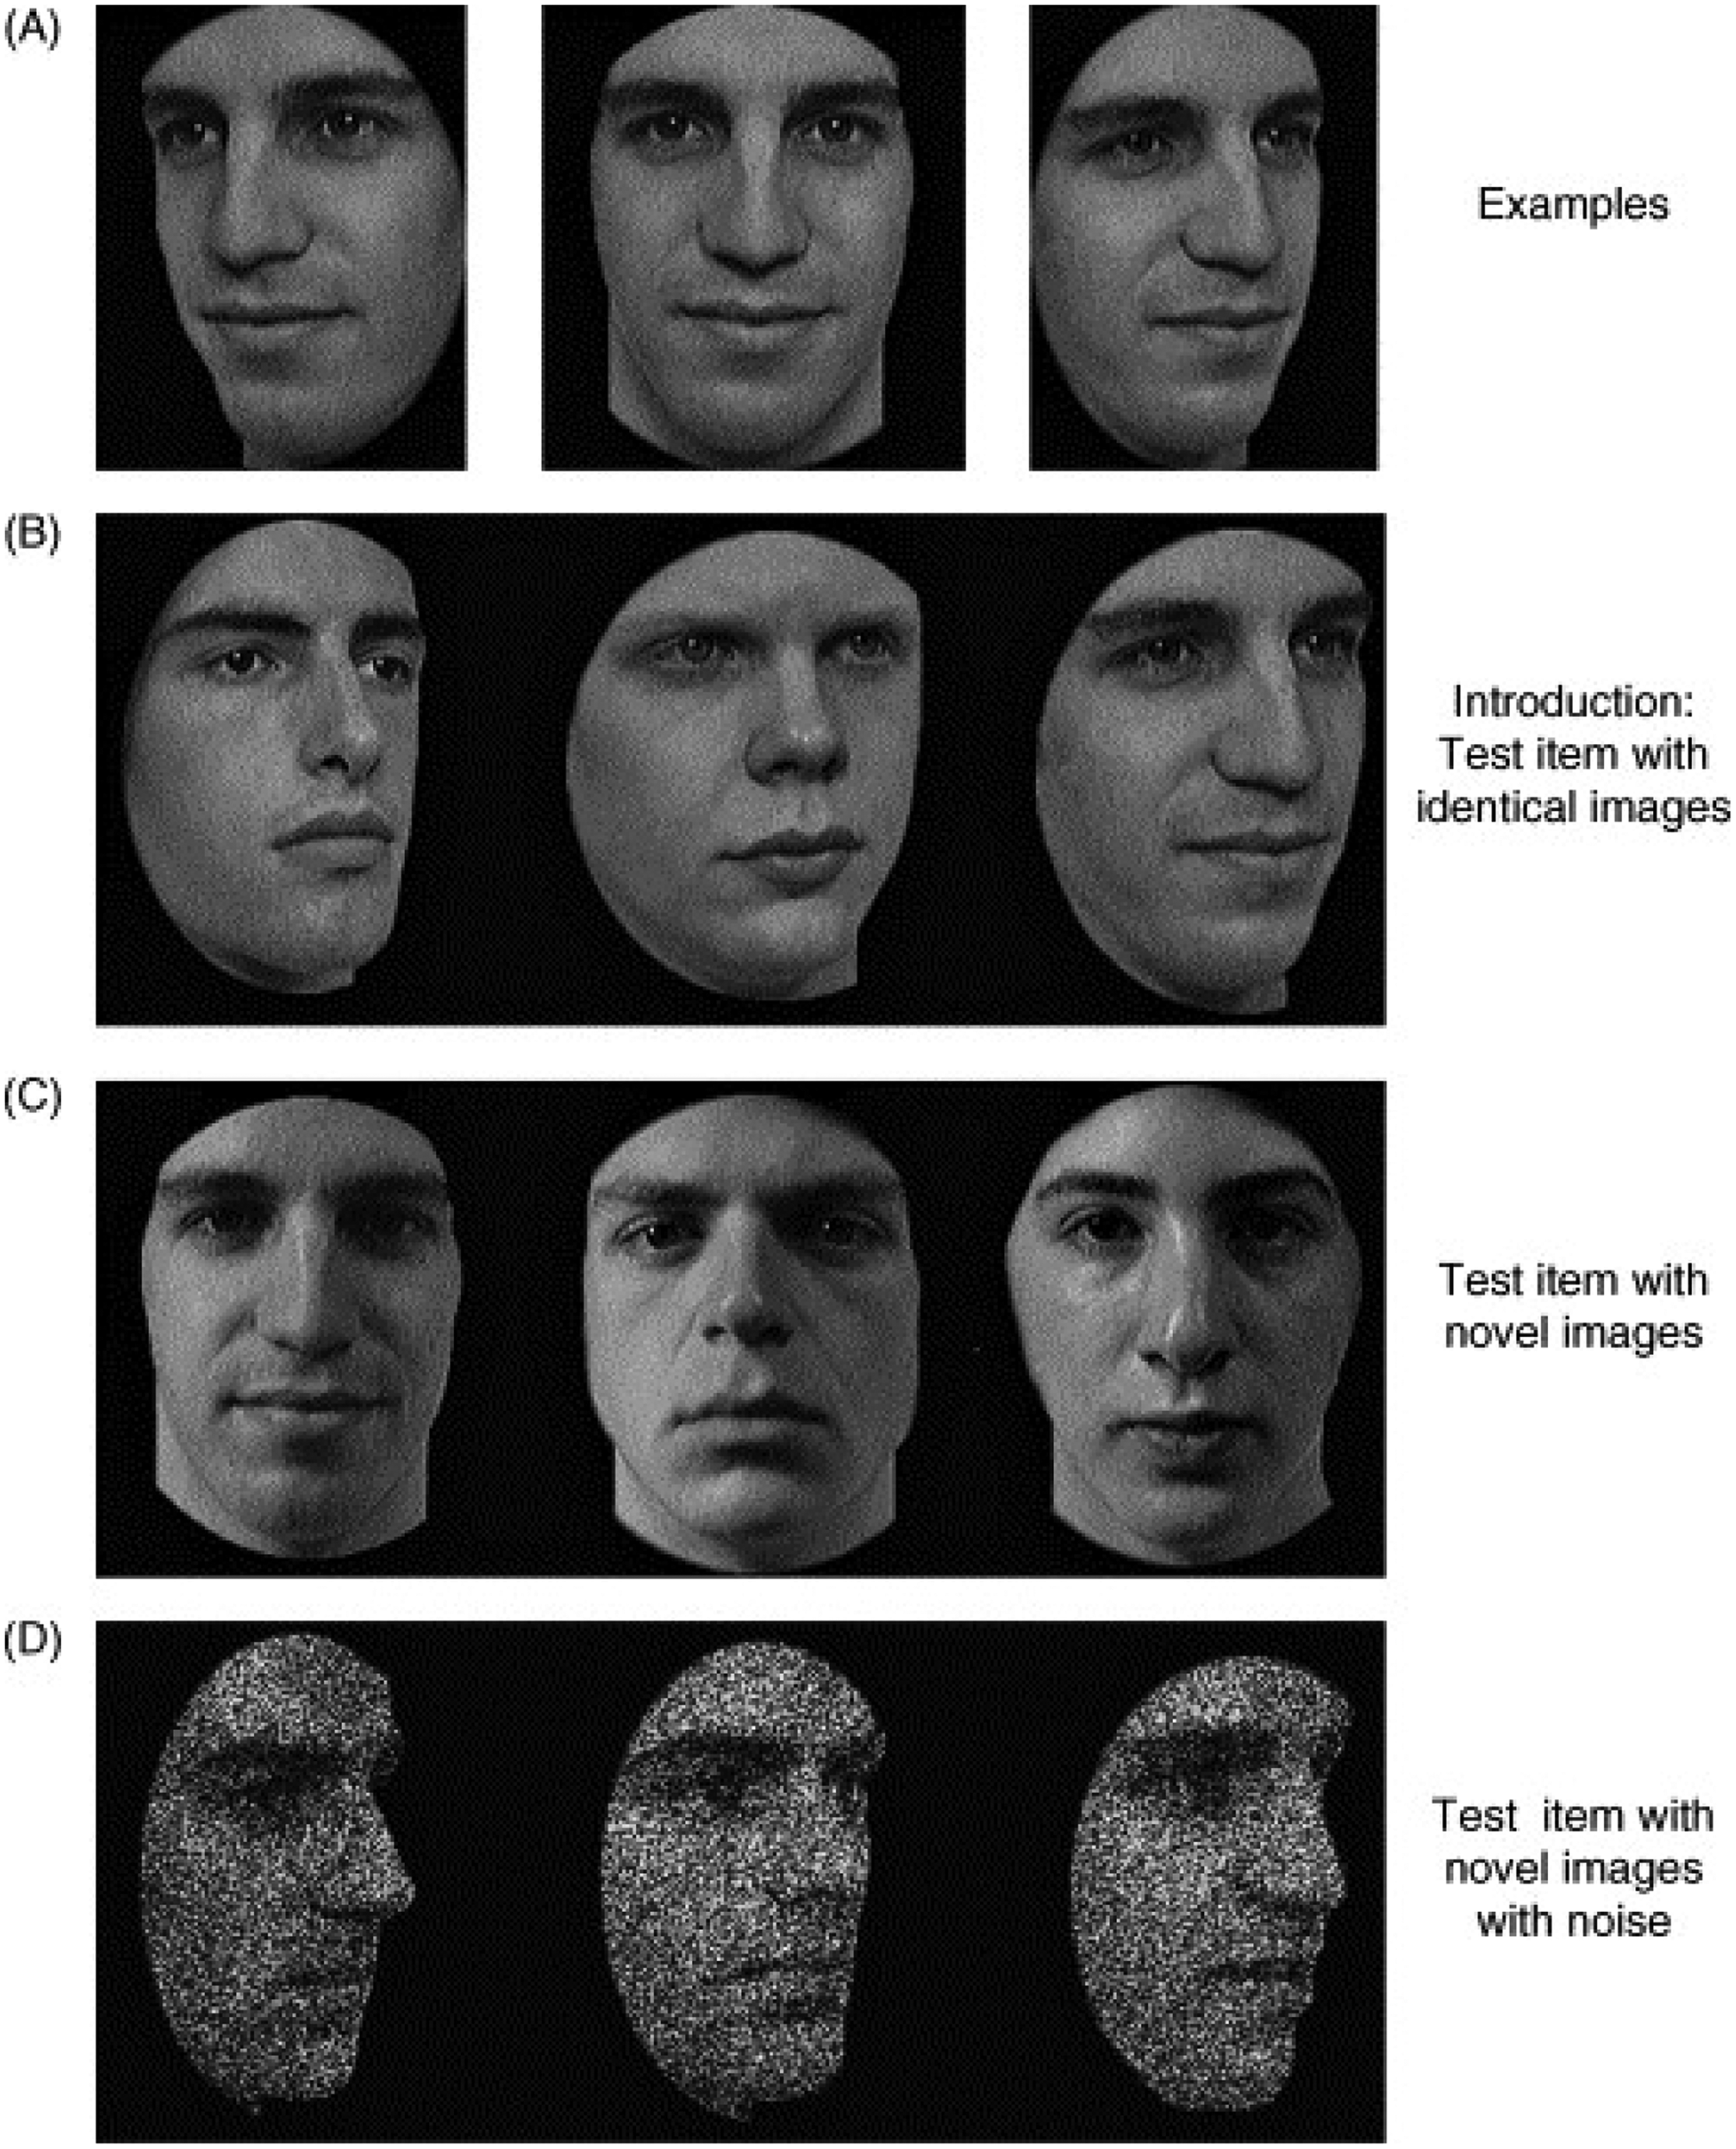
Example of test stimuli in the CFMT. (A) Study display. (B) Identical image from the target in the study display (face 3). (C) Novel image from the target in the study display (face 1). (D) Novel image with noise from the target in the study display (face 3). Reprinted with permission from Duchaine and Nakayama (2006). CCMT stimuli are accordingly.
Procedure
Both aphantasic and control participants were recruited via the imagery database of the Aphantasia Research Project (Monzel, Keidel et al., 2021), that was created to bypass the low prevalence of extreme imagery in the general population while keeping the approach channels to aphantasic and control participants the same. Data collection took place in the period from 26 August 2020 to 31 October 2021 using the online platform psytoolkit.org (Stoet, 2010, 2017). The platform is comparable to E-prime 3.0 in terms of reliability of response collection (Kim et al., 2019). Participants first answered the VVIQ before completing the CFMT and CCMT in a balanced order. In order to motivate the participants to achieve maximum performance, feedback on their own performance was promised and given at the end of the tasks.
Statistical Analyses
Performance in CFMT and CCMT was measured as percentage of correct answers. Since the CFMT and CCMT were administered online, reliabilities were analysed before testing our hypotheses to ensure that both tasks worked without laboratory control. Furthermore, to improve comparability with previous works (e.g., Bennetts et al., 2017; Bowles et al., 2009; Duchaine & Nakayama, 2006), correlations between test stages were analysed. Hereafter, the performance in CFMT and CCMT was analysed via 2 × 2 ANOVA with group membership (aphantasic vs. control) as between-subject factor and task (CFMT vs. CCMT) as within-subject factor. Additionally, to avoid nebulous results due to arbitrary vividness cut-offs in the VVIQ, we analysed the relationship between the whole vividness spectrum and performance in the CFMT and CCMT via correlations and tested for potential difference in the sizes of the correlation coefficients via correlation comparisons. For these analyses, the 16 participants in the interim group were included. Moreover, an ANCOVA with the CCMT accuracy as covariate was conducted to calculate the remaining differences of CFMT accuracy after partializing out object recognition ability (see Dennett et al., 2012). Partial correlations with the VVIQ were conducted to investigate the same for the whole imagery spectrum. Moreover, reaction times across all trials were analysed via 2 × 2 ANOVA and additional correlations to exclude the possibility of a trade-off between task accuracy and speed (but not as an additional measure for recognition performance, since participants were not instructed to respond as fast as possible). Since each response time lead to a specific accuracy, we initially did not trim reaction time data. However, to ensure stability of the effects, we repeated the analyses with the exclusion of outliers beyond 3 standard deviations from group mean. The group mean was chosen as we expected performance differences between people with aphantasia and controls, which could also lead to systematic differences in reaction times. Finally, a 2 × 2 × 3 ANOVA was calculated with item difficulty as an additional within-subject factor to test for the influence of item difficulty on face and object recognition in people with aphantasia and controls. For the whole imagery spectrum, two HLMs (unstructured) were calculated with the VVIQ as first level predictor, item difficulties as second level predictor and the CFMT and CCMT scores as criteria. Afterwards, chi-square tests were used to examine prevalence differences of prosopagnosia and object agnosia in people with aphantasia and controls.
Results
Reliability
The results of the reliability analyses demonstrated excellent internal consistencies for the CFMT (α = 0.90) and the CCMT (α = 0.84) as well as for the VVIQ (α = 0.99). The internal consistencies for the individual test stages in the CFMT and CCMT, their intercorrelations and the upper bounds of those intercorrelations are depicted in Table 2. The internal consistencies for the individual test stages were as high or even higher than in previous research (e.g., Dennett et al., 2012), providing sufficient reliability for our analyses. Furthermore, as in Dennett et al. (2012), the relationship between the stages 2 and 3 were nearly at the upper bound within their respective test, arguing that both stages measure essentially the same. The relationships to stage 1 were strong enough to argue for overlapping processes with the restriction that for stage 1 no mental transformations were necessary (e.g., rotating the images or decoding the noise).
Internal consistencies for the test stages of the CFMT and CCMT, their intercorrelations as well as their upper bound correlations (N = 136).
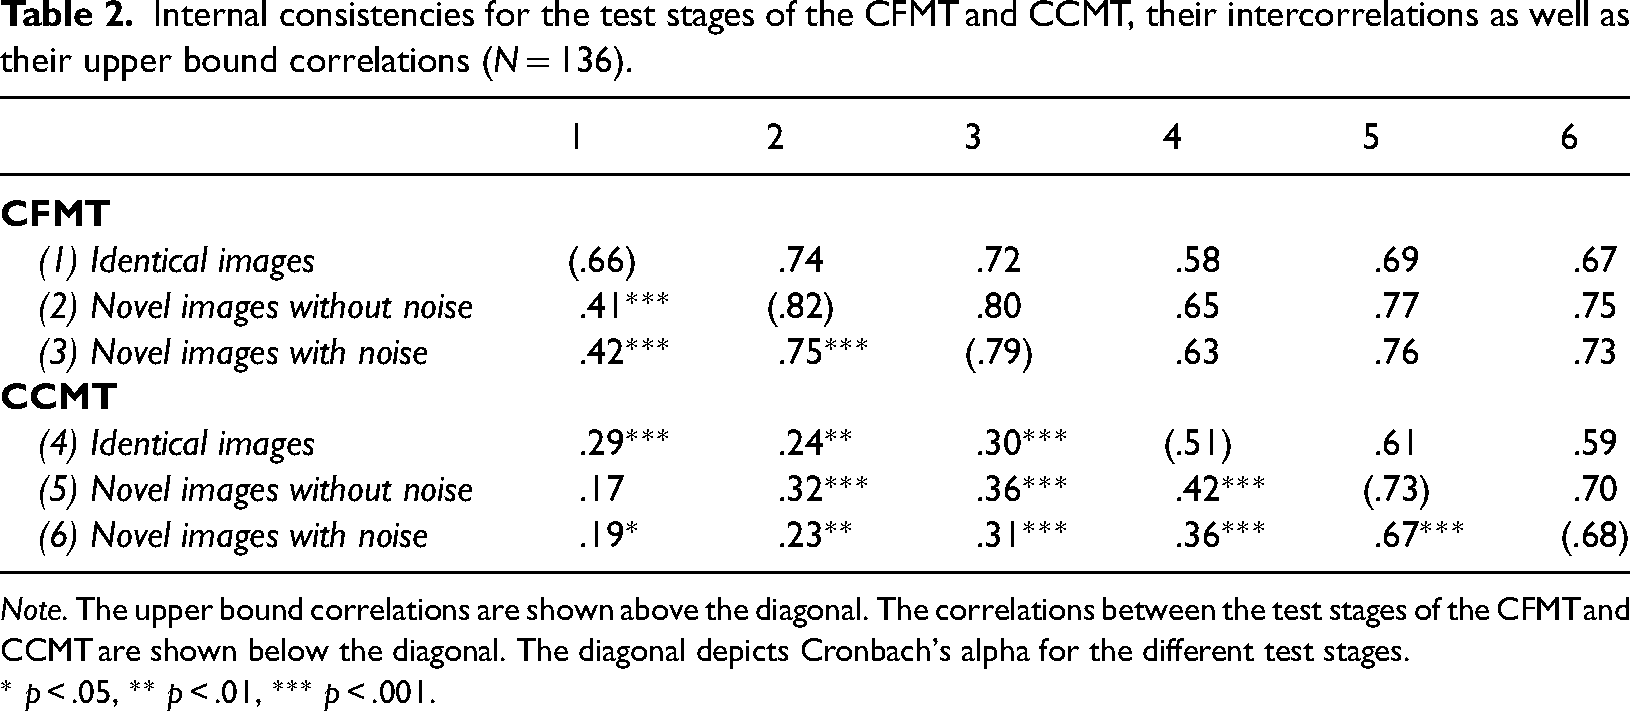
Note. The upper bound correlations are shown above the diagonal. The correlations between the test stages of the CFMT and CCMT are shown below the diagonal. The diagonal depicts Cronbach's alpha for the different test stages.
* p < .05, ** p < .01, *** p < .001.
Task Performances
The 2 × 2 ANOVA revealed a significant main effect of group, F(1, 118) = 4.47, p = .037, η2 = 0.04, but no main effect of task, F(1, 118) = 0.33, p = .568, or interaction effect between group and task, F(1, 118) < 0.01, p = .975. 2 People with aphantasia scored lower on the CFMT and CCMT than controls. Means and standard errors per condition are depicted in Figure 2a. Correlations between the VVIQ and scores in the CFMT, r(134) = .24, p = .005, and CCMT, r(134) = .18, p = .033, were also significant (see Figure 2b). The correlations did not differ significantly, z = 0.63, p = .264. When analysing the differences between people with aphantasia and controls in the CFMT using an ANCOVA with CCMT accuracy as covariate, no differences were found between groups, F(1, 117) = 1.07, p = .302, although the accuracies of the CFMT and CCMT were only correlated moderately, r(134) = .38, p < .001. The same intercorrelation was also mentioned in the original publication by Dennett et al. (2012). However, when calculating the correlation between VVIQ and CFMT accuracy after partializing out the CCMT accuracy, a significant effect remained, r(133) = .19, p = .028. Conversely, when partializing out the CFMT accuracy in the calculation of the VVIQ-CCMT-correlation, no effect remained, r(133) = .10, p = .246.
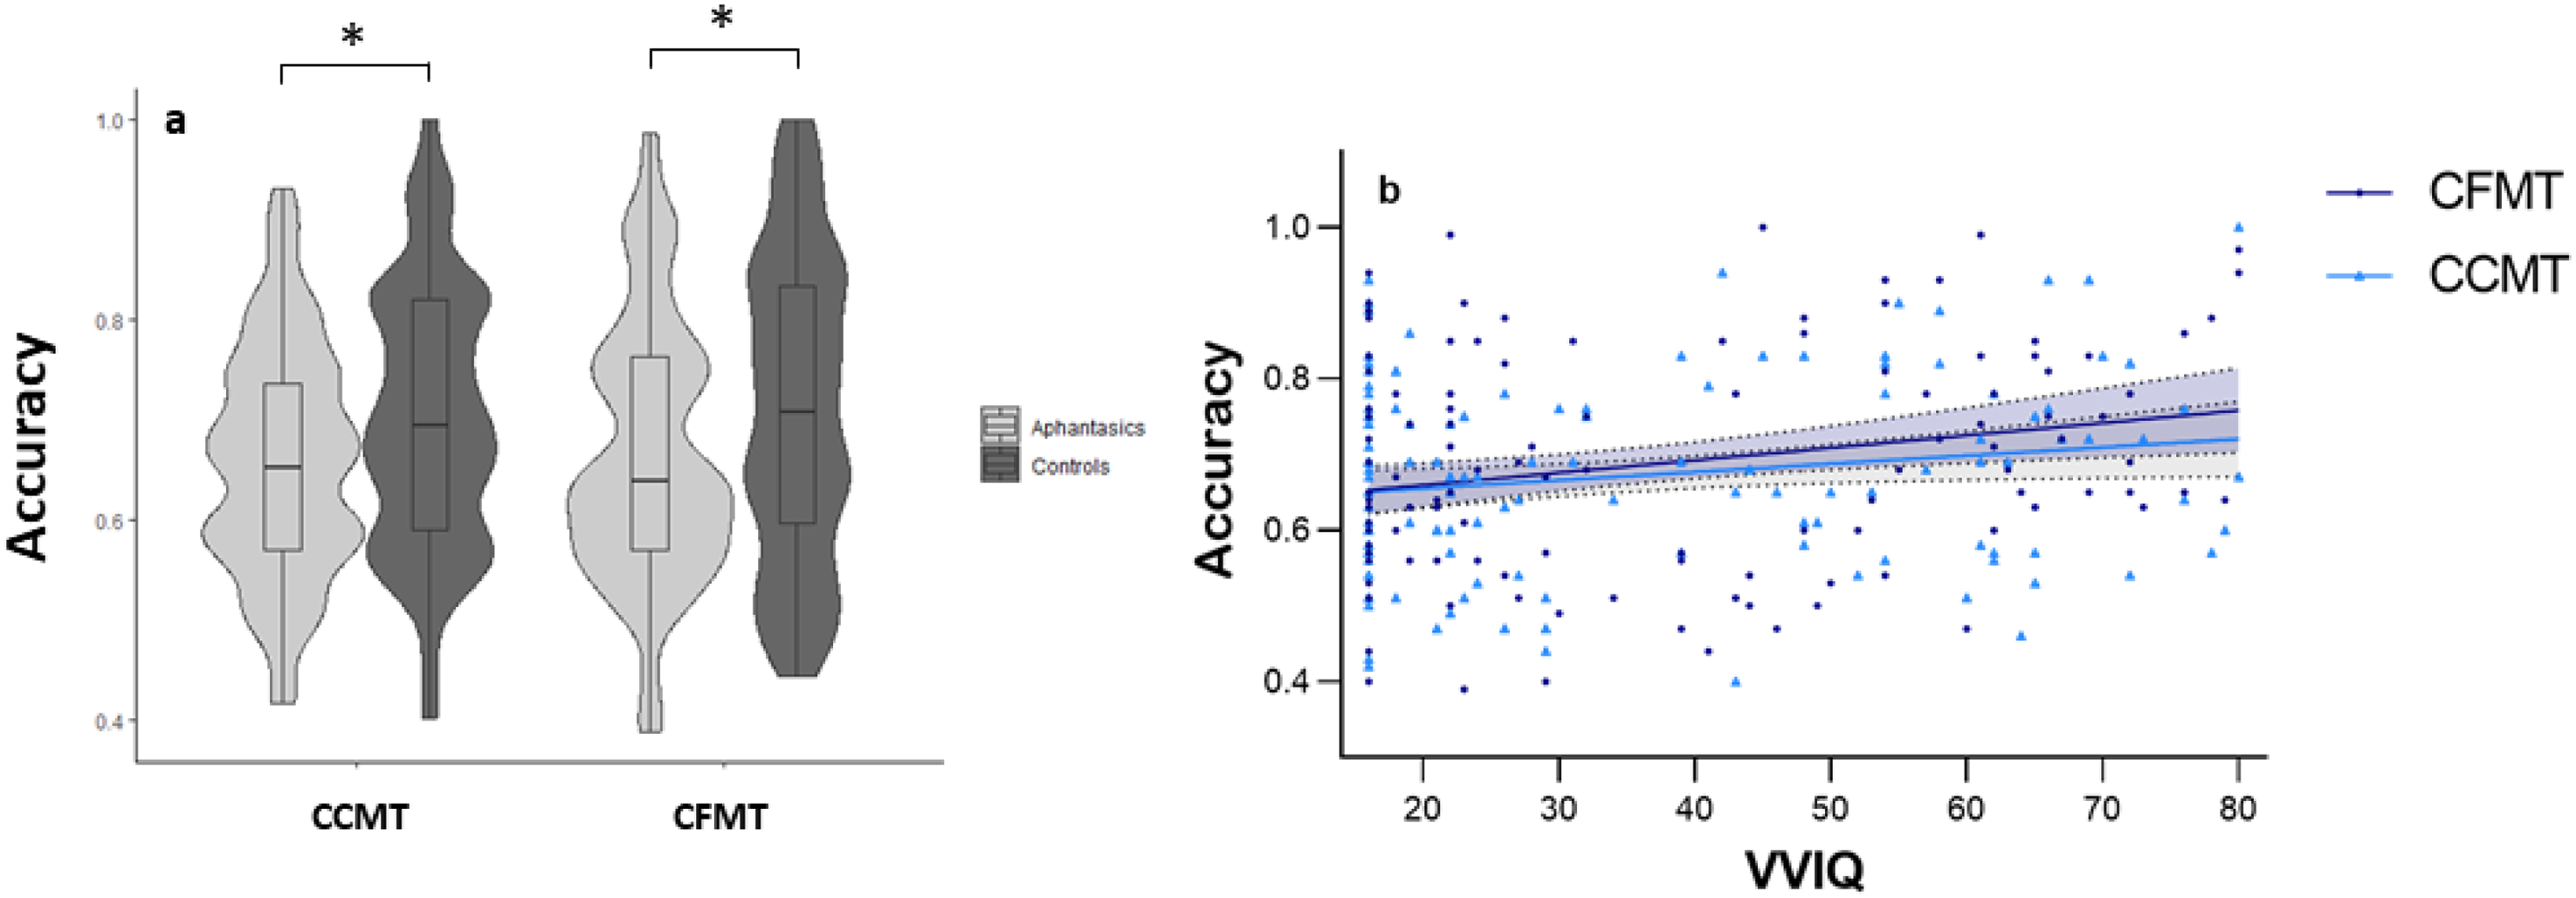
Relationship between visual imagery and visual recognition accuracy. Depicted are means ± 1 SEM. (a) Group differences: In comparison to controls, people with aphantasia perform worse in the Cambridge Face Memory Test (CFMT) and in the Cambridge Car Memory Test. (b) Continuum: The higher the vividness of visual imagery in the Vividness of Visual Imagery Questionnaire (VVIQ) the higher the visual recognition accuracy. No performance differences between CFMT and CCMT. * p < .05.
An examination of the reaction times showed no main effect of group, F(1, 118) = 2.62, p = .108, or group × task interaction, F(1, 118) = 1.64, p = .203. However, a main effect of task was significant, F(1, 118) = 58.60, p < .001, η2 = 0.33. Participants were slower in the CCMT (M = 4792 ms, SD = 1618 ms) than in the CFMT (M = 3879 ms, SD = 1271 ms). Correlations between accuracy and reaction times were not significant in the CFMT, r(134) = –.02, p = .818, but in the CCMT, r(134) = .21, p = .013. The reanalyses of the reaction time data after outlier exclusion (1 participant with aphantasia, 2 controls) lead to the same inferential results with slightly shorter and less deviating reaction times for the CCMT (M = 4659 ms, SD = 1375 ms) and the CFMT (M = 3776 ms, SD = 1094 ms).
Effects of Item Difficulty
Besides the main effect of the group already shown, the 2 × 2 × 3 ANOVA revealed a significant main effect of item difficulty, F(1.84, 217.52) = 567.36, p < .001, η2 = 0.83 as well as an interaction effect between task and item difficulty, F(1.91, 225.11) = 57.01, p < .001, η2 = 0.33. The three-way interaction effect was not significant, F(1.91, 225.11) = 2.33, p = .102. Means and standard errors per condition are depicted in Figure 3a. A linear contrast of the mean recognition accuracy was significant, F(1, 118) = 774.86, p < .001, η2 = 0.87.
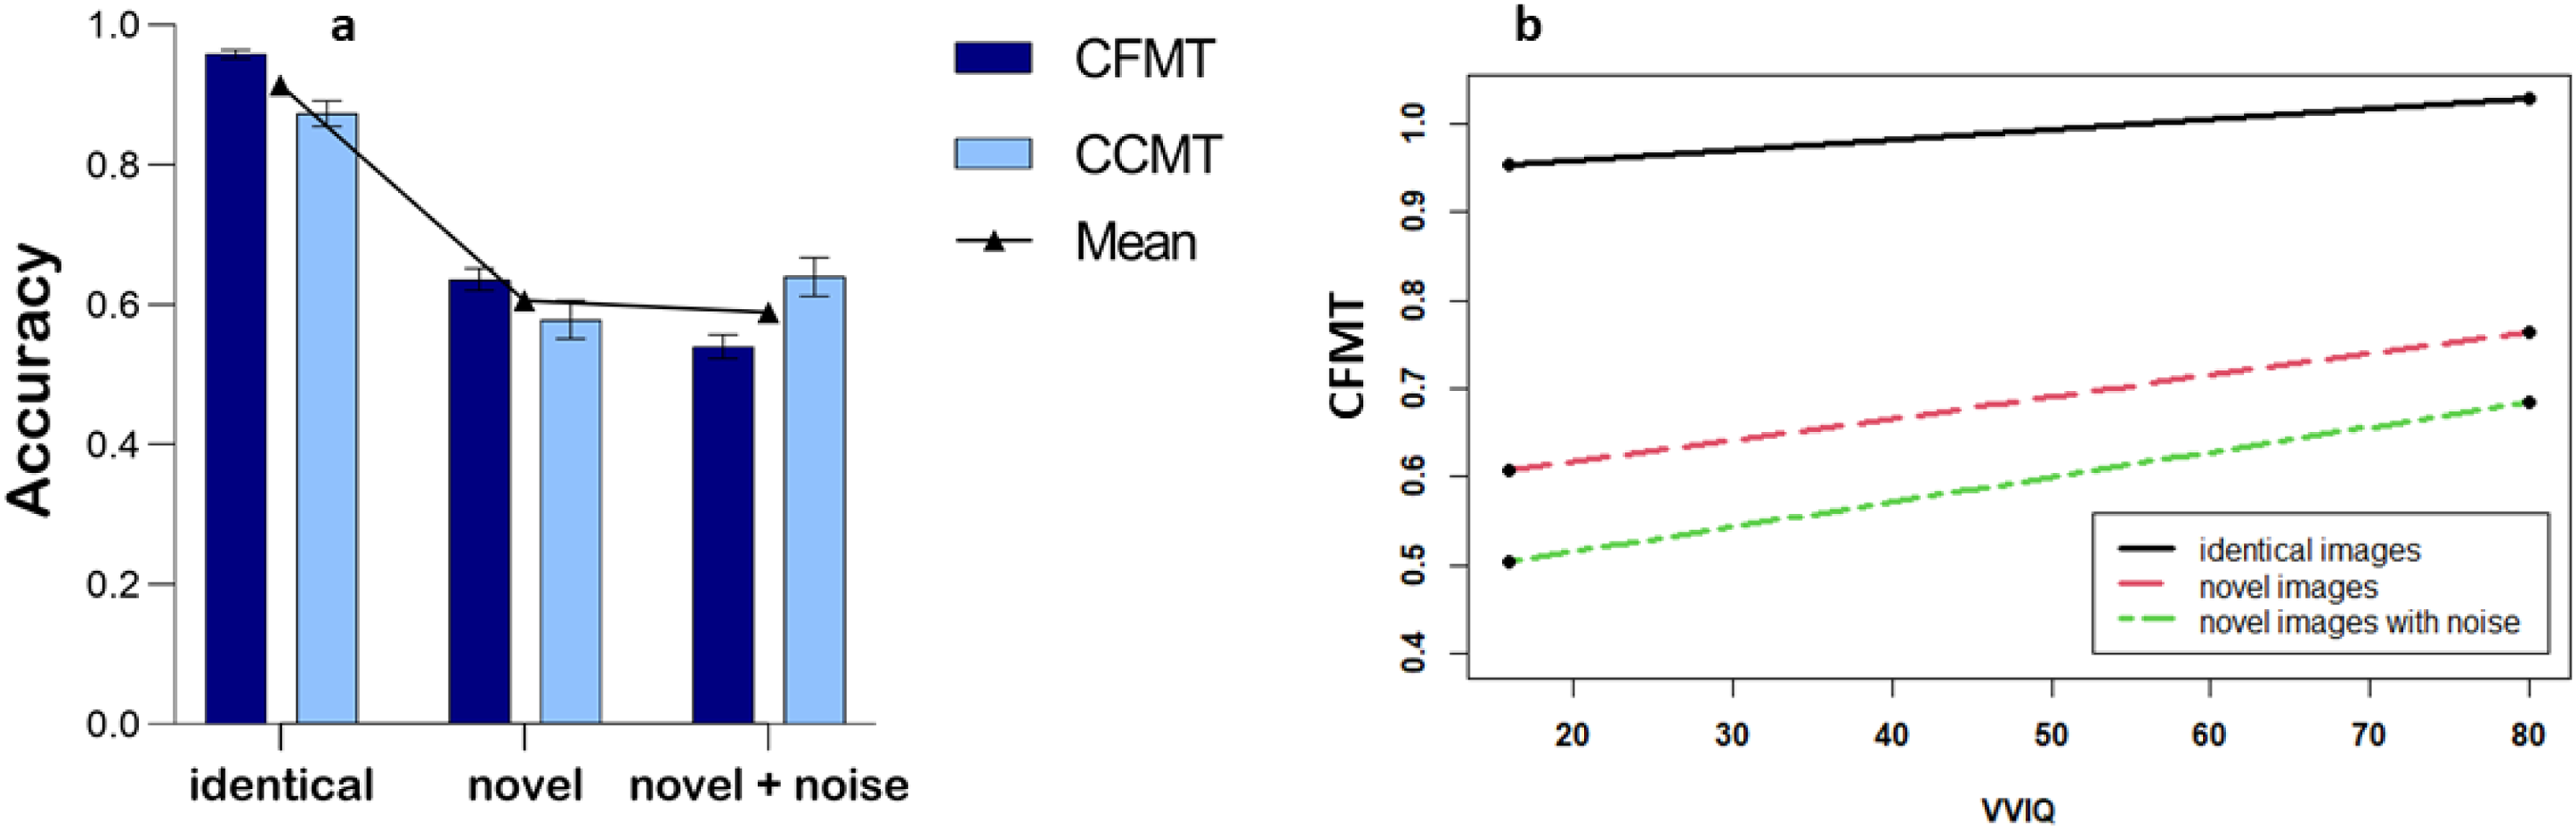
Effects of item difficulty. (a) Group differences: Recognition accuracy in the identical items, novel items without noise and novel items with noise in the Cambridge Face Memory Test (CFMT) and Cambridge Car Memory Test. Depicted are means ± 1 SEM. (b) Continuum: Simple slopes for identical items, novel items without noise and novel items with noise for the association between vividness of visual imagery and CFMT recognition accuracy.
Regarding the whole imagery spectrum, the HLM for the CFMT showed significant main effects for the VVIQ, β = 0.141, t(134.01) = 3.13, p = .002, and item difficulty, β = 0.744, t(134.01) = 28.01, p = .007, as well as a cross-level interaction effect between VVIQ and item difficulty, β = −0.063, t(134.01) = 2.36, p = .020. The simple slopes for identical images, β = 0.001, t(137.03) = 0.77, p = .447, novel images, β = 0.003, t(137.03) = 1.71, p = .091, and novel images with noise, β = 0.003, t(137.03) = 1.94, p = .056, are depicted in Figure 3b. It was estimated that the simple slopes between VVIQ and CFMT would reach significance for item difficulties below 0.52 (see Figure 4). For the CCMT, only the main effect of VVIQ, β = 0.125, t(134.00) = 2.43, p = .016, and the main effect of item difficulty, β = 0.657, t(134.00) = 22.86, p < .001, were significant, but not the cross-level interaction between VVIQ and item difficulty, β = 0.012, t(134.00) = 0.43, p = .670.
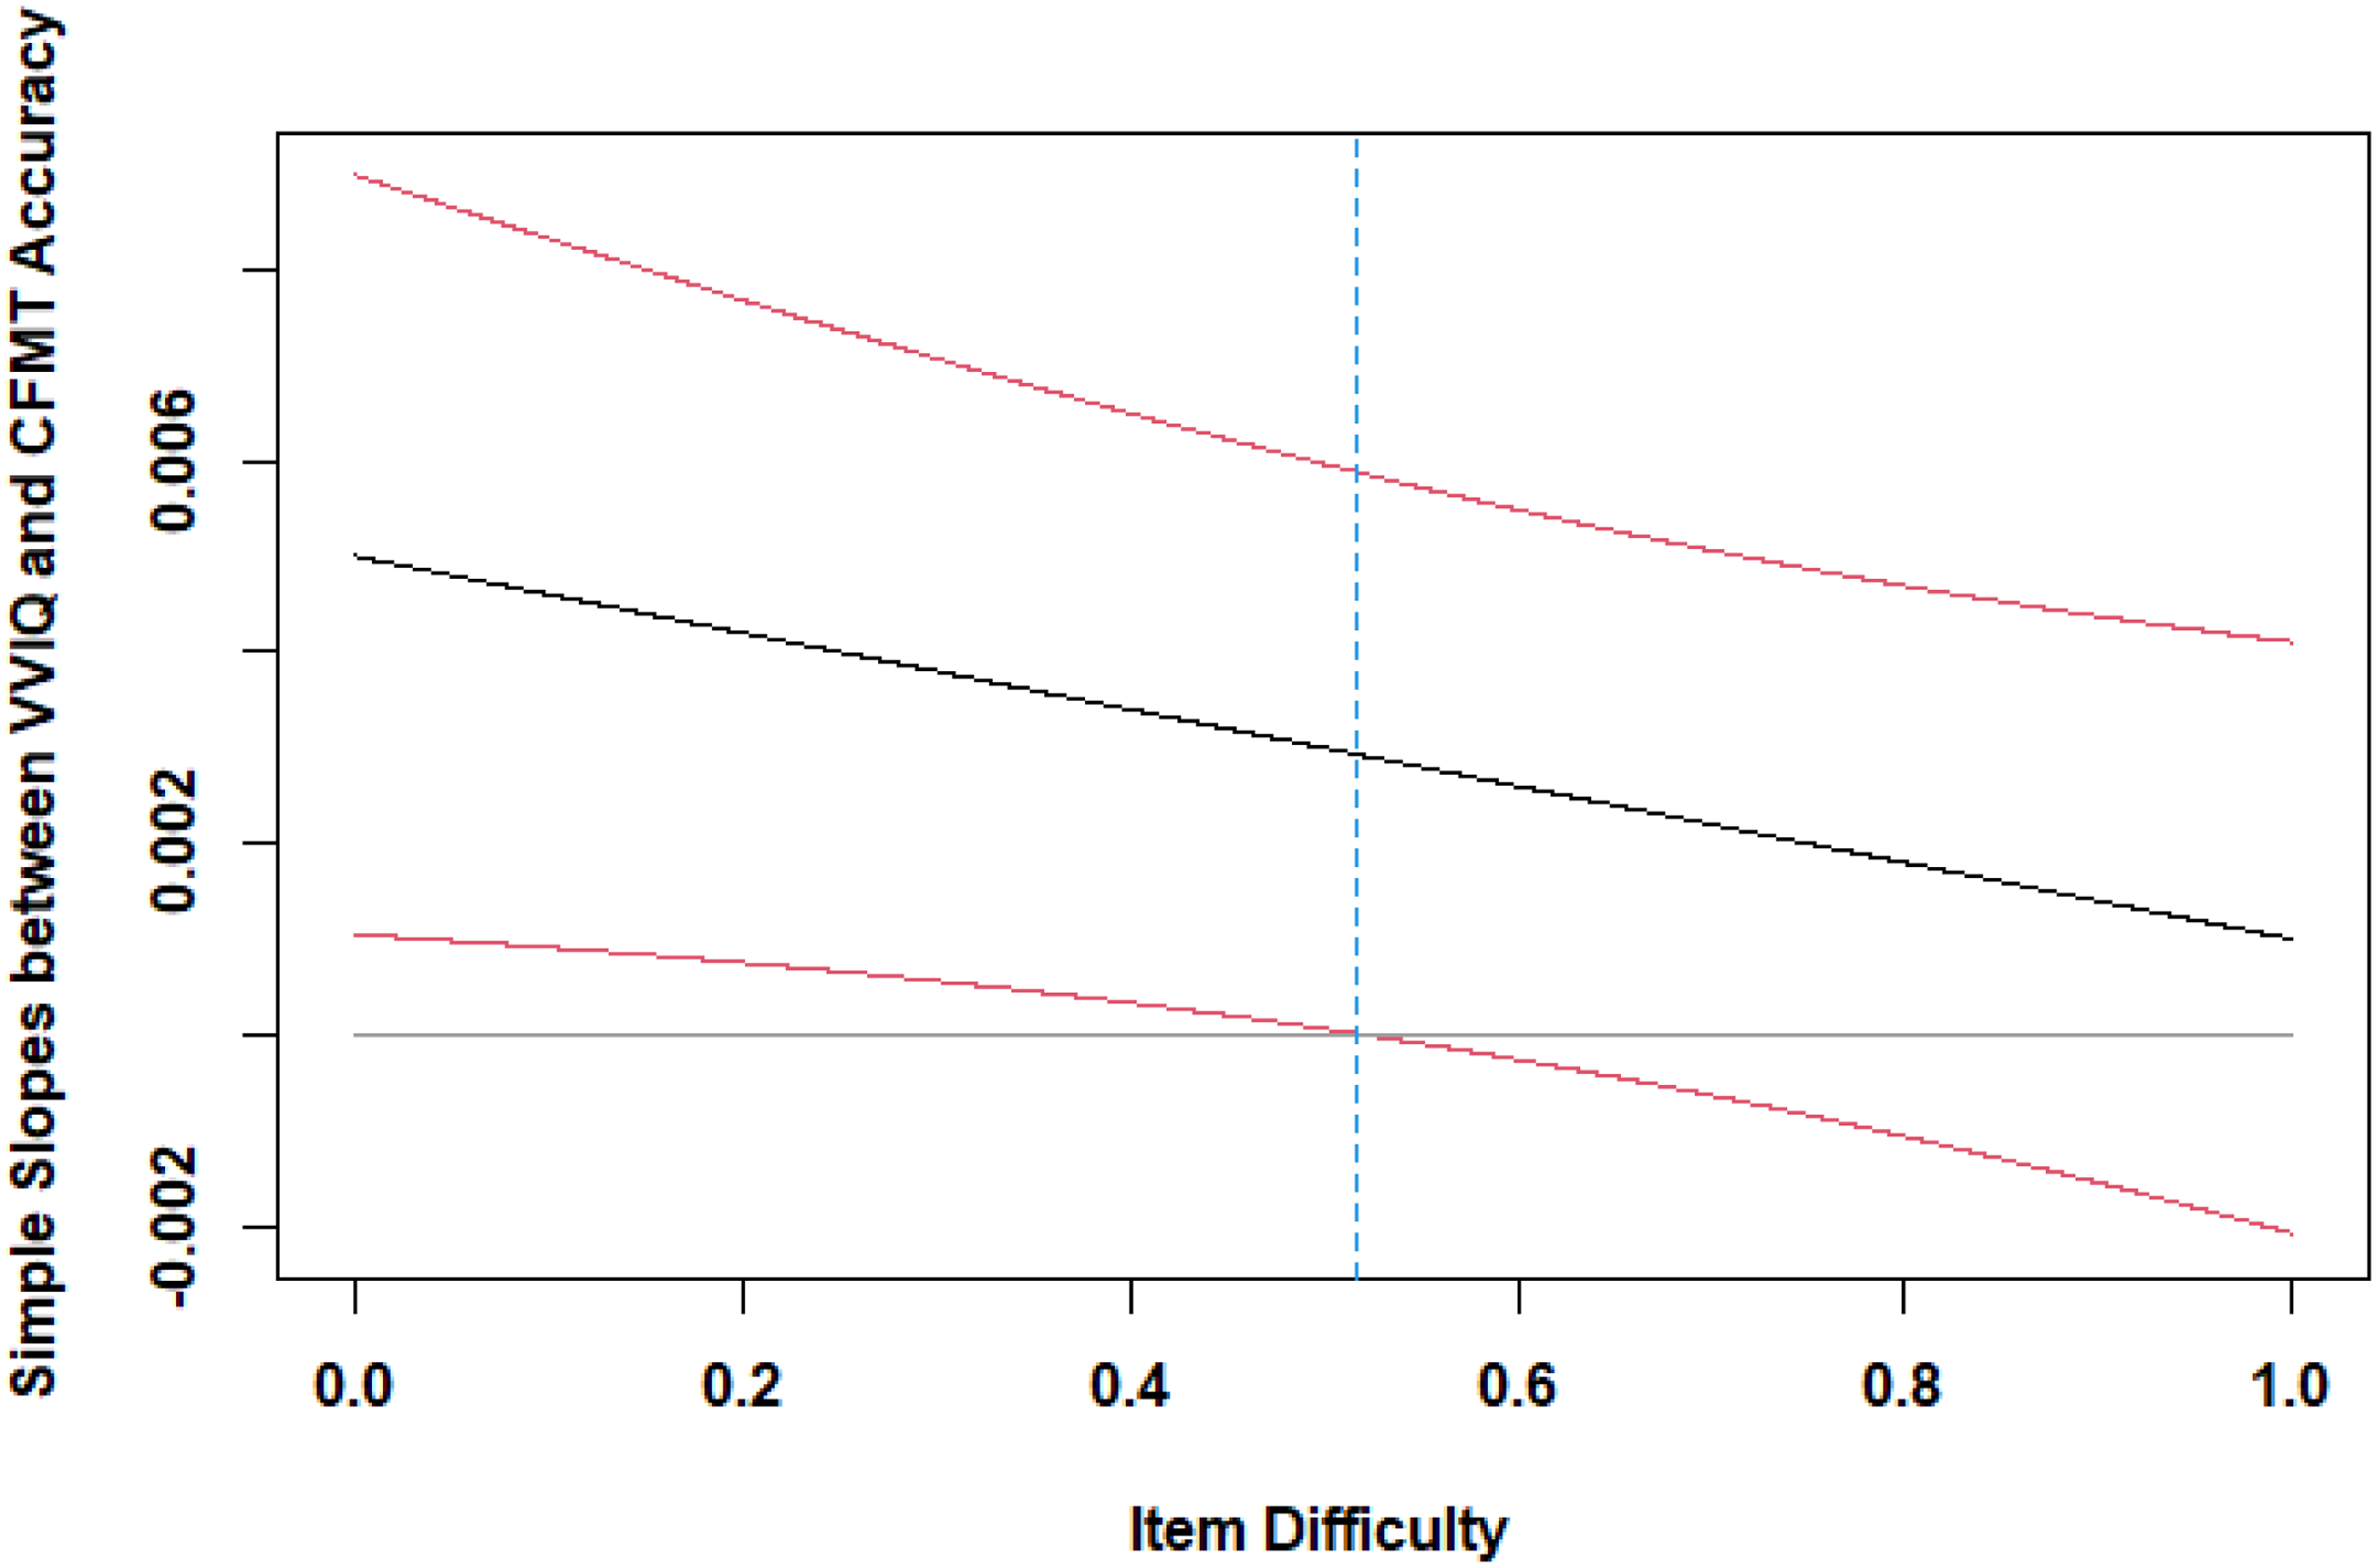
Confidence bands of item difficulty. Simple slopes between VVIQ and CFMT are significant for item difficulties below 0.52.
Prevalence of Prosopagnosia
As suggested by Duchaine and Nakayama (2006), participants are classified as having prosopagnosia if they score worse than 2 standard deviations below the average of the control group. Since our control group performed worse than the control group in the original sample (M = 80.4%, SD = 11.0%), z = 3.02, p = .001, most likely due to the online design, we decided to determine our individual case statistics by comparing the performance of our individual cases with a 2 standard deviation cut-off obtained from our own control group (cut-off = 71% − 2 × 15.3% = 40.4%). In this way, 2 out of 65 participants with aphantasia (3.0%) and 0 out of 55 controls (0%) were classified as having prosopagnosia. The difference in the distribution was not significant, χ2(1) = 1.72, p = .499. For the CCMT, 2 out of 65 participants with aphantasia (3.0%) and 1 out of 55 controls (1.8%) fell below the 2 standard deviation cut-off of 43.6% (cut-off = 70.2% − 2 × 13.3%). The distributions between the groups did not differ significantly, χ2(1) = 0.19, p > .999.
Discussion
As shown by the main effect of group and the missing interaction effect between group and task, people with aphantasia perform worse in both the CFMT and the CCMT, leading to the conclusion that they show a recognition deficit that is not specific for face stimuli. When partializing out object recognition accuracy, the differences in face recognition accuracy between people with aphantasia and controls disappeared, supporting our conclusion that no selective impairment of face recognition occurs in aphantasia. Furthermore, as inferred from the correlations, the effect of mental imagery is transferable to the whole spectrum of imagery vividness. The more vivid the mental imagery, the better the performance in CCFT and CCMT. Interestingly, however, on the whole spectrum an effect of imagery vividness on face recognition remained even after controlling for object recognition abilities measured via the CCMT (but not vice versa). Additional analyses regarding the reaction times showed no differences between people with aphantasia and controls, eliminating the possibility of a trade-off between task accuracy and speed in the extreme groups, while a positive correlation was found at least for the CCMT in the whole spectrum (leading to the limitation that at least in the CCMT a more prolonged thought process may have led to better results in people with higher imagery vividness). Besides, participants were generally slower in the CCMT, which could indicate that faces are processed more automatically than cars due to their higher evolutionary relevance (for a recent review about the adaptive value of face perception, see Behrmann & Avidan, 2022).
Further analyses showed that item difficulty did not moderate recognition deficits in the extreme groups, although a manipulation check showed differing difficulties between the stages of the CFMT and CCMT. In the whole imagery group, however, a cross-level interaction between vividness of visual imagery and item difficulty was significant in the CFMT, even though the simple slopes just missed significance. Nevertheless, the confidence bands suggest higher associations for visual imagery vividness and face recognition in even more difficult face recognition tasks. On the other hand, no moderation effect was found for the CCMT, suggesting no advantages for visual imagery for more difficult car items. Again, this could possibly be explained by the lower evolutionary relevance of the cars than faces, which prevents even high imagers from producing detailed mental images of noisy cars. Moreover, visual noise increases the reliance on configural processing, which is especially beneficial for faces than other objects (Corrow et al., 2018), and which also benefits people with visual imagery (Kozhevnikov et al., 2005). 3
Regarding the three alternative models, the general recognition deficit model should be accepted since the majority of our results indicates that people with aphantasia show general impairments in recognition, rather than selective impairments in face recognition. Even the higher relevance for face stimuli in the most difficult trials of the CFMT might not be relevant in real-world interactions, as most situations allow for better face observation than the conditions of stage 3 in the CFMT. Considering that general visual agnosia should be an exclusion criterion for prosopagnosia (Corrow et al., 2016), our findings argue against the occurrence of prosopagnosia in aphantasia. Moreover, within our sample, only 3% of aphantasics were below the clinical cut-off for prosopagnosia, which did not differ from controls. However, direct comparisons between people with prosopagnosia and people with aphantasia should be planned in the future, since it is still possible that congenital prosopagnosia and congenital aphantasia are symptoms of the same “multifaceted hereditary cerebral dysfunction” (p. 5), as proposed by Grüter et al. (2009), that leads to difficulties in face recognition and object recognition as well.
Overall, a general visual recognition deficit seems plausible in people with aphantasia, as they do not selectively lack visual imagery for faces (Zeman et al., 2015). This visual recognition deficit might best be explained by missing visual representations that are either compared with bottom-up information in top-down facilitation models (Bar, 2003) or created from bottom-up information in bottom-up hierarchical recognition models (DiCarlo & Cox, 2007) to enable viewpoint transformations for viewpoint-invariance (Wright & Barton, 2008). Either way, top-down and bottom-up information seem to use the same neural pathways (see Reverse Hierarchy Modell, Pearson, 2019), so an overlap between mental imagery and recognition is not unlikely. However, in contrast to the extreme group results, the analyses regarding the whole imagery continuum suggest an impairment in face recognition beyond the recognition of objects (i.e., after partializing out object recognition), especially when looking at the more difficult trials. This might be evidence for a task-spanning interaction effect between stimulus complexity and stimulus content due to the benefits of visual imagery strategies for the configural processing of noisy faces that is not present in the CCMT.
Implications
Leaving the grounds of extreme imagery, our results suggest that visual imagery may play an important role in visual recognition. While the lack of visual imagery may be compensable by non-visual strategies (see retained object recognition in image generation deficits, Farah, 1984), these alternative strategies seem more likely to fail the more difficult the tests are (Jacobs et al., 2018; Monzel, Vetterlein et al., 2021). Thus, in very difficult tasks, recognition in comparison to free recall seems sufficient to examine memory deficits in aphantasia (see Monzel, Vetterlein et al., 2021). In conclusion, visual imagery does not appear to be necessary nor sufficient for recognition memory (see Roldan, 2017), but is still able to enhance it.
Limitations
Some limitations are worth mentioning. First, the range of item difficulty in the CFMT and CCMT was too limited to actually test our moderation hypothesis regarding the role of item difficulty, that is, even our easiest condition was more difficult than many tasks used in previous studies that did not produce any differences. Further studies will be necessary to effectively test this moderation hypothesis. Additionally, there is a difference between item difficulty and stimulus complexity. While stimulus complexity also increases the difficulty of the task, the reverse conclusion is not permissible. However, an increase of item difficulty in contrast to stimuli complexity might normally be sufficient (Jacobs et al., 2018; see Monzel, Vetterlein et al., 2021). Second, the performance in CCMT is known to be substantially dependent on sex (Dennett et al., 2012), leading to a performance advantage for men. However, since both groups, people with aphantasia and controls, showed the same sex distribution, this should have not influenced our results. Related to this point, the CCMT only examines car recognition ability, which, strictly speaking, cannot be equated with general object recognition capability. However, due to the similar first-order structure (Diamond & Carey, 1986) and the CFMT-matched design, it is the closest approximation to an object recognition test of similar complexity. Besides, it is not obvious why people with aphantasia should have less expertise with cars than controls. Third, no non-visual recognition control task was used to control for effects of aphantasia independent of visual target modality (e.g., attentional or motivational effects). However, the aim of the study was not to show the exact mechanism why recognition ability in aphantasia might be impaired but to show that the previous focus on face recognition impairments in aphantasia (e.g., Keogh et al., 2021; Milton et al., 2020; Zeman et al., 2020) might be too short-sighted, leading us to control for non-facial recognition ability instead of non-visual recognition ability. Forth, visual imagery was only assessed via self-report questionnaire, rising questions about its validity (see Zeman et al., 2020, for a more extended discussion). However, convergent correlations were found between VVIQ and objective measures of visual imagery in the past (e.g., Monzel, Keidel et al., 2021; Pearson et al., 2011; Rademaker & Pearson, 2012), confirming its usefulness in the investigation of imagery extremes. Lastly, it could be criticised that the study was conducted online, thereby rendering the results more prone to error variance than the original task. However, a control group with visual imagery in the normal range was assessed to ensure comparisons within the same study design. Moreover, in the past, modified versions of the CFMT and CCMT were successfully conducted via internet multiple times (e.g., Bate, Bennetts, Hasshim et al., 2019; Germine et al., 2011).
Conclusion
The CFMT is a widely used instrument for assessing face recognition in people with prosopagnosia and other clinical and non-clinical groups as indicated by over 800 citations of the original publication (Duchaine & Nakayama, 2006). Nevertheless, our group was the first to apply the test to a group of people with aphantasia in order to investigate the role of visual imagery in face recognition. Although a reduction in recognition performance was found in people with aphantasia (as well as along the whole visual imagery spectrum: the less vivid the visual imagery, the worse the face recognition performance), this reduction was neither severe enough nor selective for faces to be classified as prosopagnosia. Further investigation on the mechanisms of visual imagery influencing object and face recognition (e.g., its role in top-down facilitation, see Bar, 2003, or its role in creating transformable visual representations to explain viewpoint-invariance, see Bruce & Young, 1986) will be required in the future to understand its exact contributions to general and selective recognition deficits.
Footnotes
Acknowledgements
The authors are thankful to Jürgen Kaufmann from the University of Jena, Germany, for providing the PsyToolkit scripts and stimuli for the CFMT und CCMT. They also thank Brad Duchaine and Ken Nakayama for the permission to reprint example material of the CFMT.
Author contribution(s)
Open Practice Statement
Declaration of Conflicting Interests
The authors declared no potential conflicts of interest with respect to the research, authorship, and/or publication of this article.
Funding
The authors received no financial support for the research, authorship, and/or publication of this article.