






Abstract
The tactile perception of wet fabrics plays an important role in human comfort, but the underlying mechanisms of skin–wet fabric interaction remain unclear. This study measured the basic properties (saturated water content, wicking height, moisture regain rate, fabric density, and yarn diameter) of 20 fabrics, collected real-time tactile physical parameters (skin cooling rate, normal pressure, frictional coefficient, maximum acceleration amplitude, and acceleration mean square deviation), and subjective tactile perception ratings (wetness, coldness, roughness, stiffness, and total hand feeling value) during the interactions between fingertip and fabrics with three relative water contents (dry, 35%, and 70% saturated water content). The results demonstrated the significant effects of fabric water content on tactile perceptions and tactile physical parameters. Four machine learning methods, Gradient Boosting Regression, XGBoost Regression, Random Forest Regression, Artificial Neural Networks Regression (ANNR), and a linear regression method, Partial Least Squares Regression, were used to establish predictive models. The ANNR model demonstrated the best performance in total hand feeling value (R2 = 0.727, root mean square error = 0.66), and SHapley Additive exPlanations analysis revealed eight key factors, highlighting the significant effect of fabric water content and mechanical stimulation on total hand feeling value. These findings provide deeper insights into enhancing the comfort of wet textiles and offer potential guidance to optimize the tactile design of products.
The tactile perception of skin–fabric contact strongly influences wearing comfort and consumers’ clothing choices (Limeneh et al., 2024; Utkun, 2021). Many studies assessed fabric tactile perception through subjective evaluation (Tadesse et al., 2019). However, these methods are limited by individual differences among participants and the requirement for many participants. Therefore, establishing an objective evaluation model can help overcome these limitations, providing a reliable and objective method for assessing tactile perception.
Traditional hand feeling evaluation instrument is the Kawabata Evaluation System (KES). This system measures the low-stress mechanical fabric properties (tensile, shearing, bending, compression, surface, frictional, and thermal conductivity) and calculates fabric hand values, enabling objective evaluation of fabrics under low-load conditions (Gtadesse et al., 2020). Several studies have employed fabric properties measured by KES to predict tactile perception. For instance, Tadesse et al. (2019) predicted tactile scores and total hand values using fabric mechanical properties measured by KES. The prediction performances of Artificial Neural Network (ANN) and Adaptive Neuro-fuzzy Inference System (ANFIS) modeling approaches had low root mean square error (RMSE) values (0.014, 0.0122), and the results closely matched human evaluations. Similarly, Gtadesse et al. (2020) used KES to obtain fabric mechanical properties, then employed the Kawabata translation equation to predict hand value and total hand value; the results’ errors (0.66) were smaller than those (0.78) from expert evaluations. Although these studies established relationships between fabric properties and tactile perceptions, they focused on dry fabrics and did not consider wet conditions, even though the water content of fabrics significantly affected perception (Raccuglia et al., 2018). Although KES can accurately measure the properties of dry fabrics, it is difficult to measure wet fabrics. Therefore, establishing predictive models for the tactile perceptions of wet fabrics remains necessary.
Although experimental instruments can measure fabric physical properties, skin–fabric interactions have rarely been considered. During the interaction process, factors such as participants’ touch habits and contact conditions can influence perceptions. Participants are more likely to explore a material surface during active touch, which allows the skin to receive more information than passive touch and enhances the ability to evaluate surface properties (Smith et al., 2009). Participants actively touching fabrics also better reflect real-world tactile interactions (Fischer et al., 2025) and can obtain more realistic tactile physical parameters. Therefore, collecting real-time objective physical parameters during interactive touching represents another potential method for predicting tactile perception. Izu et al. (2021) demonstrated that physical parameters during skin–fabric interactions significantly influence roughness, stiffness, comfort perception, and preference. Romao Santos et al. (2023) established a regression relationship of parameters at the finger–fabric interface (contact force, finger speed, and skin vibration) and fabric physical properties measured by KES with sensory evaluations, discovering that surface tactile perceptions were influenced by vibrations, further emphasizing the importance of objective physical parameters in skin–fabric interactions.
However, many current studies focus on one tactile perception, such as wetness (Raccuglia et al., 2018), coldness (Wu et al., 2023), or roughness (Kim et al., 2025). Since fabric hand feeling is influenced by multiple factors such as wetness, coldness, stiffness, and roughness, there remains a lack of research integrating various physical stimuli to establish connections between objective parameters (force, vibration, temperature signals, and fabric properties) and the total hand feeling value during dynamic touch. This integration provides a better understanding of the complex mechanisms underlying tactile perception. In addition, traditional predictive models cannot explain the importance level of each factor. However, the SHAP (SHapley Additive exPlanations) method can quantify the contribution of each input feature to the prediction (Lundberg & Lee, 2017). As the SHAP method is widely applied in various fields (Yang et al., 2022), applying it to identify key factors influencing tactile perception may provide valuable insights for tactile interface design.
To predict various tactile perceptions, especially the total hand feeling value during the interactions between fingertips and wet fabrics, the aims of this study were: (1) to establish tactile perception models for the skin–fabric interface at different wetting levels using machine learning algorithms; and (2) to explore important features influencing tactile perception through the SHAP method. Therefore, this experiment was conducted with three wetting levels for the fabrics, and then participants actively touched the fabrics, establishing subjective tactile perception models based on basic fabric properties and tactile physical parameters during skin–fabric interactions, and the key influencing factors were analyzed. The findings enhance the understanding of tactile perception mechanisms and guide textile and clothing design to optimize comfort.
Materials and Methods
Experimental Materials
To ensure a discernible variation in fabric properties, 20 fabrics (cotton, flax, silk, jute, and polyester) were selected. These are commonly used as clothing fabrics in the market, covering different fiber types, surface properties, and moisture-absorbing capabilities. The rules of screening were that the difference of the mean surface roughness (SMD) with the same fiber was at least 0.86 μm (Zhao et al., 2014), or when rule one was violated, the density should be different. Six properties related to tactile perception were selected (Table 1).
Experimental fabric properties.
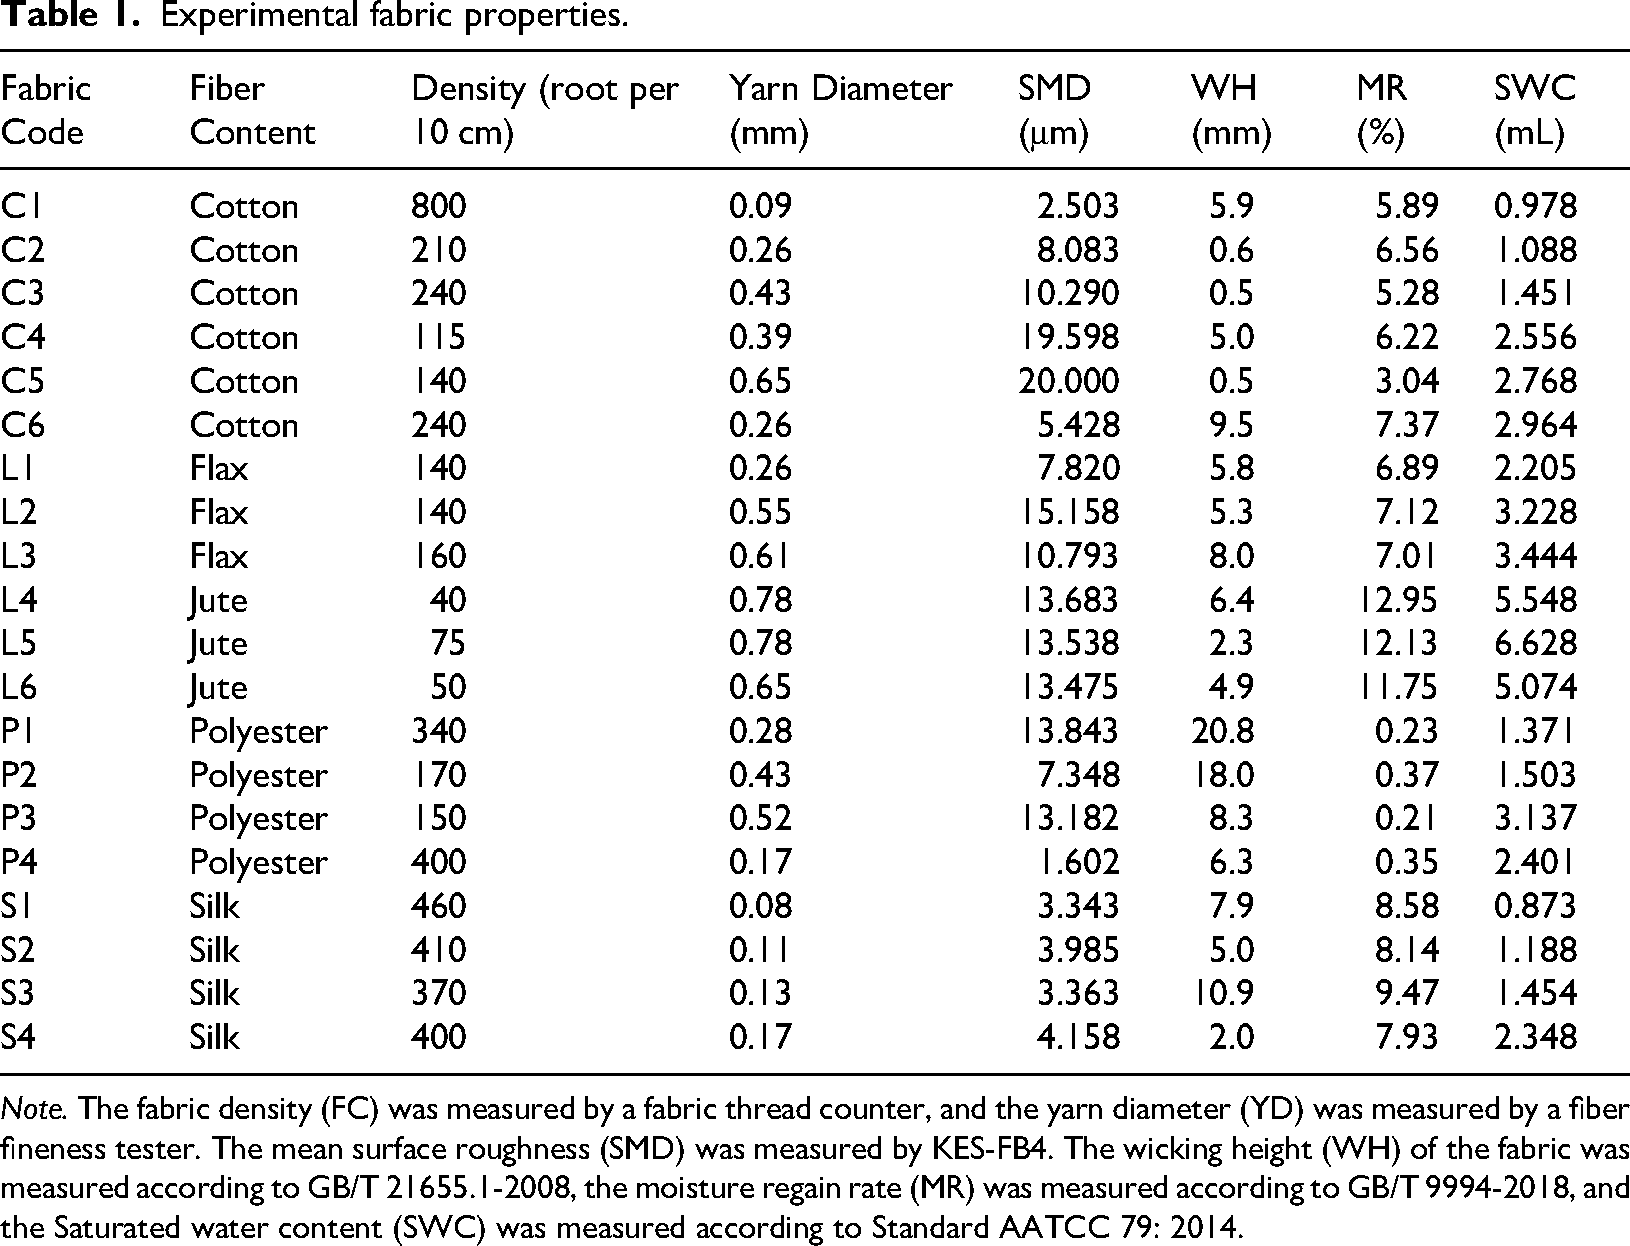
Note. The fabric density (FC) was measured by a fabric thread counter, and the yarn diameter (YD) was measured by a fiber fineness tester. The mean surface roughness (SMD) was measured by KES-FB4. The wicking height (WH) of the fabric was measured according to GB/T 21655.1-2008, the moisture regain rate (MR) was measured according to GB/T 9994-2018, and the Saturated water content (SWC) was measured according to Standard AATCC 79: 2014.
Experimental Conditions
All experiments were conducted in a climatically controlled chamber, with the temperature of 20 ± 1 °C, the relative humidity of 65 ± 5%, and the air velocity below 0.4 m s−1 to ensure a thermoneutral state.
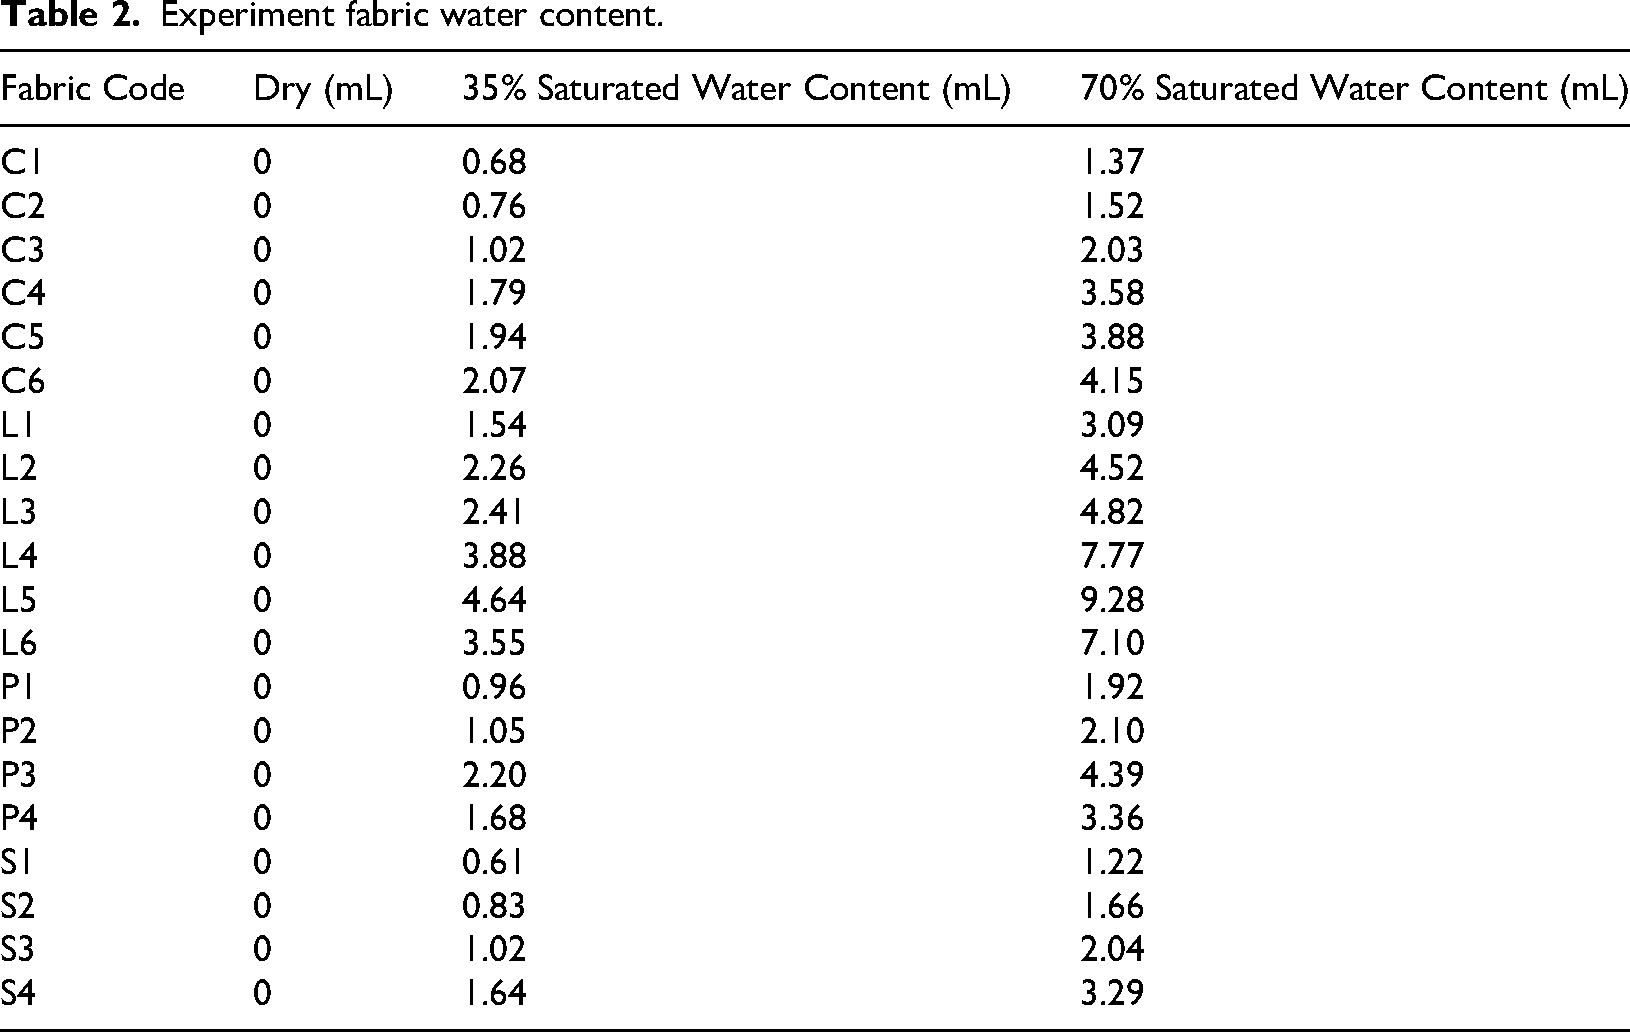
Sweat production varies with human activity levels: light (300–800 mL hr−1), moderate (800–1,500 mL hr−1), and heavy (>1,500 mL hr−1). The fabric water content was set to represent the 10-min sweat output of a human with a body surface area of 1.8 m2 at different activity levels. According to the calculations, the water content for the fabric (0.02 m2) should be: light (0.6–1.5 mL), moderate (1.5–2.8 mL), and heavy (>2.8 mL). In the experiment, the wetting levels for the fabrics were dry (D, no additional water added), low (L, 35% saturated water content), and high (H, 70% saturated water content). The water contents of the experimental fabrics at three wetting levels are shown in Table 2. Therefore, wetting level D indicated a human body in a nonsweating state, L indicated a light or moderate sweating state, and H indicated a heavy sweating state. The amount of distilled water corresponding to 35% and 70% of their saturated water content was added, the water was applied evenly to the fabric using a pipette, and the fabrics were sealed in ziplock plastics after they were fully wet and evenly. All samples (10 × 20 cm2) were conditioned under the above conditions for more than 24 hr before testing.
Experiment fabric water content.
To minimize the effect of touch speed, participants touched the fabric following a touch animation (Wu et al., 2015) at a speed of 30 mm s−1 (Zhou et al., 2018). To control the touch pressure, the experimenter monitored the pressure data from the pressure sensor within 0.2–2 N (Fagiani et al., 2011) and provided feedback to participants. Each participant practiced the touch process with the required speed and pressure before the formal experiment.
Participants
We performed a sample size (G*Power 3.1) calculation using F tests, an effect size f = 0.5, an α = 0.05, β (power) = 0.9, repetition = 3, and determined a minimum sample of 11. Twenty right-handed participants, including undergraduates and postgraduates from the College of Fashion and Design, Donghua University, were recruited. They all passed the health questionnaire screening and have no dermatologic or perceptual disorders. To minimize individual differences in sensory sensitivity, participants were screened following the procedures used in previous studies (Zhang et al., 2022) to assess their sensory acuity and intrasubject reliability. After screening, eight participants were excluded due to instability in their scores. Finally, 12 participants were selected as reliable assessors for the formal experiment: six female participants (22.50 ± 1.38 years, 1.63 ± 0.04 m, 54.67 ± 9.11 kg, and body mass index [BMI] 21.02 ± 2.81) and six male participants (22.33 ± 1.37 years, 1.76 ± 0.04 m, 74.67 ± 8.33 kg, and BMI 24.08 ± 1.70).
The participants were asked to wear long-sleeved shirts, long pants, and sneakers. They were asked not to stay up late and not to drink alcohol, coffee, or tea for 24 hr before the test, and not to do any exercise or eat any food for half an hour before carrying out the experiments. The experimental protocol and procedures were approved by the Laboratory Management Committee of Donghua University (20250412), and the testing procedures were in accordance with the principles of the Declaration of Helsinki.
Real-Time Multidimensional Interactive Signal Acquisition System
The experimental platform (Figure 1) included a temperature signal acquisition module, an acceleration signal acquisition module, and a force signal acquisition module.
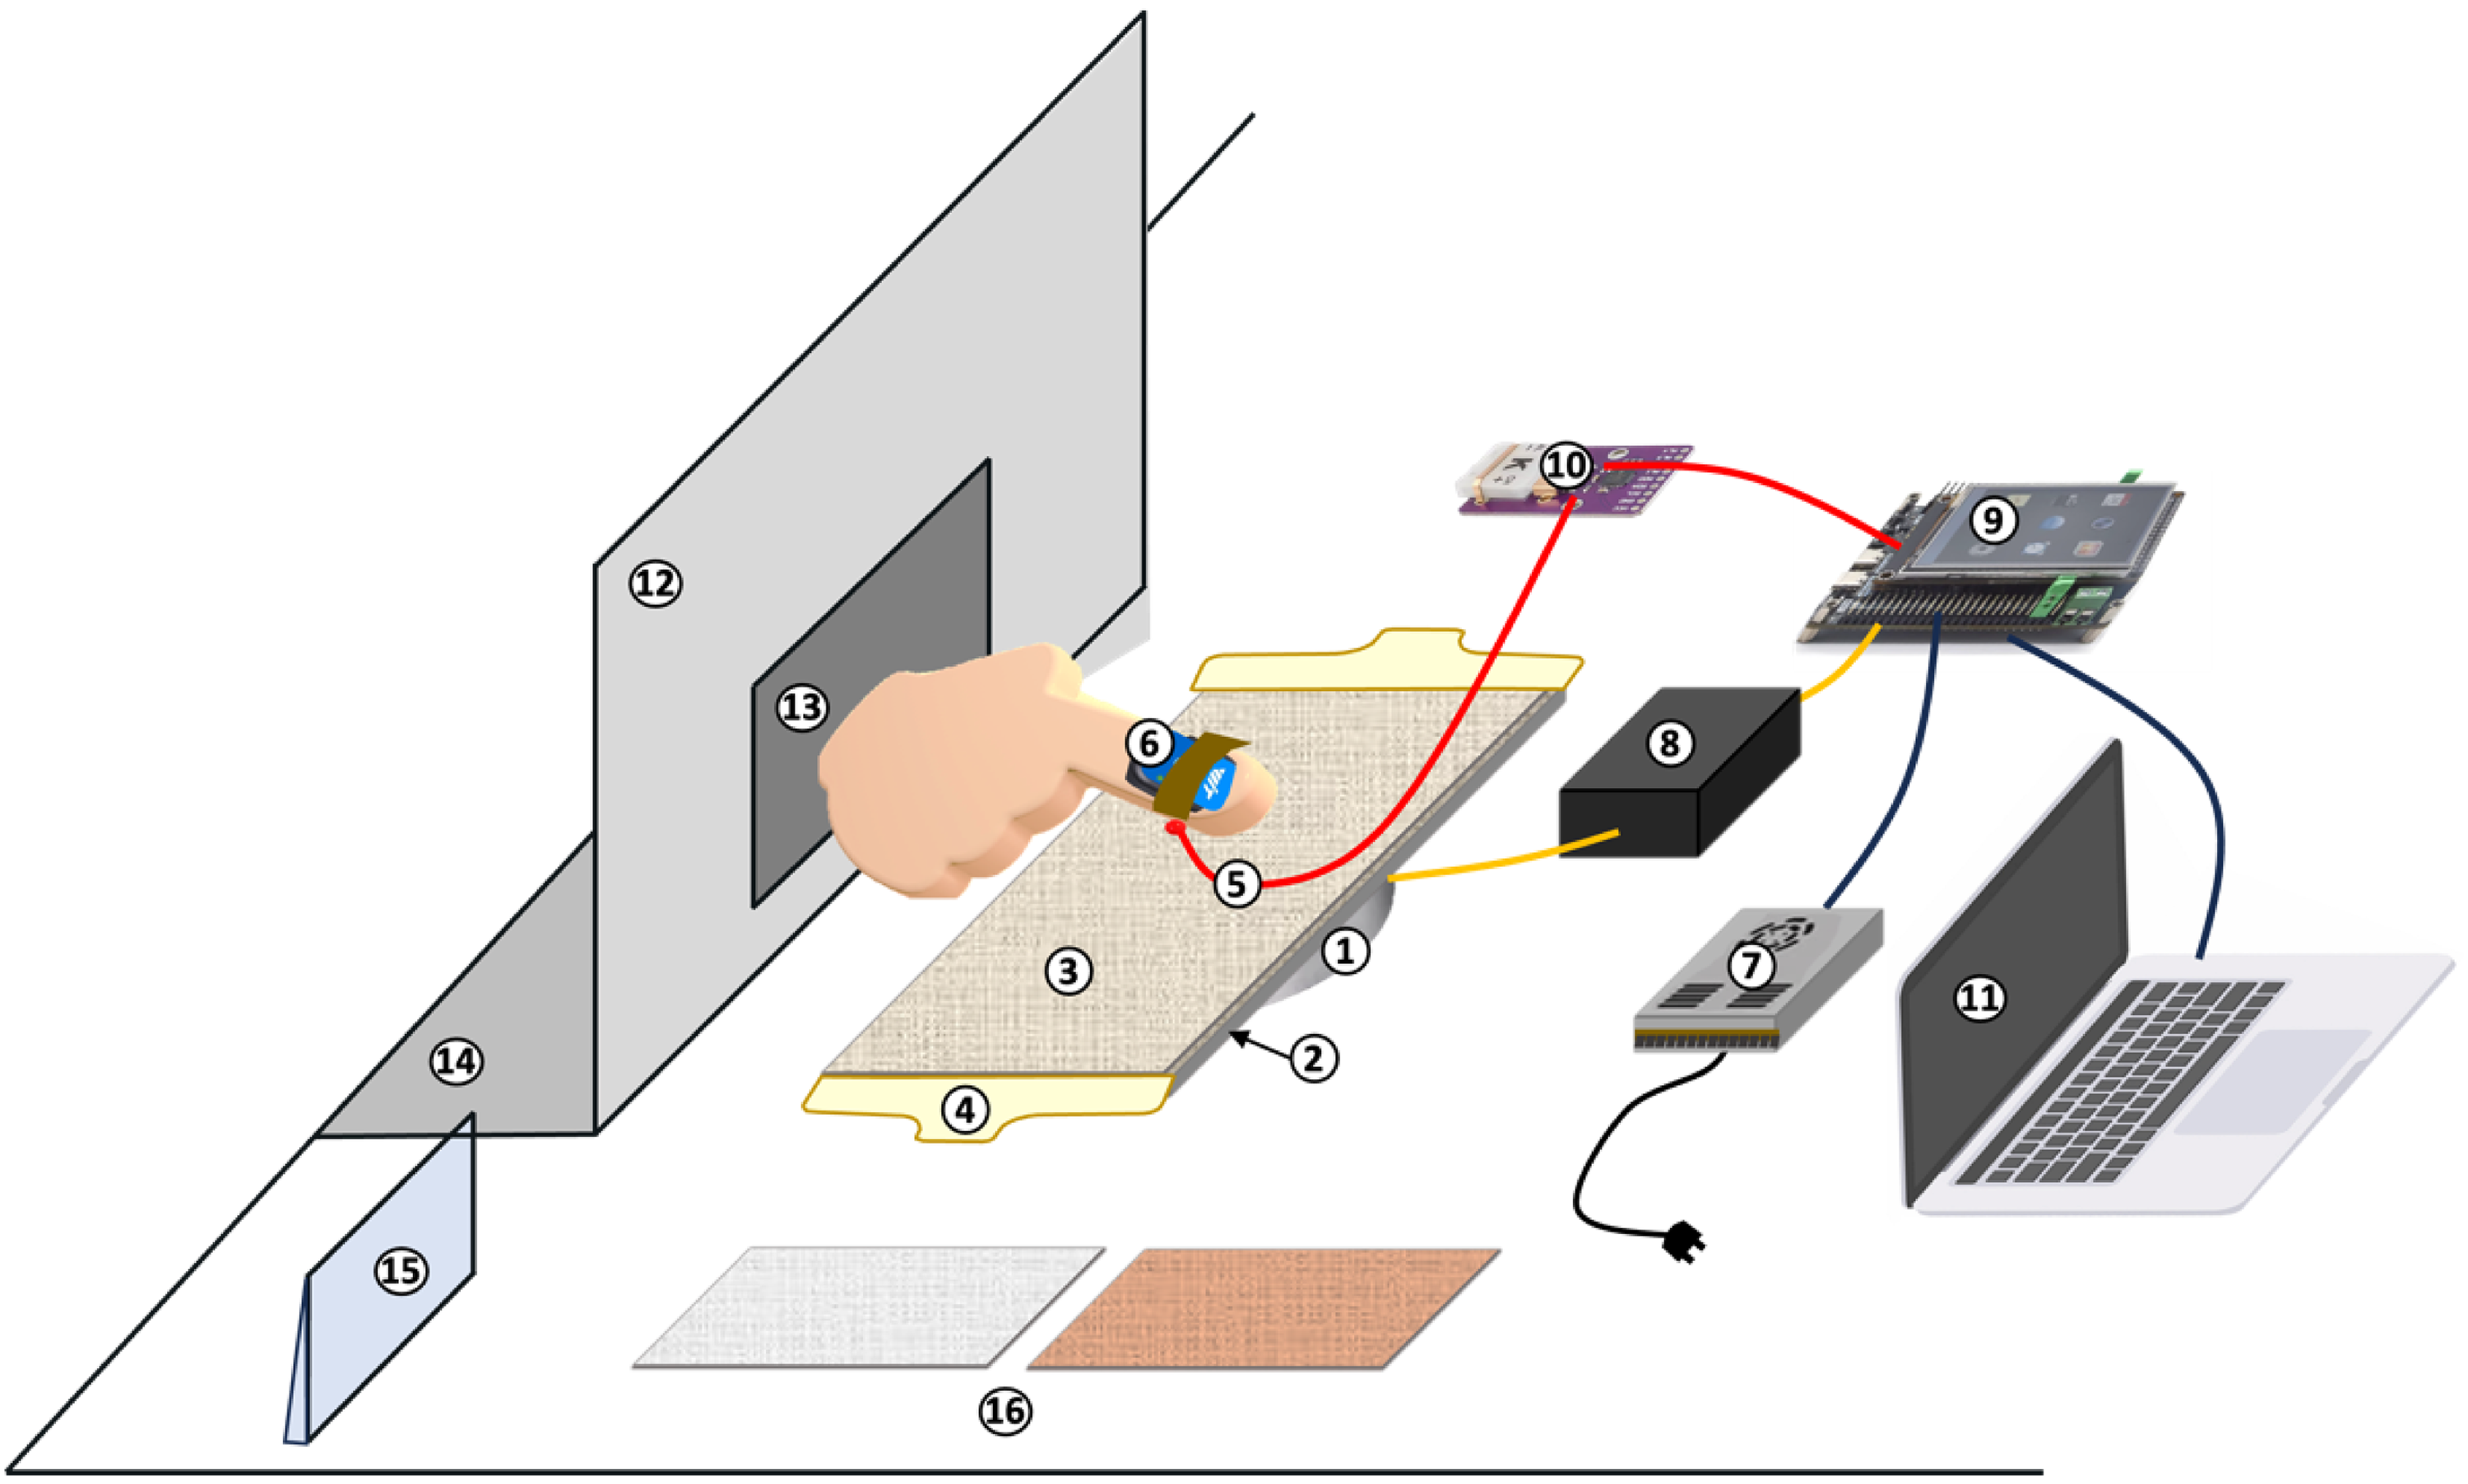
Overall device connection diagram: (1) force sensor; (2) acrylic plate; (3) sample; (4) plastic clip; (5) thermocouple temperature sensing wire; (6) acceleration sensor (Bluetooth); (7) power supply; (8) force sensor transmitter; (9) development board; (10) thermocouple converter; (11) computer; (12) baffle; (13) open; (14) heating pad; (15) touch animation display screen; (16) sample to be tested.
The temperature signal acquisition module consisted of a thermocouple temperature sensing wire (5TC-TT-T-30-36, OMEGA, USA) (5) and a thermocouple converter (MCP9600, MICROCHIP, USA) (10) to measure the skin temperature. The acceleration sensor (WT9011DCL-BT50, Weite Technology, China) was used as an acceleration signal acquisition module to measure acceleration in three dimensions: x, y, and z. The force sensor (LZ-SWF40, Hefei Lizhi Technology, China) (1) was placed under the acrylic plate (2) to measure the force in x, y, and z dimensions during the touch process. The detailed system connection method was described in the previous study (Guo & Zhang, 2025).
Measurements
Tactile Physical Parameters
The tactile physical parameters were acquired through the real-time multidimensional interactive signal acquisition system above and calculated according to the following formula.
SCR was the skin cooling rate (°C s−1):

Amax is the maximum value of acceleration amplitude (m s−2):
Amse was the mean square deviation of acceleration (m2 s−4):
Subjective Rating Scales
Based on the ratings used in the KES evaluation system (Gtadesse et al., 2020), the rating scales for wetness, coldness, roughness, and stiffness are shown in Figure 2(a). The ratings ranged from 0 (senseless) to 10 (very strong); participants could mark at any position on the scale with an accuracy of 0.1. For total hand feeling value evaluation, a six-point rating scale is used in Figure 2(b). In the figure, 0 for most uncomfortable, indicating that the fabric had a very poor hand evaluation, and it was not suitable for use in clothing or fabric products, 5 for most comfortable, indicating that the fabric had an excellent hand evaluation and was extremely comfortable; it was suitable for use in clothing or fabric products.
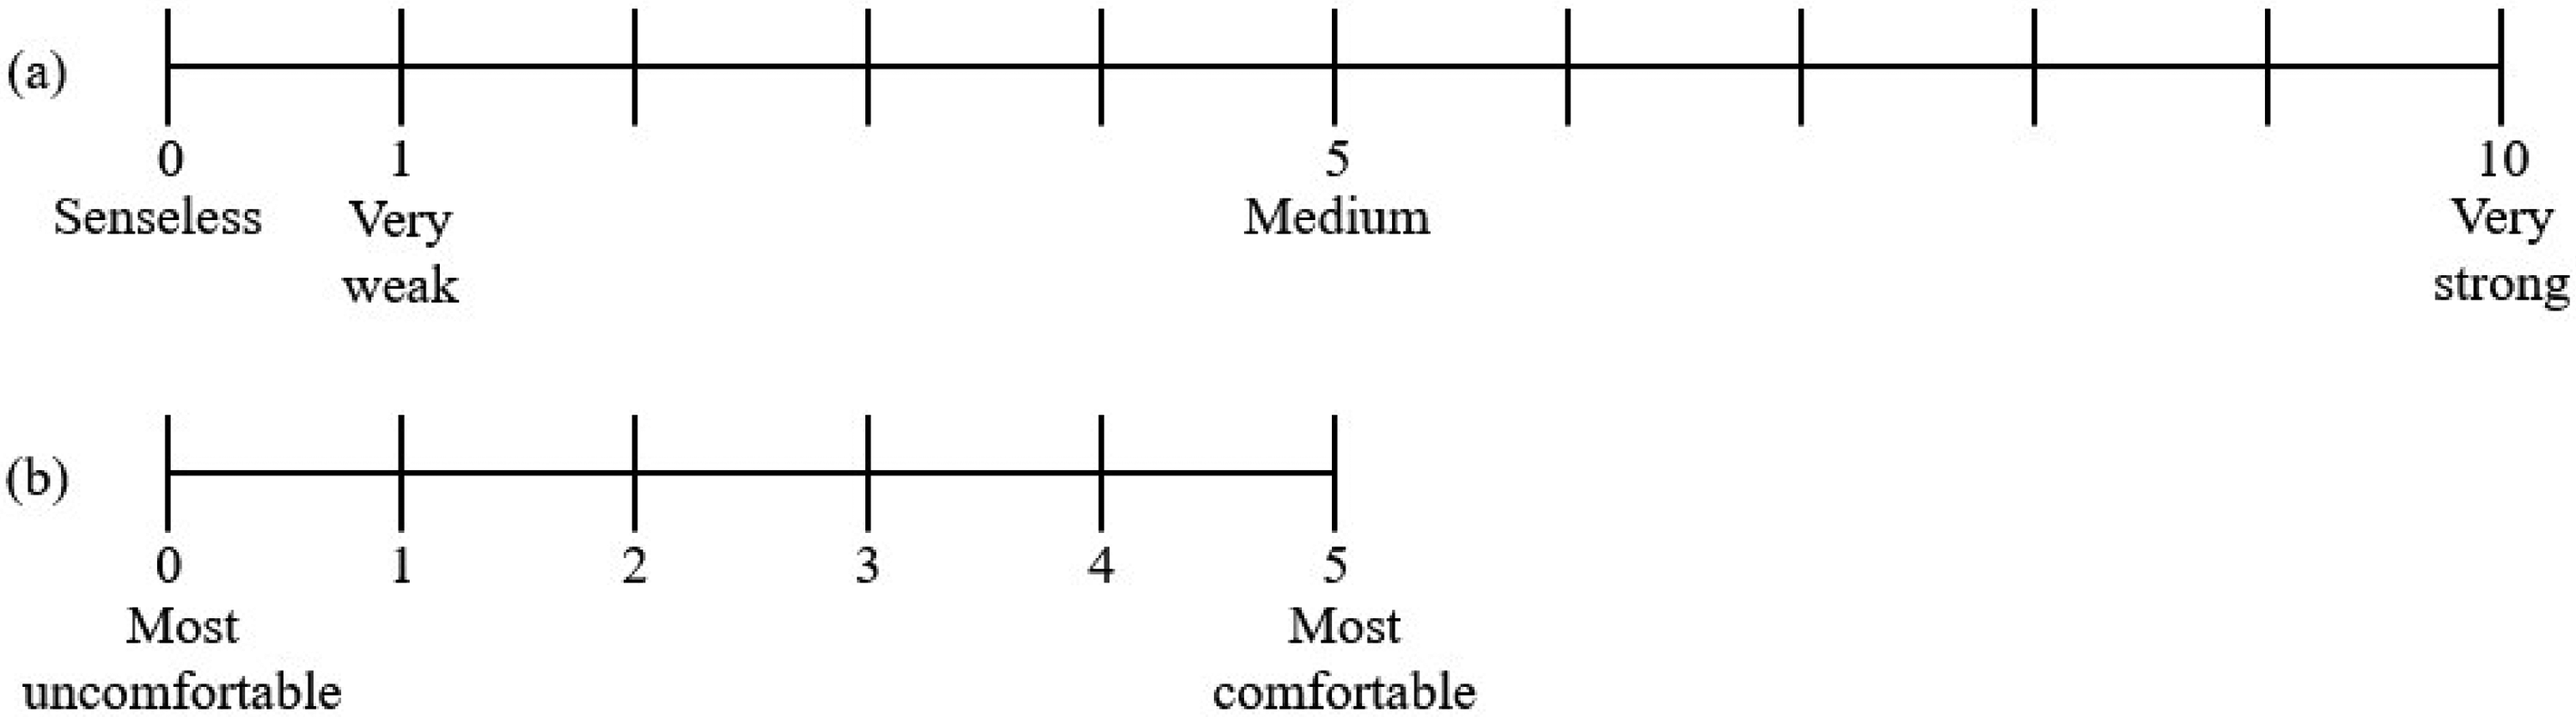
Rating scales: (a) wetness/coldness/roughness/stiffness rating scale and (b) total hand feeling value evaluation scale.
To ensure a unified evaluation standard, the reference fabrics were assigned. For wetness and coldness, fabric C5 with 100% saturated water was assigned as 10 (very strong wetness and coldness), fabric C5 without extra water was assigned as 0 (senseless). For roughness, fabric L5 was used as a 10 (very strong roughness) reference, and fabric C1 was used as a 0 (senseless) reference. For stiffness, fabric L5 (very strong stiffness) and three-layer fabric P3 (senseless) were chosen as references.
Experimental Protocol
Each participant touched 180 times (20 fabrics × 3 wetting levels × 3 repetitions). Three repetitions of each fabric at the same wetting level were required to evaluate different indicators: the first touch evaluated dry/wet and cold/warm, the second evaluated smooth/rough and flexible/stiff, and the third evaluated total hand feeling value. The order of 60 conditions (20 fabrics × 3 wetting levels) was randomly sorted with a random number generator. Each participant visited the laboratory six times, touching fabrics under 10 conditions each time in about 1 hr, and the interval between two visits was at least 48 hr. The detailed experimental procedures were as follows.
First, the participants entered the chamber and sat quietly for about 20 min to adapt to the environmental conditions. During this time, the experimenter explained the experimental procedures and the rating method for the scales, participants signed the informed consent and practiced the touching process with the required speed and pressure. The touch animation was played during each touching process. Subsequently, the experimenter fixed the thermocouple probe 0.7 cm above the first joint of the right index finger pad, and the acceleration sensor was fixed on the nail of the right index finger. The experimenter measured the temperature of the index finger pad once the temperature stabilized and recorded it as T0.
When the evaluation started, participants touched the reference fabrics using their left hand first. Then, participants used their right hand to touch the experimental fabric. And participants marked their evaluation on the scale (Figure 2) using their left hand within 5–10 s after each touch. The temperature of the fingertip once it had stabilized after touching was recorded as T1. Every touch was required to repeat when the pressure did not meet the predefined criteria. Before each touch, participants placed their right hand on the heating pad until the fingertip skin temperature recovered to T0 ± 0.2 °C. After completing three repetitions under each fabric condition, participants rested for 5 min while the experimenter prepared the test fabric for the next condition. The same procedures were repeated for each condition. Finally, each participant finished 10 conditions and left the chamber. The first test was complete, and all participants were required to complete six tests on different dates following the same procedure.
Data Analysis
In the study, the Kendall test was used to test the consistency of subjective ratings, and if the consistency analysis met the requirement (p < .05, Kendall W > 0.5), then the subsequent analyses were carried out. The Shapiro–Wilk test was used to test the normality of the data distribution. The analysis of variance (ANOVA) was used when the data conformed to a normal distribution, and the Bonferroni posthoc analysis was used to compare every two levels. The Friedman test and the Wilcoxon signed-rank test were used when the normal distribution was violated. Finally, a linear regression method and four machine learning algorithms were used to establish tactile perception predictive models, including partial least squares (PLS) regression, Gradient Boosting Regression, XGBoost Regression, Random Forest Regression (RFR), and Artificial Neural Networks Regression (ANNR). Then, the Grid Search method was used to identify the optimal hyperparameter combination, and K-fold cross-validation was used to evaluate the model performance under different hyperparameter settings. The RMSE and the coefficient of determination (R2) were used as evaluation indicators for model accuracy, and the SHAP estimation method was used to analyze the interpretability of the model.
Statistical analyses were conducted using IBM SPSS Statistics 25.0 software, with the significance level set at p < .05. Graphs were done using Origin 2025 software, and the models were established using Anaconda3 software.
Results
Subjective Evaluation Consistency
The wetness (p < .001, W = 0.931), coldness (p < .001, W = 0.862), roughness (p < .001, W = 0.866), and stiffness perception (p < .001, W = 0.818) ratings of the 12 participants showed great consistency by the Kendall test. The total hand value ratings showed less consistency than others (p < .001, Kendall W = 0.739). It was possible that more factors influenced the total hand value, causing greater differences in evaluation between participants than other perceptions.
Effects of Wetting Levels on the Tactile Physical Parameters
Skin Temperature Parameters
Significant differences were found in the skin cooling rate (Figure 3) across three wetting levels (χ2(2, 240) = 393.68, p < .001), with higher wetting levels leading to significantly greater skin cooling rates. Compared with D, L showed an 83.3% increase in the skin cooling rate, while H showed a 125.0% increase. Since water increased the fabric’s thermal absorption coefficient, leading to more significant skin cooling. While touching dry fabric also decreased skin temperature, as the environmental temperature was 20 °C, the fabric temperature was lower than the skin temperature.
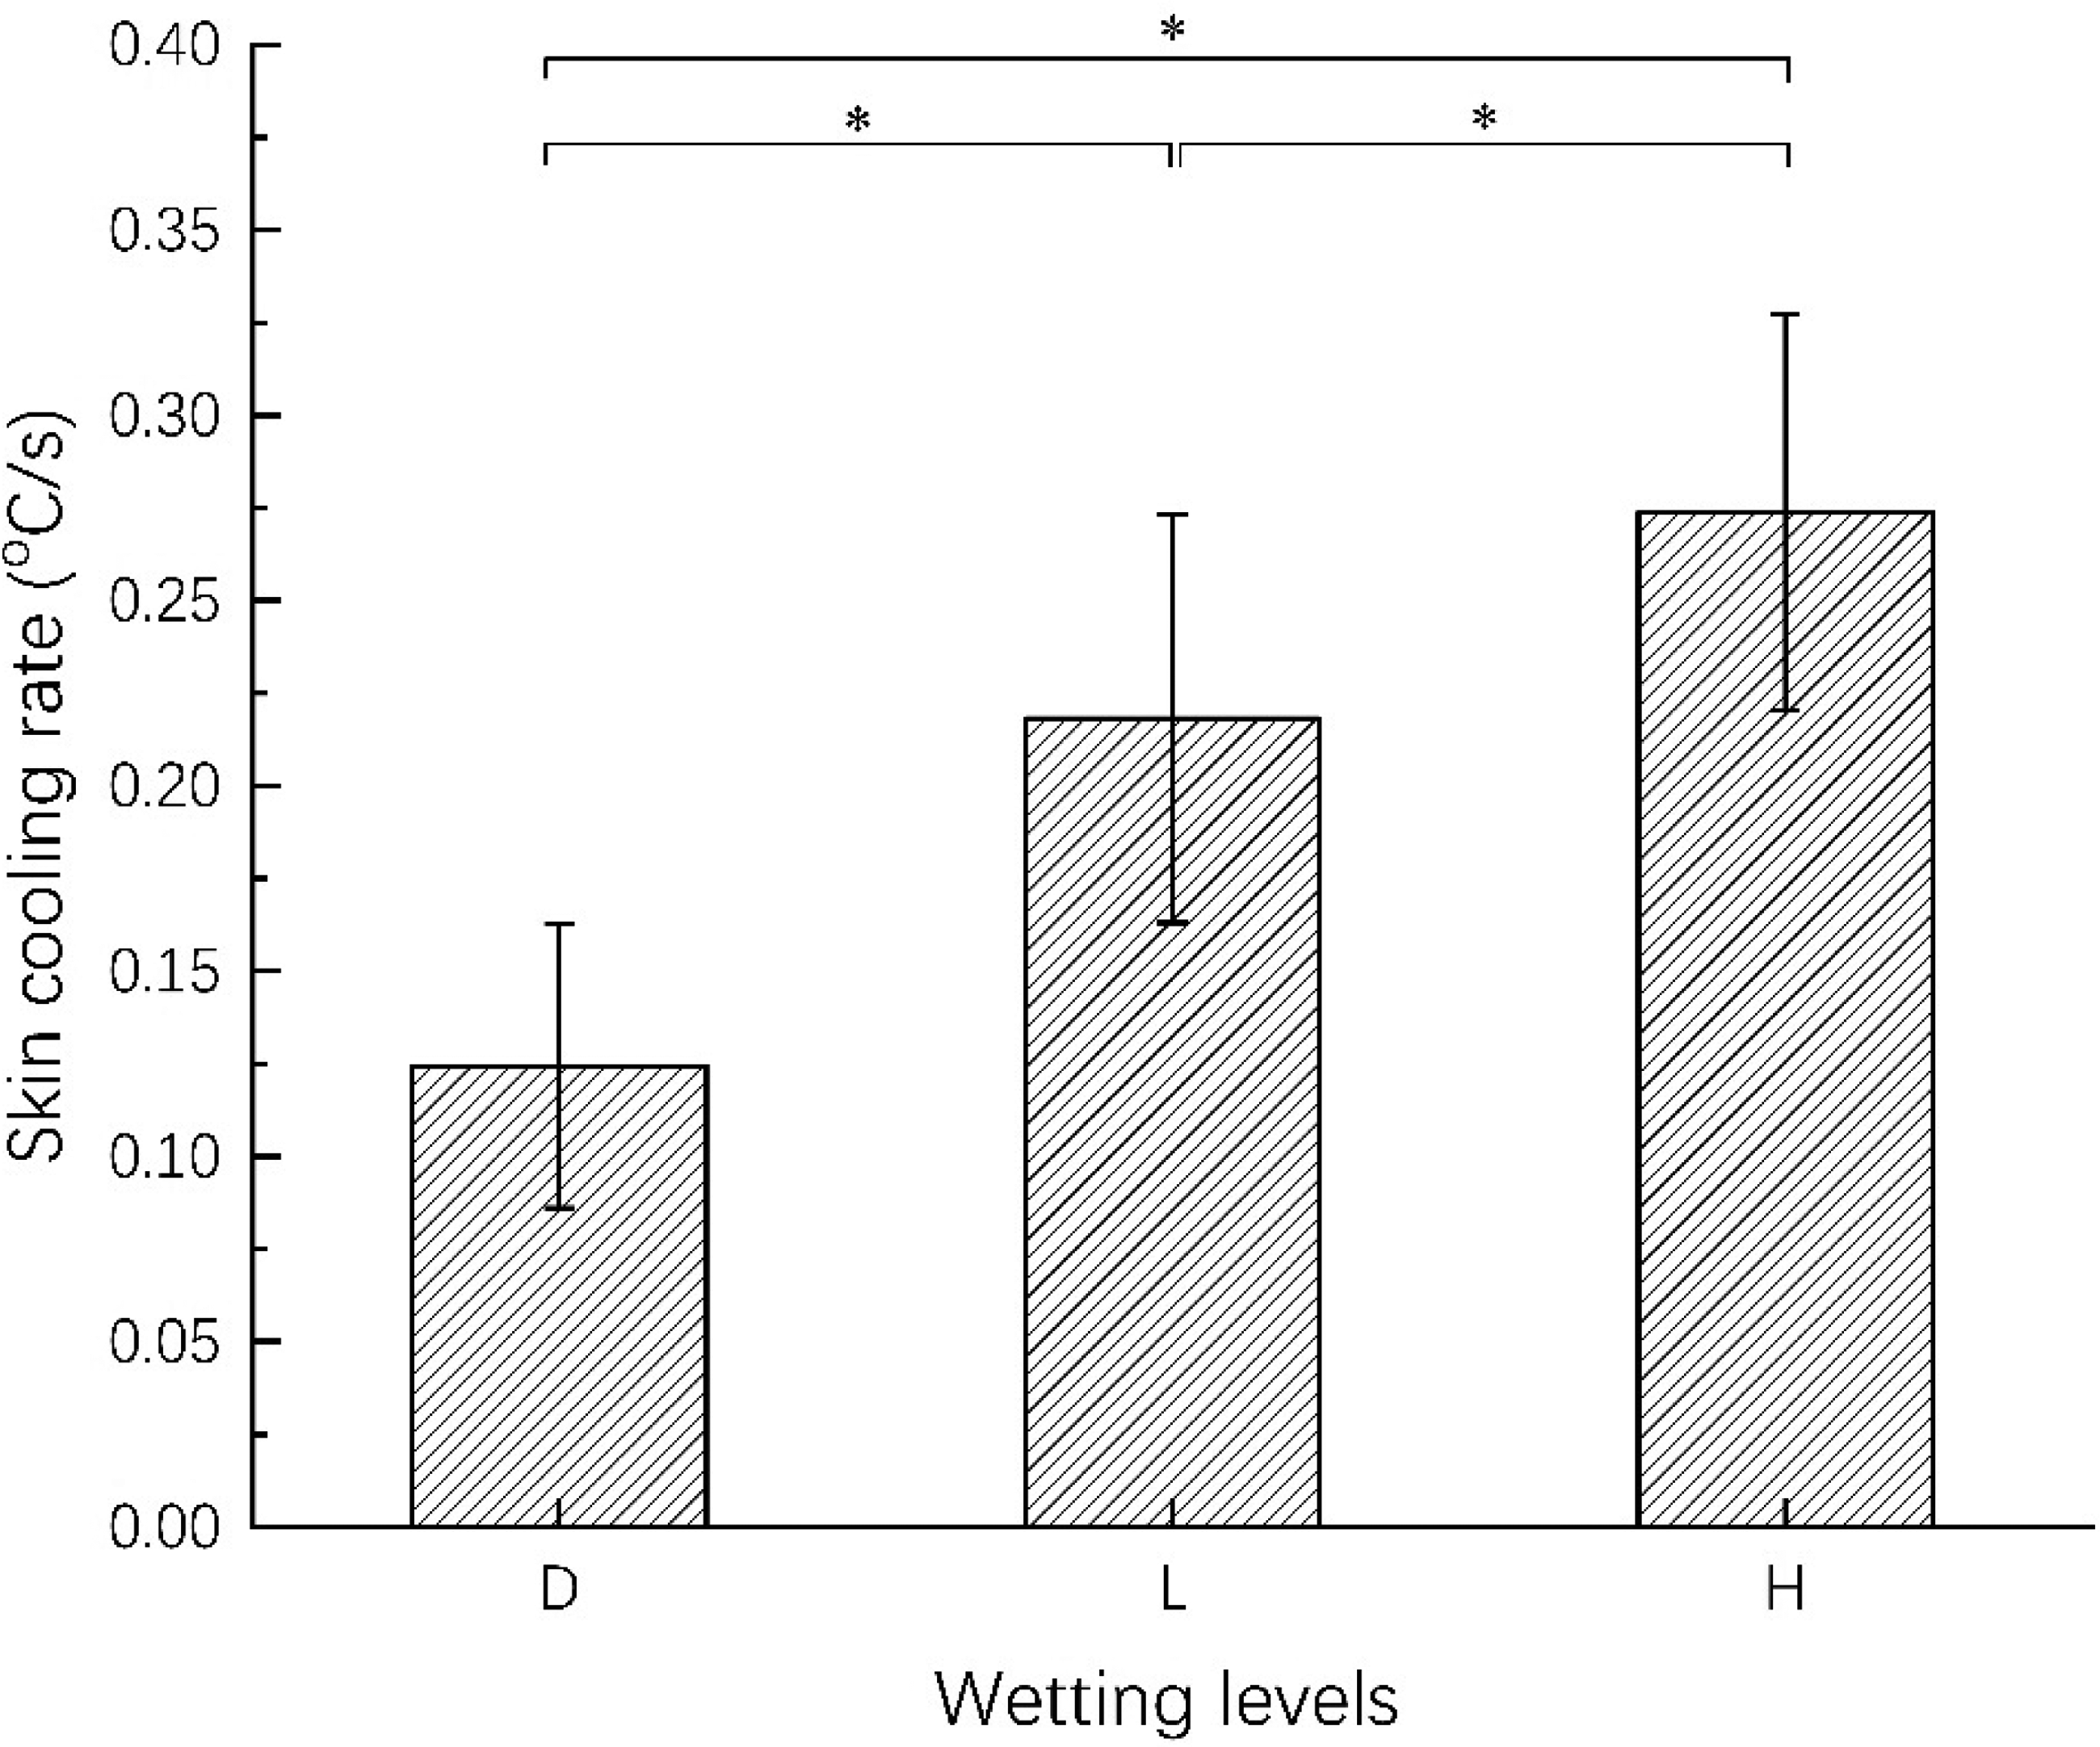
Skin cooling rate at different wetting levels. *p < .05. Note. D = dry (no additional water added); L = low wetting level (35% saturated water content); H = high wetting level (70% saturated water content). Error bars denote standard deviation.
Force Parameters
Normal Force. Figure 4 shows the normal force of the three wetting levels, that the perpendicular force imposed on the fabric by the fingertip. Normal force was significantly different across three wetting levels (F(2, 719) = 36.62, p < .001) by one-way repeated-measure ANOVA. Although participants were instructed to control touch pressure within the range of 0.2–2 N, statistically significant differences were still found between each two wetting levels (p < .001), and the normal force decreased as the wetting increased. Possibly because participants actively touched the fabric during the experiment, and as the fabric became wetter, they could feel its water content without pressing hard.
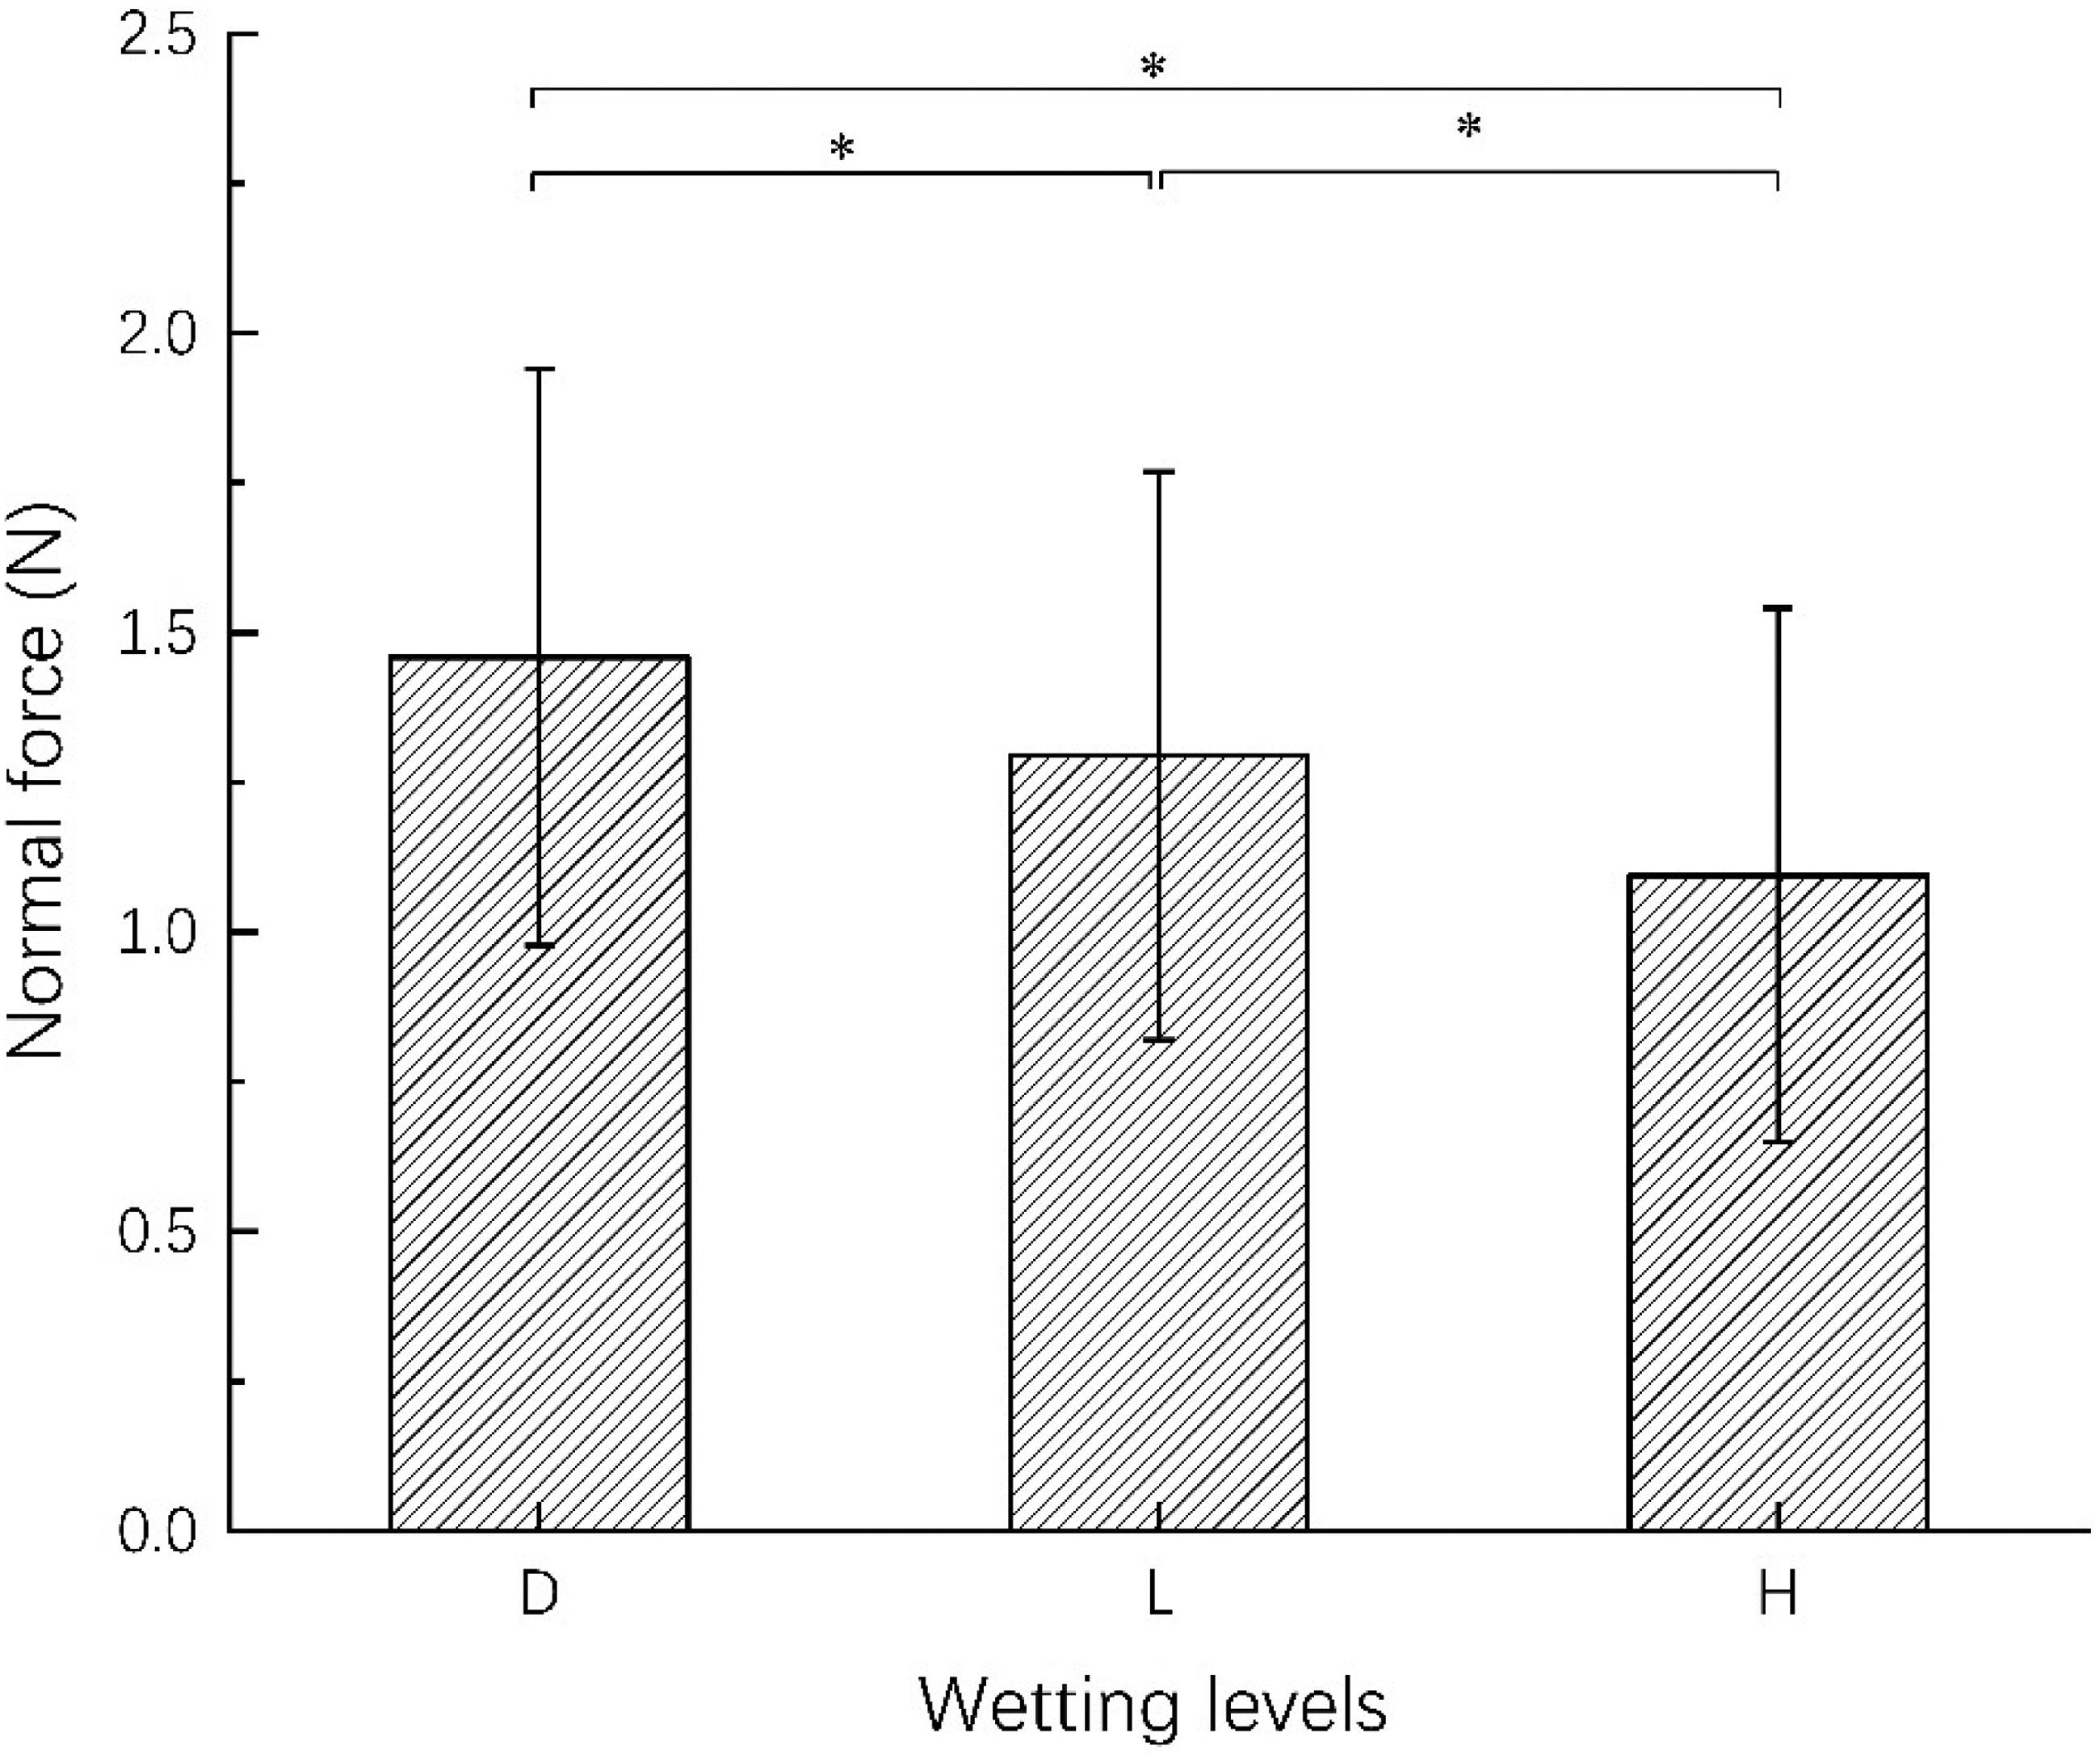
Normal force at different wetting levels. *p < .05. Note. D = dry (no additional water added); L = low wetting level (35% saturated water content); H = high wetting level (70% saturated water content). Error bars denote standard deviation.
Frictional Coefficient. Figure 5 shows the frictional coefficient and tangential force of three wetting levels. The Friedman's test showed that the wetting levels produced statistically significant differences (χ2(2, 240) = 356.51, p < .001), and the frictional coefficient increased significantly with increasing of wetting. According to formula (2), the tangential force increased while the normal force decreased as the wetting level increased, resulting in an increase in the frictional coefficient.
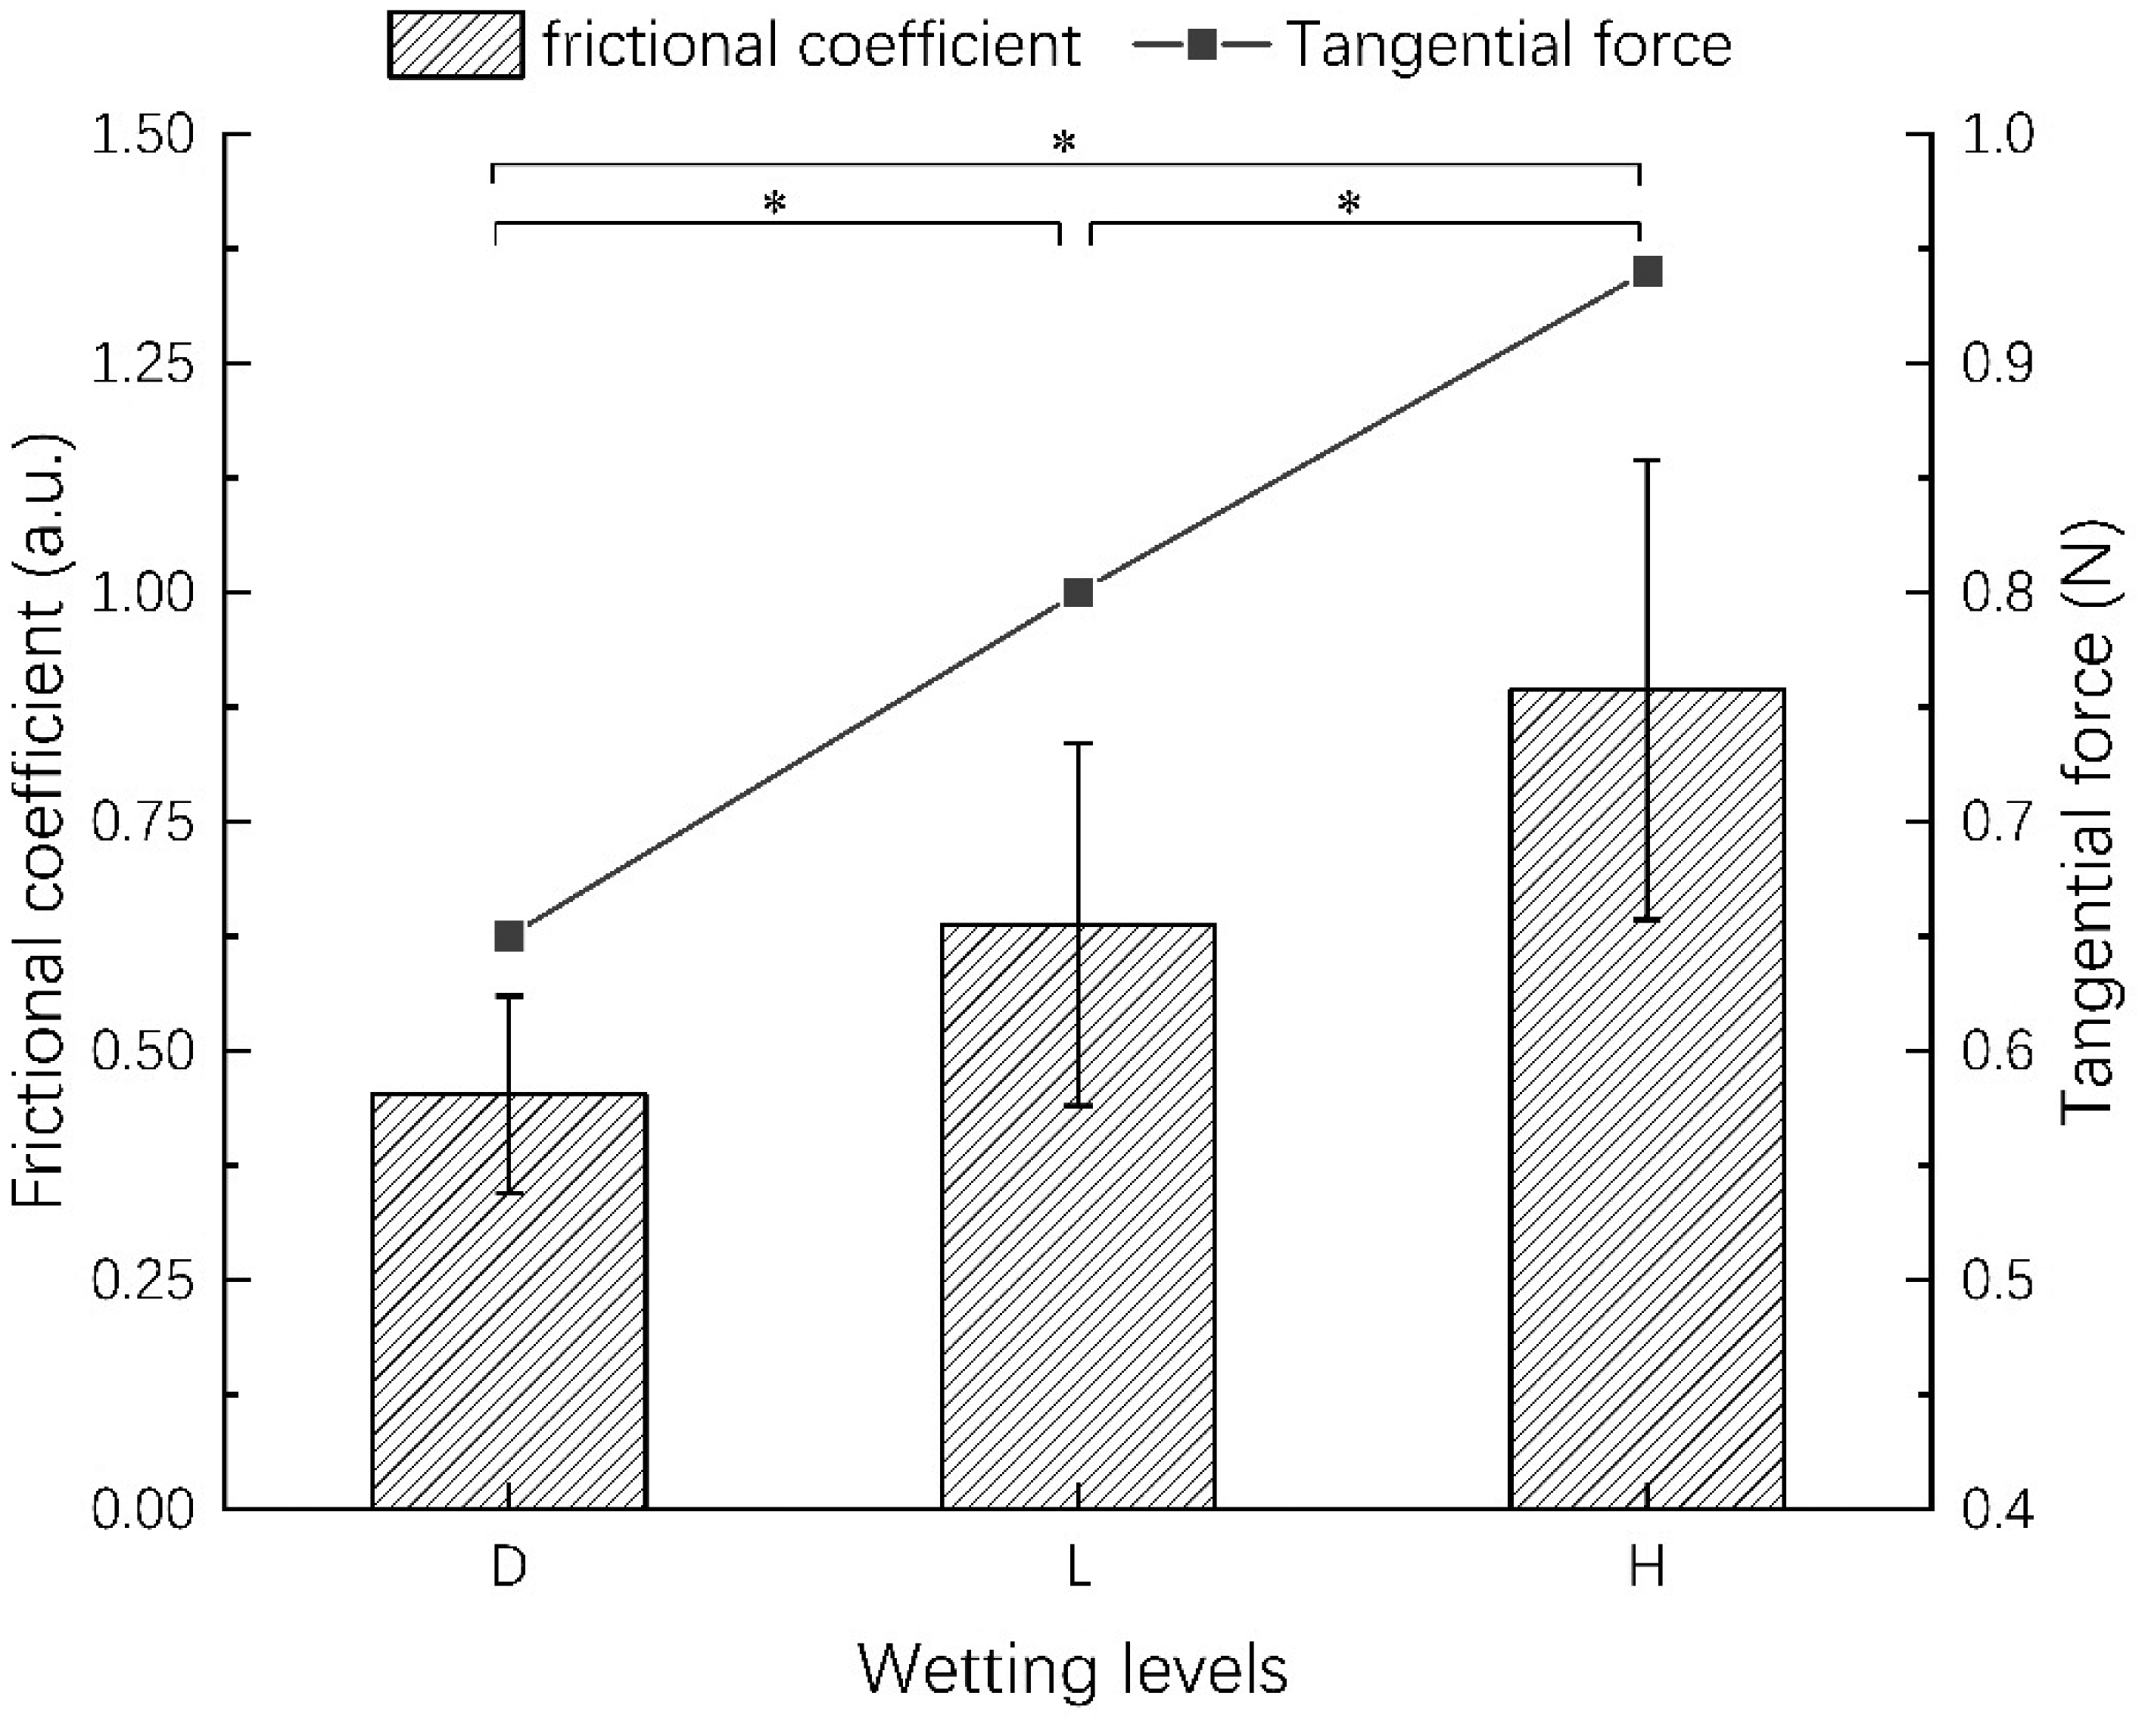
Friction coefficient and tangential force at different wetting levels. *p < .05. Note. D = dry (no additional water added); L = low wetting level (35% saturated water content); H = high wetting level (70% saturated water content). Error bars denote standard deviation.
Acceleration Parameters
The acceleration amplitude was related to the fabric surface roughness: a larger fabric surface roughness resulted in a larger amplitude. And the mean square deviation of acceleration reflected the fabric surface uniformity, with a more uniform fabric surface producing a smaller acceleration mean square deviation. The wetting level had no significant effect on the maximum value of acceleration amplitude (χ2(2, 240) = 2.24, p = .326) and the mean square deviation of acceleration (χ2(2, 240) = 0.18, p = .914) by the Friedman's test (Figure 6).
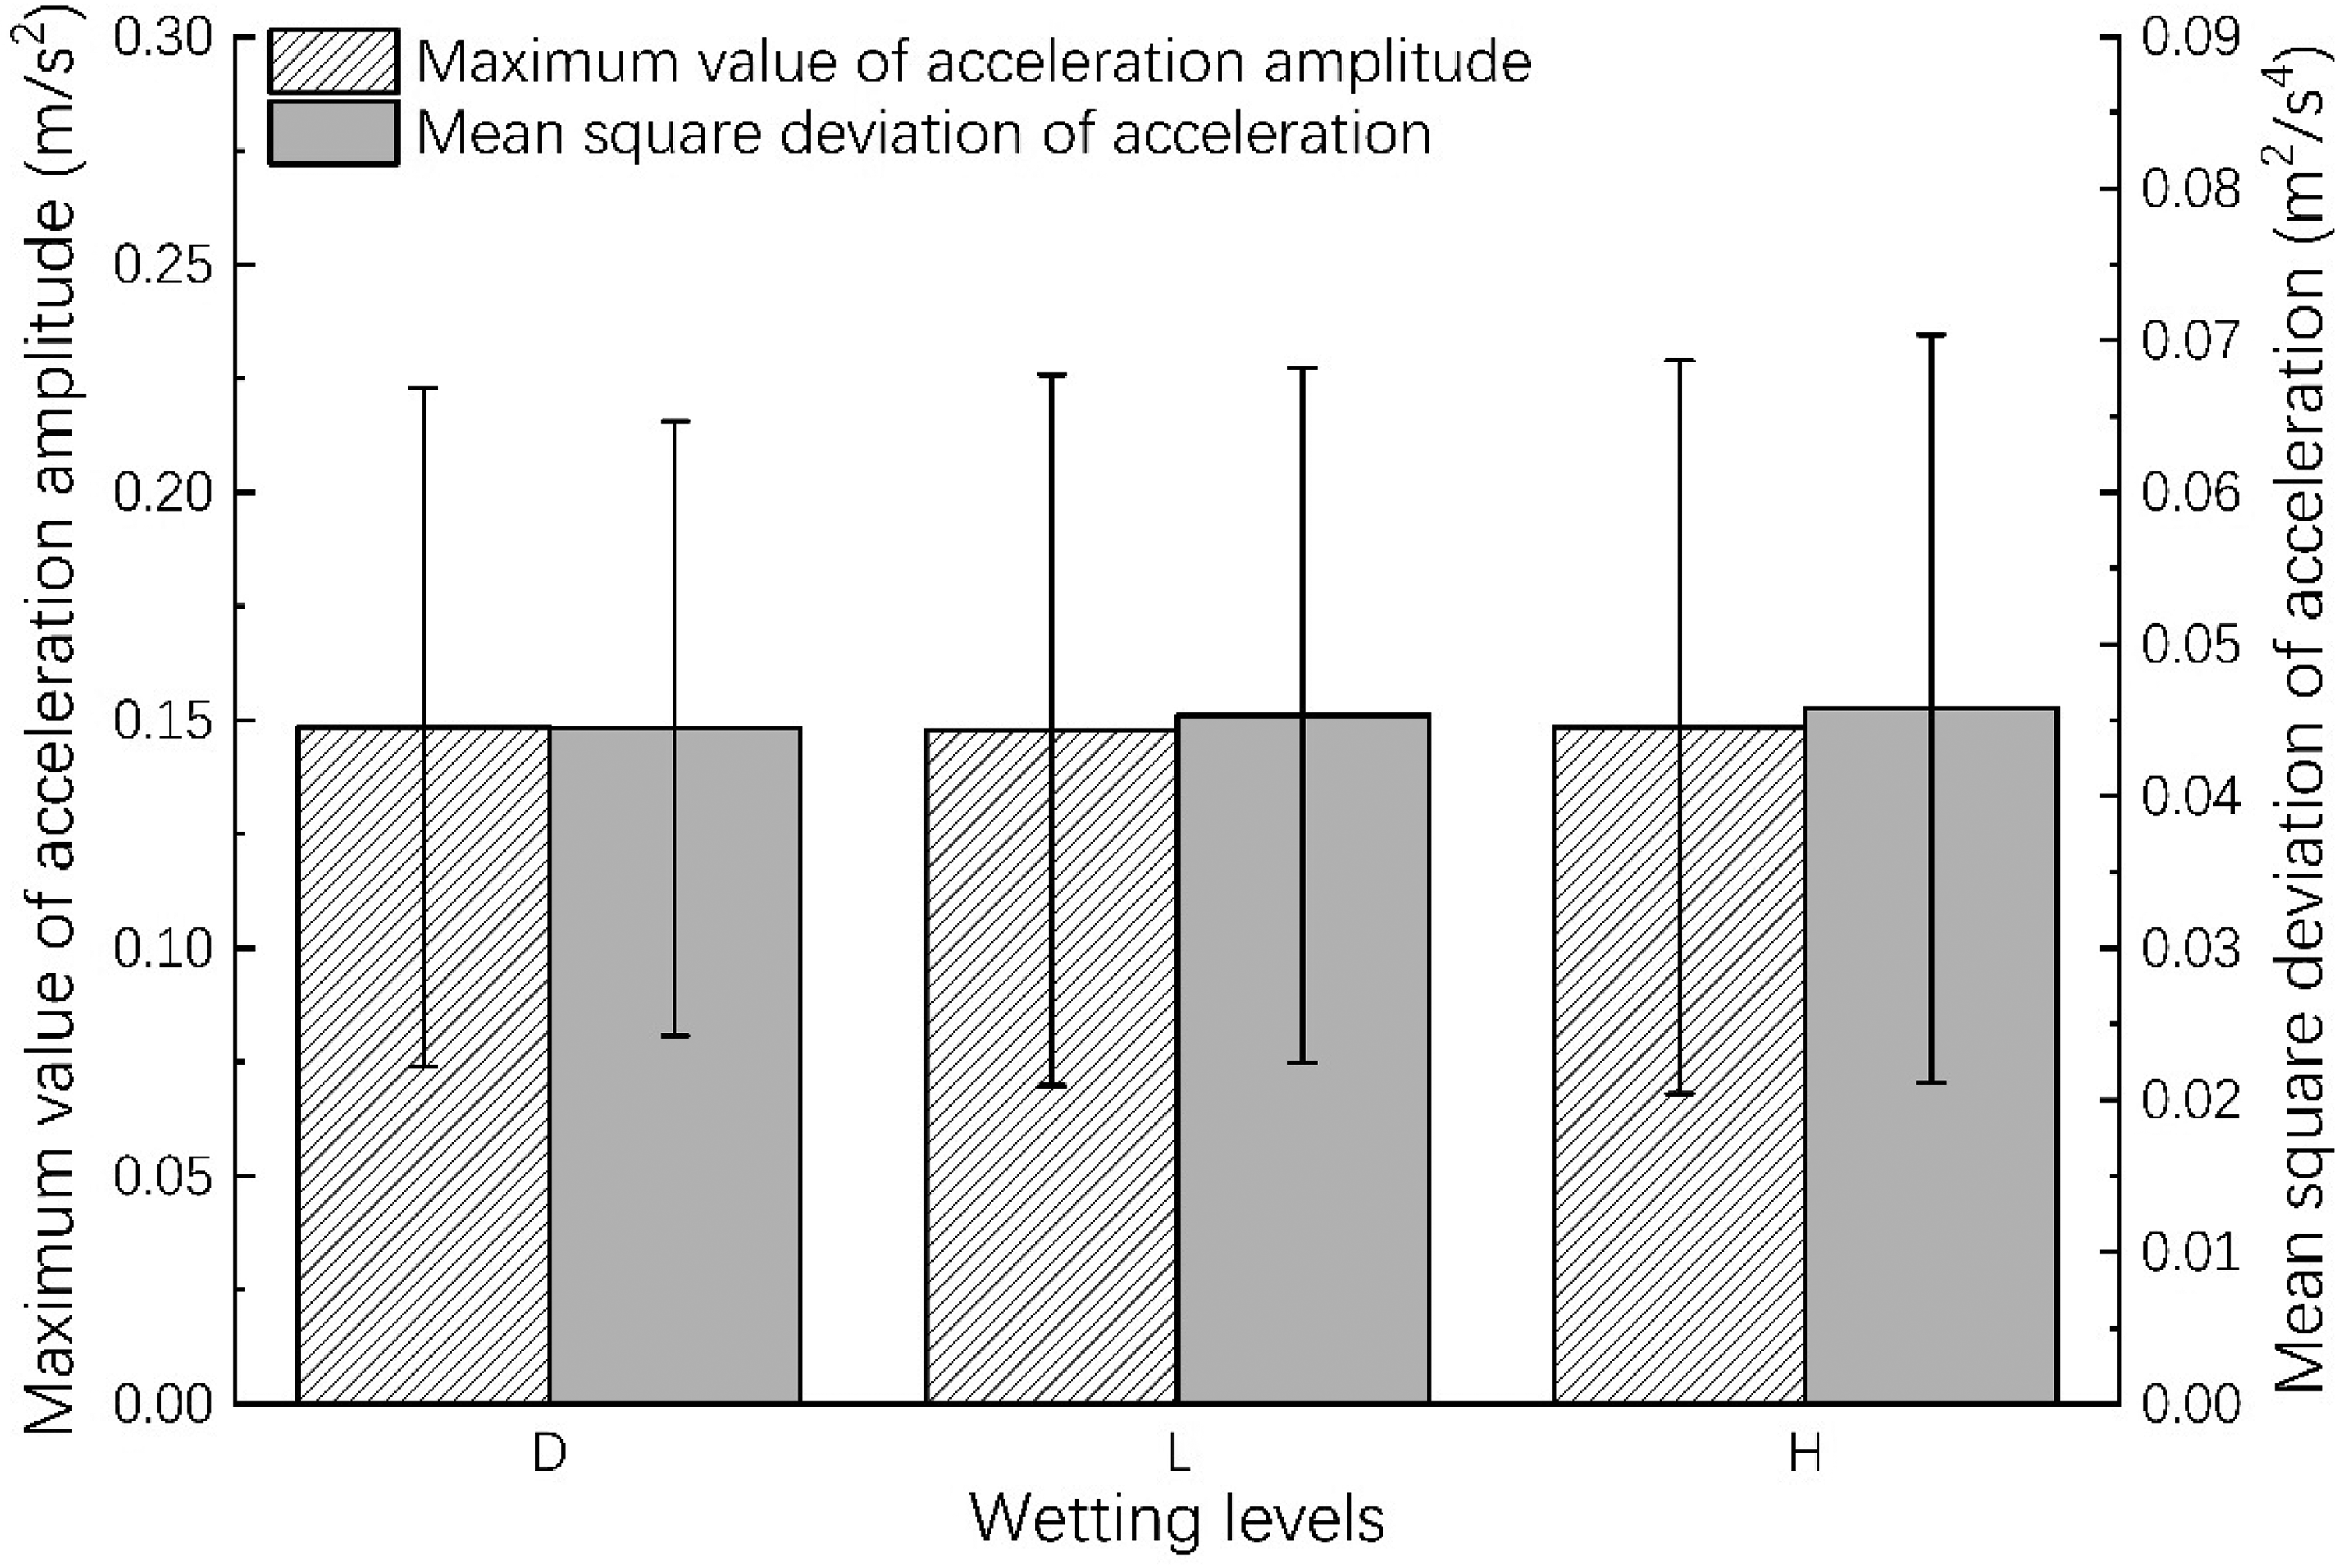
Maximum value of acceleration amplitude and mean square deviation of acceleration under different wetting levels. Note. D = dry (no additional water added); L = low wetting level (35% saturated water content); H = high wetting level (70% saturated water content). Error bars denote standard deviation.
Effects of Wetting Levels on the Tactile Perception
Wetness and Coldness Perception
The wetness (χ2(2, 240) = 472.63, p < .001) and coldness perception (χ2(2, 240) = 452.58, p < .001) were significantly different across three wetting levels (Figure 7). And wetness and coldness perception increased significantly with an increase in wetting. The Spearman's correlation coefficients between skin cooling rate and wetness and coldness perceptions were 0.781 and 0.757 (p < .001). Therefore, higher wetting levels caused greater skin cooling, which in turn led to stronger perceptions of wetness and coldness.
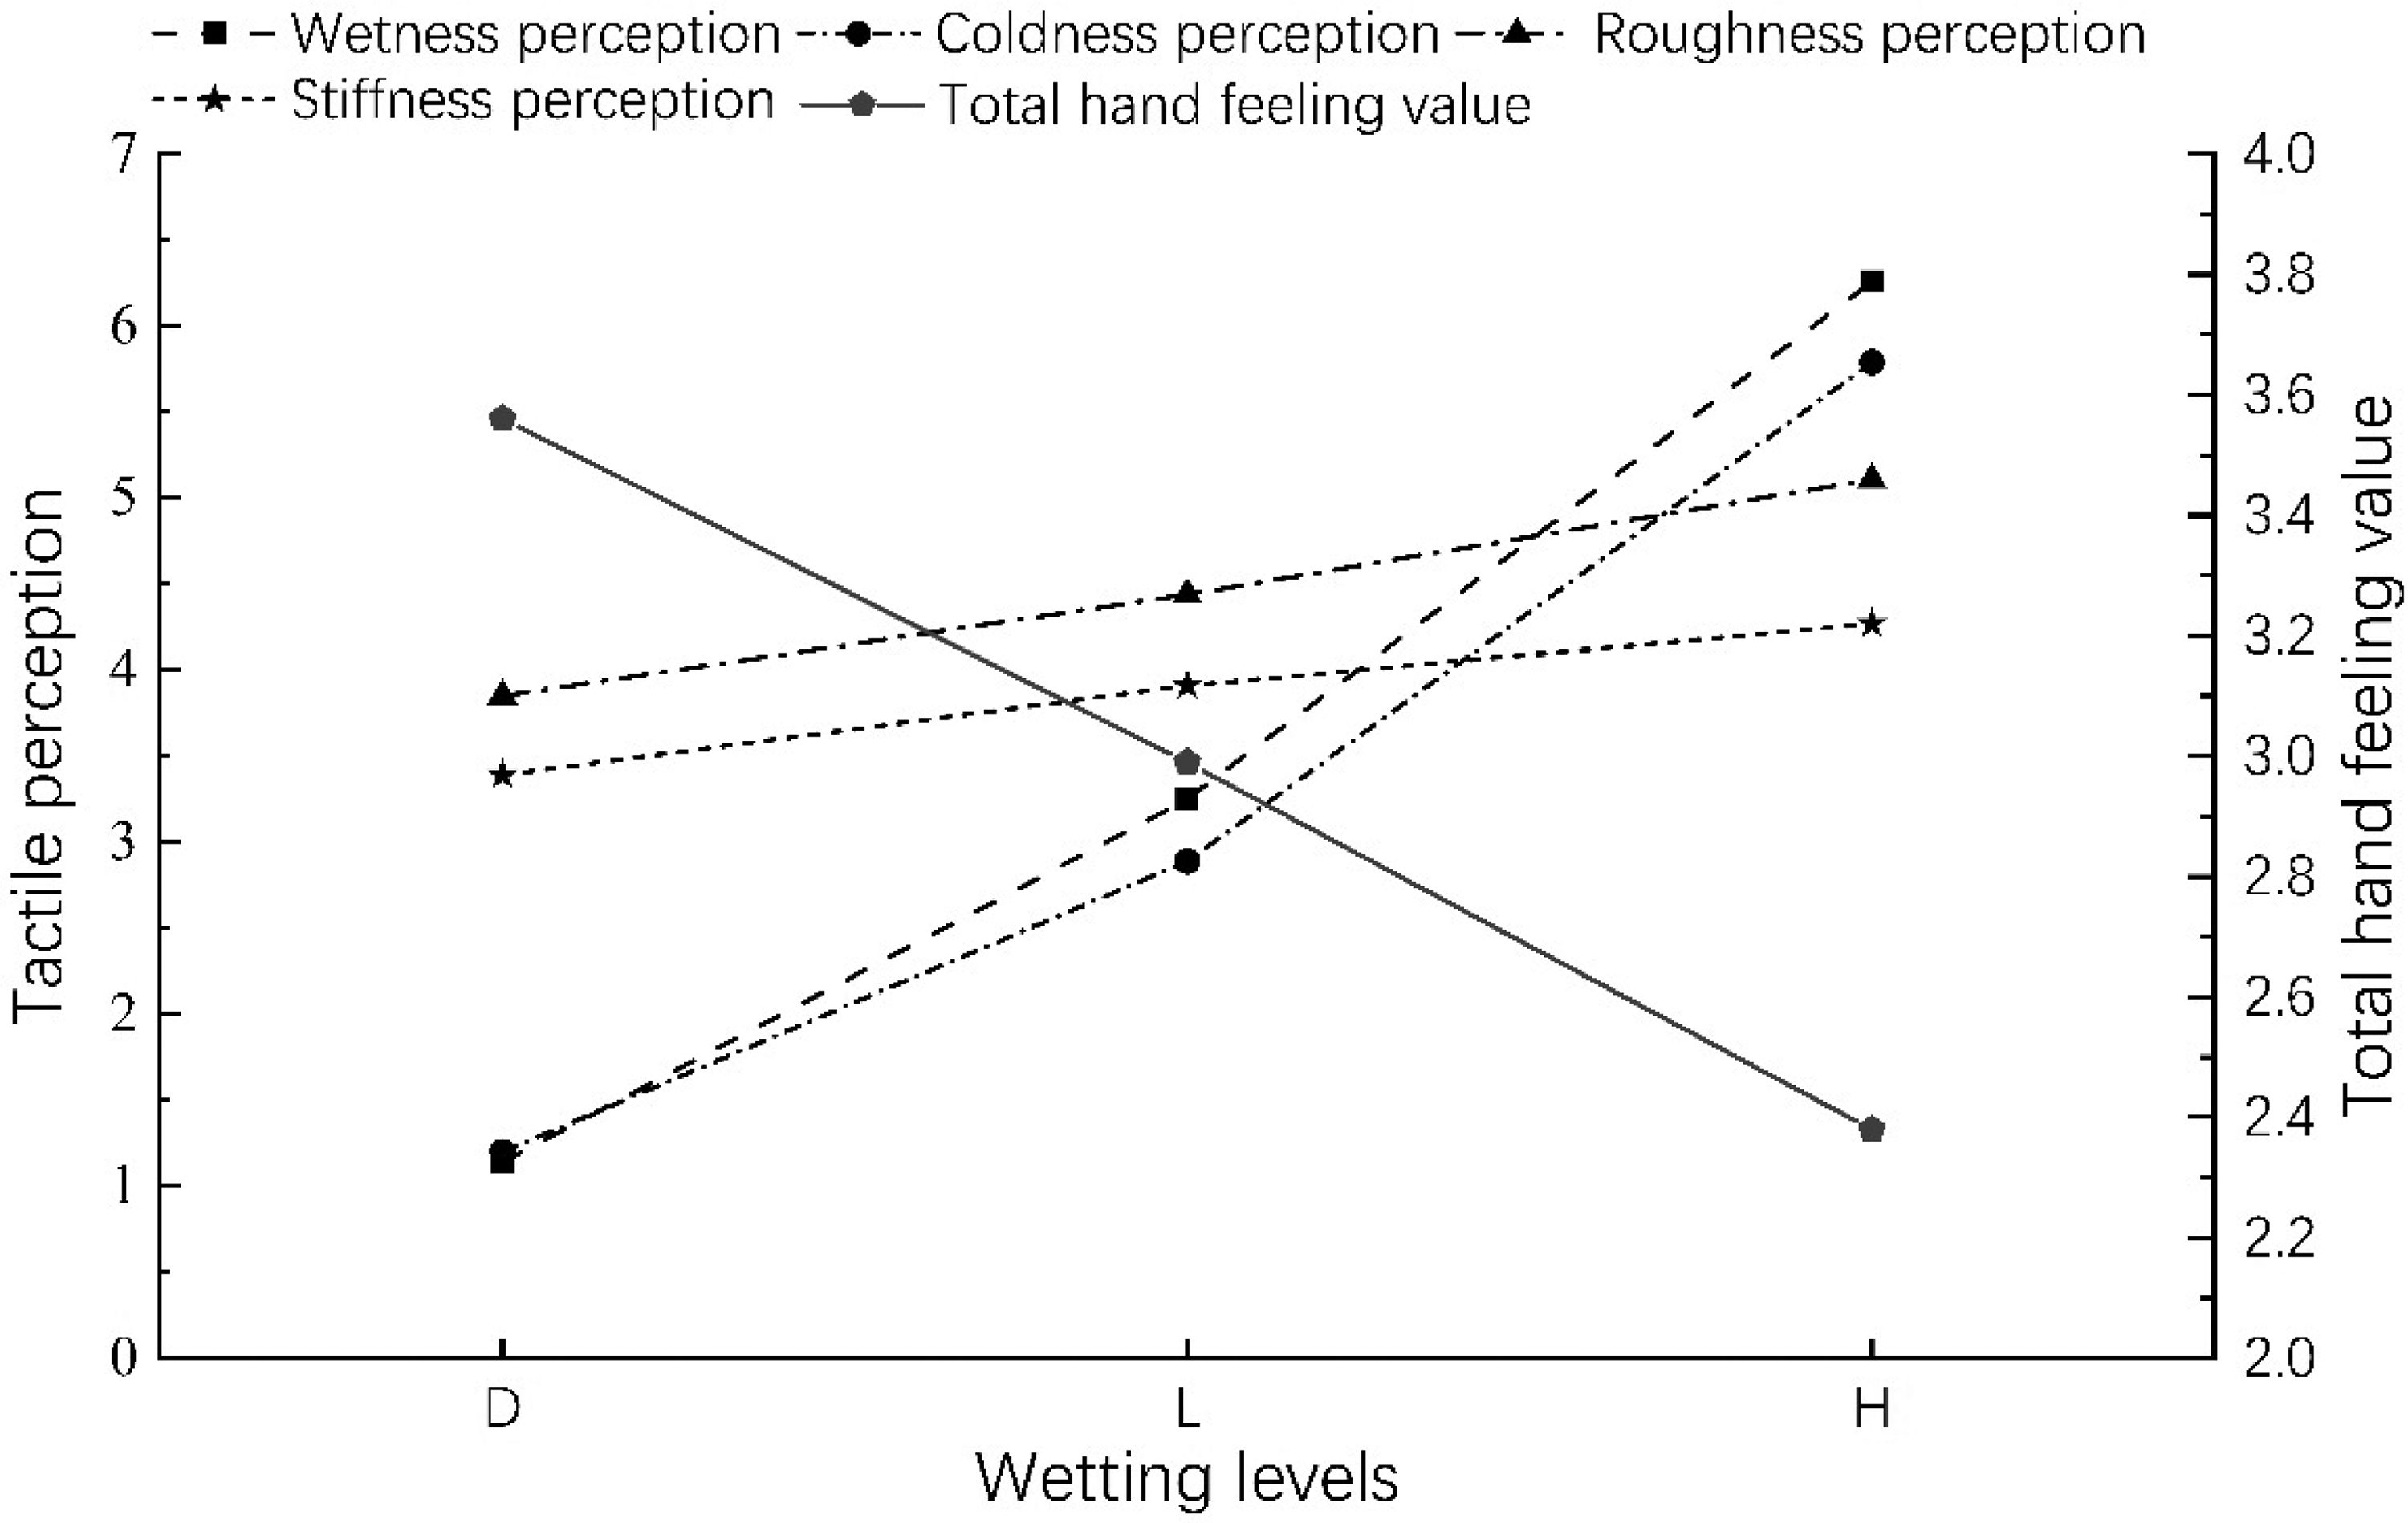
Tactile perception at different wetting levels. Note. D = dry (no additional water added); L = low wetting level (35% saturated water content); H = high wetting level (70% saturated water content).
Roughness Perception
The wetting levels produced statistically significant differences (χ2(2, 240) = 210.32, p < .001) in roughness perception, and the roughness perception increased significantly as the water content level increased (Figure 7), consistent with previous findings on the enhancement of texture sensation in wet fabric (Raccuglia et al., 2018). In this study, although the wetting level had no significant effect on the maximum value of acceleration amplitude, it had significant effects on roughness perception, which indicated that subjective perception was more sensitive than tactile physical parameters in perceiving roughness.
Stiffness Perception
The wetting levels produced statistically significant differences (χ2(2, 240) = 82.91, p < .001) in stiffness perception, and the stiffness perception significantly increased with the rising wetting level (Figure 7). A possible reason was that wet fabrics swelled due to moisture absorption, increasing the fabric thickness and significantly enhancing the stiffness perception (Asfand & Daukantienė, 2022).
Total Hand Feeling Value
The wetting levels produced statistically significant differences (χ2(2, 240) = 301.87, p < .001) in total hand feeling value. As the wetting level increased, the total hand feeling value decreased significantly (Figure 7). According to PLS regression, total hand feeling value = 8.26 − 0.26 × wetness − 0.12 × coldness − 0.66 × roughness − 0.27 × stiffness, and R2 = 0.709, RMSE = 0.637, with roughness having the strongest influence.
The Tactile Perception Predictive Model for Wet Fabrics
The effects of wetting levels on tactile physical parameters and tactile perceptions were analyzed above. To obtain complex relationships among fabric properties and predict tactile perception, the linear regression method and machine learning algorithm were employed to establish tactile perception predictive models.
Data Preparation
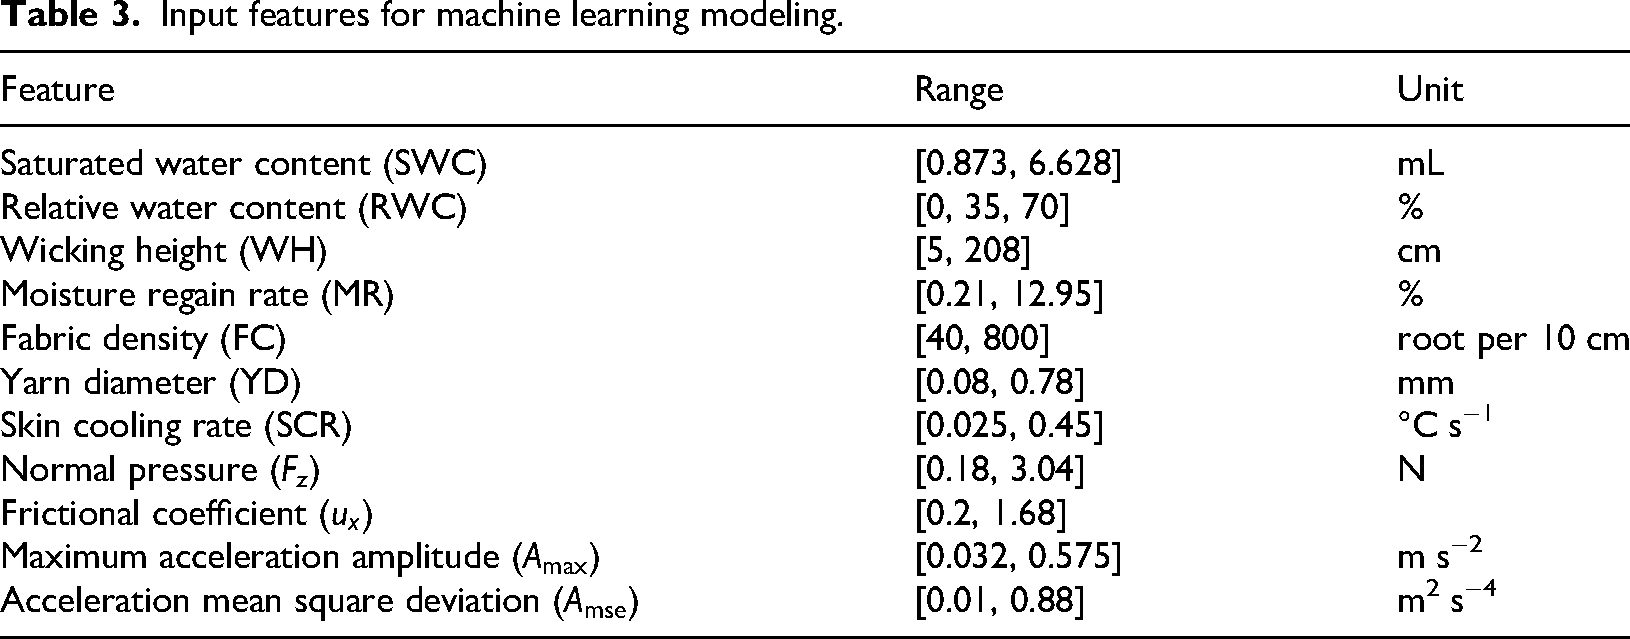
A total of 720 datasets (20 fabrics × 3 wetting levels × 12 participants) were collected. The input features included fabric properties and real-time personalized tactile interaction; the tactile parameters were recorded individually for each participant during the active touching process (Table 3), and model outputs were tactile ratings. To reduce scale differences among input features and improve the generalization ability of the model, the continuous variables were transformed into values ranging from 0 to 1. The data was randomly divided into two parts: 80% as the training set for model training and optimization, and 20% as the test set for model testing and performance evaluation.
Input features for machine learning modeling.
Predictive Performance of the Models
Table 4 presents the predictive performance of models. Based on the PLS regression model, regression models for tactile perceptions were obtained:
Predictive performance of the models (test set).
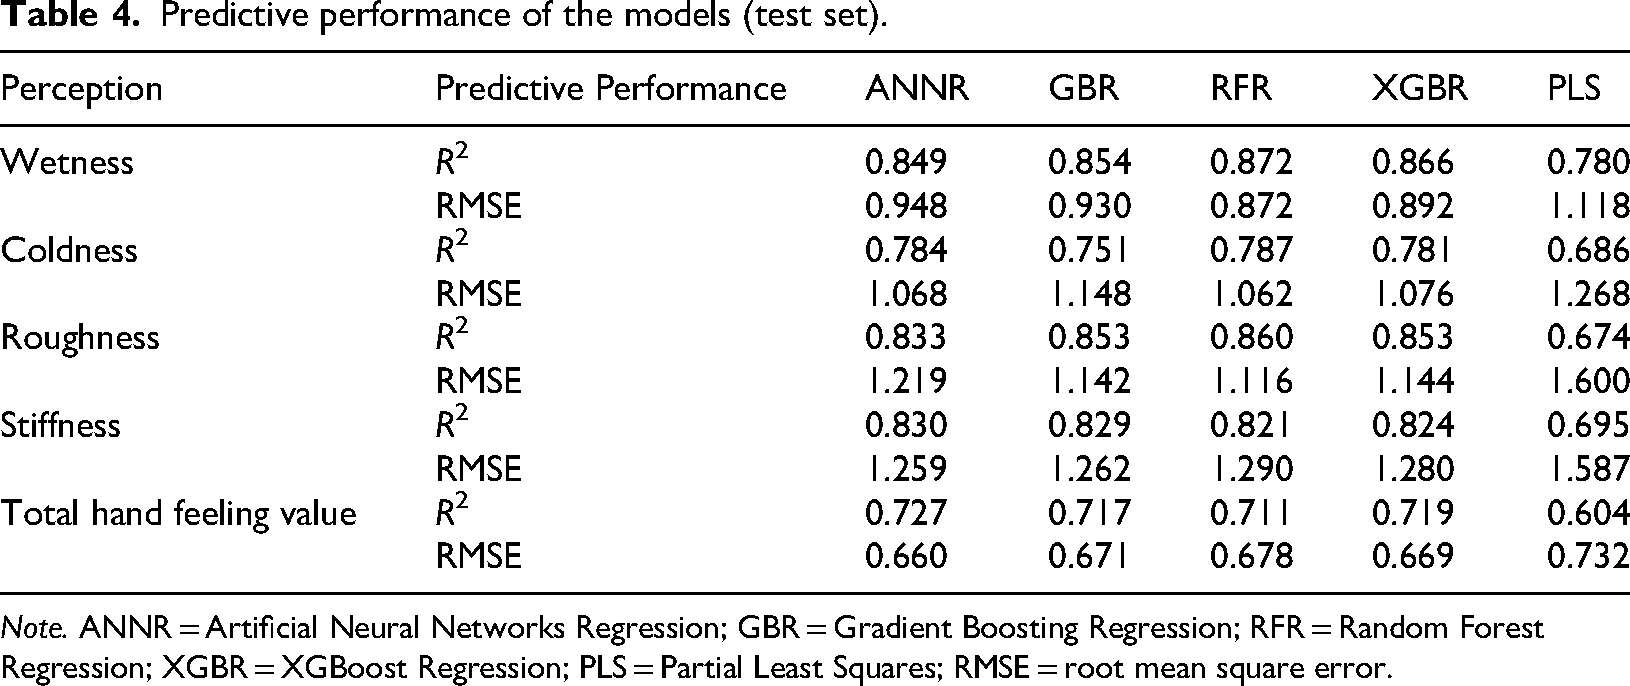
Note. ANNR = Artificial Neural Networks Regression; GBR = Gradient Boosting Regression; RFR = Random Forest Regression; XGBR = XGBoost Regression; PLS = Partial Least Squares; RMSE = root mean square error.
wetness = 1.65 × RWC − 0.44 × WH + 0.37 × SCR + 0.23 × ux − 0.23 × YD − 0.22 × MR − 0.18 × FC + 0.12 × Amse − 0.08 × SWC + 0.06 × Fz − 0.05 × Amax
coldness = 1.42 × RWC − 0.39 × WH + 0.32 × SCR + 0.32 × ux − 0.21 × MR − 0.20 × YD − 0.14 × SWC + 0.11 × Fz − 0.10 × FC + 0.10 × Amse − 0.07 × Amax
roughness = 1.00 × YD + 0.73 × MR + 0.66 × RWC + 0.63 × SWC + 0.47 × Amax − 0.46 × SCR + 0.24 × ux − 0.21 × FC + 0.19 × WH − 0.03 × Fz − 0.02 × Amse
stiffness = 1.19 × YD + 0.90 × SWC + 0.52 × Amax + 0.51 × MR + 0.43 × RWC + 0.24 × ux − 0.24 × SCR + 0.21 × Fz + 0.11 × WH + 0.11 × FC − 0.09 × Amse
total hand feeling value = −0.31 × RWC − 0.26 × YD − 0.21 × MR − 0.20 × ux − 0.19 × SWC − 0.18 × Amax + 0.17 × FC − 0.06 × SCR − 0.03 × Fz − 0.009 × Amse − 0.004 × WH However, the simple regression model exhibited the worst performance, indicating that linear models struggled to capture the complex relationship between input features and tactile perception, whereas machine learning demonstrated better performance.
For the wetness (RMSE = 0.872, R2 = 0.872) and coldness (RMSE = 1.062, R2 = 0.787) perception predictive models, the RFR exhibited the best predictive performance.
For the prediction of roughness perception, the RFR showed the best predictive performance (RMSE = 1.116, R2 = 0.860). For the stiffness perception predictive model, the ANNR achieved the lowest RMSE and highest R2 (RMSE = 1.259, R2 = 0.830).
In the models of total hand feeling value, the ANNR was the top-performing model (RMSE = 0.660, R2 = 0.727). Due to the influences of various subjective and objective factors, its prediction performance was lower than that of other perceptions.
Analysis of Key Factors Affecting the Tactile Perception
First, the SHAP method was used to evaluate each input feature's importance, and the absolute SHAP values were obtained and ranked. Since inputting all 11 features could introduce redundant information, the next dimensionality reduction was performed to simplify the model. Then, features were sequentially added to the model in the Section “Predictive Performance of the Models” in the descending order of absolute SHAP values (Liu & Yang, 2025) to obtain key features.
For wetness perception (Table 5), the model achieved a peak R2 of 0.884 and a minimum RMSE of 0.832 after inputting the first three features. Features ranked fourth and below failed to improve performance. Therefore, the key factors influencing the wetness perception were relative water content (RWC), wicking height (WH), and yarn diameter (YD).
Wetness perception feature importance ranking and model performance.
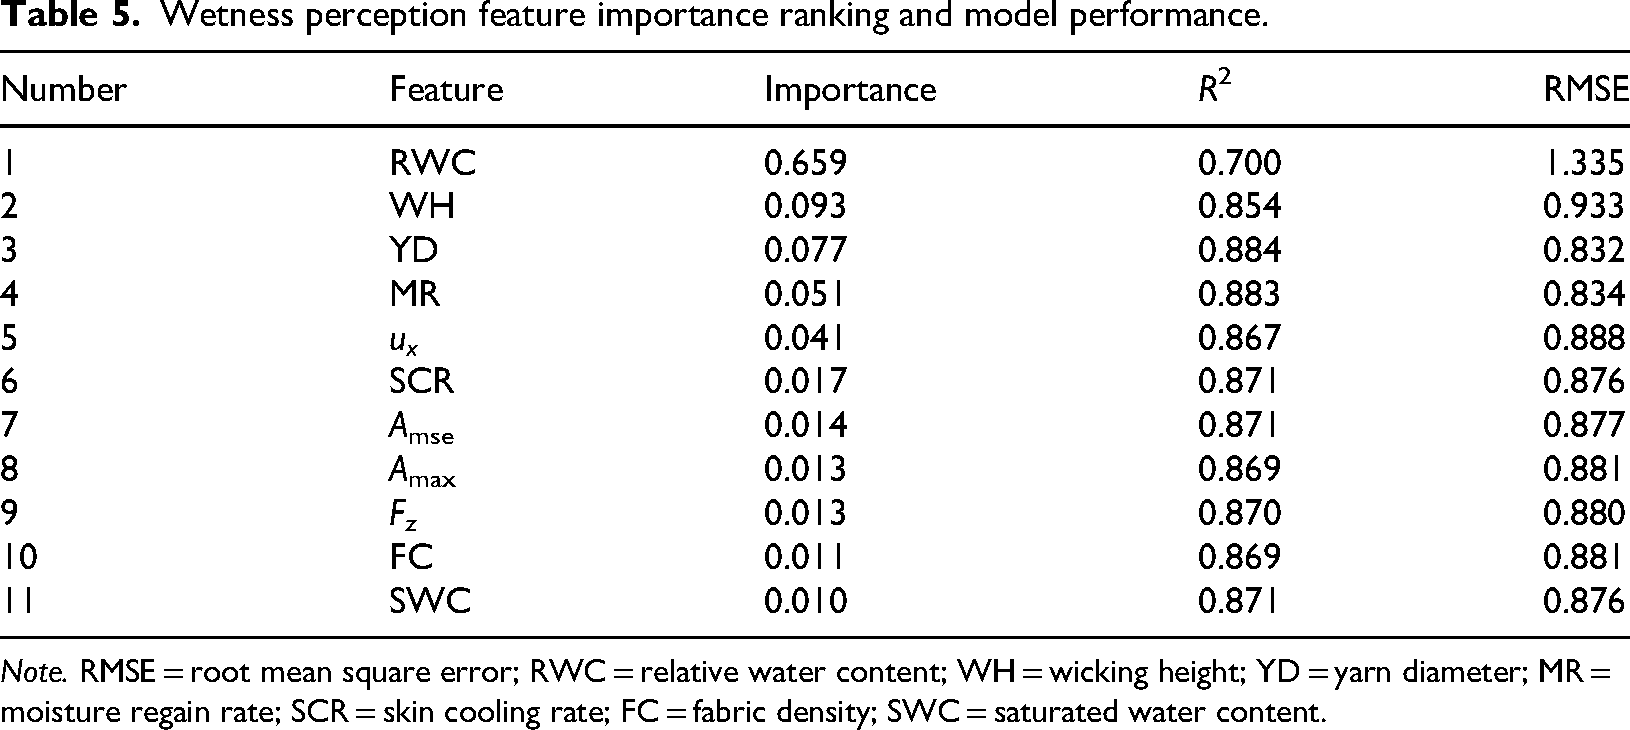
Note. RMSE = root mean square error; RWC = relative water content; WH = wicking height; YD = yarn diameter; MR = moisture regain rate; SCR = skin cooling rate; FC = fabric density; SWC = saturated water content.
For coldness perception (Table 6), the top three factors contributing to coldness perception were RWC, WH, and YD (R2 = 0.800, RMSE = 1.028), consistent with wetness perception. RWC had an importance value over 0.6, with other features having values below 0.1. This could be due to the wetting level affecting the fabric's thermal absorption coefficient, thereby significantly impacting the wetness and coldness.
Coldness perception feature importance ranking and model performance.
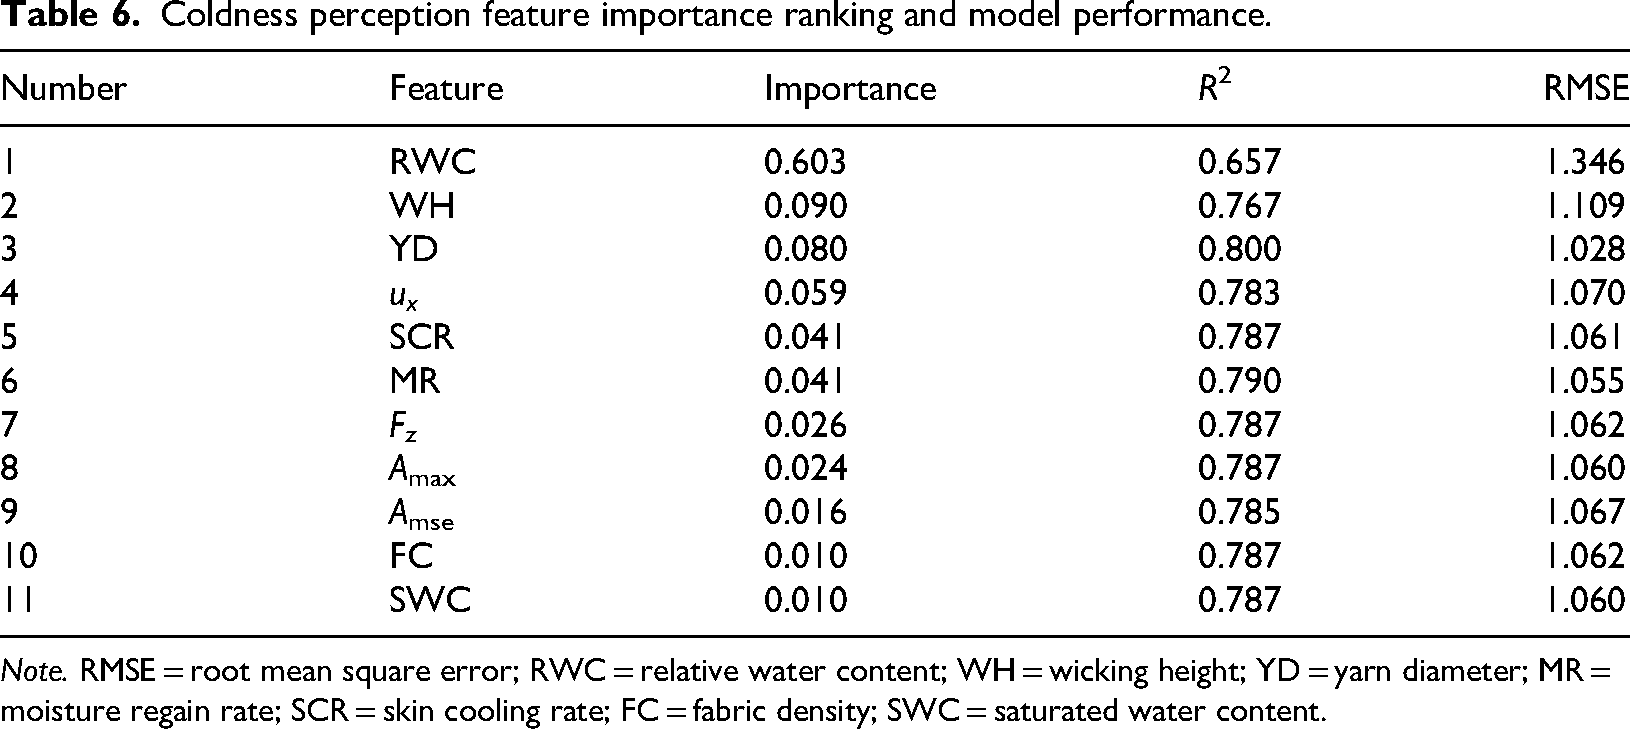
Note. RMSE = root mean square error; RWC = relative water content; WH = wicking height; YD = yarn diameter; MR = moisture regain rate; SCR = skin cooling rate; FC = fabric density; SWC = saturated water content.
For roughness perception (Table 7), features ranked 1 to 8 in importance were identified as the key factors (R2 = 0.859, RMSE = 1.118). It was observed that besides fabric properties, tactile parameters frictional coefficient (ux) and acceleration mean square deviation (Amse) were also key factors. This may indicate the impact of surface uniformity on roughness perception.
Roughness perception feature importance ranking and model performance.
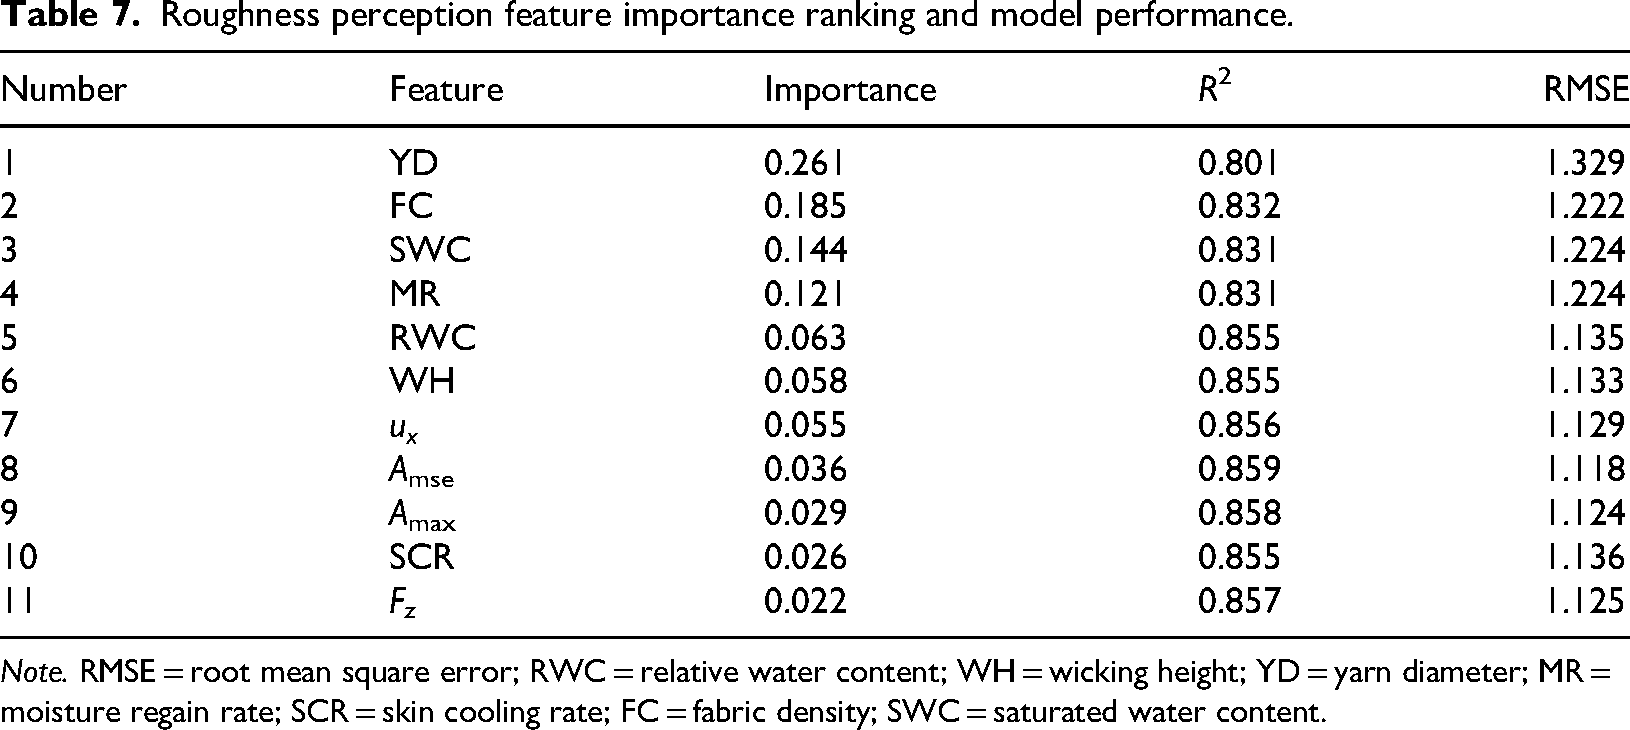
Note. RMSE = root mean square error; RWC = relative water content; WH = wicking height; YD = yarn diameter; MR = moisture regain rate; SCR = skin cooling rate; FC = fabric density; SWC = saturated water content.
The model's R2 for stiffness perception (Table 8) reached a peak of 0.787, with a minimum RMSE of 1.410 as the feature number increased from 1 to 9. Features ranked tenth and below had importance values less than 0.02 and did not enhance performance. The results showed that, besides fabric properties, tactile parameters frictional coefficient (ux) and maximum acceleration amplitude (Amax) were also key factors. Therefore, tactile parameters should not be overlooked for roughness and stiffness.
Stiffness perception feature importance ranking and model performance.
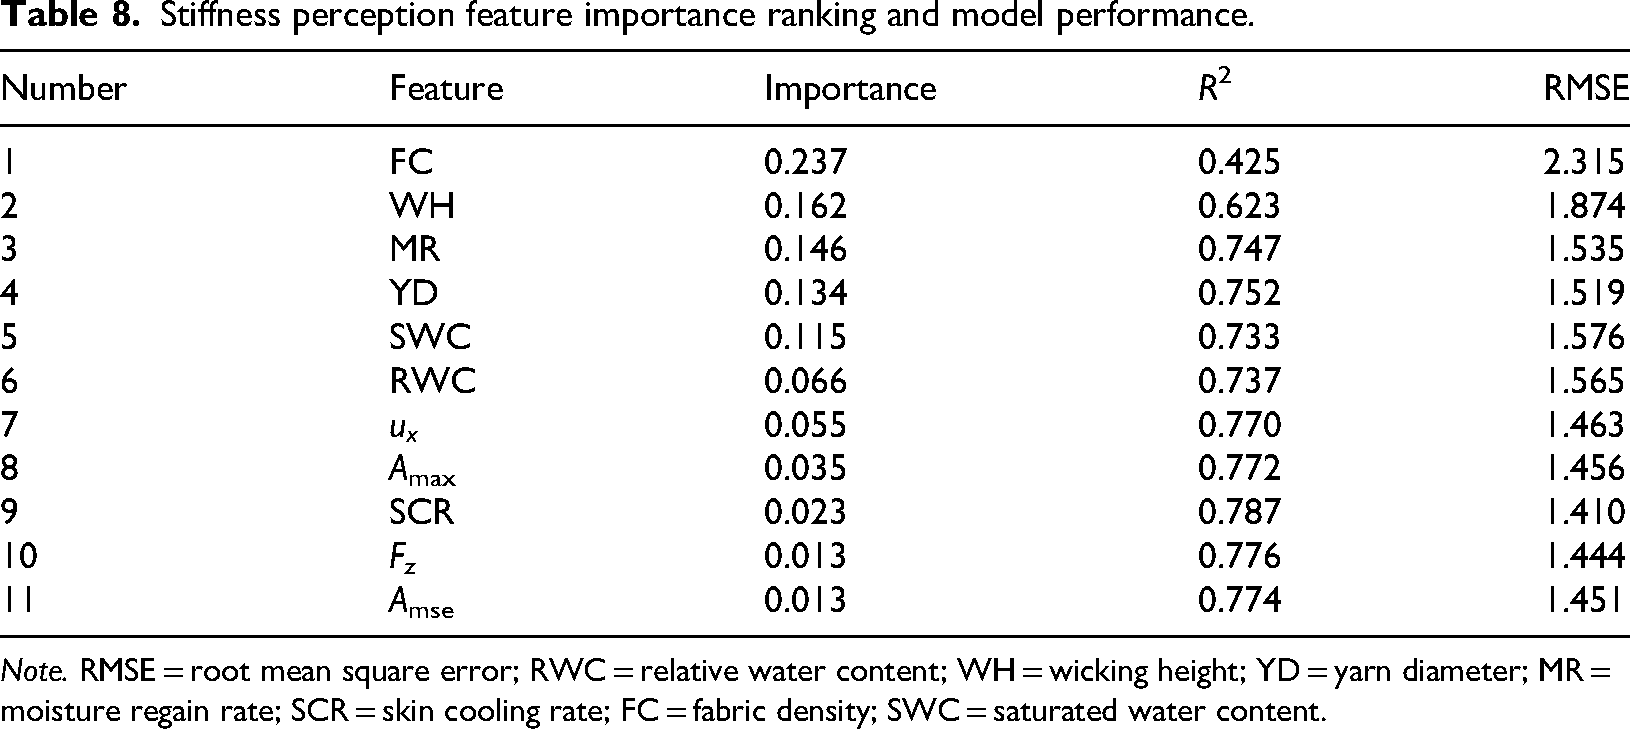
Note. RMSE = root mean square error; RWC = relative water content; WH = wicking height; YD = yarn diameter; MR = moisture regain rate; SCR = skin cooling rate; FC = fabric density; SWC = saturated water content.
As the number of features increased from 1 to 8, the total hand feeling value model's R2 reached a peak of 0.72, and the RMSE minimized to 0.667 (Table 9). Therefore, the key factors influencing the total hand feeling value were determined to be the top eight features. The rankings for ux and Amax were higher than those for other perceptions. Possibly, because participants actively touched the fabric during the experiment, this revealed individual touching in perception strategies, indicating the importance of interactive touch in total hand feeling evaluation and providing deeper insights for textile design. The results also highlighted the complex interplay of multiple factors influencing total hand feeling, as well as the importance of adding tactile physical parameters during the interaction process to predict total hand feeling value
Total hand feeling value feature importance ranking and model performance.
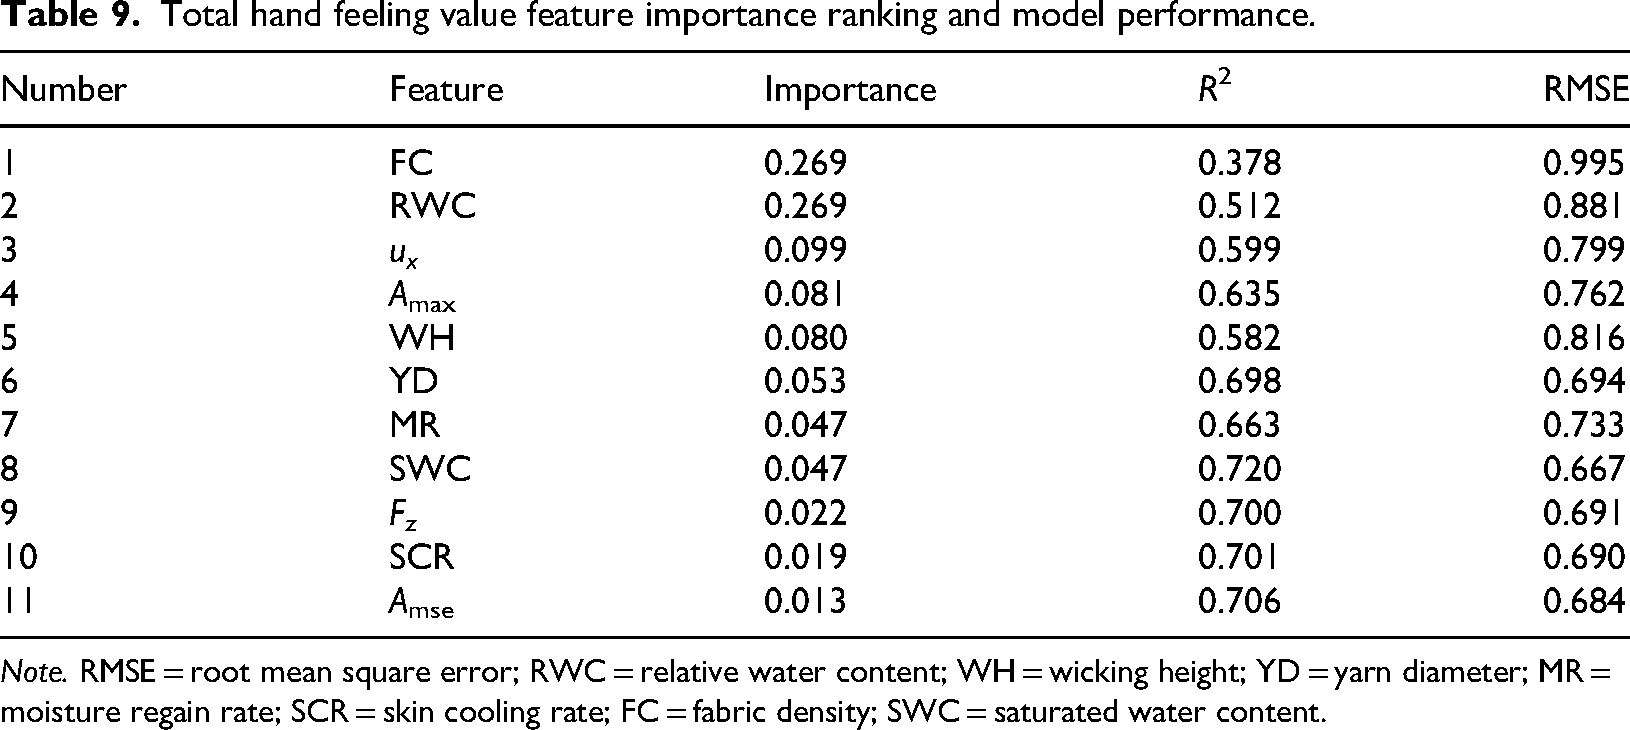
Note. RMSE = root mean square error; RWC = relative water content; WH = wicking height; YD = yarn diameter; MR = moisture regain rate; SCR = skin cooling rate; FC = fabric density; SWC = saturated water content.
Discussion
Key Factors Influencing Total Hand Feeling Value of Wet Fabrics
Most studies currently use KES to measure the mechanical properties of fabrics, then establish hand value evaluation models based on these properties (Tadesse, Chen et al., 2019). However, KES is expensive and complex, and it cannot simulate the realistic skin touch conditions. In contrast, in this study, the basic properties of fabrics (no requirement for KES testing) and tactile physical parameters during interactive touching were combined to establish predictive models for wet fabric perception. The total hand feeling value predictive model's R2 reached 0.72, which could be useful for solving high-cost and time issues, making it more suitable for realistic applications.
When fabrics contain water, their thermal conductivity increases and surface properties change, which eventually affects tactile perception. Tang et al. (2018) analyzed the regression relationship between fabric moisture levels and stickiness perception, finding that over 82.8% of the stickiness variation was due to increased fabric water content. They also found that wetness perception scores decreased as fabric dryness increased (Chau et al., 2018). In this paper, significant effects (p < .001) of the wetting levels on tactile perception were also found in the Section “Effects of Wetting Levels on the Tactile Perception.” However, previous studies have less considered modeling the tactile perception of wet fabrics. To quantify the significant role of water content in tactile perception, our previous study (Ding & Zhang, 2026) established a predictive model of wet fabrics for wetness perception with an R2 of 0.904 and found that the top two factors influencing the wetness perception were RWC and WH, consistent with the Section “Analysis of Key Factors Affecting the Tactile Perception.” But our previous work only explored the wetness perception without establishing a total hand feeling value predictive model. In this study, we found that the total hand feeling values of wet fabrics were significantly lower than those of dry fabrics, and RWC ranked the second in feature importance. Moreover, among the top eight features in importance ranking, the key factors ux (Suganuma, 2025), WH, YD (Lu et al., 2022), MR, and SWC were closely related to fabric water content, indicating the important influence of water content on total hand feeling value.
Furthermore, the impact of mechanical stimulation of the skin on fabric hand feeling must be considered. Izu et al. (2021) employed multiple regression analysis to investigate the effects of mechanical stimulations of skin (skin vibration and friction) on tactile perception, finding that the friction affected comfort evaluation, while skin vibration influenced preference. In this study, we also found that in the total hand feeling value predictive model, the key factors FC, ux, and Amax were in the top four features in importance ranking, highlighting the significant influence of mechanical cues on the total hand feeling evaluation.
Additionally, the water content of the fabric also affected the mechanical stimulation of the skin. Previous studies showed that the frictional coefficient can characterize the surface comfort of fabrics (Chen et al., 2015), and the effect of varying water content on mechanical stimulation further affected tactile perception (Merrick et al., 2022). Therefore, our study integrated the real-time interactive effects of water content and mechanical parameters on total hand feeling. We also observed the influence of the wetting level on ux; higher wetting level significantly increased ux (Figure 5). Both water content and ux were key factors in the total hand feeling value predictive model (Table 9). These findings highlighted the importance of collecting real-time tactile physical parameters of wet fabrics for establishing predictive models, which could provide a theoretical reference for smart prosthetics signal collection to output sensory evaluations.
Sensitivity Differences among Different People
Individual tactile sensitivity and experience significantly influenced the perception of textile quality (Mehta et al., 2024). And research by Ye et al. (2023) also classified participants into three types (extraordinary, ordinary, and nonsensitive) based on their electroneurophysiological responses during skin–fabric contact. During the experiment, we indeed found that individual differences influenced the total hand feeling values. We employed principal component analysis and K-means clustering methods; participants were clustered based on their total hand feeling values (Sagara et al., 2022), resulting in three groups (Figure 8).
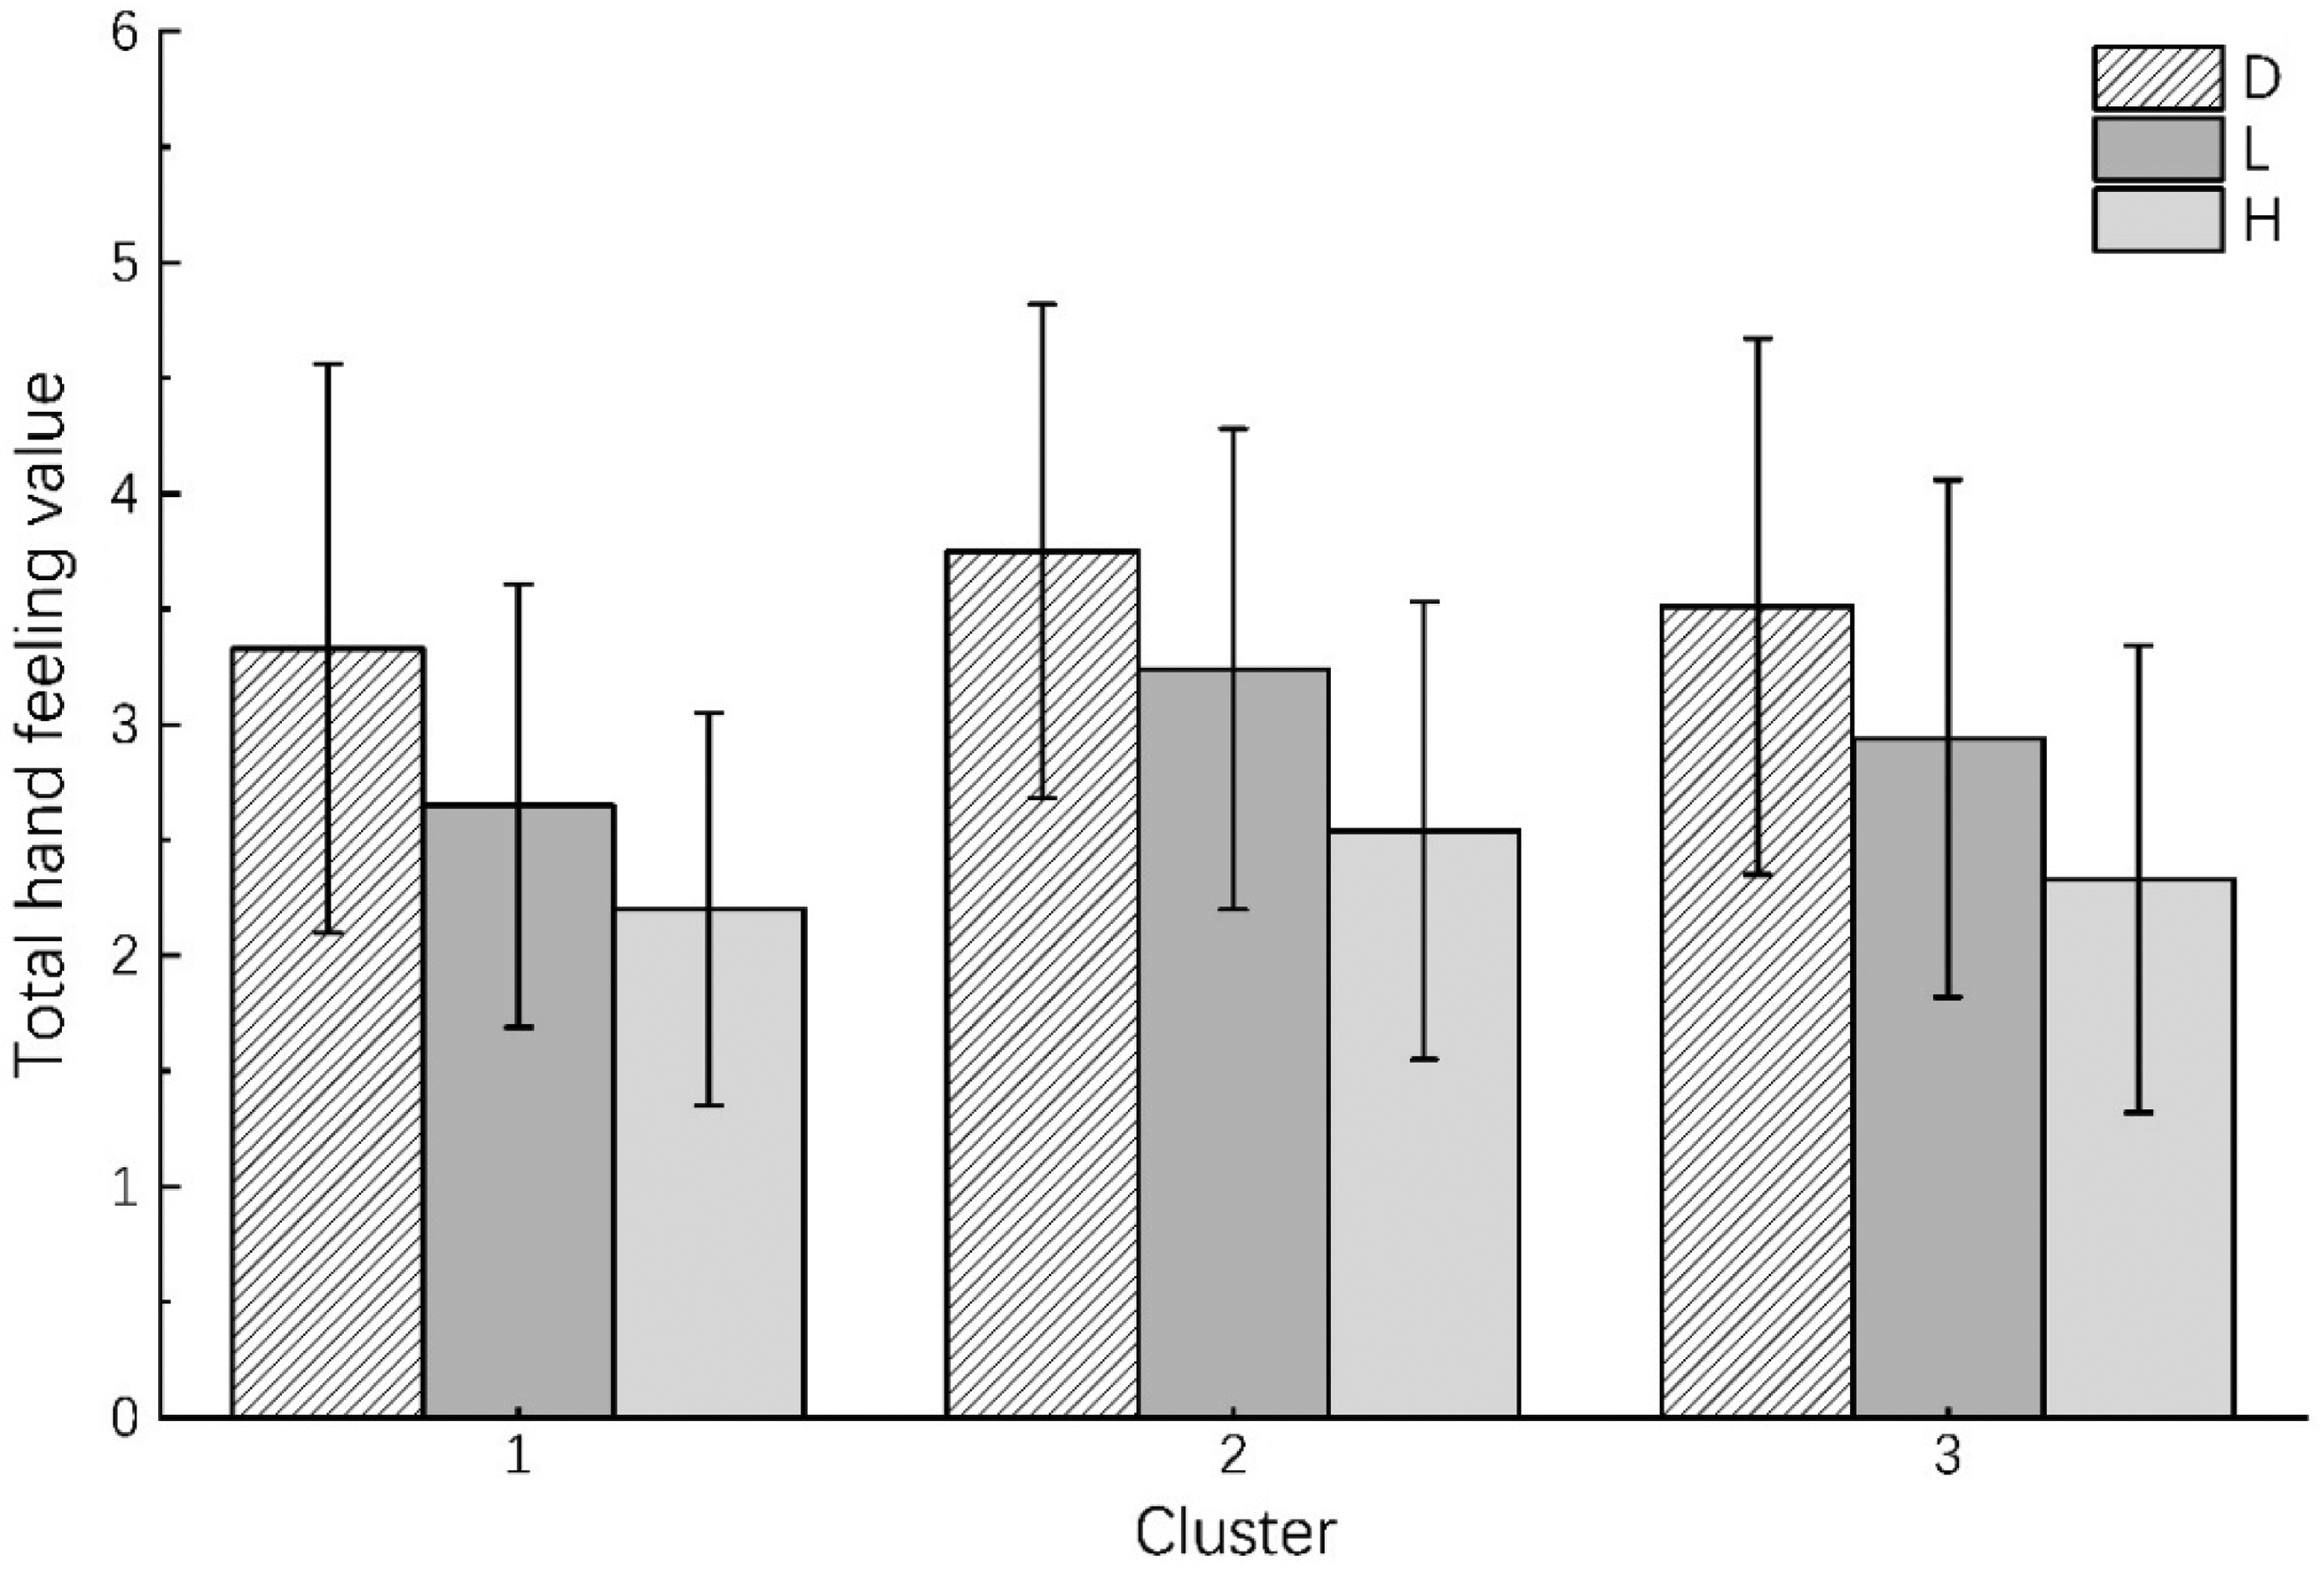
Total hand feeling value at different clusters. Note. D = dry (no additional water added); L = low wetting level (35% saturated water content); H = high wetting level (70% saturated water content). Error bars denote standard deviation.
Among the 12 participants, cluster 1 included two participants; their total hand feeling values were the lowest among the three groups. And their relative decreasing rates in total hand feeling values from D to L (20.4%) and from D to H (33.9%) were the highest, showing that this group was the most sensitive and most prone to discomfort. Cluster 2 included four participants, with the highest total hand feeling values. Their relative decreasing rates from D to L (13.6%) and from D to H (32.3%) were the lowest, indicating that this group was the most insensitive and had the highest tolerance for total hand feeling. Cluster 3 had the largest number (six participants, 50%), with sensitivity levels between the first two clusters, representing most ordinary participants. The existence of participants at the two extremes of sensitivity explained the importance of individual differences. However, only 12 participants in this experiment resulted in fewer participants in each cluster. This was one of the reasons that the total hand feeling model had limited predictive accuracy (R2 = 0.727). Future studies should expand the sample size to minimize the effects of individual sensitivity differences.
Furthermore, female participants’ total hand feeling values were significantly higher than male participants by the Mann–Whitney U test (p < .05), indicating that female participants tended to give higher ratings (Figure 9). Female participants had larger relative decreasing rates from D to L (16.2%) and from D to H (34.3%) than male participants, showing that female participants were more sensitive to the stimulus of wet fabrics. These could be due to sex differences in tactile spatial acuity (Peters et al., 2009) and skin biophysical properties (Firooz et al., 2012). These results confirmed that sex differences are also a key factor influencing total hand feeling value.
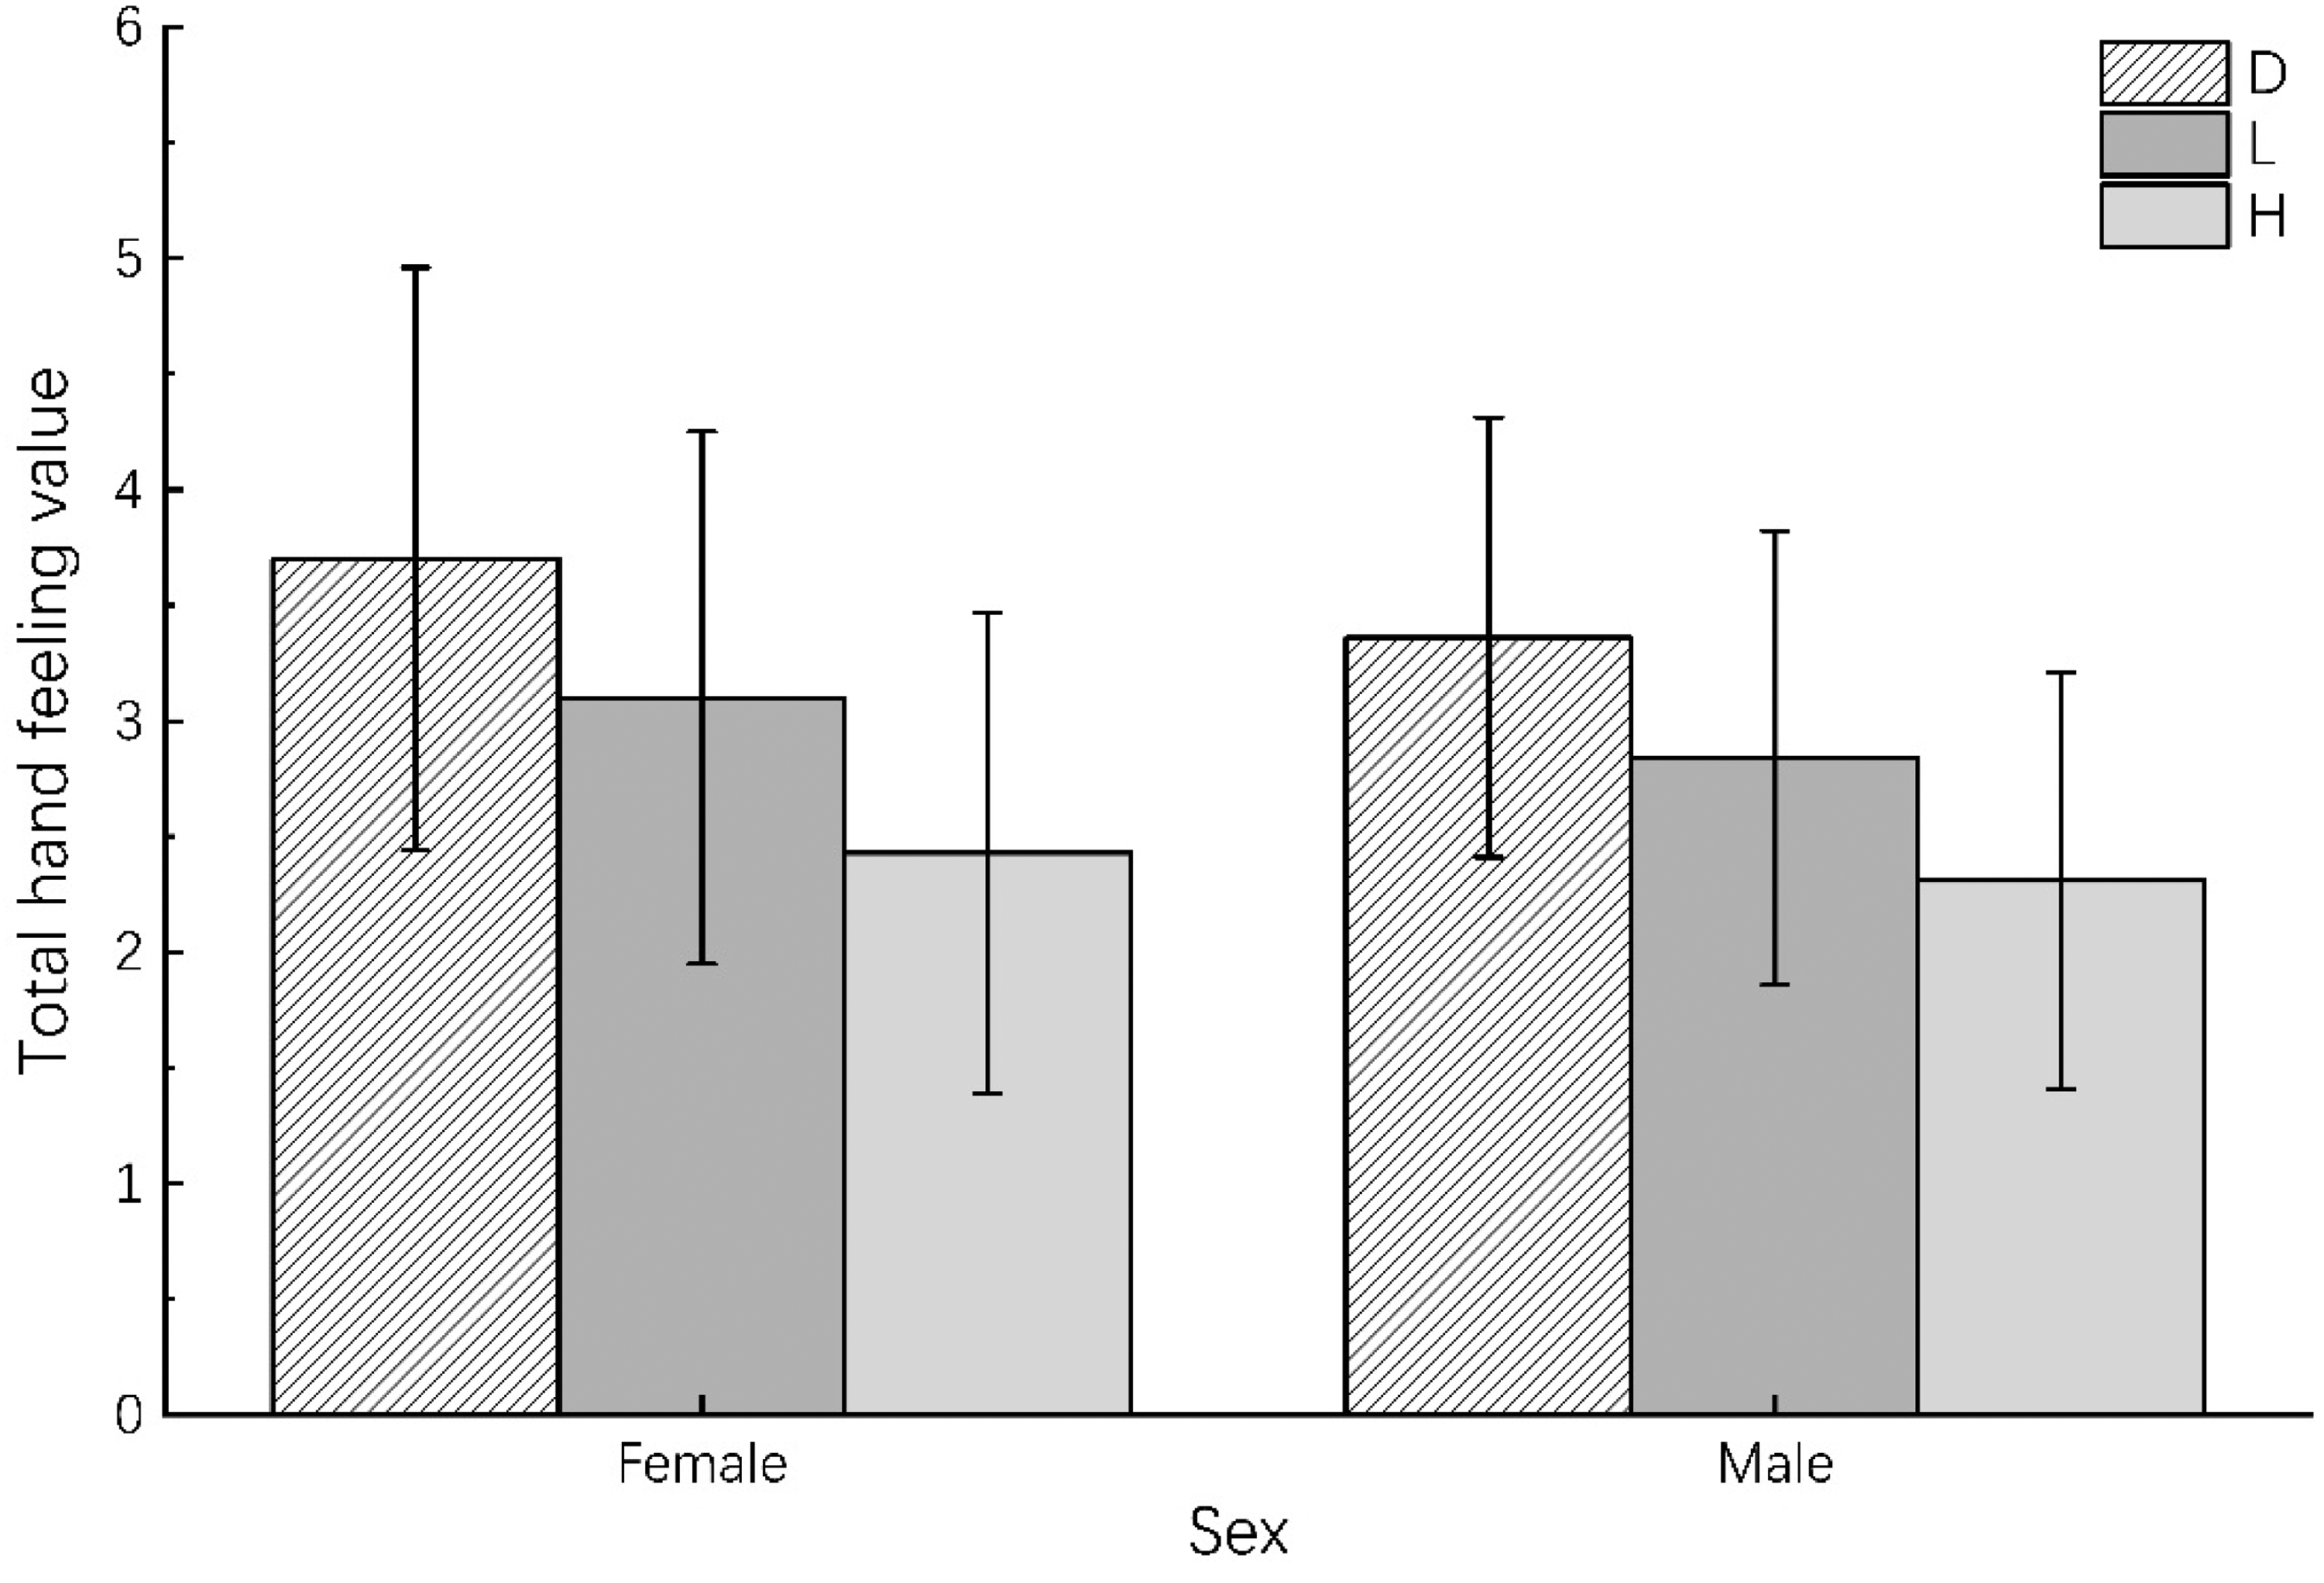
Total hand feeling value under different sexes. Note. D = dry (no additional water added); L = low wetting level (35% saturated water content); H = high wetting level (70% saturated water content). Error bars denote standard deviation.
Limitations
In this study, the fiber types examined were limited. Future research should expand the fabric types and quantities covering different fiber types, weave structures, thicknesses, and weaving methods to improve model accuracy and generalizability, and further investigate the influence of fabric properties on tactile perception. Additionally, although the predictive model demonstrated good performance, individual differences in tactile perception should not be overlooked. Future studies could increase the number of participants, including participants with different preferences, backgrounds, and ages, to enhance predictive accuracy.
Conclusions
This study collected real-time tactile physical parameters during finger–fabric interactions, and combined with the basic physical properties of fabrics, established objective predictive models for wetness, coldness, roughness, stiffness, and total hand feeling value. The effects of wetting level on the tactile physical parameters and subjective tactile perceptions were analyzed. The SHAP method was employed to explore key factors influencing tactile perceptions.
The results deepen the understanding of the effects of fabric water content on tactile perception, particularly on the total hand feeling value, and emphasize the important influence of real-time tactile physical parameters on total hand feeling value. The results revealed that in the predictive model (R2 = 0.727, RMSE = 0.66) for total hand feeling value, the eight key influencing factors were FC, RWC, ux, Amax, WH, YD, MR, and SWC. The study provides an objective method for quantifying multiple tactile perceptions of wet fabrics. And the findings offer a scientific basis for textile design and the tactile optimization of product design, such as flexible wearable devices and smart prosthetics.
Footnotes

Author Contribution(s)
Funding
The authors disclosed receipt of the following financial support for the research, authorship, and/or publication of this article: This work was supported by the MOE (Ministry of Education in China) Project of Humanities and Social Sciences (No. 23YJAZH209) and Fundamental Research Funds for the Central Universities (No. 2232024B-03).
Declaration of Conflicting Interests
The authors declared no potential conflicts of interest with respect to the research, authorship, and/or publication of this article.