
Abstract
The study thoroughly investigated the hot deformation behavior and microstructure evolution of superaustenitic stainless steel S31254. Hot compression tests were conducted at temperatures ranging from 950 °C to 1200 °C and strain rates of 0.01–10 s−1. The flow behavior of S31254 is influenced by adiabatic heating, particularly at high strain rates. The critical conditions of dynamic recrystallization for various deformation conditions were calculated based on the “double differential method.” An rise in deformation temperature or a reduction in strain rate reduces critical stress. Using the Arrhenius equation and Zener-Hollomon parameter to represent the deformation parameters, a linear connection between peak stress and dynamic recrystallization critical conditions was determined. Electron backscattering diffraction and transmission electron microscopy were used to characterize the microstructure under various deformation conditions. The dynamic softening of superaustenitic stainless steel is mainly achieved through dynamic recrystallization. The recrystallized grains are driven by distorted energy to nucleate preferentially at high-angle grain boundaries and grow towards high misorientations. Discontinuous dynamic recrystallization characterized by grain boundary bowing out is the main recrystallization mechanism in S31254. However, at high temperatures and low strain rates (1200 °C, 0.01 s−1), the dynamic recrystallization process shifts from discontinuous to continuous, with subgrain coalescence serving as the nucleating mode.
This is a visual representation of the abstract.
Keywords
Introduction
Superaustenitic stainless steels (SASS) contain more alloying elements than conventional austenitic steels and have better corrosion resistance and mechanical properties, and are therefore employed in a large number of industries with harsh service environments, such as nuclear power, aerospace, exhaust gas purification, and chemical processing.1–4 High alloying leads to high heat distortion resistance and deterioration of hot working properties in SASS.5–7 The presence of severe segregation and coarse solidification in the continuous casting billets of SASS further increases the tendency to hot deformation cracking. 8 Thermal deformation is an essential production route for manufacturing a wide range of products, so improving the thermal processability of SASS is a major concern in the industry.
The strain, deformation temperature, and strain rate are significant parameters that affect the evolution of microstructure during thermal processing, and they are frequently used to create constitutive equations characterizing the flow behavior of alloys.9,10 The Arrhenius model is widely employed to characterize the flow behavior of alloys due to its simple formulation and suitability of deformation parameters. Guo et al. 11 developed an Arrhenius model for 316 N, which accurately predicts its thermal deformation behavior. Mirzaei et al. 7 constructed a constitutive equation for Sanicro-28 SASS at low strain rates and temperatures of 800 °C–1100 °C to accurately predict the flow behavior of the material. Liu et al. 12 compared three Arrhenius models for the rolled S31254 and concluded that recrystallization occurs more frequently under low strain rate and high-temperature conditions. However, there is still a lack of research on the establishment and analysis of constitutive equations for homogenized S31254 billets, especially through empirical models that correlate flow stress data with dynamic recrystallization (DRX).
Previous studies have revealed13–16 that the lower stacking fault energy (SFE) makes it more difficult for dynamic recovery to happen in austenitic stainless steels, and the softening during thermal deformation relies mainly on DRX. Metals have two distinct DRX mechanisms: continuous DRX (CDRX) and discontinuous DRX (DDRX). 17 DDRX nucleates through strain-induced grain boundary migration (SIBM), in which subgrains arch out on high-angle grain boundaries (HAGBs) during crystal growth, which is accompanied by twin formation. 18 In the CDRX mechanism, subgrains absorb dislocations dissociated from adjacent subgrain boundaries and grow into grains through subgrain coalescence. 19 Mirzaei et al. 20 and Arun et al. 21 suggested that the flow softening during hot deformation in SASS is due to DDRX rather than CDRX. Han et al. 22 proposed that SASS mostly nucleates through the DDRX grain boundary arching mechanism, but only nucleates through the CDRX subgrain coalescence mechanism at high temperatures and strain rates. Hao et al. 23 observed the transition zone in transmission electron microscopy (TEM) and drew similar conclusions. Wang et al. 24 reported that SASS 254SMO undergoes CDRX under all deformation conditions. There is still controversy about the DRX mechanism in SASS, especially S31254, under different deformation conditions. In addition, Gao et al. 25 reported that element segregation and precipitates in 654SMO were almost eliminated after homogenization at 1280 °C for 16 h, greatly improving the material's hot workability. However, there are few studies on the microstructure evolution and DRX mechanism of homogenized S31254 billets. Further investigation into the hot deformation behavior of homogenized S31254 will help to lay the foundations for the stable production of advanced materials.
In the aforementioned studies, the kinetic analysis of SASS mainly focuses on the establishment and optimization of the constitutive equations. In addition, as a widely produced and applied SASS, most researchers are concerned with its properties in cast and rolled states. There are few reports on the hot deformation behavior and microstructure evolution of S31254 continuous casting billets after homogenization. This study utilized a homogenized S31254 continuous casting billet as the research material and performed hot compression experiments on columnar specimens with equiaxed grains under various deformation conditions. The flow behavior and critical conditions for DRX of S31254 were evaluated in detail. Kinetic analyses were carried out to establish the constitutive equations, which were used as a basis to relate the kinetic model to the critical conditions for DRX. Microstructure evolution and DRX mechanisms were studied using electron backscattering diffraction (EBSD) and TEM.
Experimental procedures
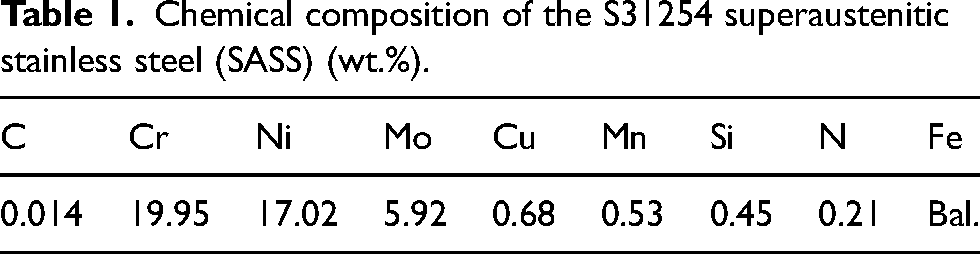
The study employed S31254 SASS as the experimental sample, which was obtained from continuous casting billets produced by Taiyuan Iron and Steel (Group) Co., Ltd (TISCO). Table 1 presents the alloy's chemical composition (wt.%). According to the macroscopic metallographic characteristics of the S31254 continuous casting billet, it can be divided into three regions: fine equiaxial crystal region, columnar crystal region, and center equiaxial crystal region, as illustrated in Figure 1(a). The optical microstructure of the as-cast central equiaxial crystals is shown in Figure 1(b), where a large number of dendrites and precipitates are present in the original microstructure. The billet was homogenized at 1280 °C for 12 h and then air-cooled to improve its microstructure homogeneity. The optical microstructure of the homogenized center equiaxed grain is shown in Figure 1(c), where it can be found that the dendrites and elemental segregation are effectively eliminated. A cylindrical sample with a size of Φ10 × 15 mm was processed from the center equiaxed grain zone for hot compression testing. The samples were cut (as illustrated by the yellow sample in Figure 1(a) in the axial direction of the sample parallel to the rolling direction. The thermal simulator used for the thermal compression test was the Gleeble-1500. Samples were heated to 1200 °C at a ramp rate of 10 °C/s and homogenized for 60 s. The samples were then cooled to the deformation temperature at a cooling rate of 5 °C/s and homogenized for 20 s. The samples were thermally deformed to a true strain of 0.8 over a temperature range of 950 °C–1200 °C (50 °C interval) at strain rates of 0.01–10 s−1. The samples were water-cooled to preserve the microstructure after thermal deformation. The complete experimental process is shown in Figure 1(d).
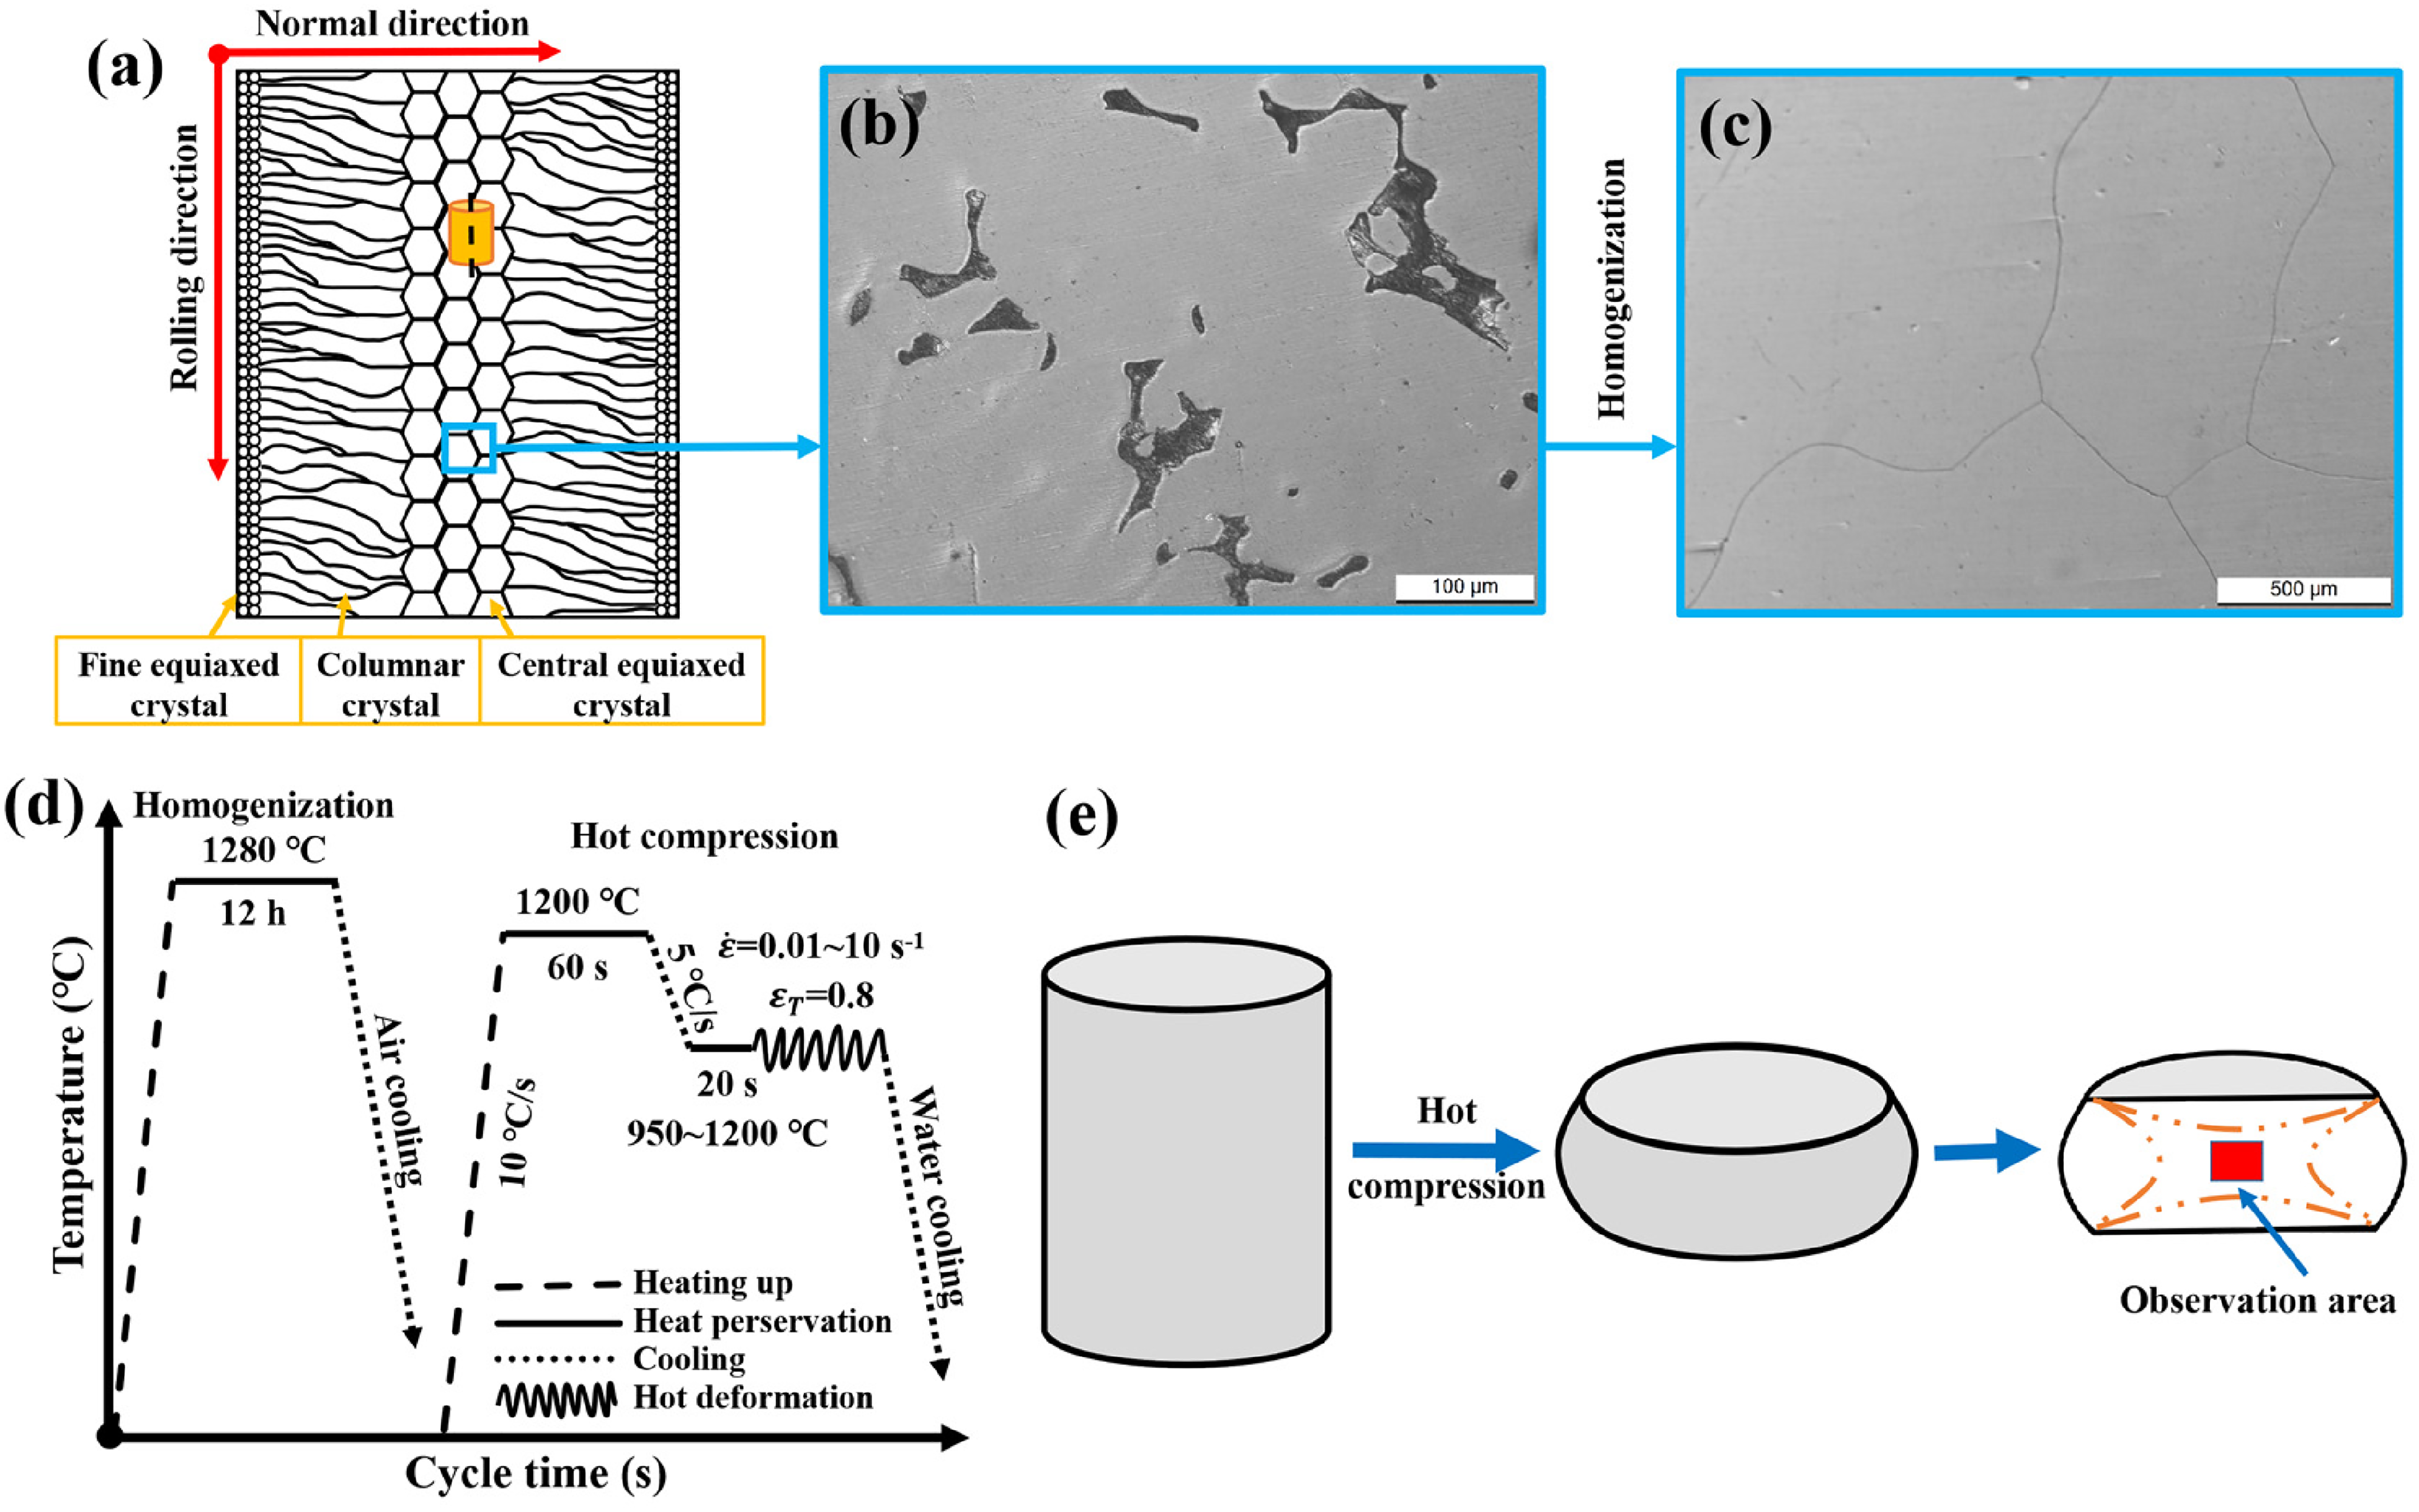
(a) Schematic diagram of the microstructure morphology of cast billets and sampling direction of compression samples, (b) optical microstructure of the central equiaxial crystal region in the as-cast, (c) homogeneous states, (d) process curves of thermal compression tests, and (e) schematic diagram of the observation position of deformed samples.
Chemical composition of the S31254 superaustenitic stainless steel (SASS) (wt.%).
Before metallographic observation, the samples were mechanically polished and electrochemically eroded. The etching solution used was 10 vol.% oxalic acid (C2H2O4) solution, voltage 7 V, and etching time 25 s. As shown in Figure 1(e), the uniform deformation zone at the center of the deformed samples was chosen as the microstructure observation area. Optical microstructures (OMs) were observed using an equipment model Leica DM2500. The finer microstructure of the deformation zone was observed using electron backscatter diffraction (EBSD, Oxford Aztec). The samples used for EBSD were mechanically milled to 3000 grit, and then electrochemically polished for 20–25 s in a 10 vol.% HClO4 + 90% vol.% acetic acid solution at room temperature to remove the surface stress at 20 V and 1.5 A. The microstructural behavior of the deformed grains and substructures such as dislocations and subgrains were observed using TEM (Tecnai G2 F20). Thin foils of about 80 μm thickness and 3 mm diameter used for TEM analysis were perforated using dual-jet electrolytic polishing at 50 V in a 90 vol.% ethanol solution and 10 vol.% perchloric acid.
Results and discussion
Flow behavior
The true stress–strain curves obtained from the hot compression tests of S31254 at various deformation temperatures (950 °C–1200 °C) and strain rates (0.01–10 s−1) are shown in Figure 2. The stress–strain curves for all deformation conditions exhibit similar characteristics. The flow stress (σ) increases rapidly with strain up to the peak stress (σp) and then gradually decreases towards the steady-state level. This single-peaked flow profile indicates the presence of DRX within the metal during thermal deformation, and the profile characteristics are sensitively dependent on the competing effects between work hardening and dynamic softening occurring within the alloy.22,26 During the early stage of strain, dislocations continuously form and multiply with the occurrence of deformation, resulting in mutual hindrance of dislocations and rapid increase of stress. At the same time, cross-slips of dislocations may also occur. However, the softening effect at this stage is still significantly weaker than the hardening due to dislocation proliferation. Once the deformation increases up to the peak strain (εp), it can be considered that DRV and DRX begin to dominate the microstructural evolution inside the alloy. In particular, DRX is more effective in eliminating hardening. However, under high strain rate deformation conditions (1–10 s−1), the deformation enters a steady-state phase. During this phase, the flow stress tends to stabilize and no longer fluctuates violently with strain.
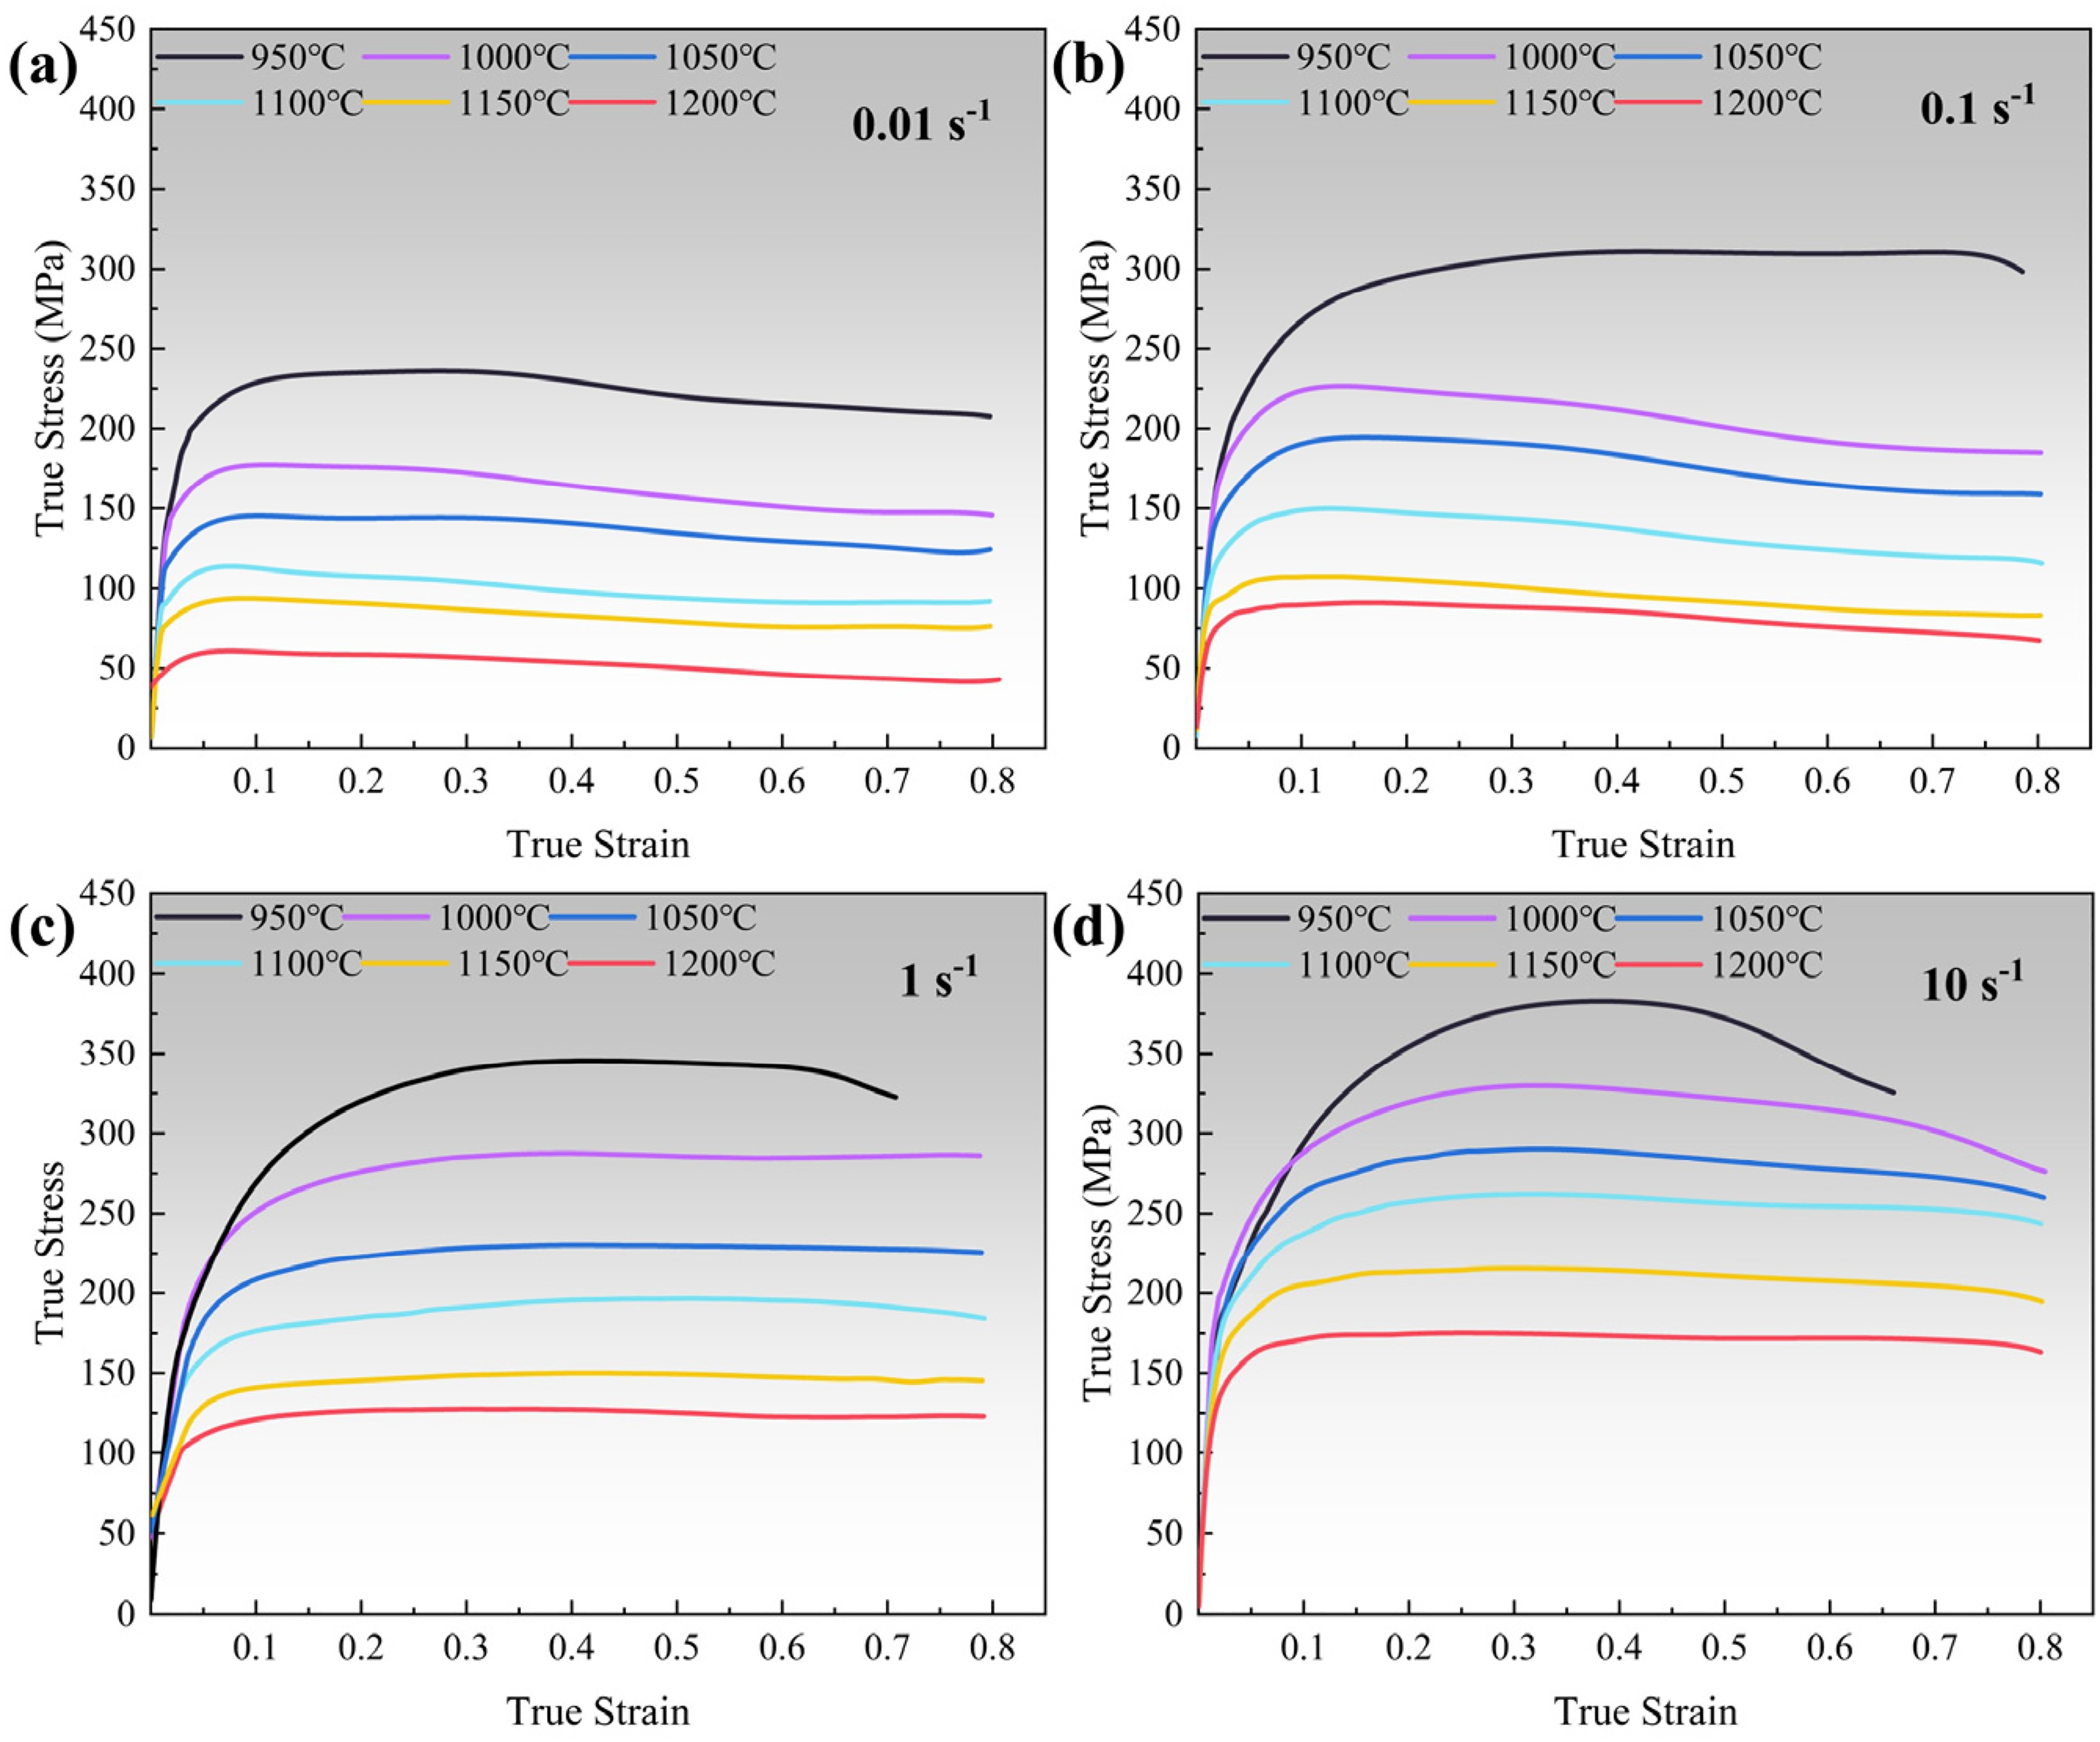
The true stress–strain curves of S31254 deformed at various temperatures and strain rates: (a) 0.01 s−1; (b) 0.1 s−1; (c) 1 s−1; and (d) 10 s−1.
The flow softening parameter (X) can be used to evaluate the softening behavior of the flow curves.
27
The equation for calculating the flow softening parameter is as follows:
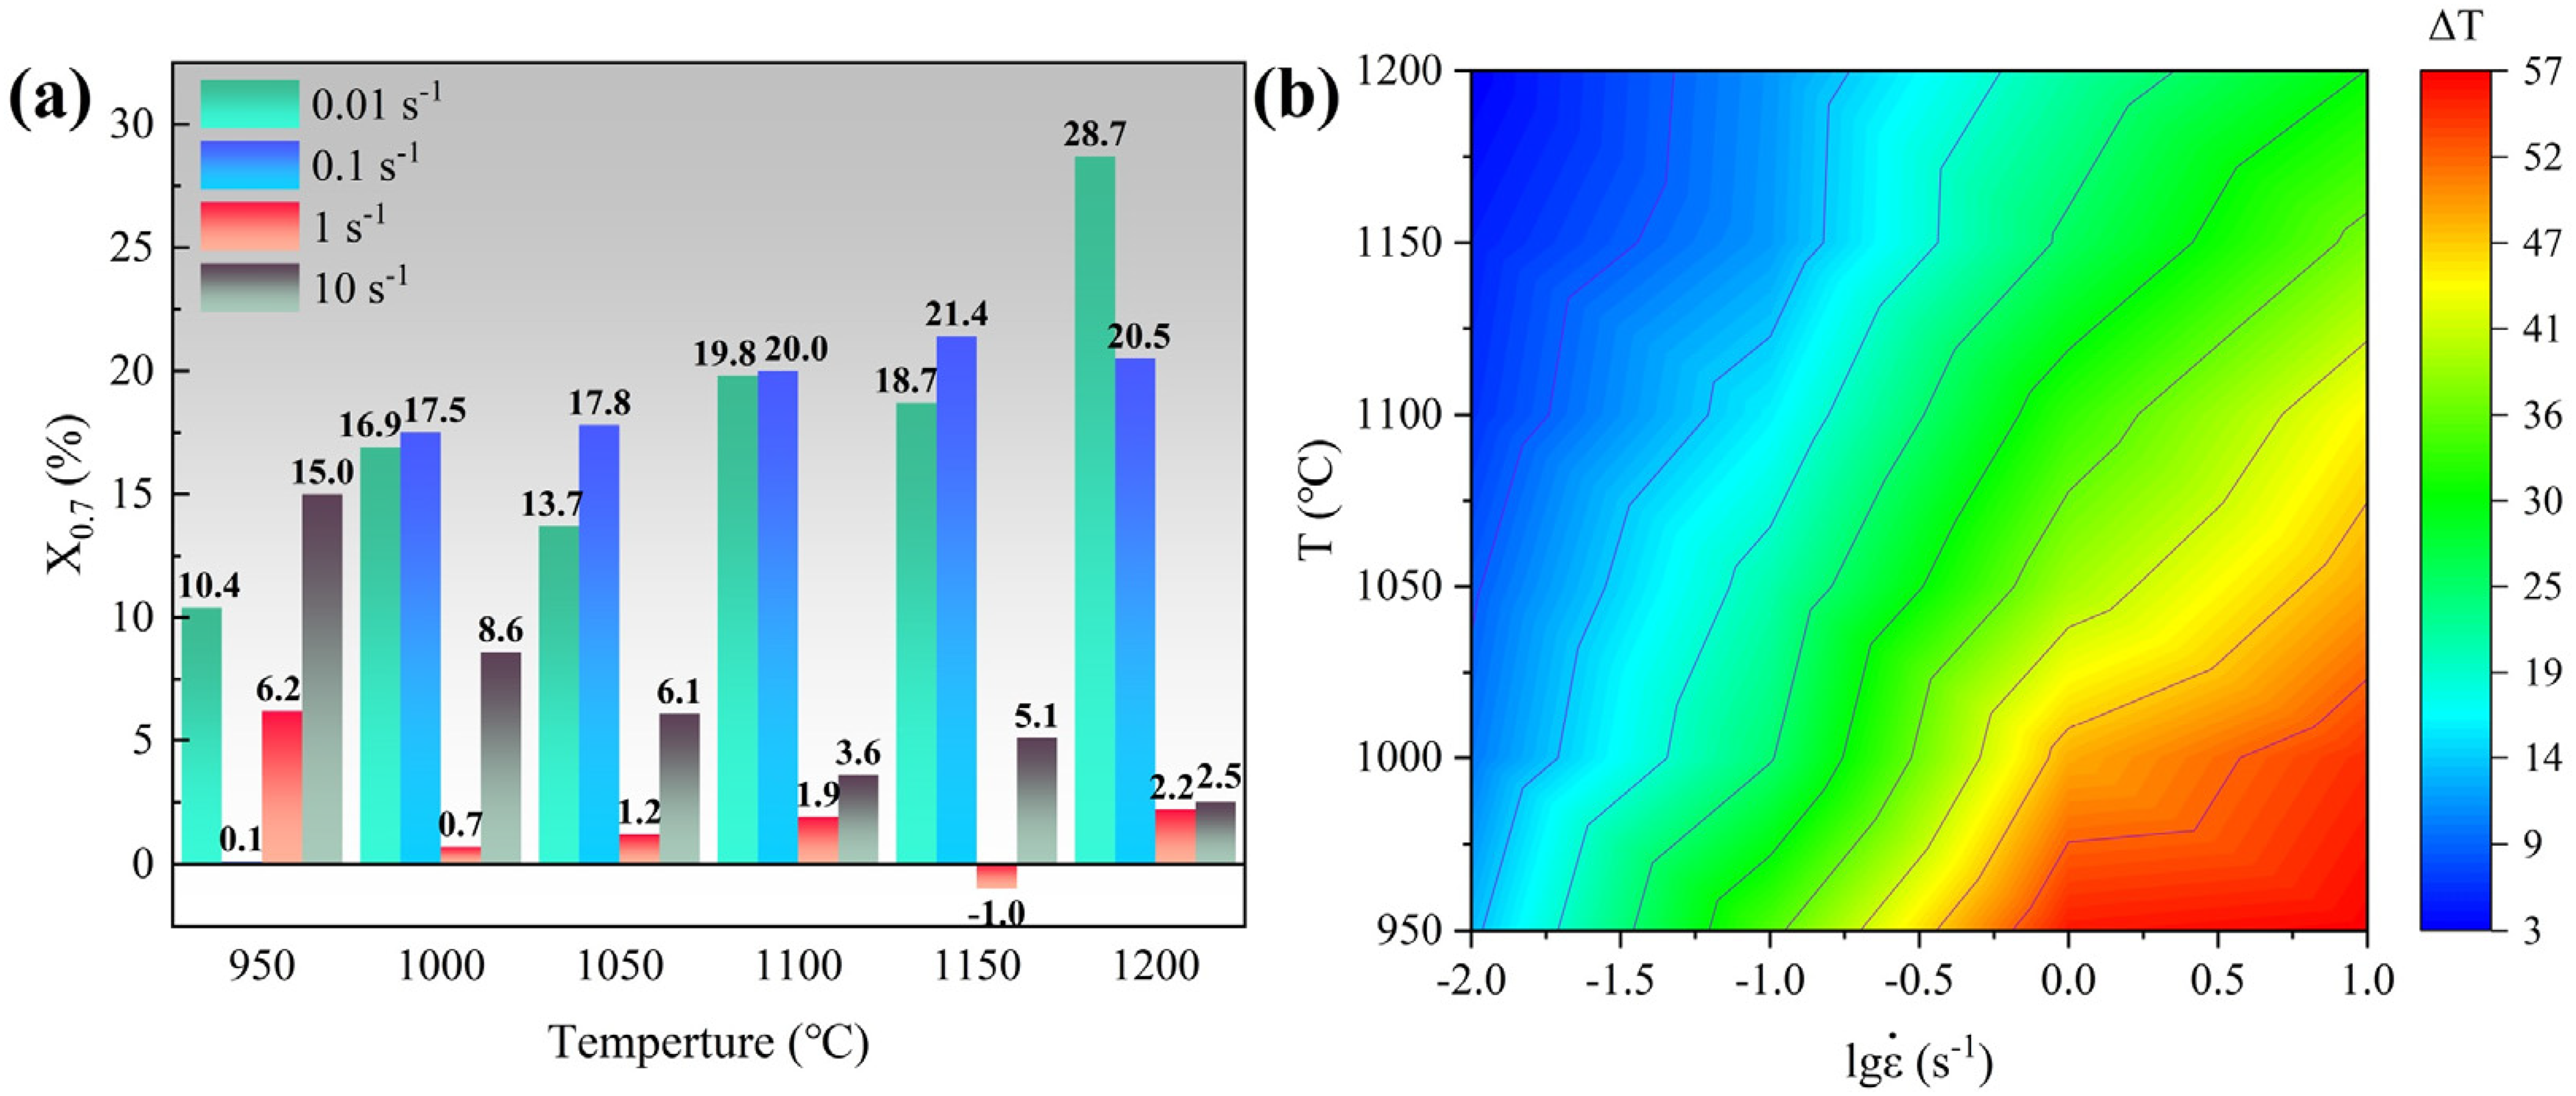
(a) Degree of flow softening and (b) adiabatic temperature rise of S31254 at true strain 0.7 for various conditions.
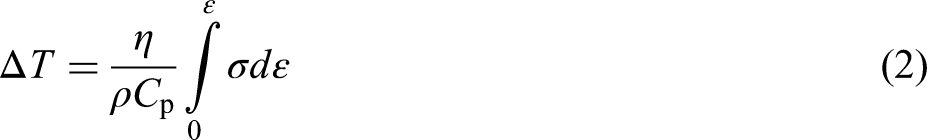
The adiabatic temperature rise calculation formula is as follows
28
:
DRX critical conditions
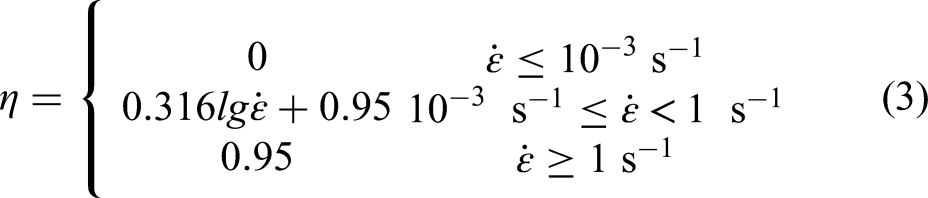
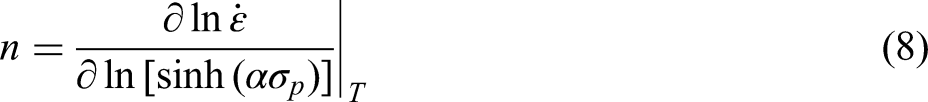
The determination of various types of hot deformation parameters is essential for researching hot rolling and other hot processing production. 29 Locating the inflection point of the work-hardening rate (θ) versus the stress curve is one of the more commonly used methods for determining the critical DRX stress (σc). 30 The θ versus σ curves for each deformation condition can be obtained by derivation of the true stress–strain curve, as shown in Figure 4. The inflection points marked by black circles on each curve in Figure 4 correspond to the σc under each deformation condition. In addition, the point at which θ is equal to 0 corresponds to the σp.
The curve of θ versus σ of S31254 deformed at various temperatures and strain rates: (a) 0.01 s−1; (b) 0.1 s−1; (c) 1 s−1; and (d) 10 s−1.
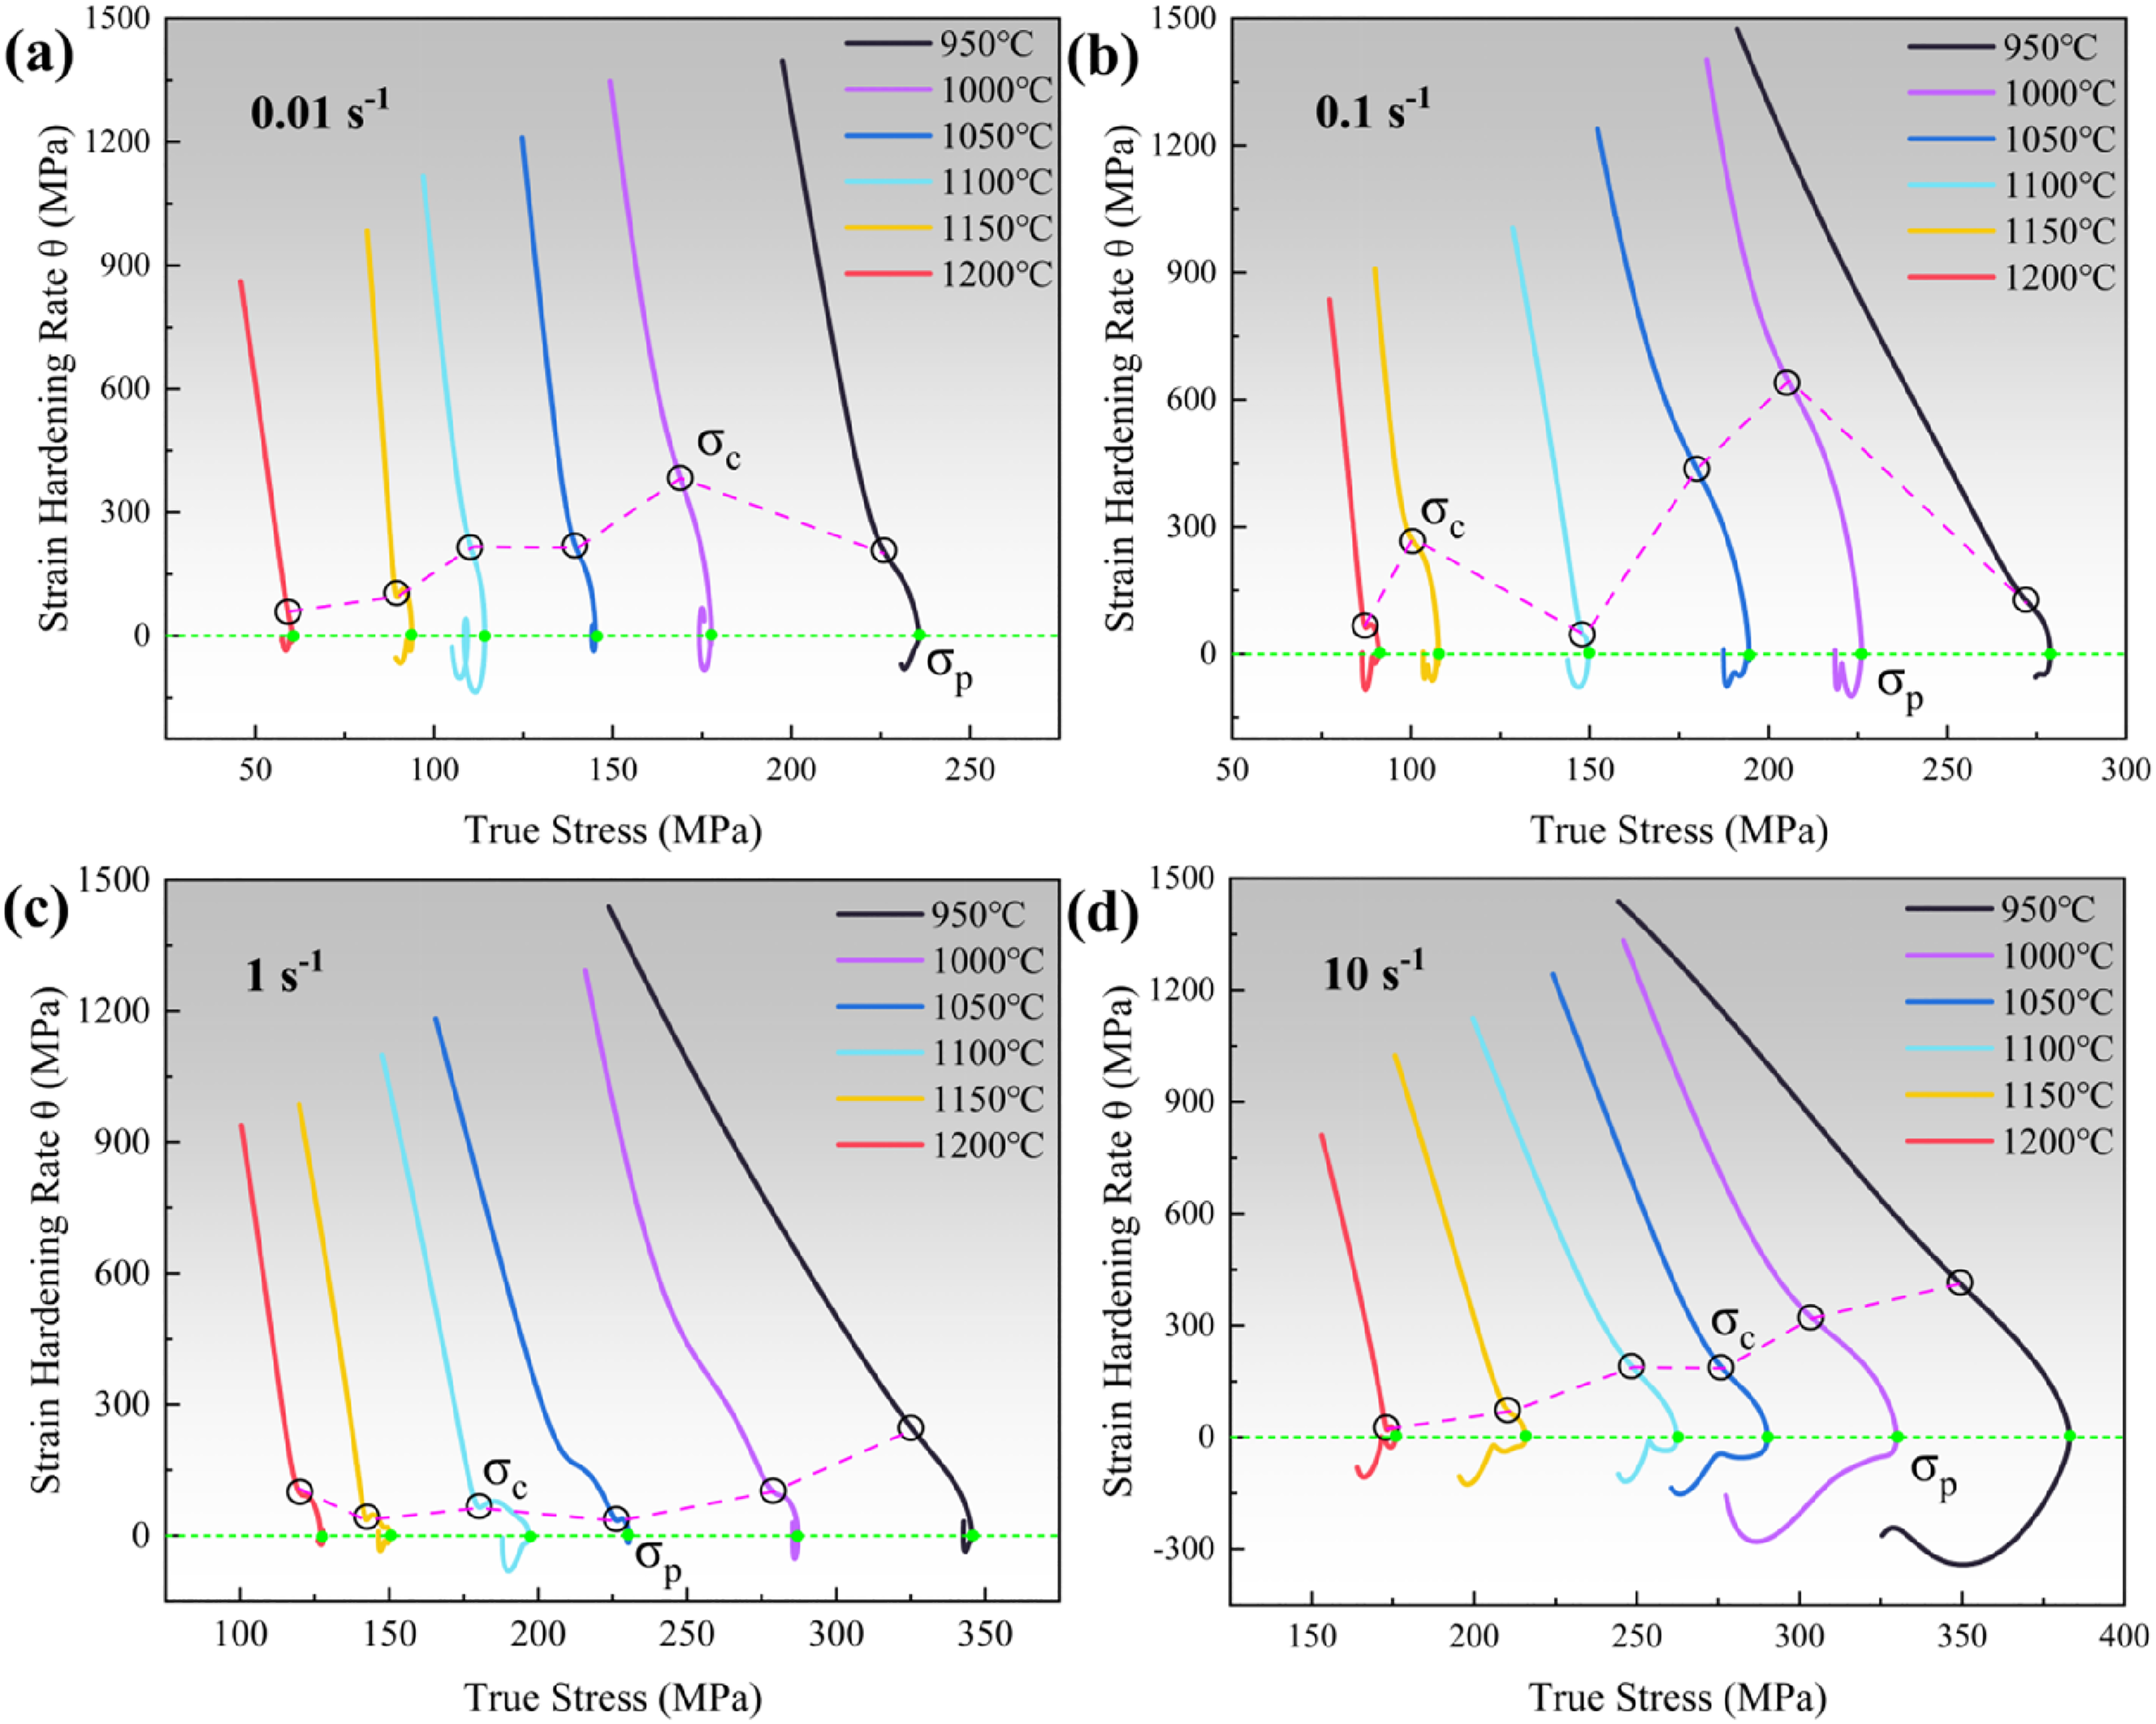
However, it should be noted that Figure 4 can only provide an approximate location of the inflection point. To accurately calculate σc, the “double differentiation method”
31
was used. The resulting curve of
The
Critical stress (MPa) and corresponding critical strain (in parentheses) at various deformation conditions.
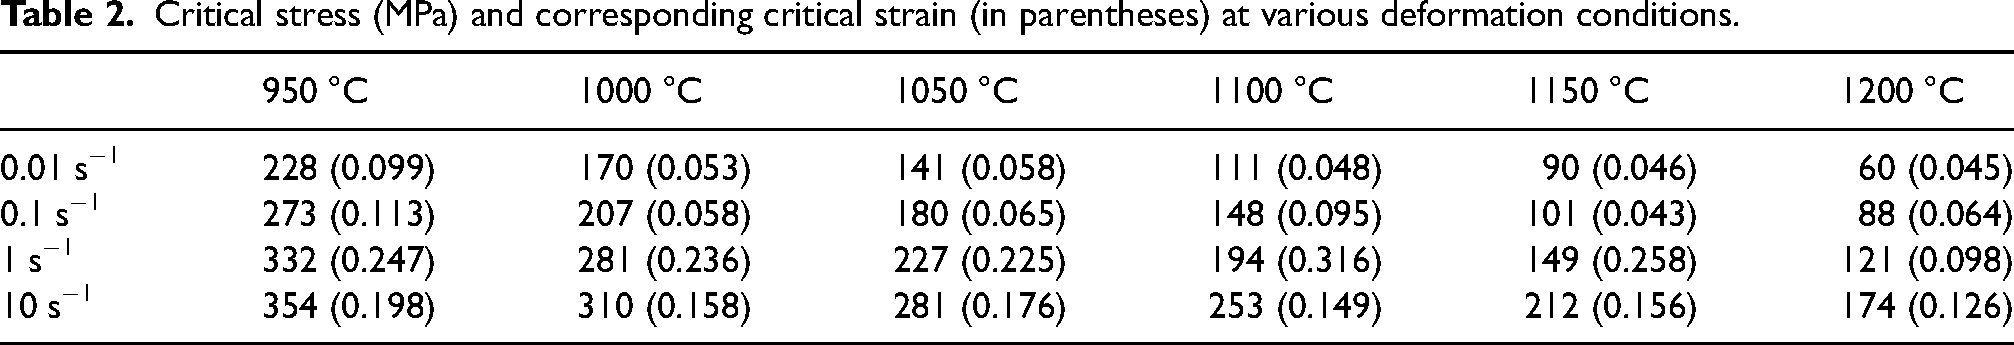
Similar to critical stress and critical strain, there exists a critical storage energy for activating DRX during hot deformation, the value of which can be denoted by the critical dislocation density (ρm).32,33 The following inequality exists between critical dislocation density and strain rate
34
:
The ρm of an alloy increases with the plastic strain applied by an external force. The precondition for DRX is reached when the strain is accumulated to the point where the alloy satisfies inequality (4).16,34 The interfacial migration rate in inequality (4) increases as the temperature increases. Therefore, for an exact alloy, the value of
Kinetic analysis
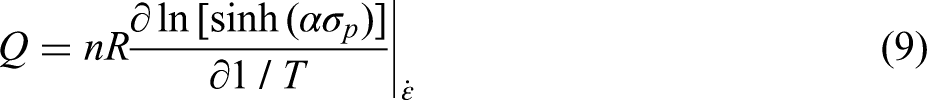
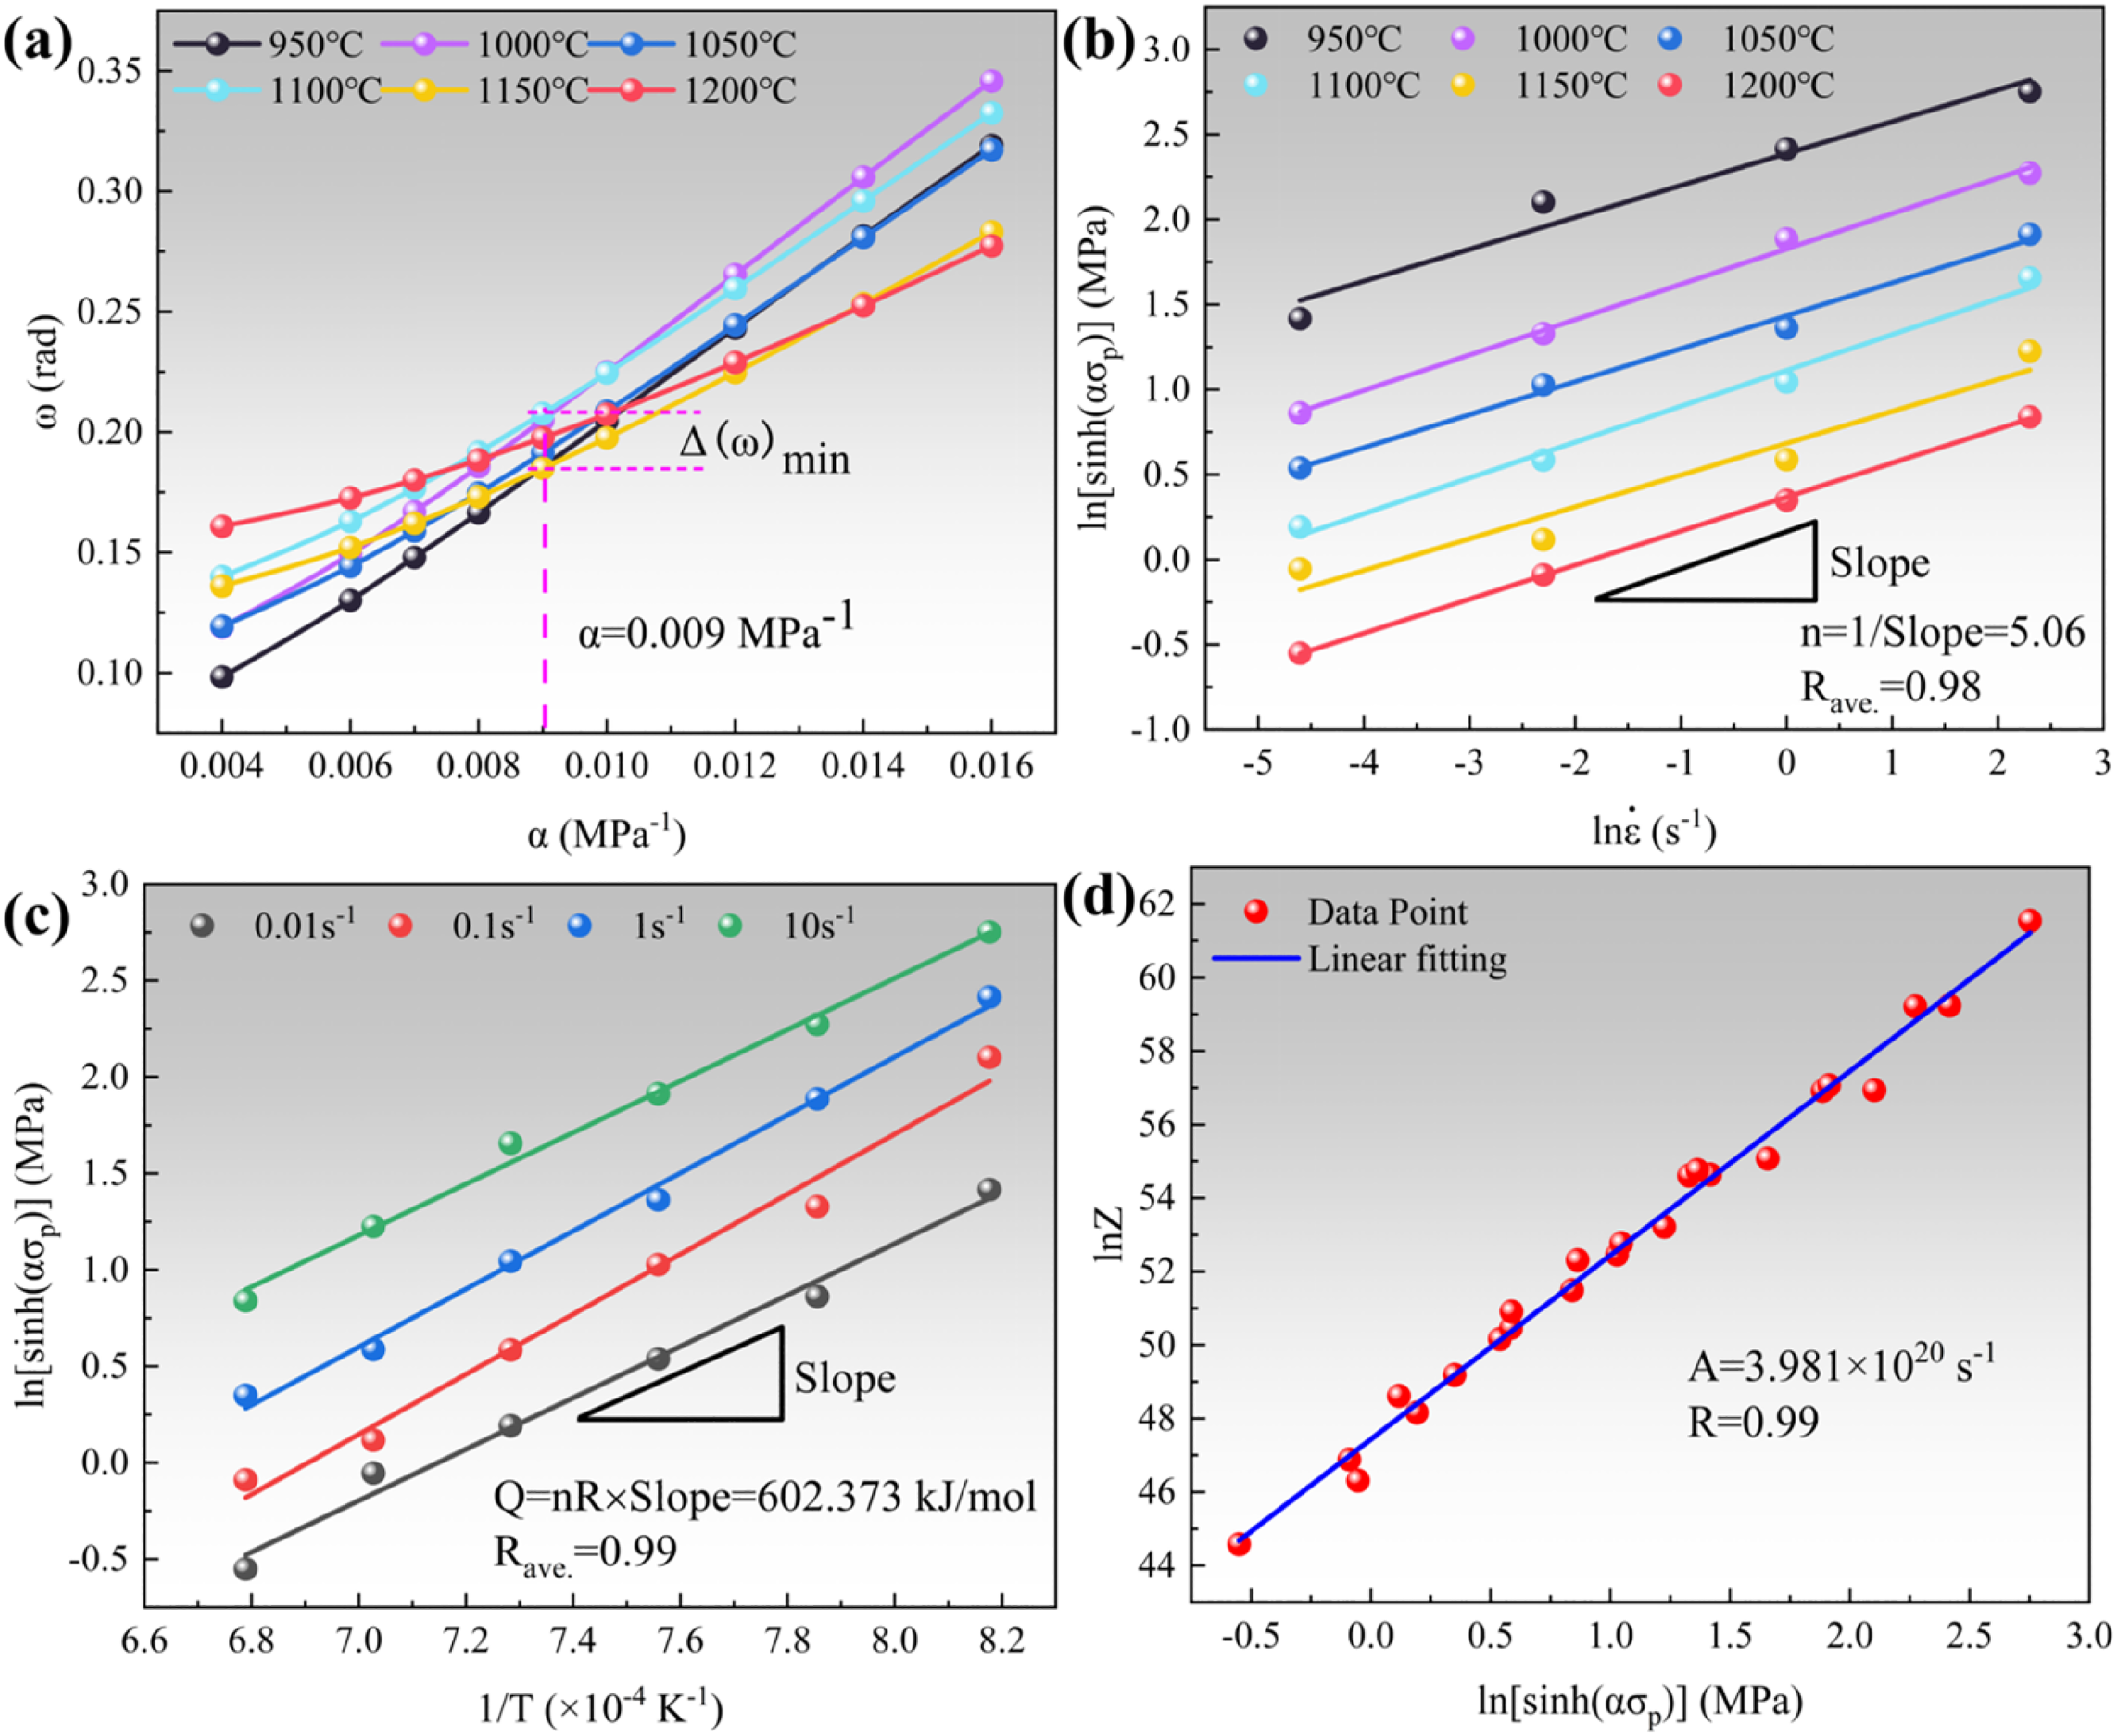
The production of S31254 using hot processing techniques is closely linked to various types of hot deformation parameters. The kinetic analysis was carried out to help predict the hot deformation characteristics of S31254 and provide some guidance for its production. The kinetic relationship between T, 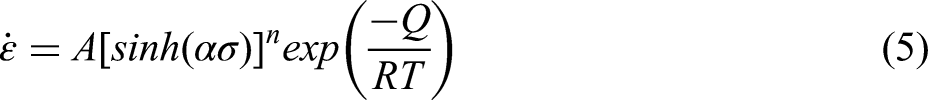
Taking both sides of equation (5) logarithmically to simplify the solution and substituting the value of σp into σ, from which a new formula can be derived:
The plot of the angle of inclination between the fitted lines of (a)
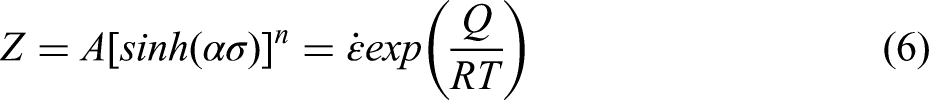
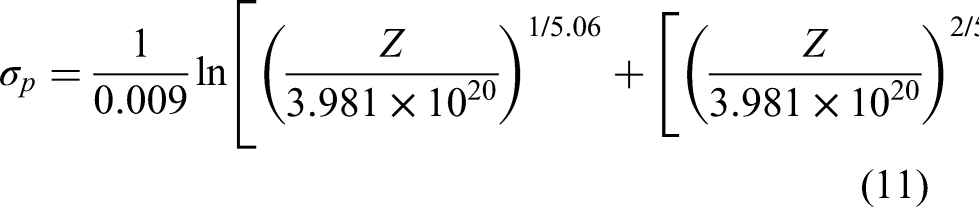
Taking the logarithm of equation (6) yields a simplified equation for the relationship between Z and stress:
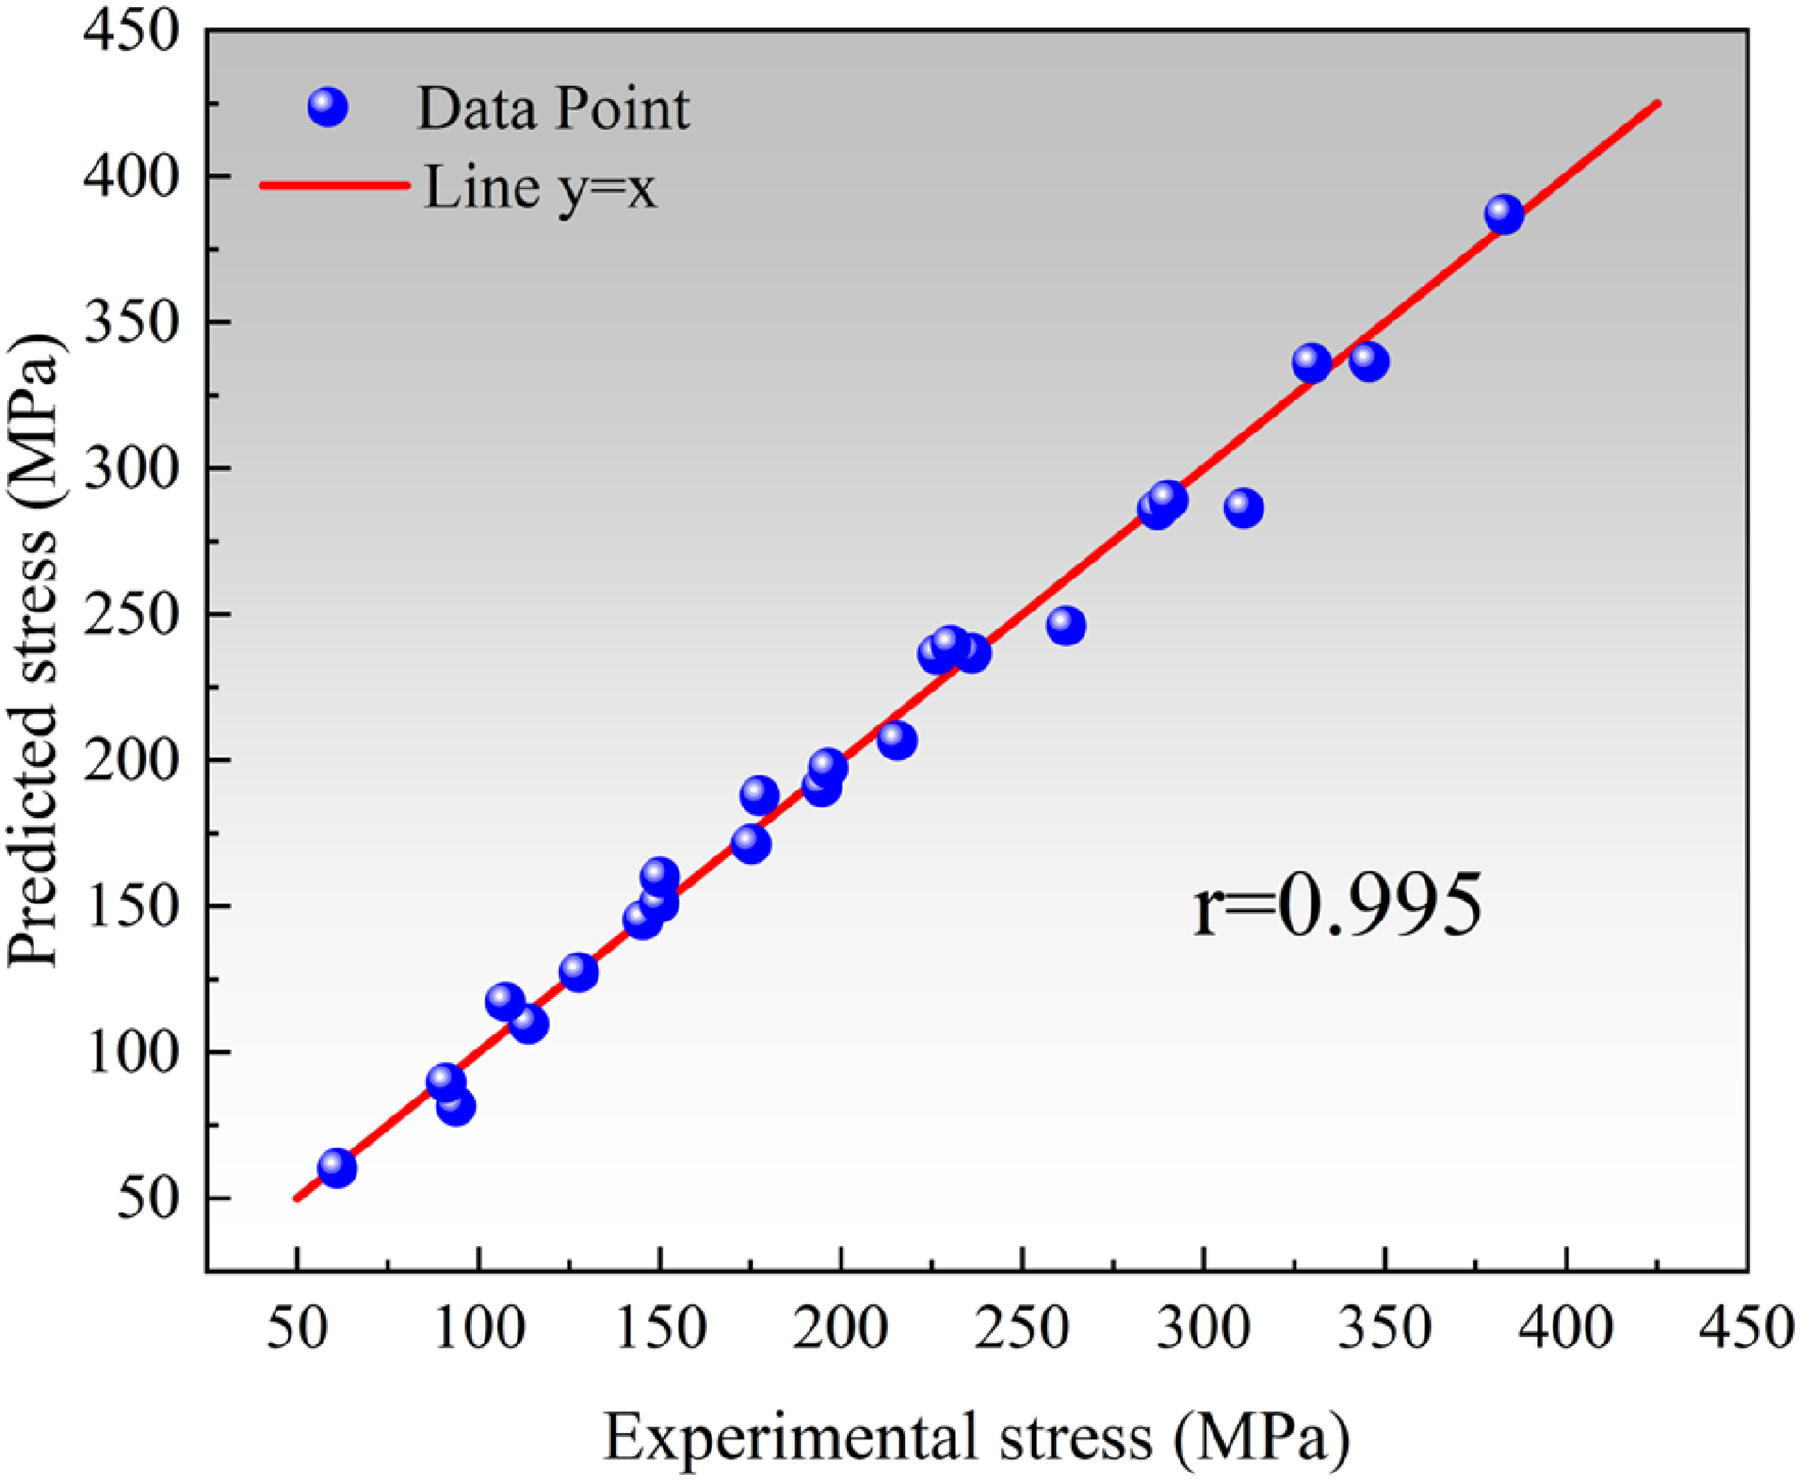
The comparison between experimental σp and predicted σp.
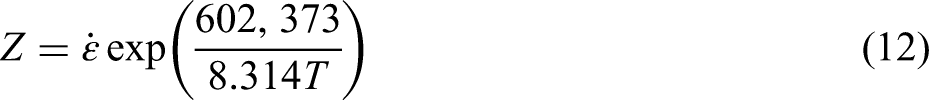
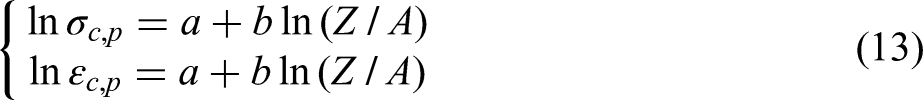
The Z parameter is essentially associated with the conditions of thermal deformation. The construction of linear functional relationships between flow parameters such as σp, εp, σc, εc, and Z can provide a reference for the development of a thermoforming process for S31254. The logarithm of the above parameters can be used to construct a linear relationship between them and the dimensionless parameter ln(Z/A)
41
:
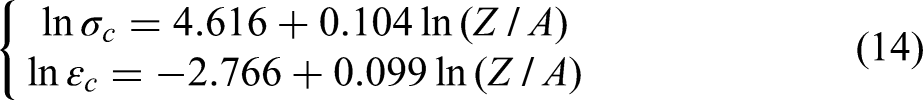
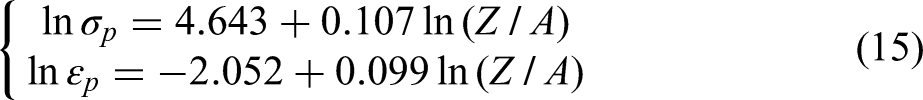
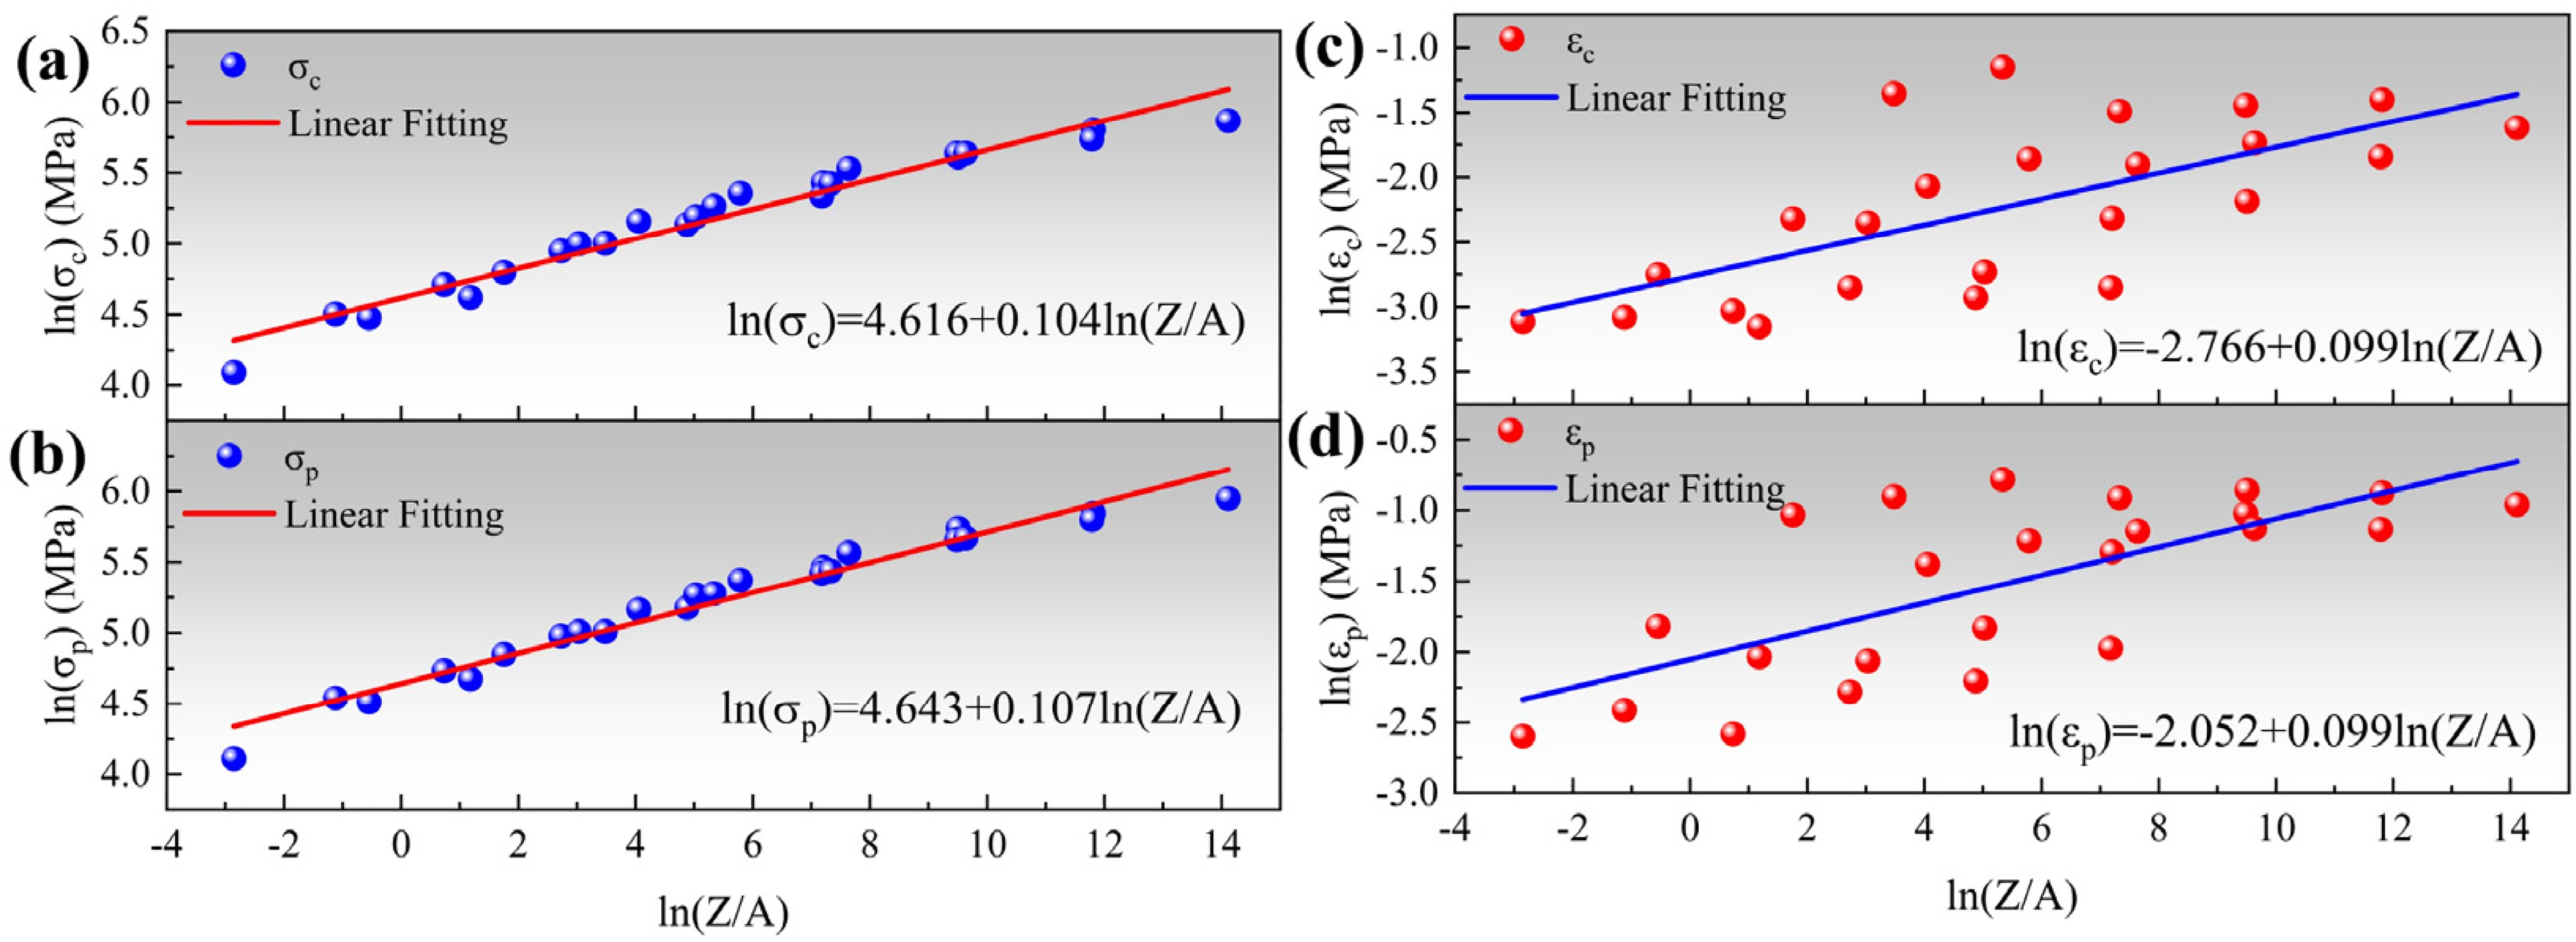
Fitted lines for (a) σc, (b) σp, (c) εc, and (d) εp as a function of ln(Z/A).
It should be noted that the range of ln(Z/A) is between −3 and −14 (as shown in Figure 8). Therefore, by converting equations (14) and (15), a linear relationship between σc, εc and σp, εp can be obtained, as shown in equation (16). This relationship is similar to reports on the thermal deformation of other austenitic stainless steels (σc = 0.89–0.96σp).26,42,43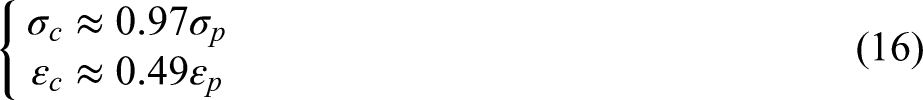
Microstructure evolution
At a strain rate of 0.01 s−1
The microstructure evolution of S31254 at 1000 °C, 1100 °C, and 1200 °C at a strain rate of 0.01 s−1 is shown in Figure 9. The black and grey lines in Figure 9 indicate high-angle grain boundaries (HAGBs) with angles greater than 10° and low-angle grain boundaries (LAGBs) with angles in the range of 1°–10°, respectively. The grain boundaries of the original grains show jagged bowing out, as indicated by the black arrows in the original enlarged image of Figure 9(a 1 ) and (b 1 ), which is closely associated with SIBM. 44 There are numerous and complex LAGB networks inside the original grains, especially in those grains that are strongly deformed at the center. It can be observed that there is a continuous distribution of finer grains between the original coarse grains, as shown in Figure 9(a 1 ) to (c 1 ). The distribution of these fine grains is like a string of “necklaces,” the number and size of which grow with the increase in temperature and gradually expand to the center of the original grain. Some researchers regard this characteristic as a result of DDRX.7,22

EBSD analysis results including IPF ((a1) to (c1)), GOS ((a2) to (c2)), and KAM ((a3) to (c3)) maps of S31254 under a strain rate of 0.01 s−1 to various temperatures of (a1) to (a3) 1000 °C, (b1) to (b3) 1100 °C, (c1) to (c3) 1200 °C, wherein the black and grey lines represent boundaries with misorientation of > 10° and 2°–10°.
The average deviation within a single grain and the average difference in atomic orientation between each grain are defined as grain orientation spread (GOS), which reflects the overall orientation gradient of grains. A higher GOS value means that the lattice distortion of the grains is more severe, indicating higher deformation energy storage.24,45 As shown in Figure 9(a 2 ) to (c 2 ), the original grains generally have large lattice distortions, and the higher the distortion degree, the more complex the LAGBs network inside the grains. The “necklace-like” grains between the original grains have small GOS values and almost no distortion, indicating that these “necklace-like” grains are newly generated recrystallized grains. In addition to the GOS plot, the kernel average misorientation (KAM) plot can also be used to evaluate the local plastic strain degree of grains. Higher KAM values indicate higher plastic deformation degrees, directly reflecting the density of defects such as dislocations in that region. As shown in Figure 9(a 3 ), the original grains show high KAM values mainly at the edges, indicating that the strain is not deep within the grains but mainly concentrated in the outer layer. It is worth noting that high KAM value areas are basically coincident with complex LAGB networks. Apparently, at high-temperature deformation conditions, a large number of entangled dislocations accumulate in the edge region of original grains through DRV action, performing cross-slip and realignment to form these LAGBs. With continuous DRV action, the LAGBs will further attract dislocations to gather, and ultimately the internal dislocation density of grains will continue to decline and form complex LAGB networks. As deformation temperatures increase, the high dislocation density areas in the original grains significantly reduce, while LAGBs transform from short-range disordered states to long-range ordered network structures (indicated by yellow arrows in Figure 9(b 3 )). Furthermore, the internal recrystallized grains have almost no plastic strain accumulation, indicating that DRX nucleation and growth processes can effectively eliminate defects and distortions accumulated in the original microstructure.
The critical point was identified as the right bottom of the first peak on the distribution curve of the GOS values in order to obtain an accurate recrystallization fraction. All grains with GOS values below the critical point are judged to be recrystallized grains. 26 As shown in Figure 10(a 1 ) to (c 1 ), the DRX fraction increases with increasing temperature. Obviously, higher deformation temperatures appear to promote DRX, which results in the significant softening of flow stress at high temperatures (Figure 2). In addition, by observing the special grain boundary distribution in Figure 10(a 1 ) to (c 1 ), it can be found that Σ3 n grain boundaries mainly distribute in the recrystallized grains, and almost no observation is made in the original grains, indicating that twin boundaries are an important DRX assistive mechanism for S31254 during high-temperature deformation.

Recrystallized grains distribution map superimposed with twinning boundaries distribution map of S31254 under a strain rate of 0.01 s−1 to various temperatures of (a1) 1000 °C, (b1) 1100 °C, (c1) 1200 °C, wherein the black, red, green, and blue lines represent HAGBs, σ3, σ9, and σ27 twinning boundaries and ((a2,3), (b2,3) and (c2,3)) misorientation profiles of PTP and PTO corresponding to the light blue arrows in (a1) to (c1).
Figure 10(a 2 ) to (c 2 ) and (a 3 ) to (c 3 ) reflect the misorientation changes within the original grains along the blue arrows in Figure 10(a 1 ) to (c 1 ). The orange curve means the total misorientation (point-to-origin, PTO), and the green curve reflects the misorientation between neighboring points (point-to-point, PTP). For segment A1 (Figure 10(a 2 )), the PTP curve has a large number of small growth peaks (2°–8°) and two jumps exceeding 10°, indicating the presence of numerous LAGBs and HAGBs within the original grain. Meanwhile, the PTO curve of segment A1 shows alternating cumulative growth, indicating that numerous subgrains with similar internal orientations have formed in this direction. The dislocation cells formed by dislocation entanglements are polygonized by DRV to form these subgrains. Subsequently, adjacent subgrain boundaries undergo dislocation separation and rearrangement, continuously increasing the misorientation and forming an ordered LAGB network through subgrains coalescing (Figure 9(b 2 ) and (c 2 )). For segment A2 (Figure 10(a 3 )), the PTP orientation difference is small, but the PTO orientation difference shows a continuous accumulation trend. This characteristic distribution of misorientation is usually accompanied by the formation of geometrically necessary dislocations, which are essential for coordinated deformation. 46 Similar to segment A1, segment B1 (Figure 10(b 2 )) also forms LAGBs and HAGBs perpendicular to the deformation direction. Unlike A1, the accumulated misorientation in segment B1 is higher, and there are fewer small growth peaks on the PTP curve, indicating that the increase in temperature accelerates the microstructure evolution within the original grains. The change pattern of segment B2 (Figure 10(b 3 )) is similar to that of segment A2. The small growth peak on the PTP curve corresponds to the presence of subgrain boundaries. As the temperature continues to increase, segment C1 (Figure 10(c 2 )) also forms a few LAGBs and HAGBs, but misorientation is significantly lower than that in segments A1 and B1. This is a result of the increase in temperature which greatly facilitates the expansion of the DRX grains into the original grains, effectively reducing deformation distortions and defects, resulting in a smaller misorientation in the residual original grains. As for segment C2 (Figure 10(c 3 )), its PTO curve shows alternating misorientation distribution, with no accumulation of misorientation within the grains. The appearance of this misorientation characteristic is usually due to the presence of microbands. 47
At a strain rate of 10 s−1
The microstructure evolution of S31254 at 1000 °C, 1100 °C, and 1200 °C with 10 s−1 is shown in Figure 11. It can be observed that the original grain boundaries have jagged edges with “necklace-like” grains distributed among them. Compared to 0.01 s−1, the deformation grains at 10 s−1 have formed a more dense and complex LAGB network within the grains. In order to accommodate the more severe deformation at 10 s−1, numerous HAGBs perpendicular to or nearly perpendicular to the compression direction are also formed within the original grains, as shown in the local enlargement of Figure 11(a 1 ). These line-segmented HAGBs did not evolve into a network structure as LAGBs do but rather provided nucleation sites for recrystallization as original grain boundaries do. The subgrains formed by DRV locally bow out on the HAGBs on these intra-crystalline (indicated by the yellow arrow in the enlarged image in Figure 11(b 1 )), and nucleate into recrystallized grains through SIBM under the drive of distortion energy (indicated by the black arrow in the enlarged image in Figure 11(b 1 )). Obviously, this nucleation feature is the same as when the strain rate is 0.01 s−1 (as indicated by the black arrow in the enlarged image of Figure 9(a 1 ) and (b 1 )), which belongs to the typical DDRX nucleation mode.

EBSD analysis results including IPF ((a1) to (c1)), GOS ((a2) to (c2)), and KAM ((a3) to (c3)) maps of S31254 under a strain rate of 10 s−1 to various temperatures of ((a1) to (a3)) 1000 °C, ((b1) to (b3)) 1100 °C, ((c1) to (c3)) 1200 °C, wherein the black and grey lines represent boundaries with misorientation of > 10° and 2°–10°.
The number of these “necklace-like” recrystallized grains, distributed along the original grain boundaries and intracrystalline HAGBs, increases significantly with increasing temperature. This phenomenon is the same as that at 0.01 s−1. According to the GOS distribution map, it can be found that recrystallized grains mainly appear in the original grains with high GOS values or near the original grain boundaries (Figure 11(a 2 )), and expand towards the side with high GOS values (Figure 11(b 2 ) and (c 2 )), indicating that strong lattice distortion drives the nucleation and growth of DRX. The KAM plot at 10 s−1 is significantly different from that at 0.01 s−1. The dislocation defects are densely distributed throughout the entire original grain at 10 s−1, rather than only in the outer layer of the original grain. This is mainly because an increase in the strain rate allows strain to penetrate the interior of coarse original grains, while simultaneously shortening the time for DRV to act, resulting in dislocations not having sufficient time for effective climb and rearrangement. This also leads to the LAGBs not absorbing enough dislocations for continuous transformation. Therefore, the LAGBs network at 10 s−1 exhibits a short-range disordered state (indicated by the local enlargement in Figure 11(a 3 ) and (b 3 )), while at 0.01 s−1, it exhibits a long-range ordered state after sufficient DRV (indicated by the yellow arrow in Figure 9(b 3 )). Similarly, regardless of whether it is at a high or low strain rate, the nucleation and growth of recrystallization effectively eliminate the defects and distortions accumulated in the original microstructure (indicated by the red circle in Figure 11(b 3 ) local enlargement and Figure 11(c 3 )).
The DRX fraction at 10 s−1 increases with temperature and is much higher than that at 0.01 s−1, as demonstrated in the recrystallized grain distribution map of Figure 12(a 1 ) to (c 1 ). In particular, the DRX fraction reaches 52.4% at 10 s−1 and temperatures of 1200 °C. The higher DRX fraction at high strain rates can be attributed to the high deformation energy storage. Due to the stronger dislocation–dislocation interactions and the weaker DRV interaction at high strain rates, the deformation storage energy and dislocation density increase with the strain rate, which in turn enhances the DRX nucleation rate. In addition, the effect of adiabatic temperature rise (ΔT) on DRX should be considered. As shown in Figure 3(b), S31254 has a high adiabatic temperature rise at 10 s−1, and in particular, the adiabatic temperature rise at 950 °C can reach up to 57 °C. This high adiabatic temperature rise will accelerate dislocation climb and grain boundary migration to promote DRX.

Recrystallized grains distribution map superimposed with twinning boundaries distribution map of S31254 at 10 s−1 to various temperatures of (a1) 1000 °C, (b1) 1100 °C, and (c1) 1200 °C, wherein the black, red, green, and blue lines represent the boundaries with misorientation of > 10° (HAGBs), Σ3, Σ9, and Σ27 twinning boundaries. And ((a2,3), (b2,3), and (c2,3)) misorientation profiles of PTP and PTO corresponding to the azury arrow superimposed in (a1), (b1), and (c1).
Additionally, CSL grain boundaries, particularly Σ3 grain boundaries, were identified within and along the newly formed DRX grains. This suggests that these Σ3 grain boundaries were created as a result of DRX. The twin boundary fraction at 10 s−1 was significantly higher than that at 1 s−1, with a twin boundary fraction of 17.8% at 10 s−1 and 1100 °C, significantly higher than the 9.7% at 0.01 s−1 and 1100 °C. Previous studies have shown that the creation of numerous twin boundaries in austenitic stainless steels is a result of the occurrence of DDRX.22–24 Twin boundaries have an effect on DRX in terms of both DRX nucleation and growth.26,46 On the one hand, when the bow-out subgrain is the twin orientation of the parent grain, it is more likely for the subgrain to detach from the parent grain, promoting SIBM nucleation. On the other hand, when the twin orientation of DRX grain has a large misorientation with respect to the original grain, the interface migration rate of the recrystallized grain will also be large, thereby promoting the growth of the recrystallized grain. Therefore, twins play a crucial role in the dynamic softening of S31254.
Figure 12(a 2 ) to (c 2 ) and (a 3 ) to (c 3 ) reveals the misorientation changes within the original grains along blue arrows in Figure 12(a 1 ) to (c 1 ). For the segments A1 and A2 (Figure 12(a 2 ) and (a 3 )), their PTP and PTO curves exhibit dense alternating peaks, with almost every PTP peak exceeding 10°, indicating the generation of numerous HAGBs and microbands due to severe deformation within the grains. This observation is consistent with the HAGBs observed in Figure 11(a 1 ) to (a 3 ). As the temperature increases to 1100 °C (Figure 12(b 2 ) and (b 3 )), it can be found that the PTP curve of line segments B1 and B2 does not show as many HAGBs as at 1000 °C. Combined with the fact that there are no DRX grains in the area where line segments B1 and B2 are located, this indicates that preexisting HAGBs are one of the essential prerequisites for DDRX grain nucleation. Although DRX has not occurred yet, the dense interdigitated peaks with a misorientation of < 10° on the PTP curve indicate that DRV has occurred sufficiently in this region, forming a large number of subgrain boundaries and LAGBs. Line segment C1 is located at the outer region of the recrystallized grain, and its PTO misorientation shows a continuous accumulation trend with a small PTP misorientation < 2°, indicating that the deformation energy storage in this region is small. After DRV, lattice distortions are almost eliminated. On the other hand, line segment C2 is located on the residual original grain surrounded by recrystallized grains. It can be found that there are still a few LAGBs with a misorientation > 2° on its PTP curve, and its accumulated misorientation can reach > 20°, indicating that there is still a large amount of distortion energy inside this residual original grain. Combined with the observation in Figure 12(c 1 ) that recrystallized grains expand towards C2 rather than towards C1, this suggests that distortion energy is one of the essential factors driving DRX breeding and expansion.
Mechanism of DRX
In order to characterize the microstructure after hot deformation in more depth, TEM observations were performed on compression specimens under some of the deformation conditions, which are shown in the bright field images in Figure 13. A large number of thick-walled, high-density dislocation walls were formed inside the grains during deformation at 1000 °C and 0.01 s−1, as shown in Figure 13(a). These dislocation walls are evidence of DRV. Through DRV, the dislocation tangles generated by severe deformation undergo dissociation and rearrangement driven by distortion energy, thus evolving into adjacent unclosed or open dislocation walls. As
Transmission electron microscopy (TEM) bright-field micrographs of the specimens deformed at (a) 1000 °C, 0.01 s−1; (b) 1100 °C, 0.01 s−1; (c) 1200 °C, 0.01 s−1; (d) 1000 °C, 10 s−1; (e) 1100 °C, 10 s−1; and (f) 1200 °C, 10 s−1.
The DRX mechanism during metal thermal deformation includes CDRX and DDRX. 17 DDRX usually develops in materials with low SFE, such as austenitic stainless steel, and relies heavily on twin formation and SIBM for nucleation and growth.18,22,23 For DDRX, when subgrains form on pre-existing original HAGBs or on intragranular HAGBs generated by severe deformation, they can be driven by distortion energy to bow out on HAGBs through SIBM, and then nucleate to become the core of recrystallized grains. For CDRX, when the materials have high SFE, dislocations basically do not dissociate and expand but are more susceptible to cross-slip and climb.49,50 Therefore, subgrains can absorb dislocations dissociated from adjacent subgrain boundaries to coalesce. As the coalescence continues, subgrain boundaries gradually transform into LAGBs, and eventually into HAGBs to constitute recrystallized grains. Therefore, whether it is DDRX or CDRX, the recrystallization process cannot be separated from the formation of subgrains and LAGBs.
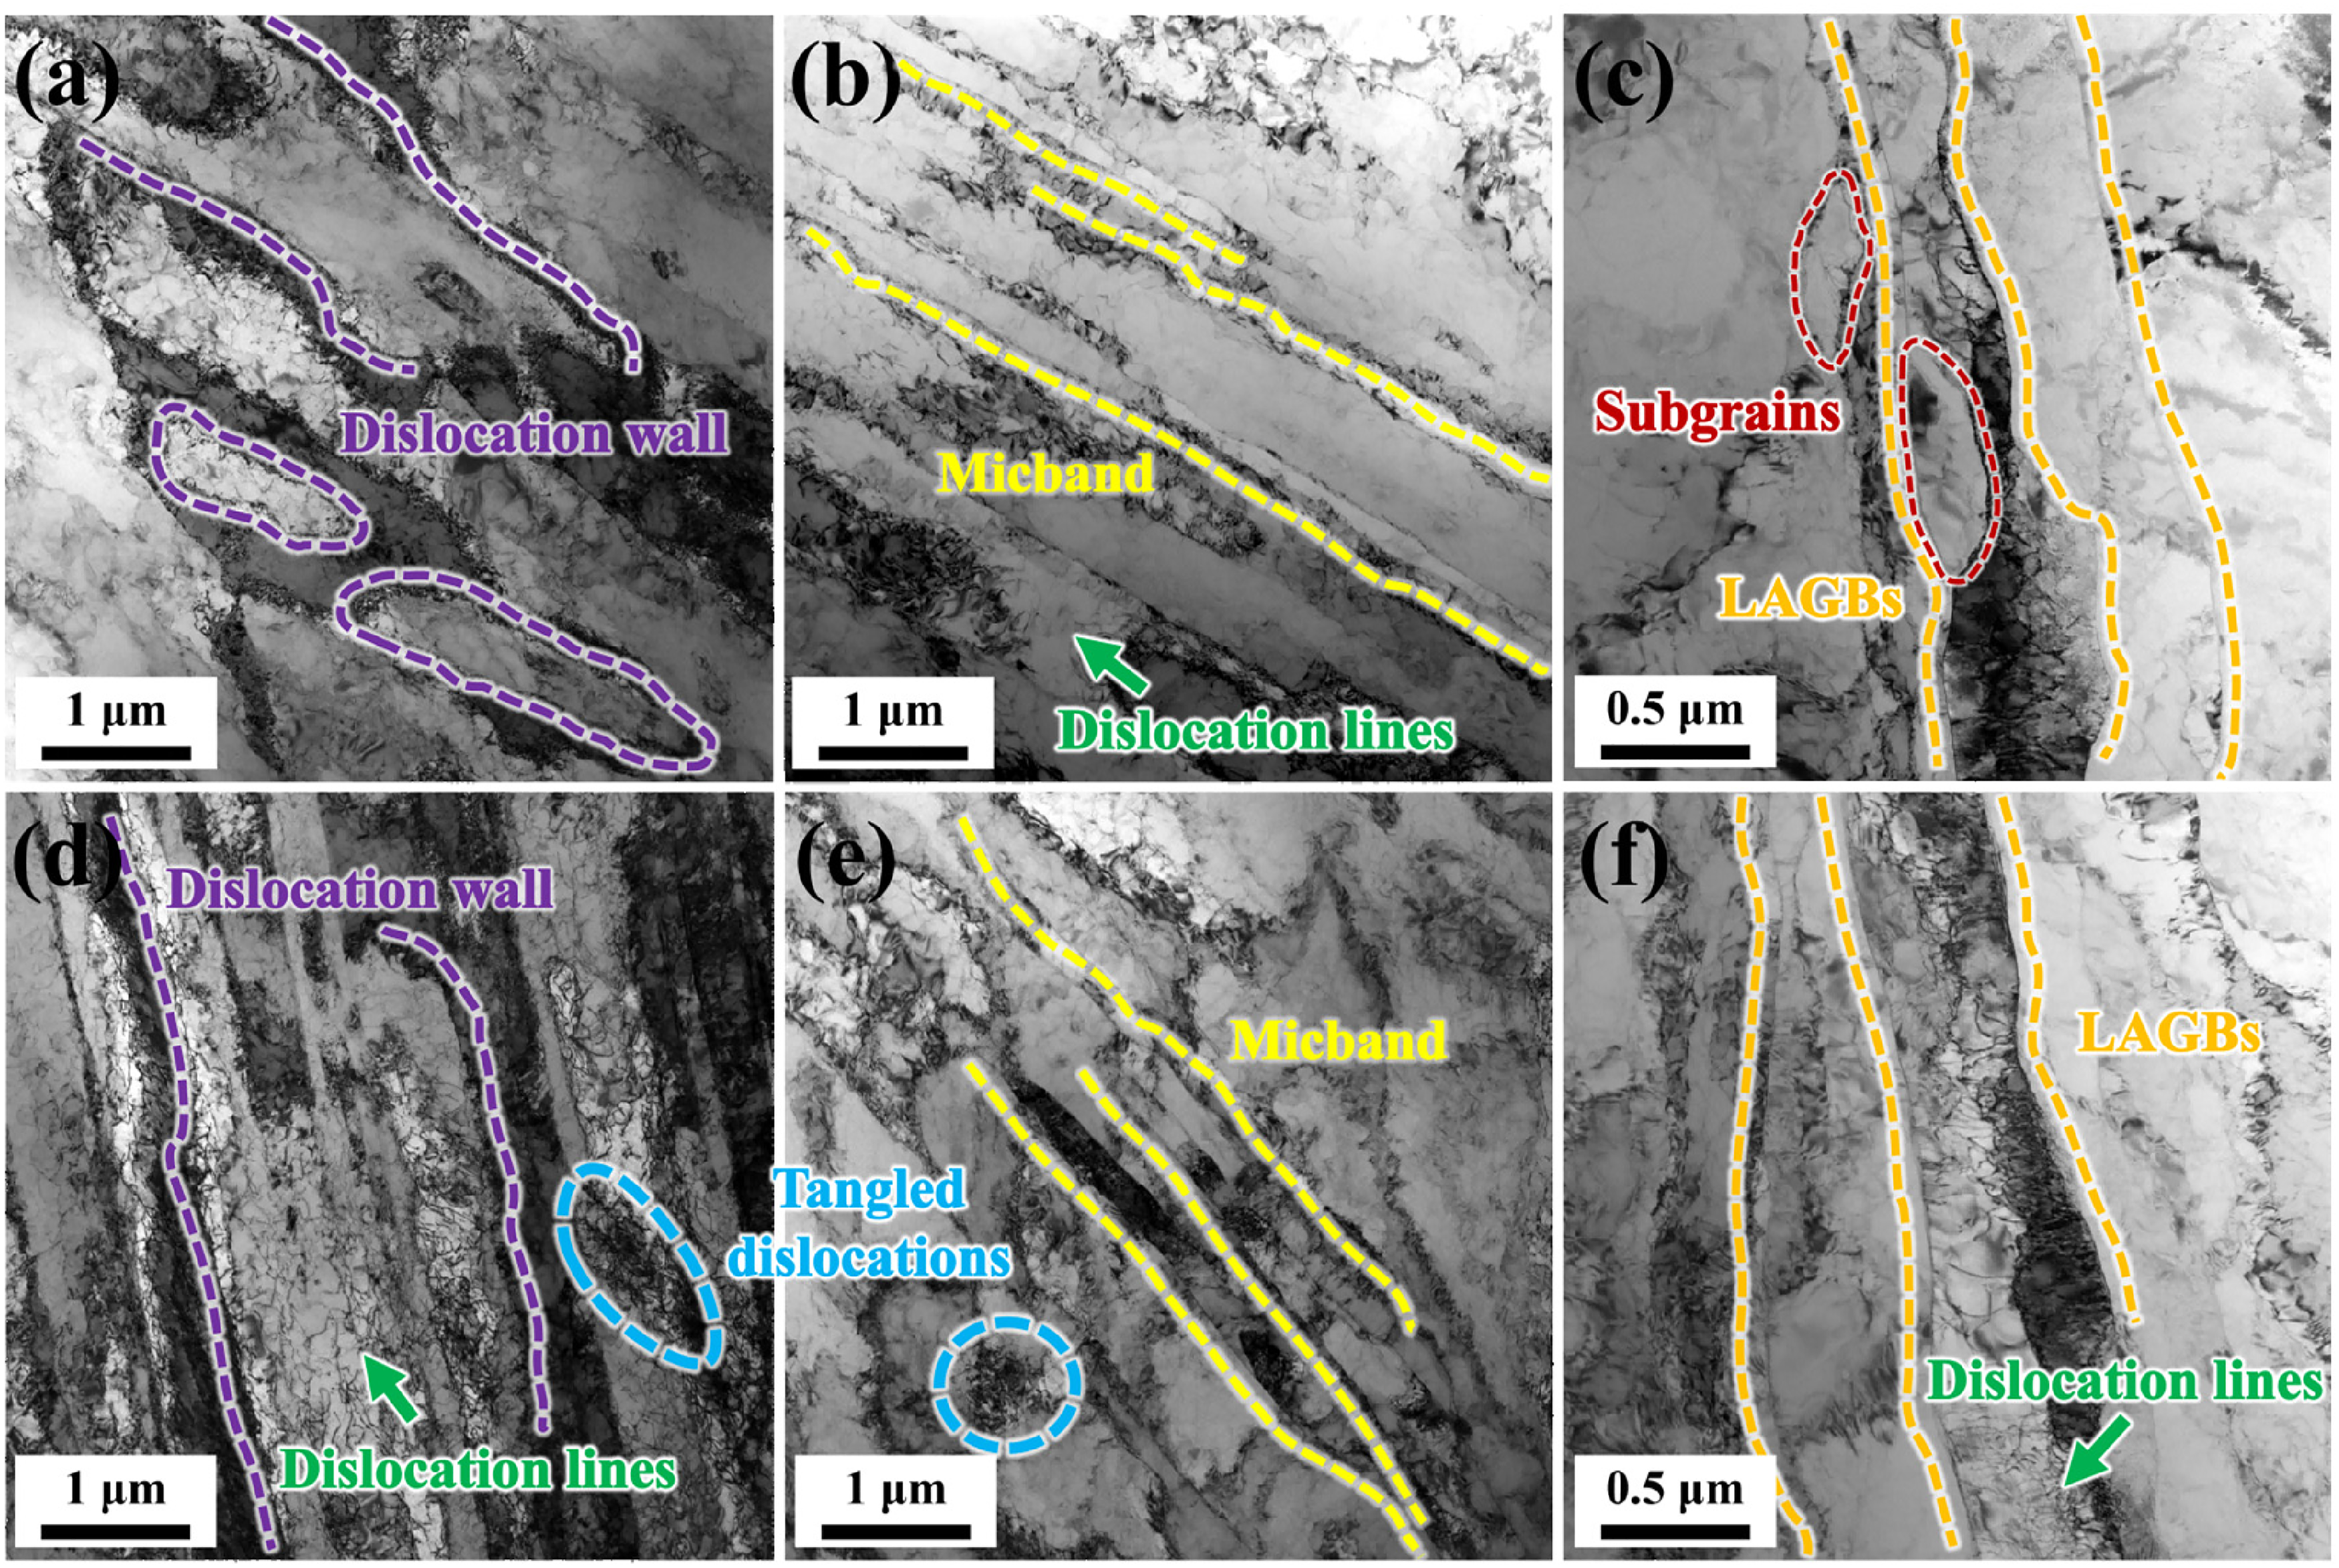
The nucleation mechanisms of DDRX and CDRX are different, so they can be distinguished based on the distribution characteristics of the misorientation angle. If the misorientation angle is distributed in large proportions in the range of 2°–10° and > 20°, and the medium angle range of 10°–20° is not dominant, it indicates that DDRX has occurred. On the contrary, if the misorientation angle is distributed in large proportions in the medium angle range of 10°–20°, it indicates that subgrain progressive rotation, that is, CDRX, has occurred.17,51 Figure 14 shows the trend of misorientation angle and its corresponding proportion under various deformation conditions for S31254. It can be observed that the misorientation angle is mainly distributed in the LAGBs and > 20° ranges. The proportion of misorientation angle gradually shifts from the LAGBs range to the > 20° range as temperature increases. With the exception of 0.01 s−1, 1200 °C (Figure 14(c)), the proportion of misorientation angle in the medium angle range of 10°–20° remains low under other deformation conditions. In addition, for materials with low SFE, twin boundaries generally occur randomly during recrystallization growth around the recrystallized grains formed by bow-out nucleation. It can be found that when the proportion of misorientation angle in the HAGBs range is high, the proportion of twin boundaries is also high, indicating that DDRX grains are mainly nucleated and grown by SIBM. Based on the features of misorientation angle in Figure 14, combined with the typical microstructure features observed in the “Microstructure evolution” section such as the “necklace-like” microstructure (Figures 9 and 11) and grain boundary bow-out (indicated by black arrows in Figure 9(a 1 ) and (b 1 ) local enlargement and yellow arrows in Figure 11(b 1 ) local enlargement), it can be inferred that except for high temperature and low strain rate conditions, the DRX mechanism of S31254 under other deformation conditions is DDRX characterized by grain boundary bow-out.
Misorientation histograms and the corresponding fraction variation following deformation at (a) 1000 °C, 0.01 s−1; (b) 1100 °C, 0.01 s−1; (c) 1200 °C, 0.01 s−1; (d) 1000 °C, 10 s−1; (e) 1100 °C, 10 s−1; and (f) 1200 °C, 10 s−1 in S31254, respectively.
Under high temperature and low strain rate (Figure 14(c)), the significantly higher proportion of misorientation angle in the range of 10°–20° indicates a different nucleation mechanism. Typically, CDRX is considered as an extension of dynamic recovery. The deformed microstructure has sufficient time to recover at 0.01 s−1 and 1200 °C, so it can clearly observe the gradual transition of the misorientation angle of LAGBs from small to large in the deformed grains, as shown in Figure 15. Figure 15(b) shows that a large number of coarsened subgrains surrounded by different angles of LAGBs are distributed inside the original grains. During deformation, these coarsened subgrains are formed by coalescing adjacent subgrains with almost the same orientation through internal subgrain boundary dissociation. Dislocation climb and concentrate near the LAGBs (Figure 15(c)), and form a grid of LAGBs with different angles (indicated by the yellow arrows in Figure 15(b)). When a subgrain is surrounded by higher angle LAGBs (Figure 15(b), subgrain a), it will continue to grow as a DRX grain by absorbing more dislocations (Figure 15(b), grain b). This result is in line with the recrystallization behavior reported by Liao et al. 26 during hot deformation of 654SMO. Obviously, under high temperature and low strain rate deformation conditions (0.01 s−1, 1200 °C), the DRX mechanism of S31254 is CDRX with subgrain coalescence as the nucleation mode.
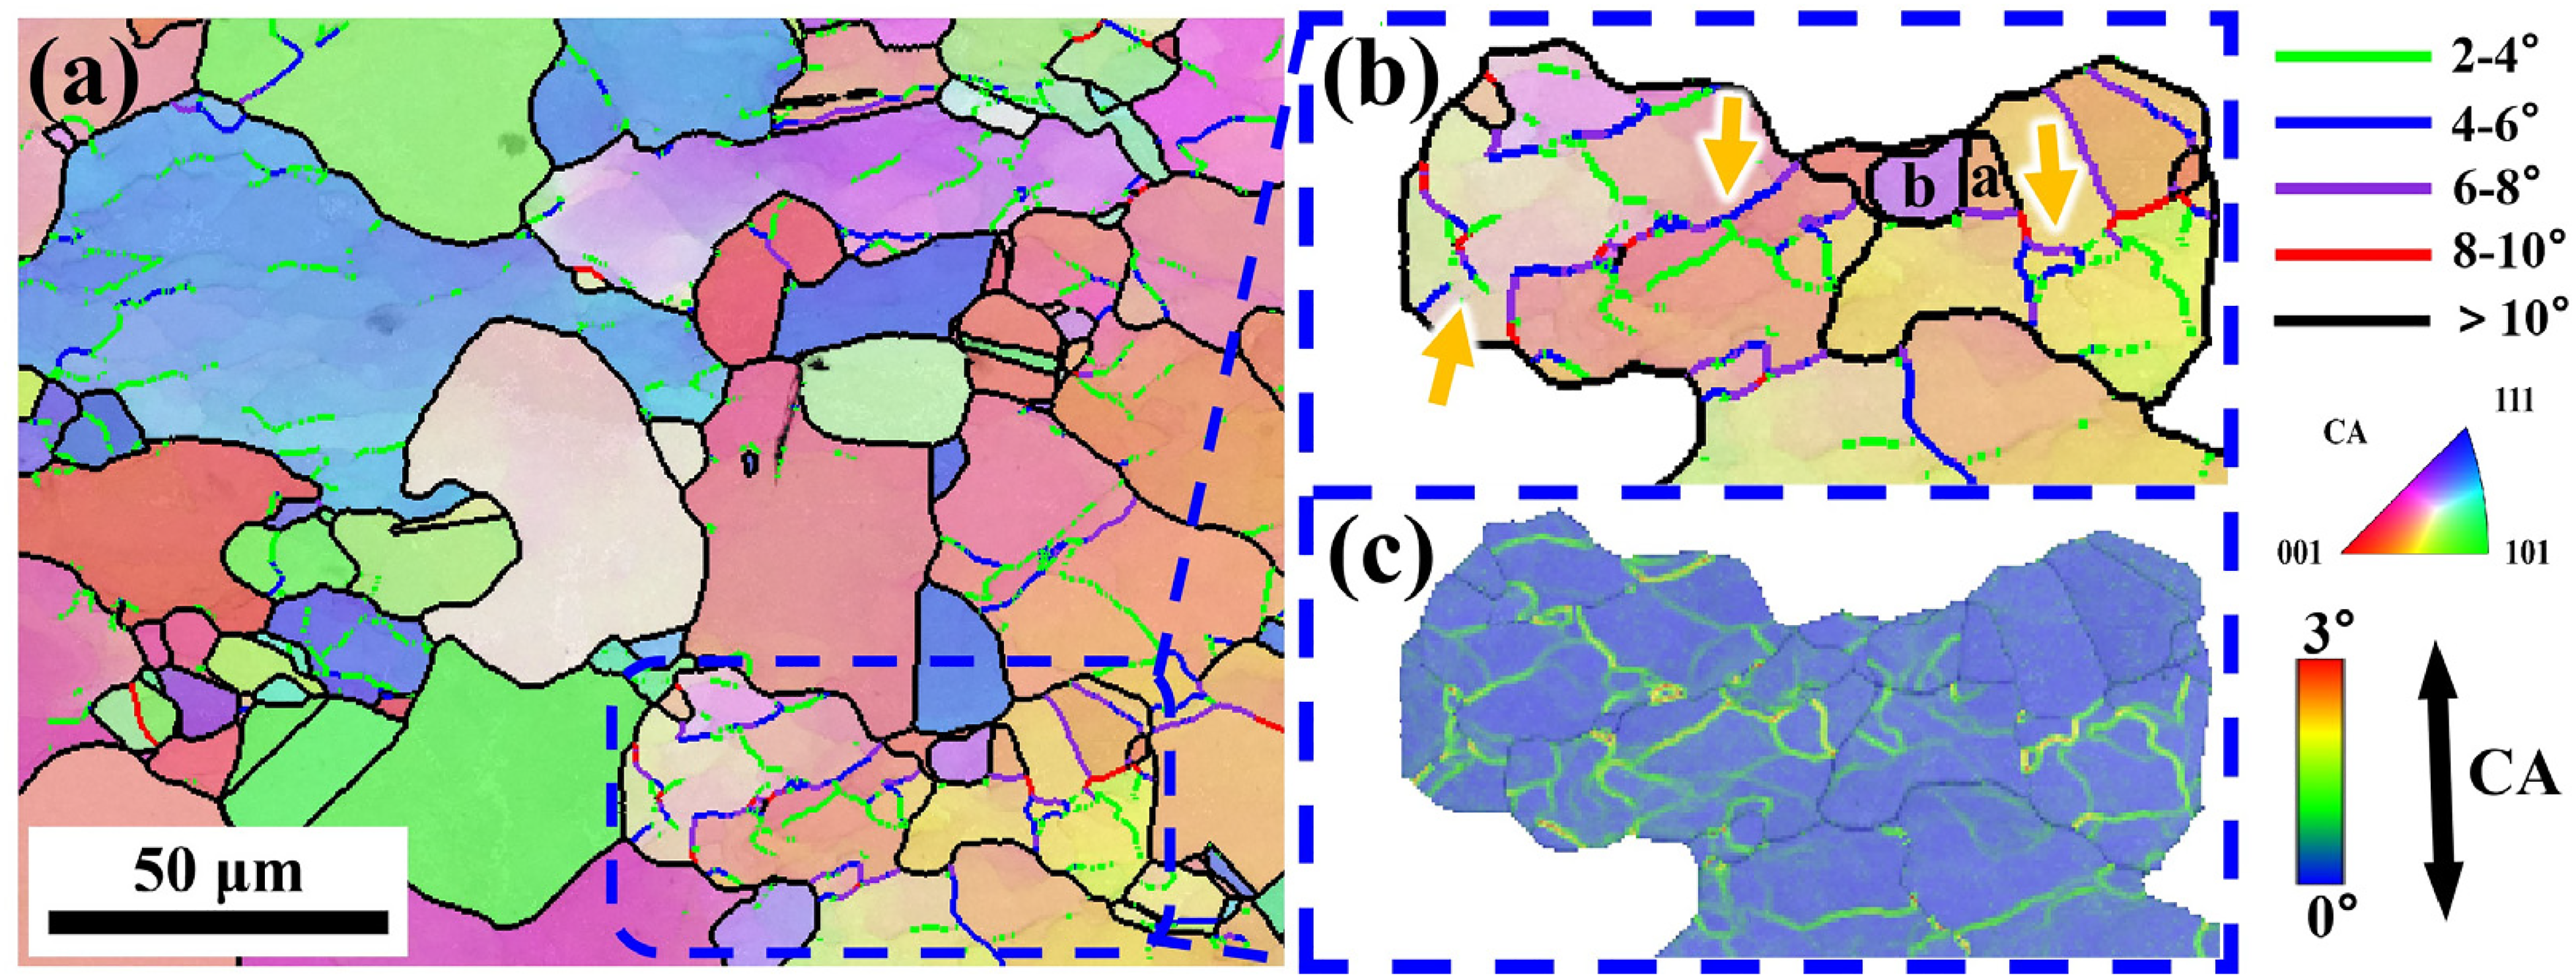
EBSD analysis results include (a) IPF maps of S31254 at 0.01 s−1, 1200 °C, as well as its locally enlarged (b) IPF and (c) KAM maps, wherein the green, blue, purple, red, and black lines in the IPF maps represent boundaries with misorientation of 2°–4°, 4°–6°, 6°–8°, 8°–10°, and >10°, respectively.
Conclusions
This work investigated the hot deformation behavior and microstructure evolution of homogenized SASS S31254 through uniaxial compression at temperatures ranging from 950 °C to 1200 °C and strain rates ranging from 0.01 to 10 s−1. The major conclusions are as follows:
(1) Similar single-peak characteristics can be identified in the flow curves at various deformation conditions. The impact of work-hardening was intensified with higher strain rates. However, the adiabatic temperature rise led to a greater degree of flow softening at 10 s−1 compared to 1 s−1. (2) The critical stress and critical strain required for DRX were calculated based on the double-differential method. The critical stress decreases with an increase in deformation temperature or a decrease in strain rate. It was observed that DRX occurred at a true strain of 0.32 or less under all deformation conditions. (3) The constitutive equation was constructed based on the hyperbolic sine Arrhenius function. The activation energy was calculated to be 602.373 kJ/mol. The relationship between the critical stress (σc) and peak stress (σp), as well as the relationship between the critical strain (εc) and peak strain (εp), can be expressed as σc ≈ 0.97σp, εc ≈ 0.49εp. (4) The dynamic softening of S31254 is mainly achieved through DRX. The higher deformation energy storage and adiabatic temperature rise are the reasons for the higher proportion of DRX at high strain rates. Recrystallized grains preferentially nucleate on HAGBs and grow driven by distortion energy, extending towards high misorientation. (5) The formation of low-angle grain boundaries and subgrains by dynamic recovery is the basis for DRX to occur. The DRX mechanism of S31254 is mainly discontinuous DRX characterized by grain boundary bow-out. However, the DRX mechanism is transformed into CDRX with subgrain coalescence as the nucleation mode at 1200 °C, 0.01 s−1.
Footnotes
Acknowledgements
The authors would like to acknowledge support from the National Key Research and Development Program of China (grant no. 2023YFB3712400) and the National Natural Science Foundation of China (grant nos. 52027805, 52204381, and U1806220).
Author contributions
Zhu Cao: conceptualization, methodology, writing-original draft, and data curation. Luhai Liao: investigation and visualization. Xinghai Zhang
Data and code availability
The raw and processed data required to regenerate these findings will be shared with interested parties upon reasonable request.
Declaration of conflicting interests
The author(s) declared no potential conflicts of interest with respect to the research, authorship, and/or publication of this article.
Funding
The author(s) disclosed receipt of the following financial support for the research, authorship, and/or publication of this article: This work was supported by the National Natural Science Foundation of China, National Key Research and Development Program of China, (grant numbers 52027805, 52204381, U1806220, and 2023YFB3712400).