
Abstract
The accurate prediction of SO2, NOx and PM emissions in the iron ore sintering process could adjust the desulfurization and denitrification operation in time. The study presented an integrated prediction model for SO2, NOx and PM in sintering flue gas. Gradient boosting decision tree, recurrent neural network, gated recurrent unit were chosen as sub-models to predict SO2, NOx and PM by comparing different regression prediction models, which were then combined to form an integrated prediction model (MMEP). The box plots, empirical mode decomposition algorithm, Pearson correlation coefficient and maximum information coefficient to select independent variables for the predictive model. The MMEP model had an overall accuracy greater than 0.82, as verified by production data, which could provide guidance for on-site sintering production.
Keywords
Introduction
The SO2, NOx and PM generated from the sintering process of iron ore fines were the main pollutants of the iron and steel production process, which were prone to react with moisture and hydrocarbons in the atmosphere to form acid rain that contaminated soil and water.1,2 The SO2 in sintering flue gas mainly came from iron ore and solid fuel, and the generation of NOx was mainly in the sintering ignition stage, solid fuel combustion and high-temperature reaction stage, and the formation of PM came from the sintering raw fuel, the combustion made the exhaust flue discharge a large amount of dusty waste gas. The detection and treatment of sintering flue gas pollutants were carried out almost simultaneously, which led to passive adjustment of the treatment process.3,4 Advance prediction of major pollutants in sintered flue gas provided effective guidance for desulfurization and denitrification operations. Therefore, it was significant that established a mathematical model to predict SO2, NOx and PM during the sintering process.
Currently, the prediction of SO2, NOx and PM produced during the iron ore sintering process was mainly based on mechanistic and data-driven models. Ni et al. 5 used numerical model methods to explore the influence of fuel types and operational parameters on nitrogen oxides. However, due to part assumptions in the computation process, less likely to be applied in actual production. Some scholars had utilized the PSO-BP neural network 6 and radial basis function neural networks 7 to predict the main pollutants in sintering flue gas, which achieved good predictive accuracy, but less consideration to account for the noise due to unstable gas flow rates and flue gas in the ducts, the noise data affected the stability and reliability of prediction model. To address the challenge of precise SO2, NOx and PM prediction, the study presented an integrated prediction model based on noise processing framework.
The integrated prediction model utilized box plots to eliminate outliers produced during the sintering process. The adaptive empirical mode decomposition (EMD) algorithm was employed to denoise the SO2, NOx, and PM data. The Pearson correlation coefficient and the maximum information coefficient (MIC) were combined to choose sintering parameters, with the affected SO2, NOx, and PM selected as the input for the prediction model. By comparing different deep learning algorithms, the best-performing one was chosen as the sub-model, and it was combined with others to form an integrated prediction model. The model was verified using metrics such as mean squared error (MSE), the optimal fit R2, and so on.
Sintering flue gas emission process description and model structure design
The main pollutants in the flue gas during the sintering process of iron ore powder were described in detail, which involved the generation and emission of major pollutants such as SO2, NOx and PM,8,9 and an integrated prediction model framework was established for the prediction of SO2, NOx and PM in the sintered flue gas.
Description of the sintering flue gas emission process
The iron ore sintering process mainly consisted of the following steps: batching, mixing, ignition, sintering, crushing, cooling and screening, as illustrated in Figure 1. Various materials such as iron ore powder, coke powder, limestone, dolomite and returned fines were thoroughly blended in predetermined proportions to form a mixture. The mix combined with an appropriate amount of water was evenly spread on a sintering pallet to enhance the sintering quality. As the pallet moved past the ignition furnace, the material layer was ignited and burned, with the entire sintering process being powered by the negative pressure generated by the main exhaust fan in the wind box. The resultant pollutants were collected into the flue, which were emitted by desulfurization and denitrification treatments. When the pallet reached the end, the mixture had been burnt and melted, indicating the final sintered ore had formed. The finished sintered ore was crushed by a crusher, cooled by a ring cooler and screened with a sieve. During the unloading process, pollutants were present and must be treated before emission. The qualified sintered ore was used as a raw material for blast furnace ironmaking, with the smaller particles were returned.10–12
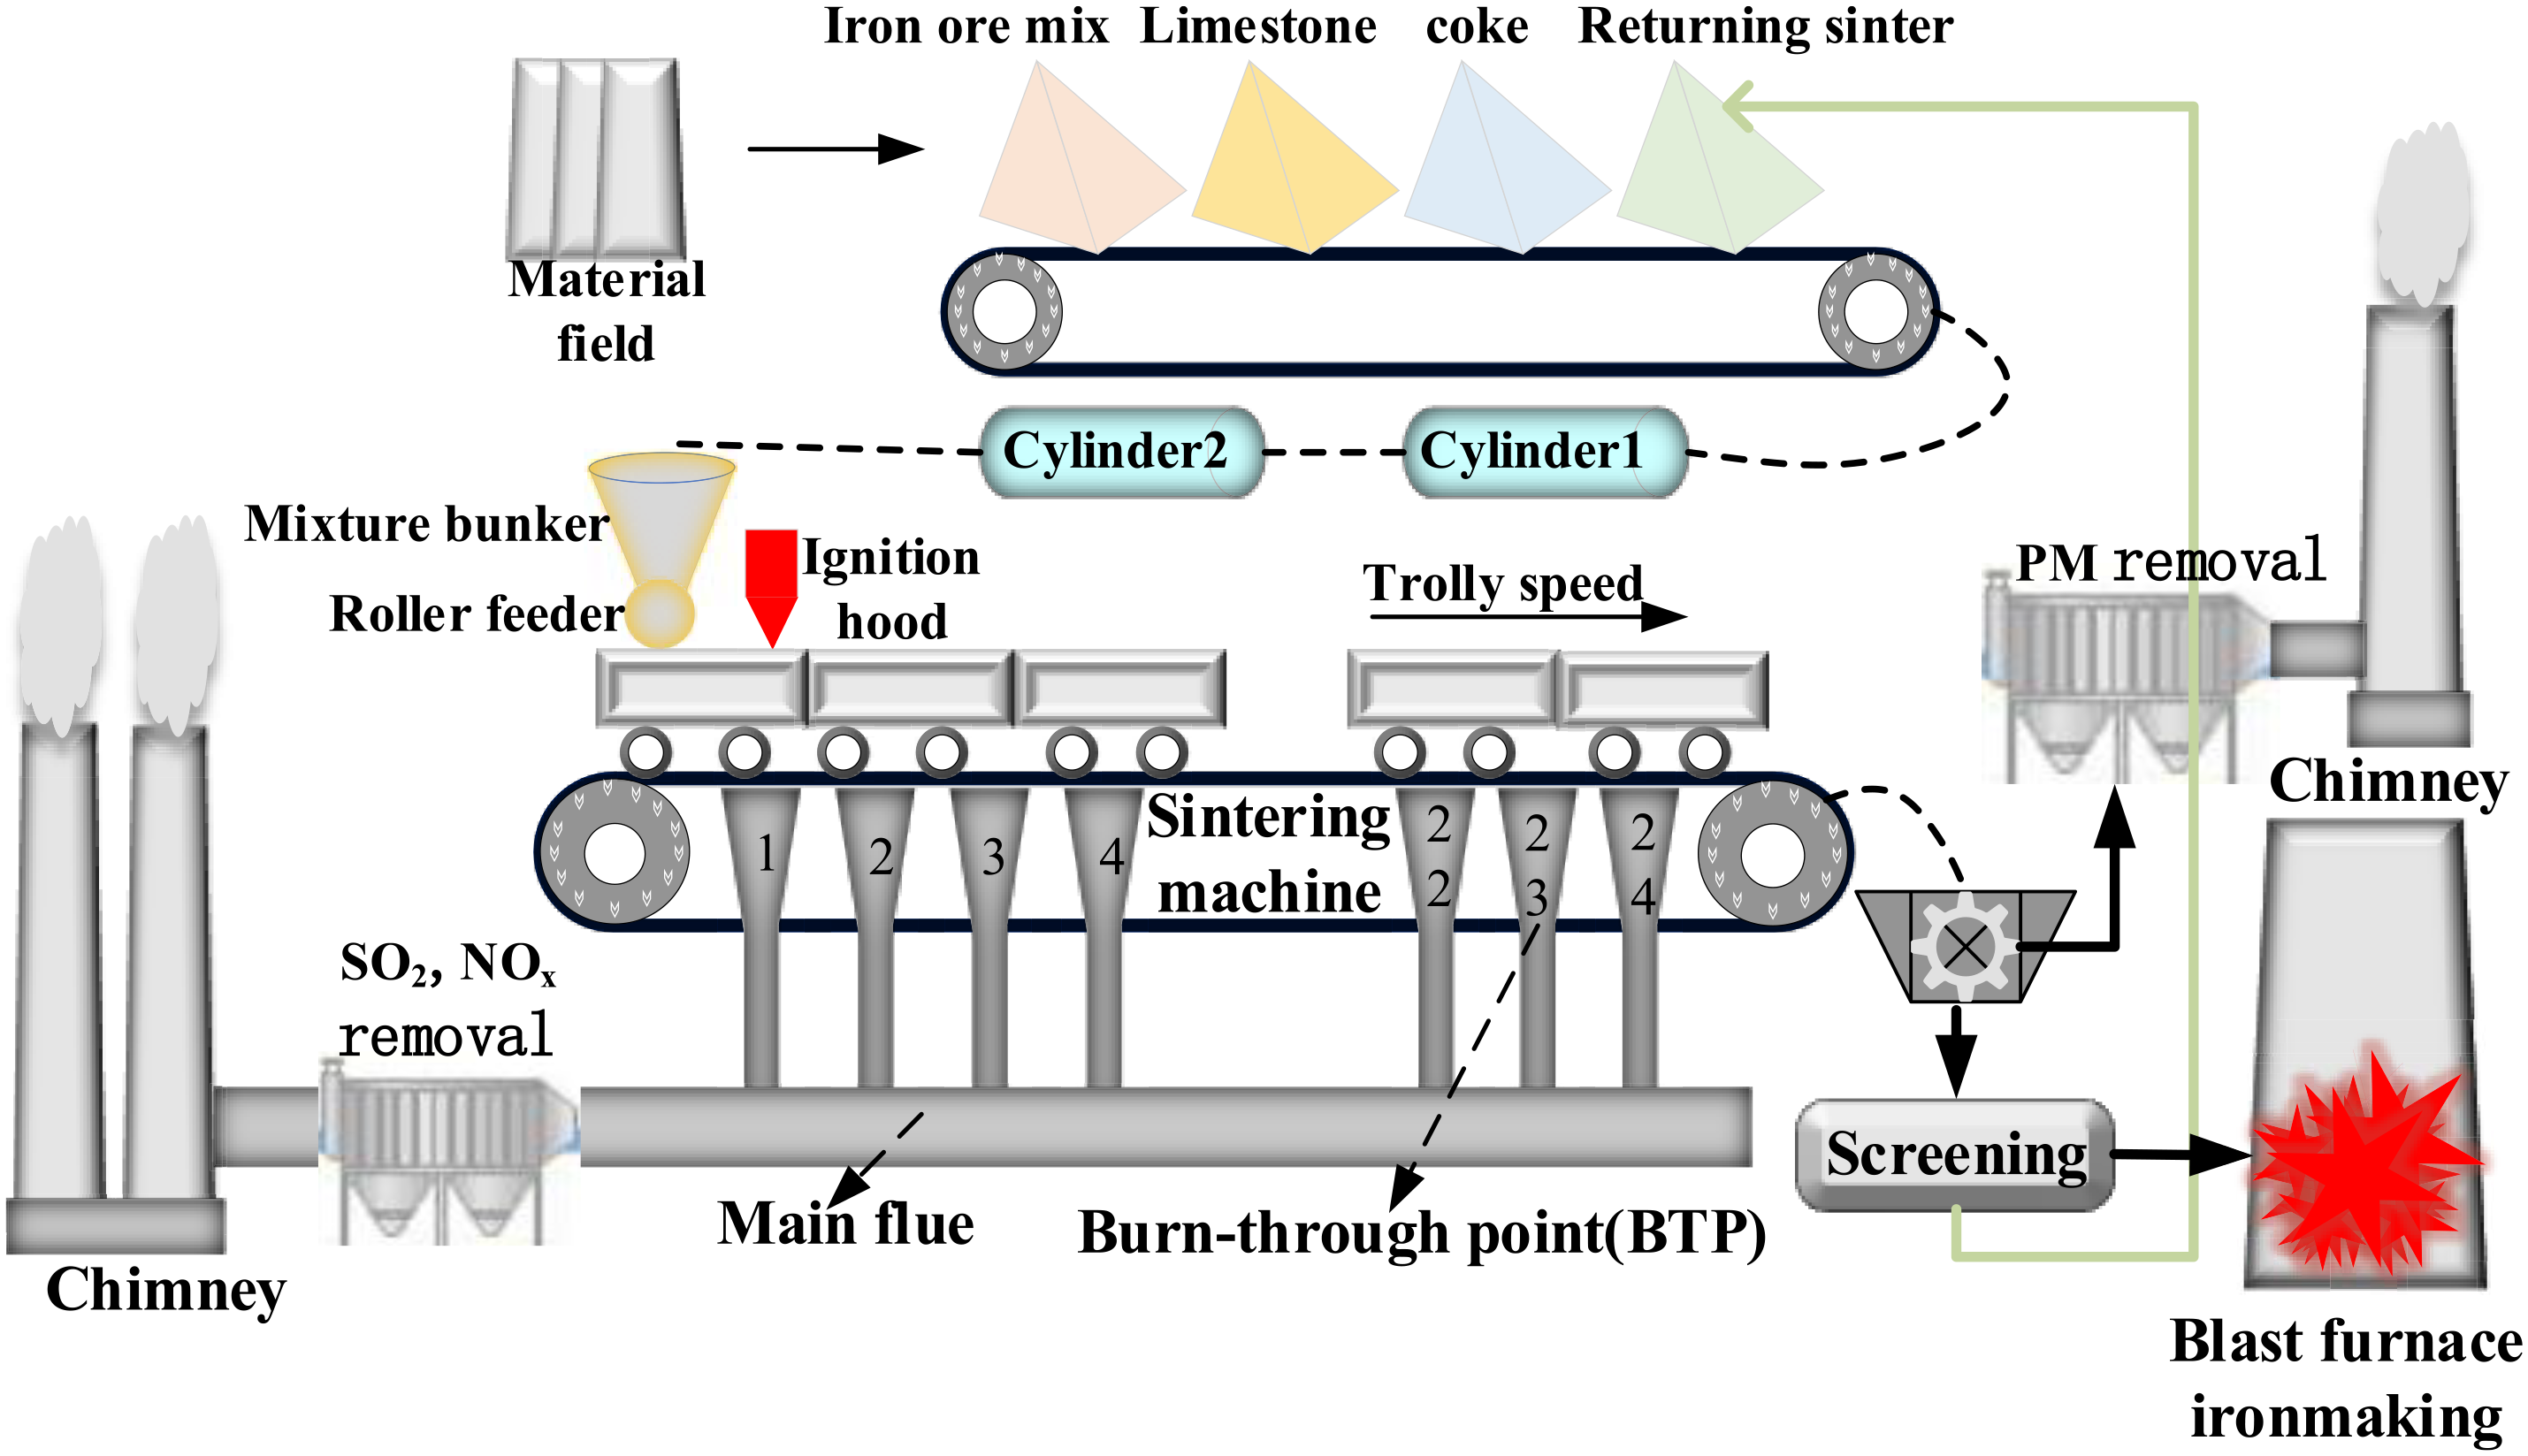
Sintering process of iron ore powder.
Design of model structure
The establishment process of the multi-model integrated prediction model is shown in Figure 2. Box plots were used to eliminate outliers in the sintering process, and the adaptive EMD algorithm was applied for noise reduction. After processing, the data underwent linear and non-linear correlation analysis to determine the sintering parameters that affected SO2, NOx and PM, which different deep learning algorithms were used for prediction, and with good prediction accuracy and stability was selected as the sub-model. The integrated prediction model was formed by combination to enable advance forecasting.
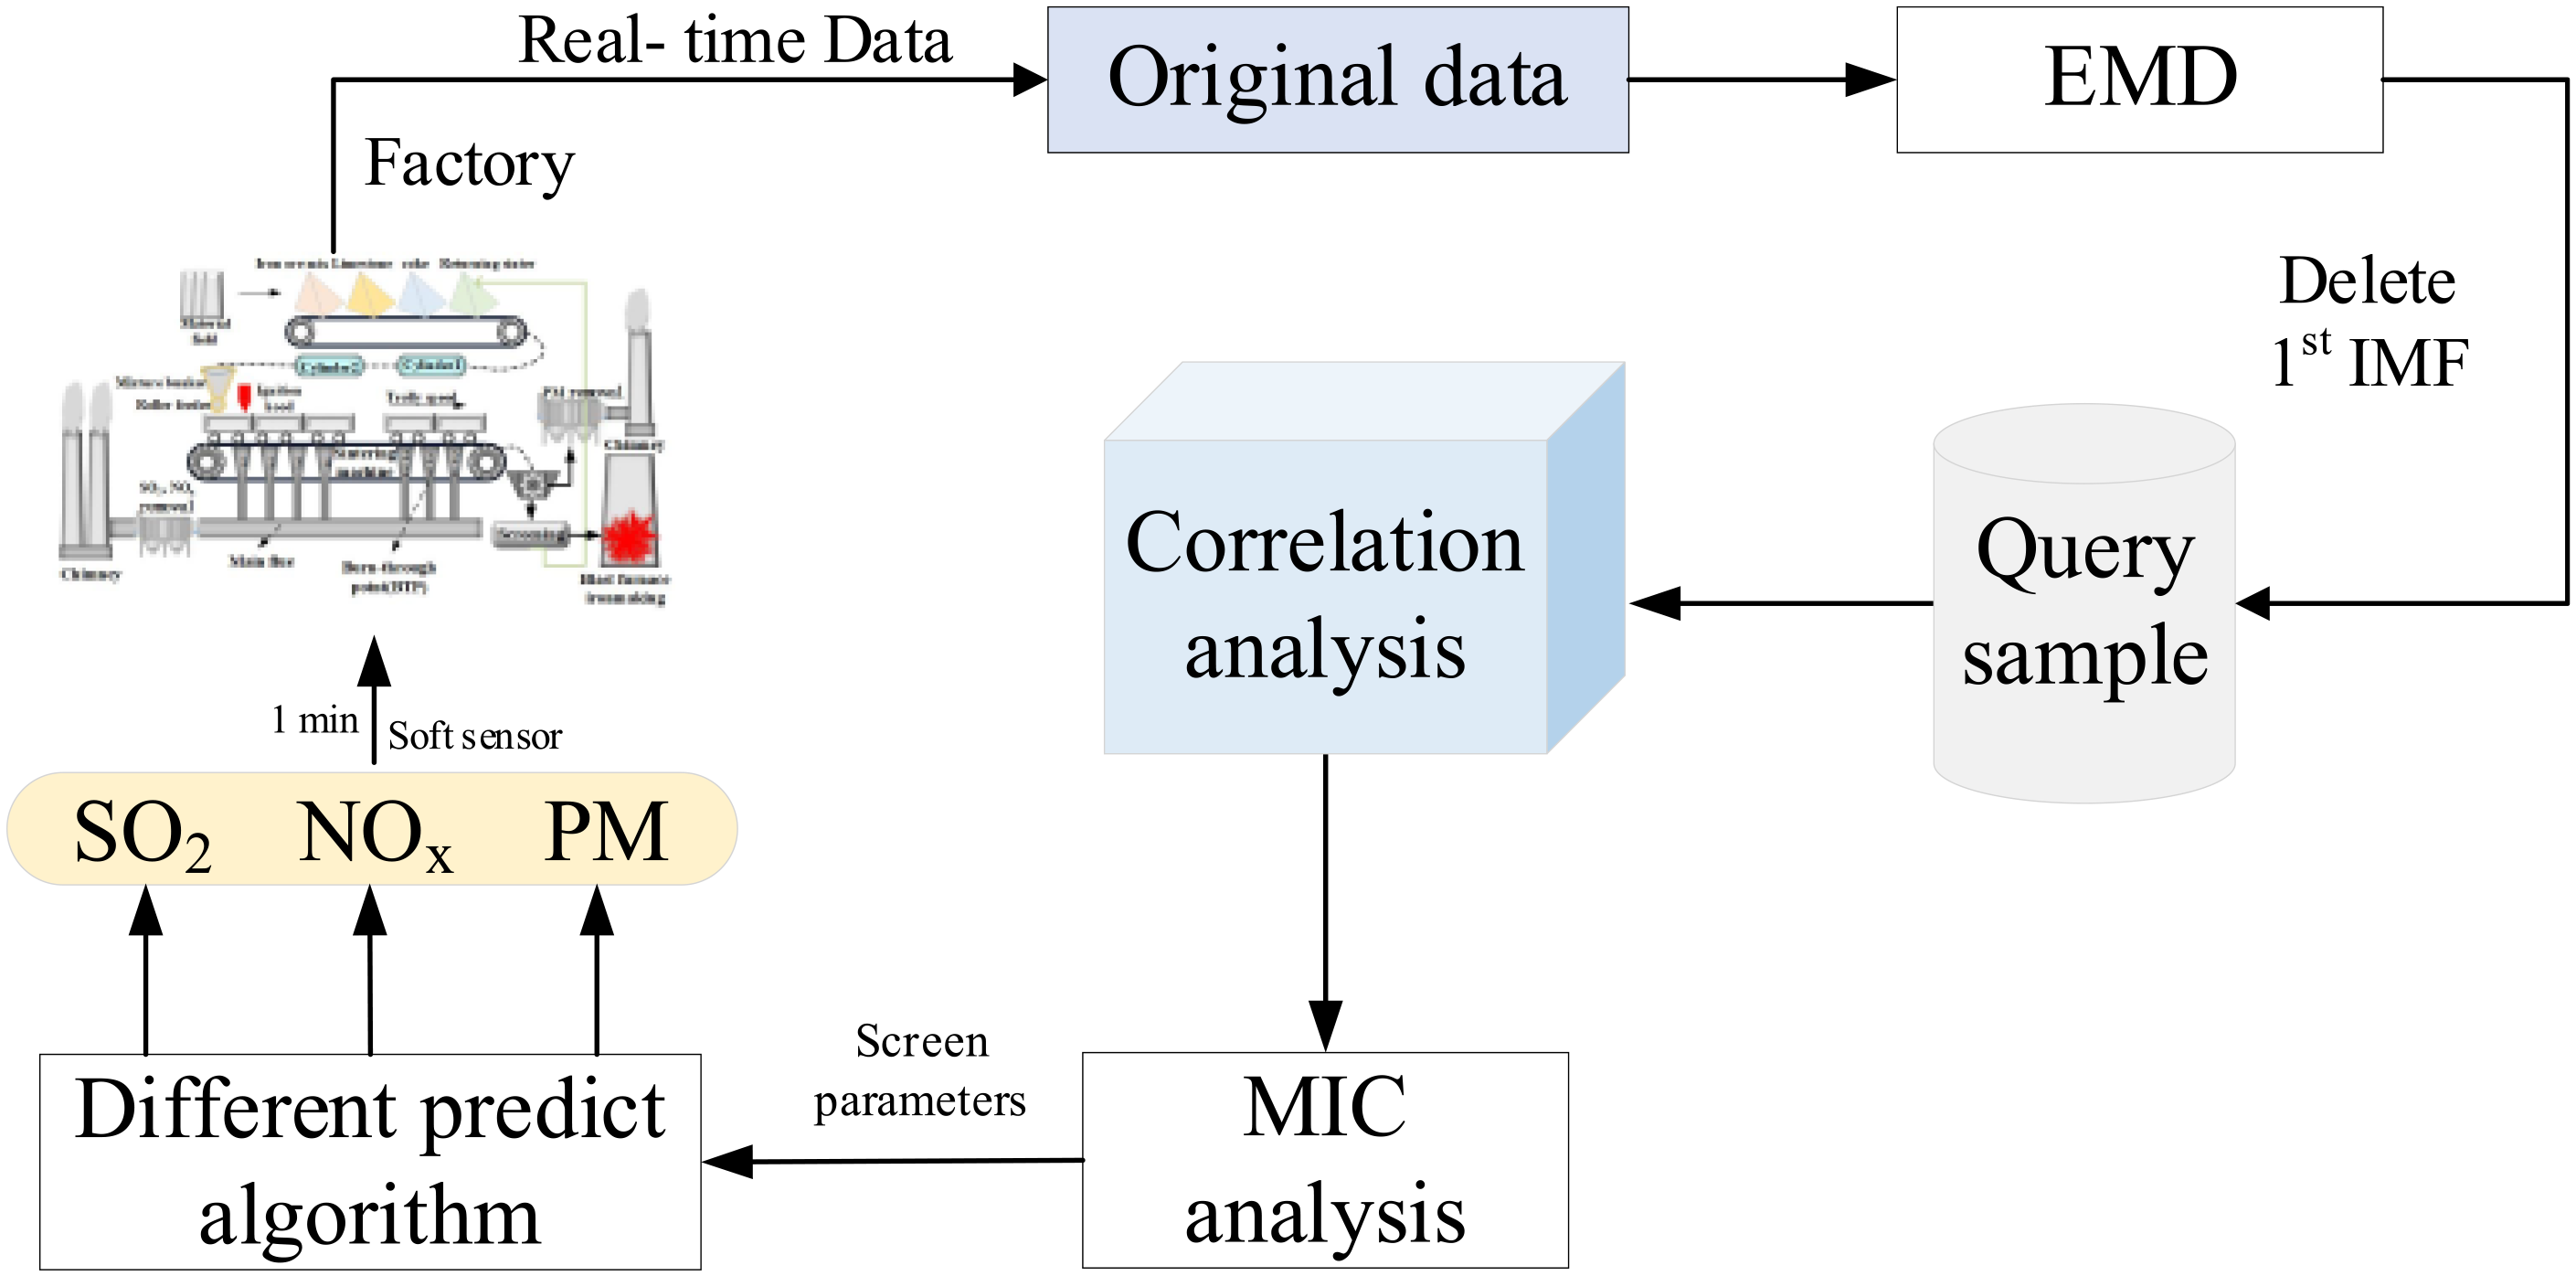
Model structure diagram.
Design of the model for forecasting sintering flue gas
The detailed stages of designing the integrated prediction model were introduced; the main contents were data preprocessing of the sintering process, prediction model and error evaluation.
Data preprocessing model during the sintering process
The sintering of iron ore powder was a complex physicochemical process where variations in raw materials and instability in operating equipment led to the acquisition of data with certain anomalies. Box plots were adopted at depicting the central location and the spread of multiple groups of continuous quantitative data. The height of the box reflected data fluctuations and could be employed to exclude outlier data encountered during the sintering process.
During the collection of SO2, NOx and PM indices, some noise was present, affecting the precision of the model. The EMD was an effective data processing method for noise reduction. The principal steps of EMD involved iteratively decomposing the original signal into multiple IMFs and a residual. The univariate signal x(t) was expressed by Equation (1):

Regression forecasting model for SO2, NOx and PM in the sintering process
The iron ore sintering process was a continuous time-sequential operation, according to the data characteristics, the machine learning algorithms (gradient boosting decision tree (GBDT), K-Nearest Neighbors (KNN) and support vector regression (SVR)) and deep learning algorithms (recurrent neural network (RNN), long short-term memory (LSTM) and gated recurrent unit (GRU)) were selected for the comparison, in which the RNN, LSTM and GRU algorithms accounting for temporal influences.
GBDT14,15 was an iterative decision tree algorithm that consisted of an ensemble of decision trees, and the results of all the trees were summed up to get the final answer. The algorithm generalized well on densely distributed datasets and could automatically detect higher order relationships between features and allowed for parallel computation between trees, resulting in fast computation and high predictive accuracy. However, the computational complexity increased with higher data dimensions.
The KNN algorithm 16 calculated using the Euclidean distance, computing the distance from one point to all other nearby points, then selecting the closest K points. The classification of these K points was tallied to assign a category, thereby facilitating regression prediction.
SVR 17 was a non-probabilistic algorithm that utilized kernel functions to map data into a high-dimensional space. In the space, it sought the optimal hyperplane that maximized the margin between the hyperplane and the training data to derive the regression model. Unlike other regression models, SVR transformed the regression problem into a process of finding a function that approximates the true function.
RNNs 18 were neural network models capable of processing sequential data, remembering previous information and applying it to current computations. RNN could solve many sequence-related problems due to their recurrent connections, which allowed them to handle variable-length sequence input. The predicted the next output based on prior information, making their memory capabilities highly effective for temporal information processing.
LSTM 19 was an enhanced RNN architecture that addressed issues of vanishing and exploding gradients and improved the modeling of long-term dependencies. Through the gating mechanisms (forget gate, input gate, output gate), which could filter out unnecessary information, thereby enhancing model performance.
GRU20,21 was capable of retaining information over long sequences without clearing it over time or removing it due to irrelevance to the prediction, preserving relevant information to be passed on to the next unit, utilizing all information and thereby avoiding the vanishing gradient problem. The algorithm was straightforward and effective, with fast computation speed, featuring only two gates (update gate and reset gate), fewer parameters, and was easier to optimize.
Prediction models evaluation
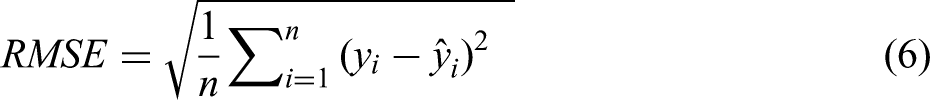
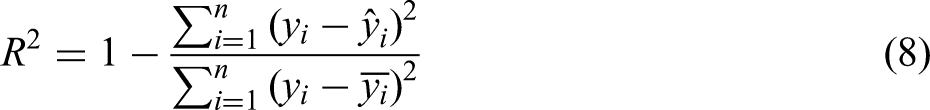
MSE, root mean squared error (RMSE), mean absolute error (MAE) and the coefficient of determination (R2) were employed to evaluate the performance of the combined model.22,23


Experimental results
Sintering parameter preprocessing
Selecting actual operational data from a sintering plant, the data range was analyzed and the average values were computed. The process theory was integrated with sintering production data to address the correspondence of sintering production parameters. After preprocessing, the fluctuation ranged for SO2, NOx and PM were, respectively, 541.1–2500.2 mg/m³, 105.93–311.25 mg/Nm³ and 19.23–195.815 mg/Nm³, with the average values being 1645.33 mg/m³, 209.94 mg/Nm³ and 65.34 mg/Nm³ respectively, data distribution is as shown in Table 1.
Sintering process data analysis table.
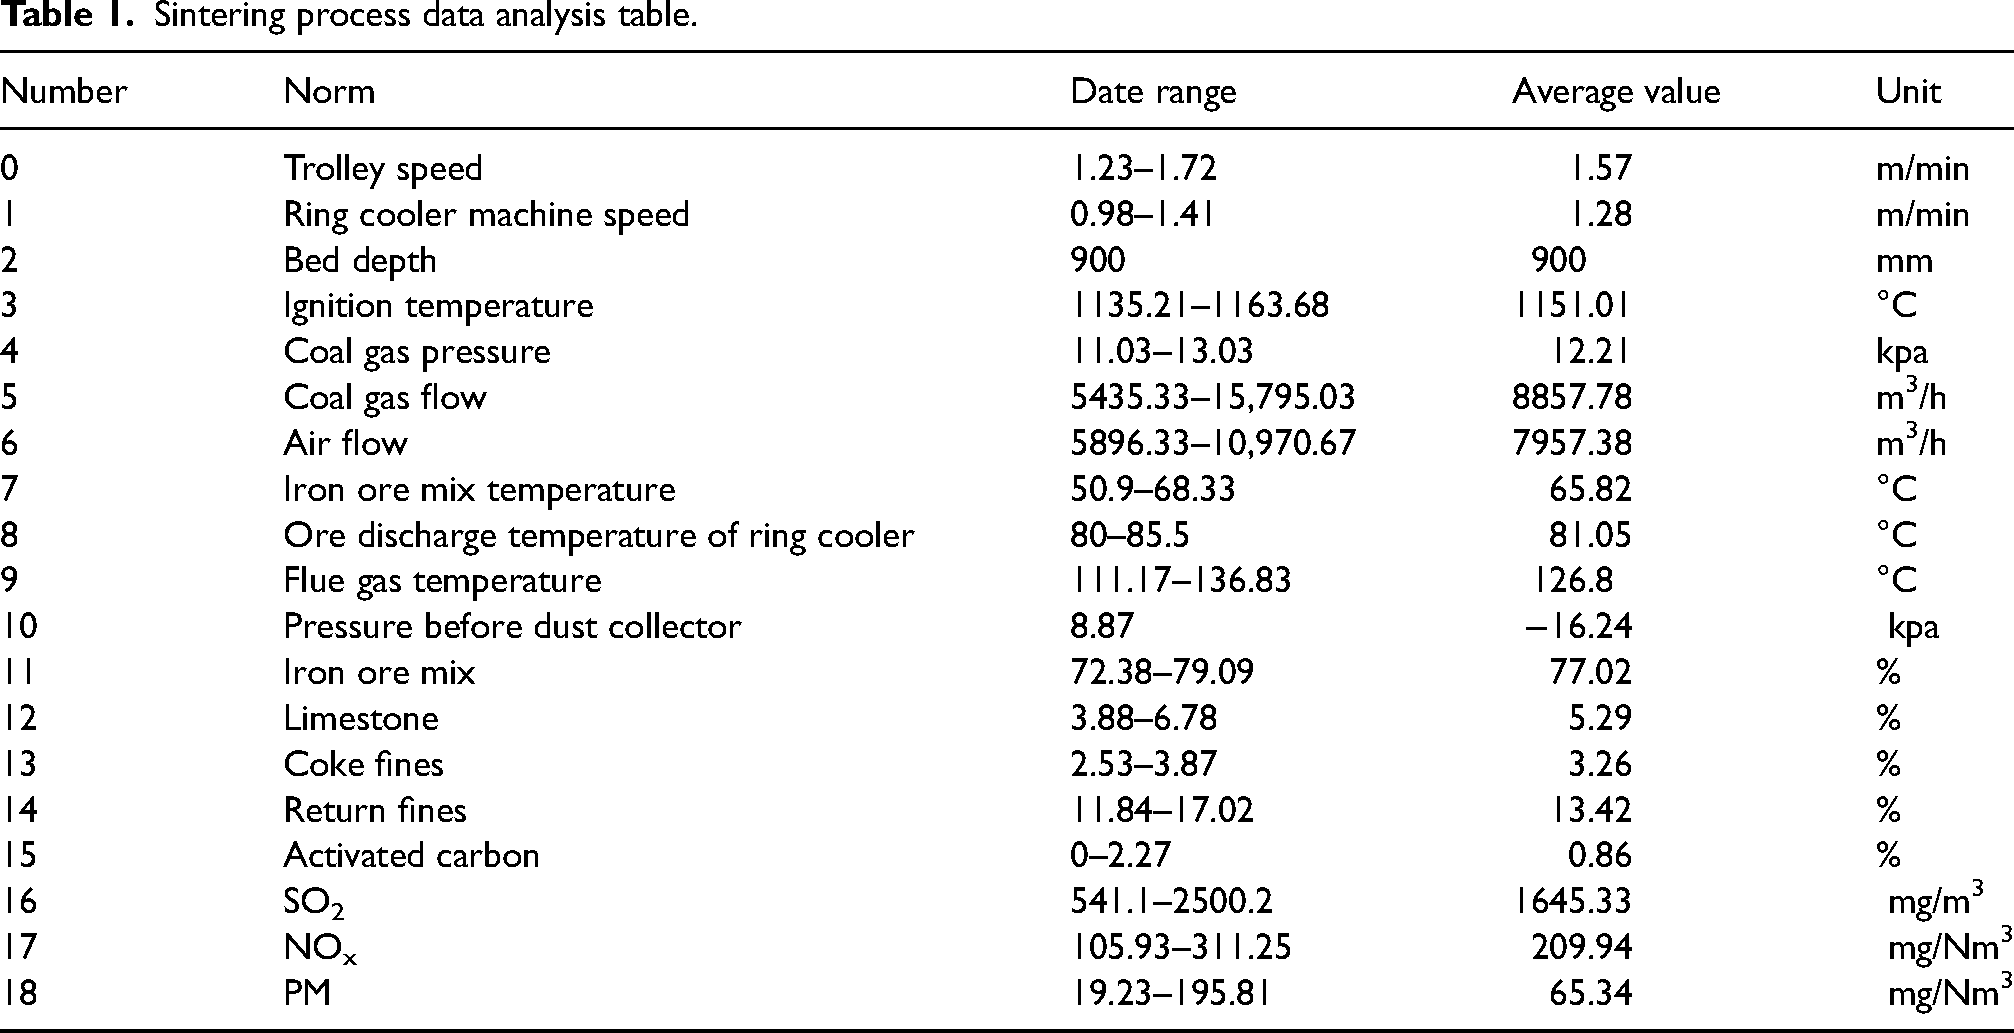
During the iron ore sintering process, production materials and operational conditions were changed, resulting in outliers within the sintering index data. With varying standards for measuring different indices, the data were normalized. As shown in Figure 3, outliers were displayed as black dots, with indices 2, 9 and 10 showing the most significant range of outliers. The outliers affected the prediction accuracy of SO2, NOx and PM components in sintering flue gas and needed to be eliminated.
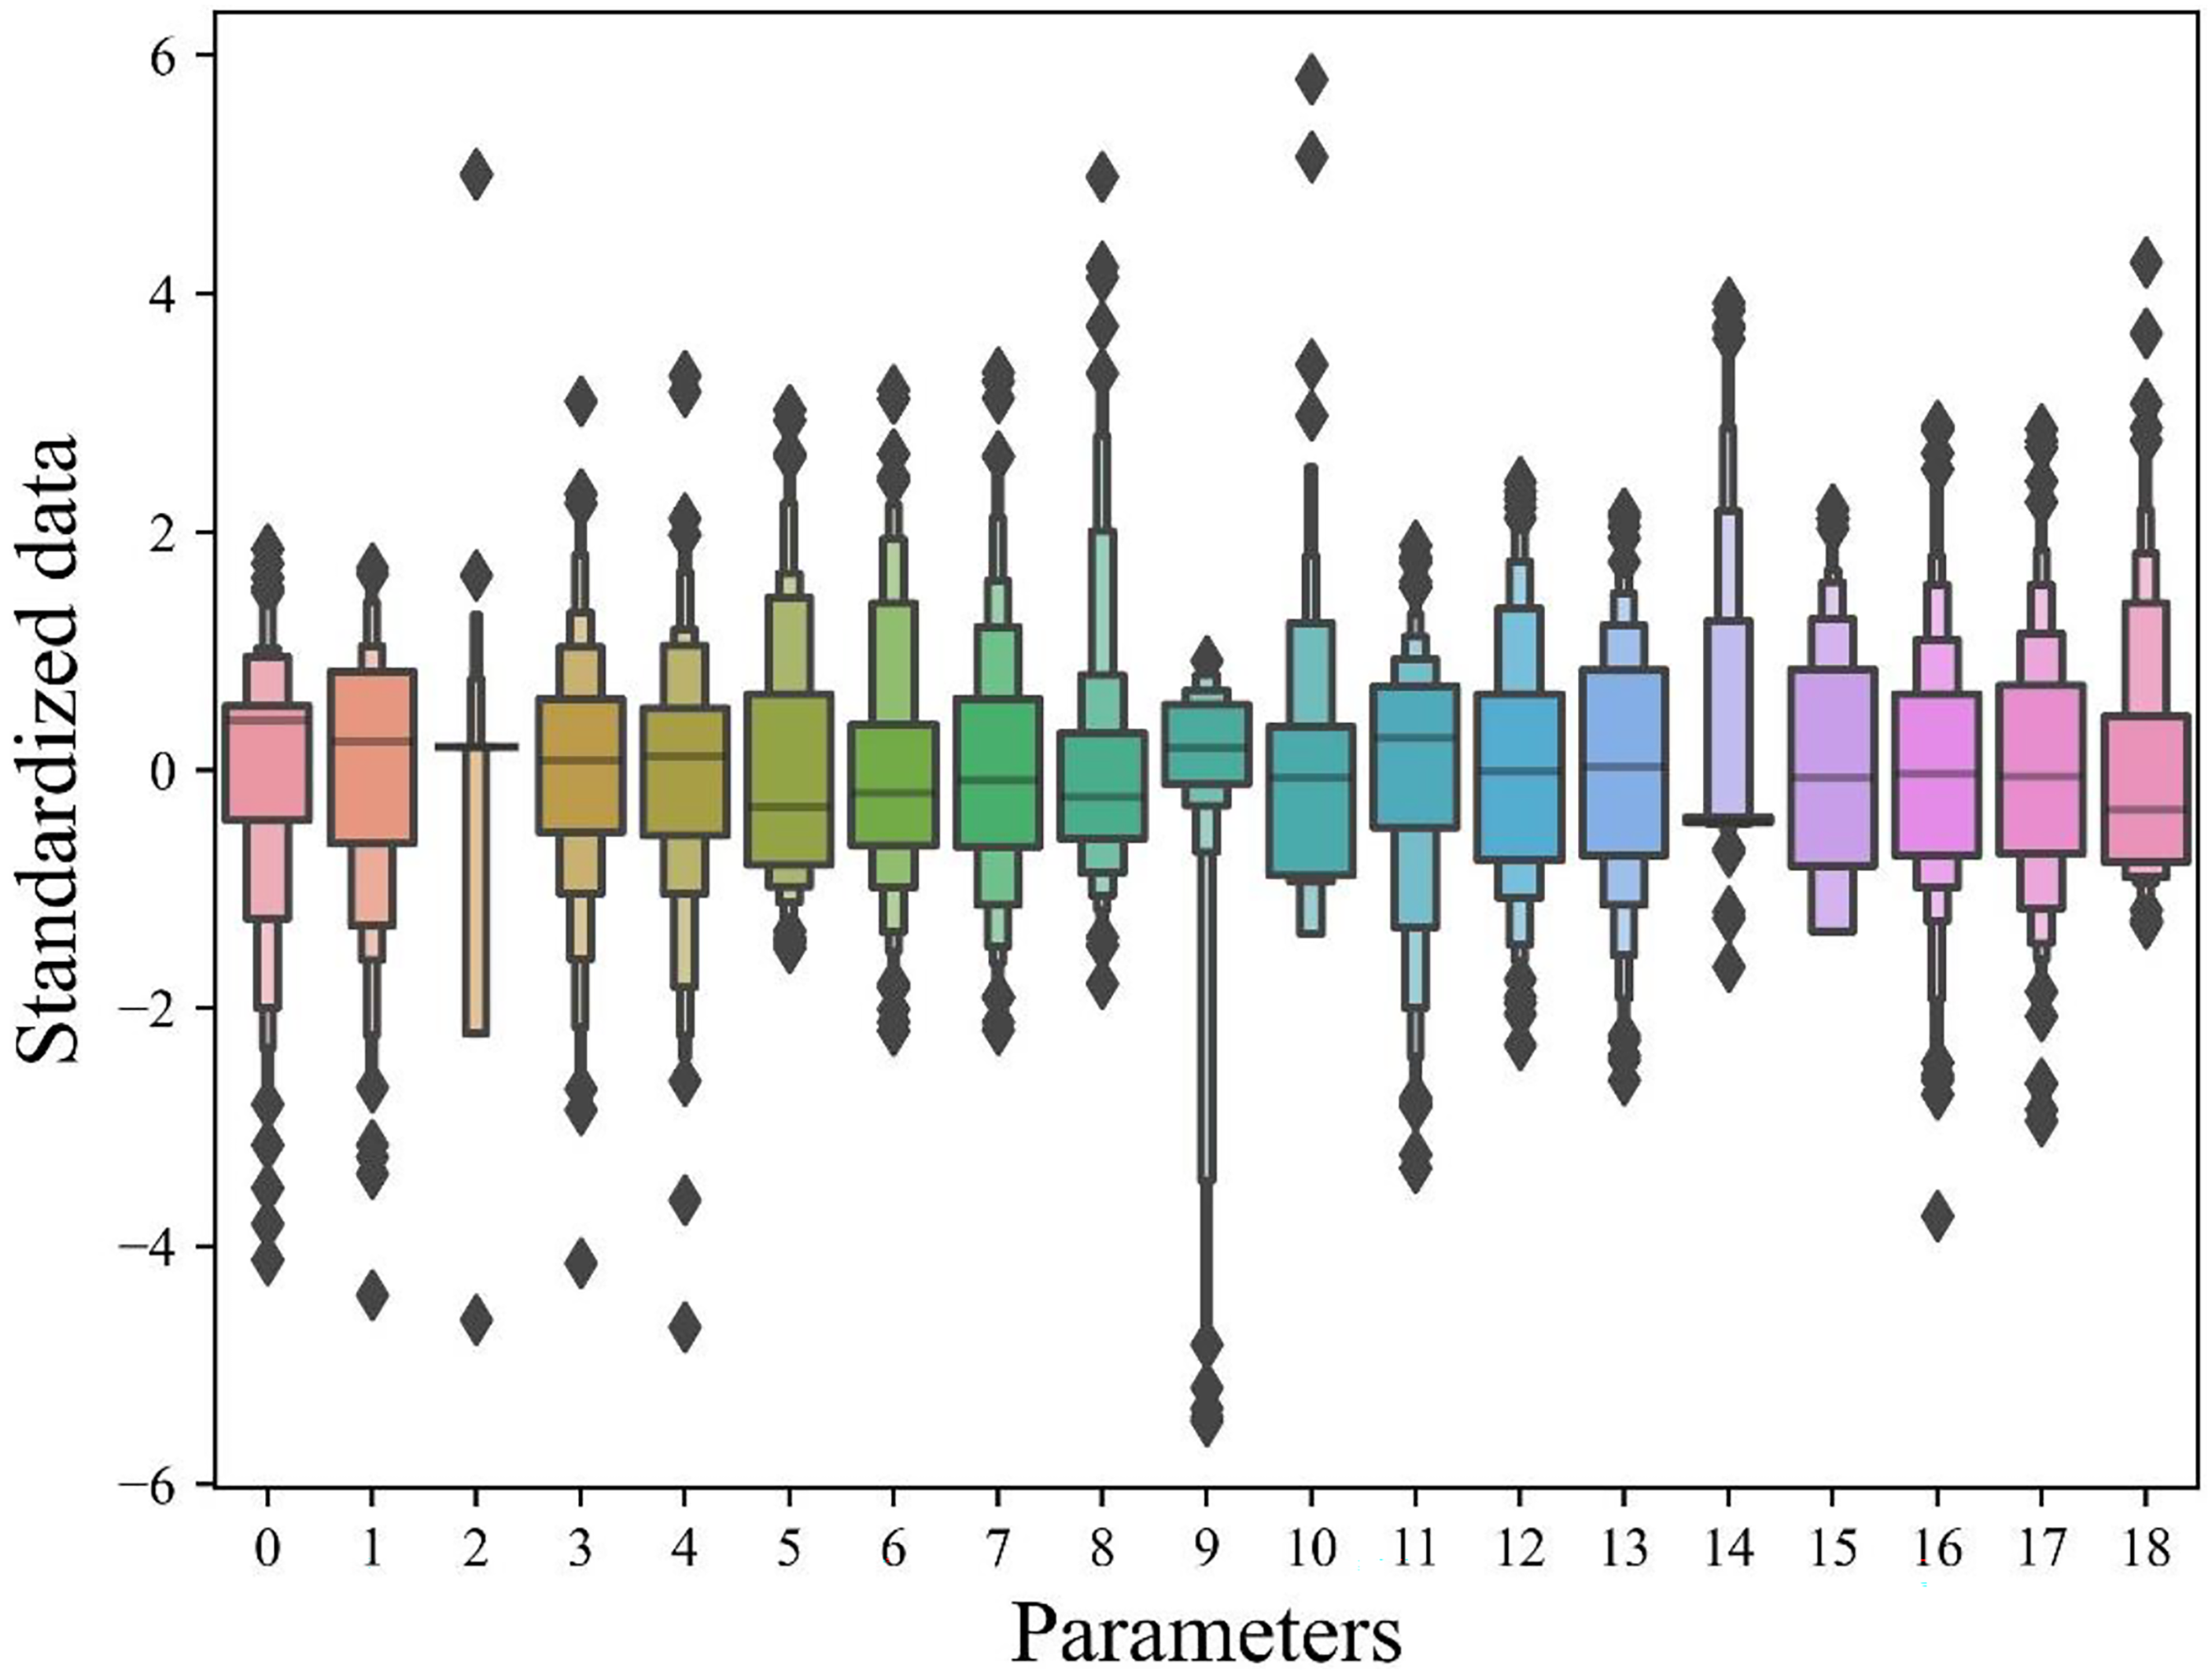
Box plot of index parameters in the iron ore sintering process.
The new dataset derived from the removal of outliers, reflected the influence of various operational disturbances and sensor instabilities on the sintering machine, resulting in considerable noise within the gathered process data. As illustrated in Figure 4, the SO2, NOx and PM data were characterized by large and unstable fluctuations in amplitude.
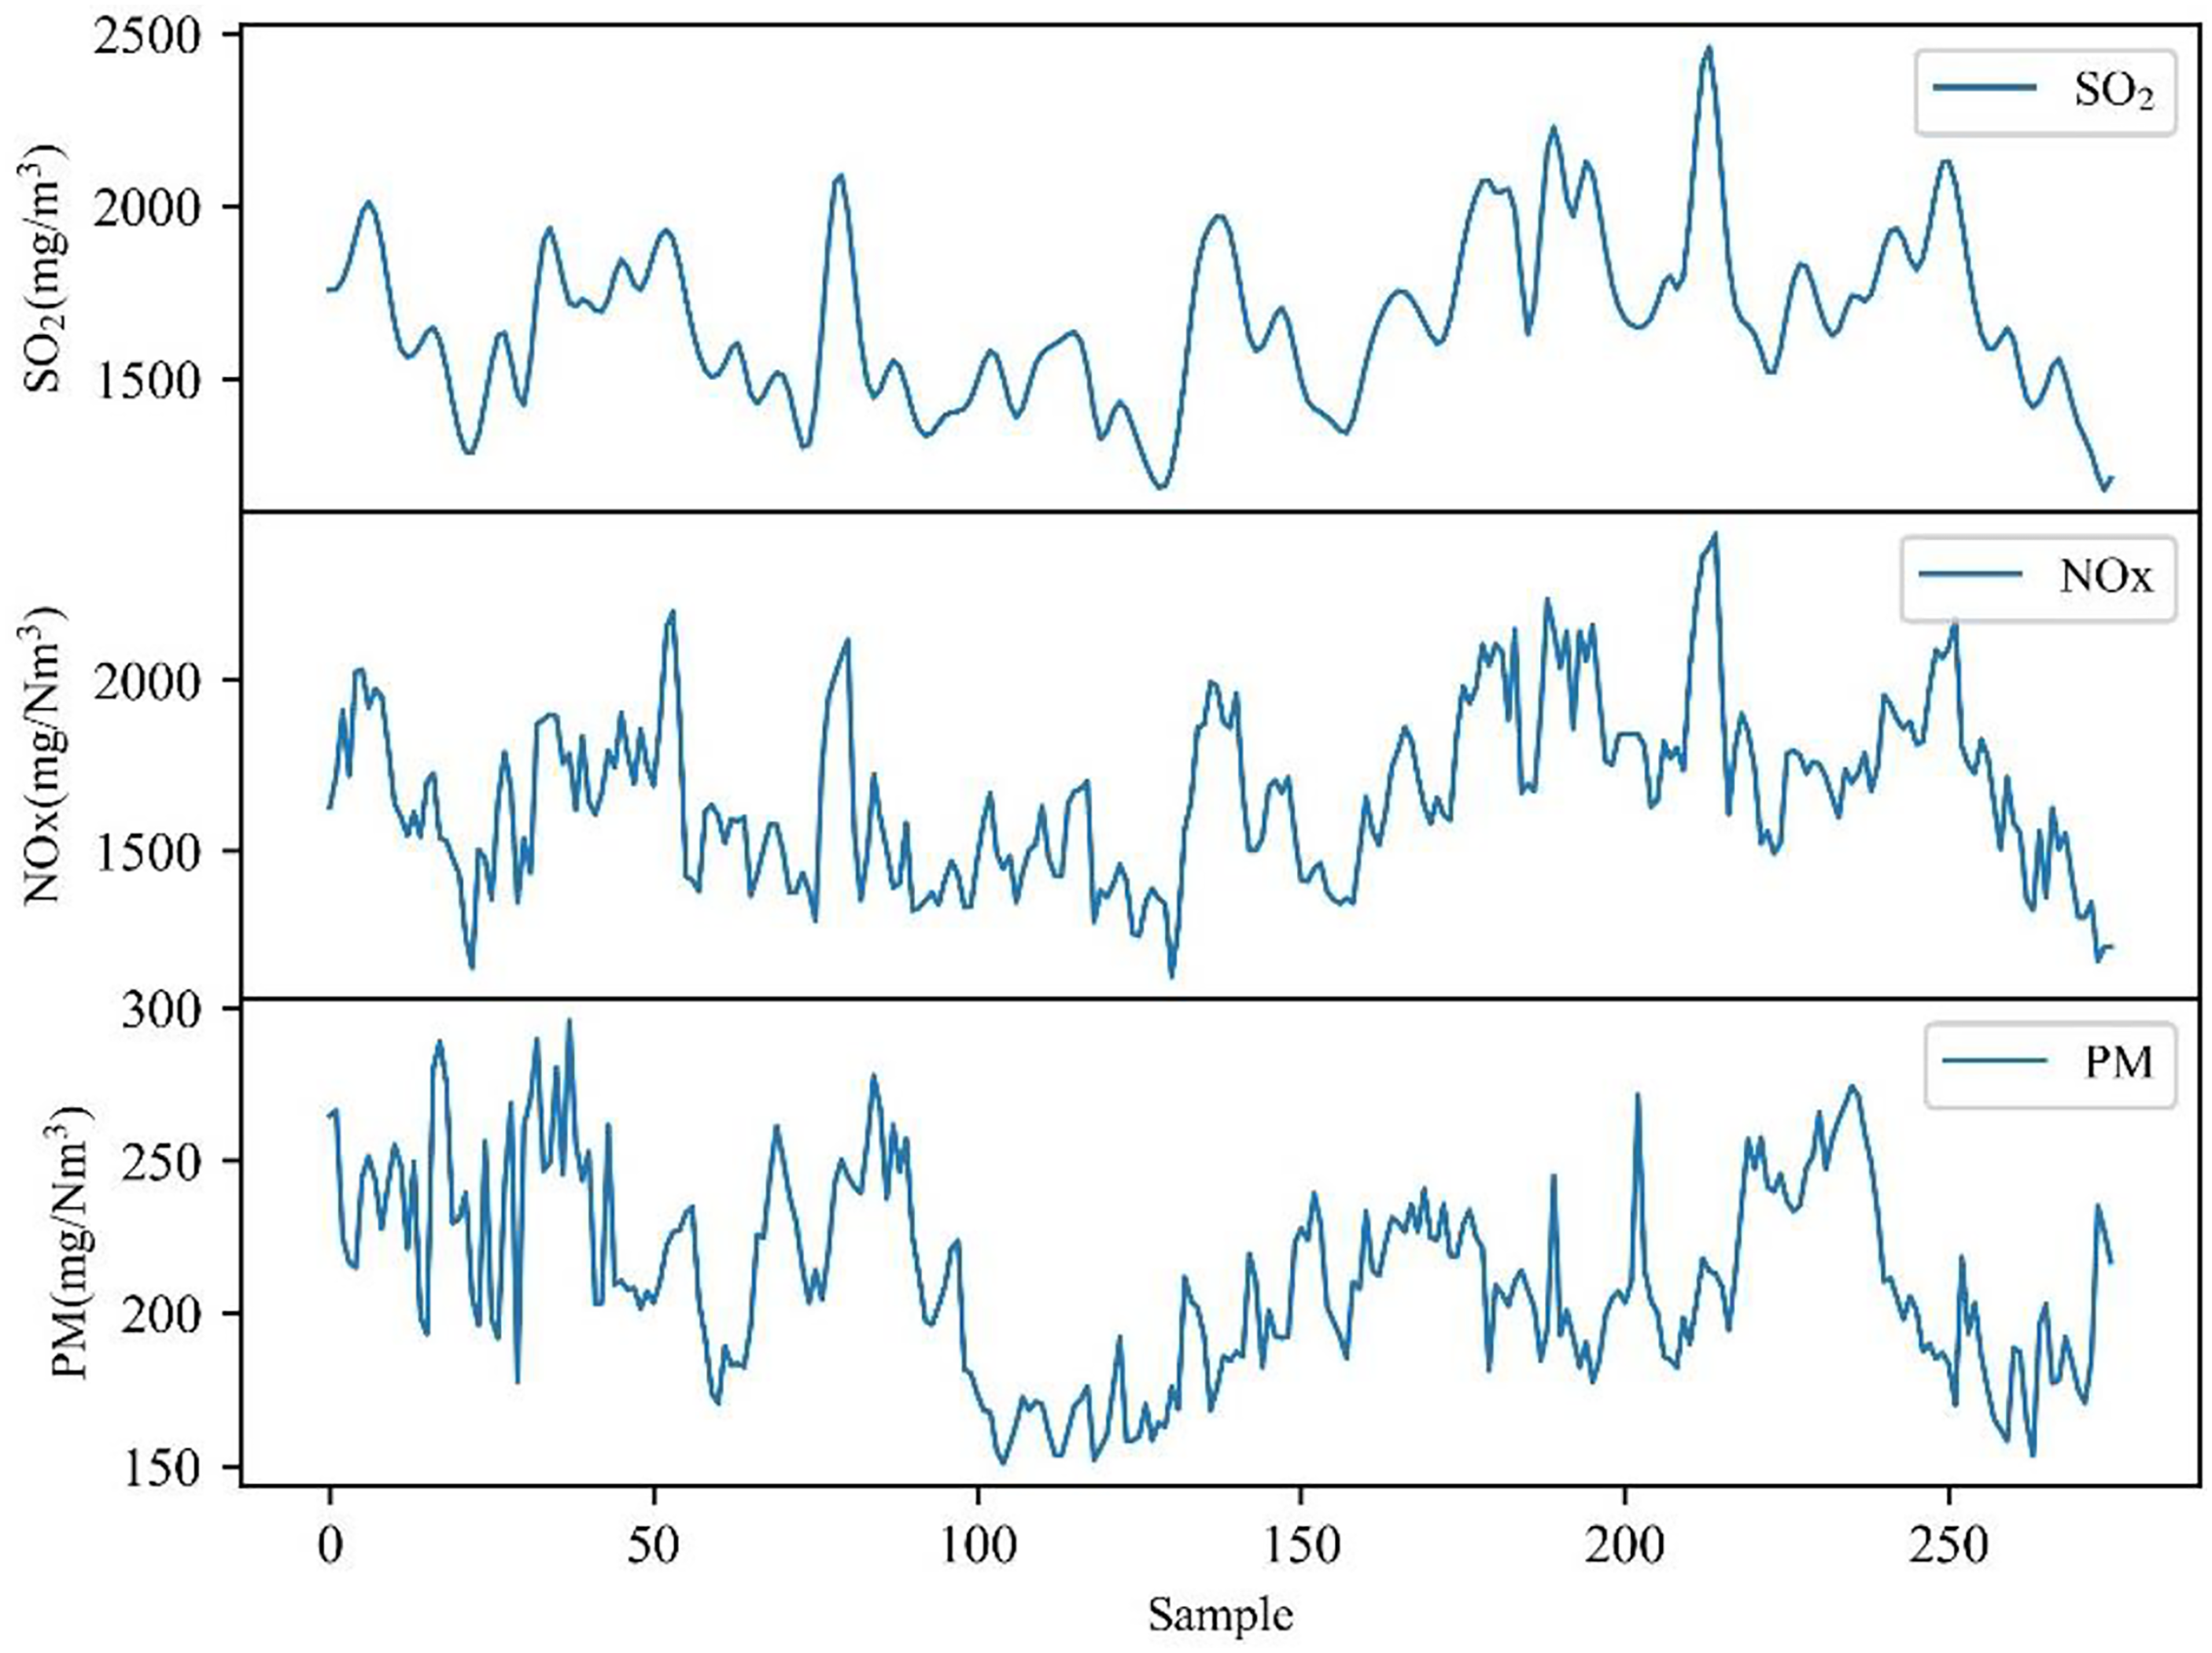
Original data chart for SO2, NOX, and PM.
The EMD algorithm was applied to denoise the SO2, NOx and PM data, decomposing them into IMFs 1–5 as shown in Figure 5. IMFs were components extracted from the original signal by EMD, and each IMF represented a vibrational mode at a different frequency or time scale of the signal. The arrangement of IMFs from the highest frequency to the lowest frequency made up the decomposition of the signal. The IMF1 exhibited significant noise fluctuations, which eliminating the IMF1 data and then reconstructing, a denoised dataset was obtained.
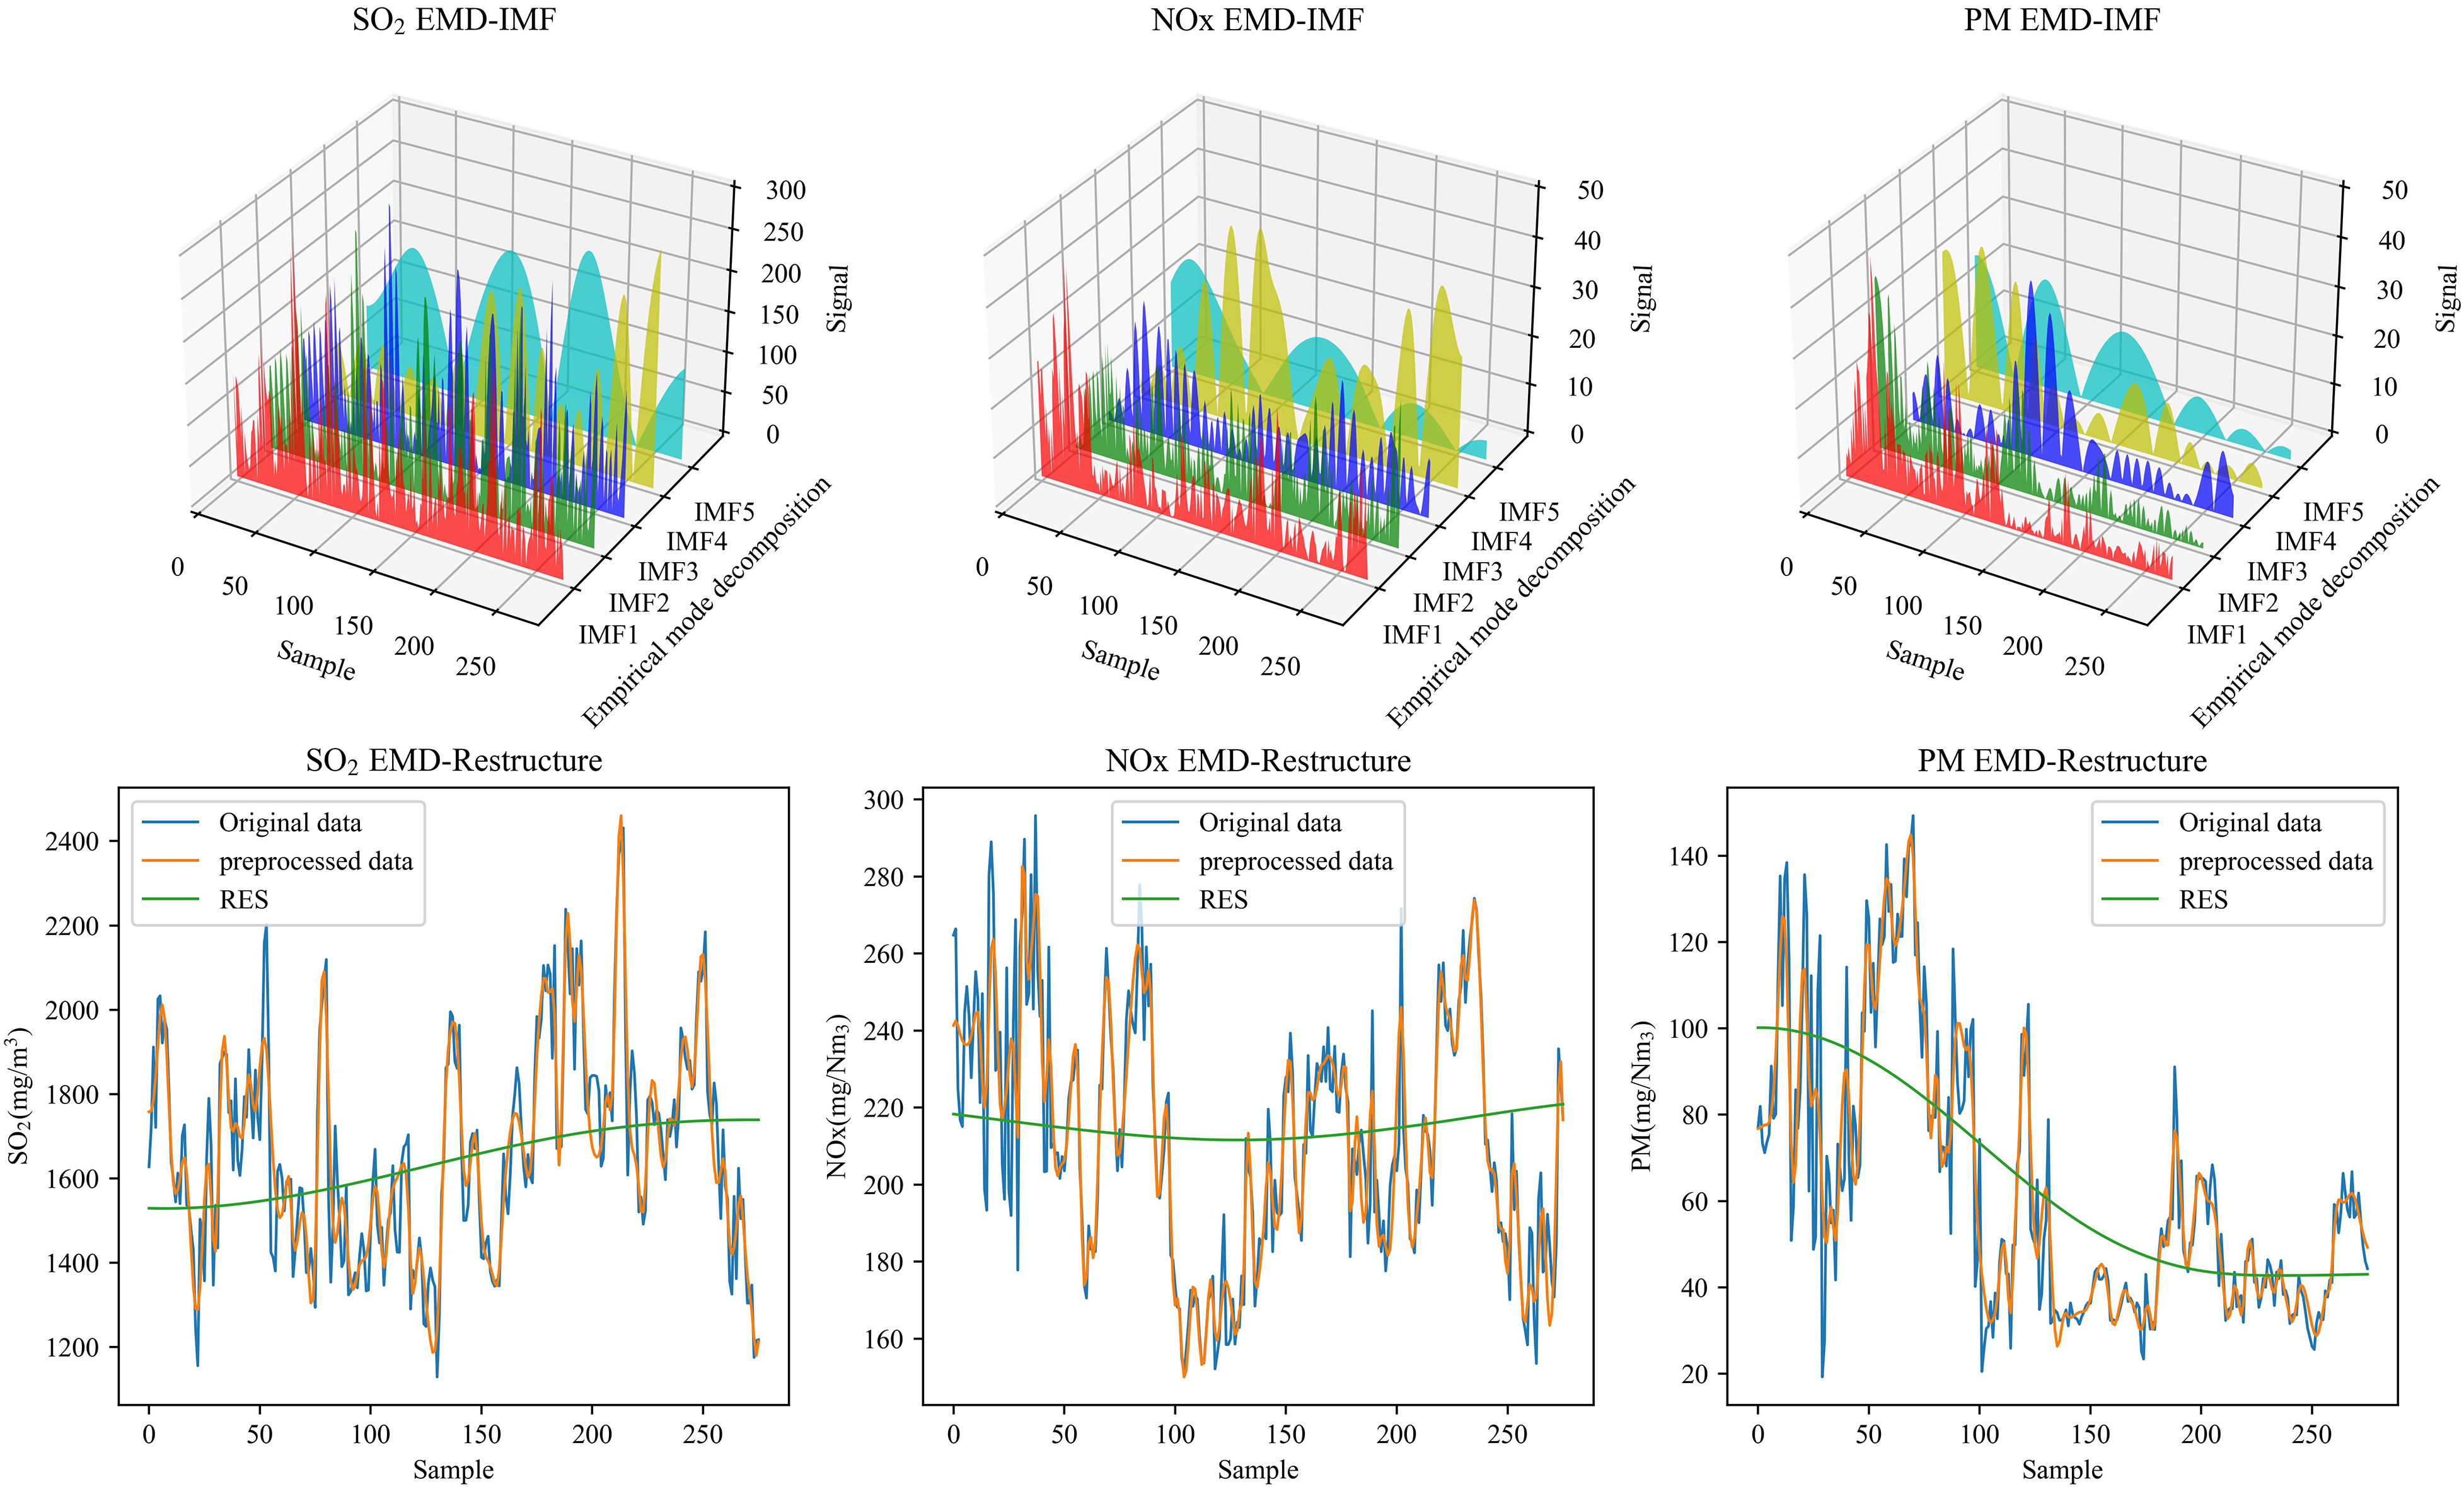
IMFs decomposition comparison.
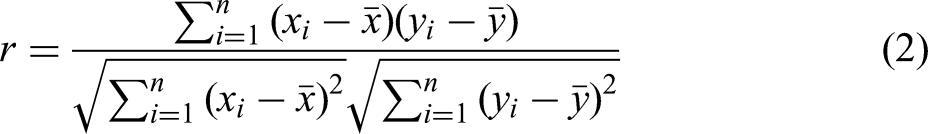
The Pearson correlation coefficient was used to calculate the correlation between each index, and a correlation heatmap was drawn as shown in Figure 6. Indicators with a strong correlation to SO2 include sinter machine speed, ignition temperature and activated carbon, whereas coal gas pressure, mixed ore and quicklime were the main influences on NOx. Sintering parameters related to PM included the speed of the ring cooler, mixed ore and the temperature of the mixture.
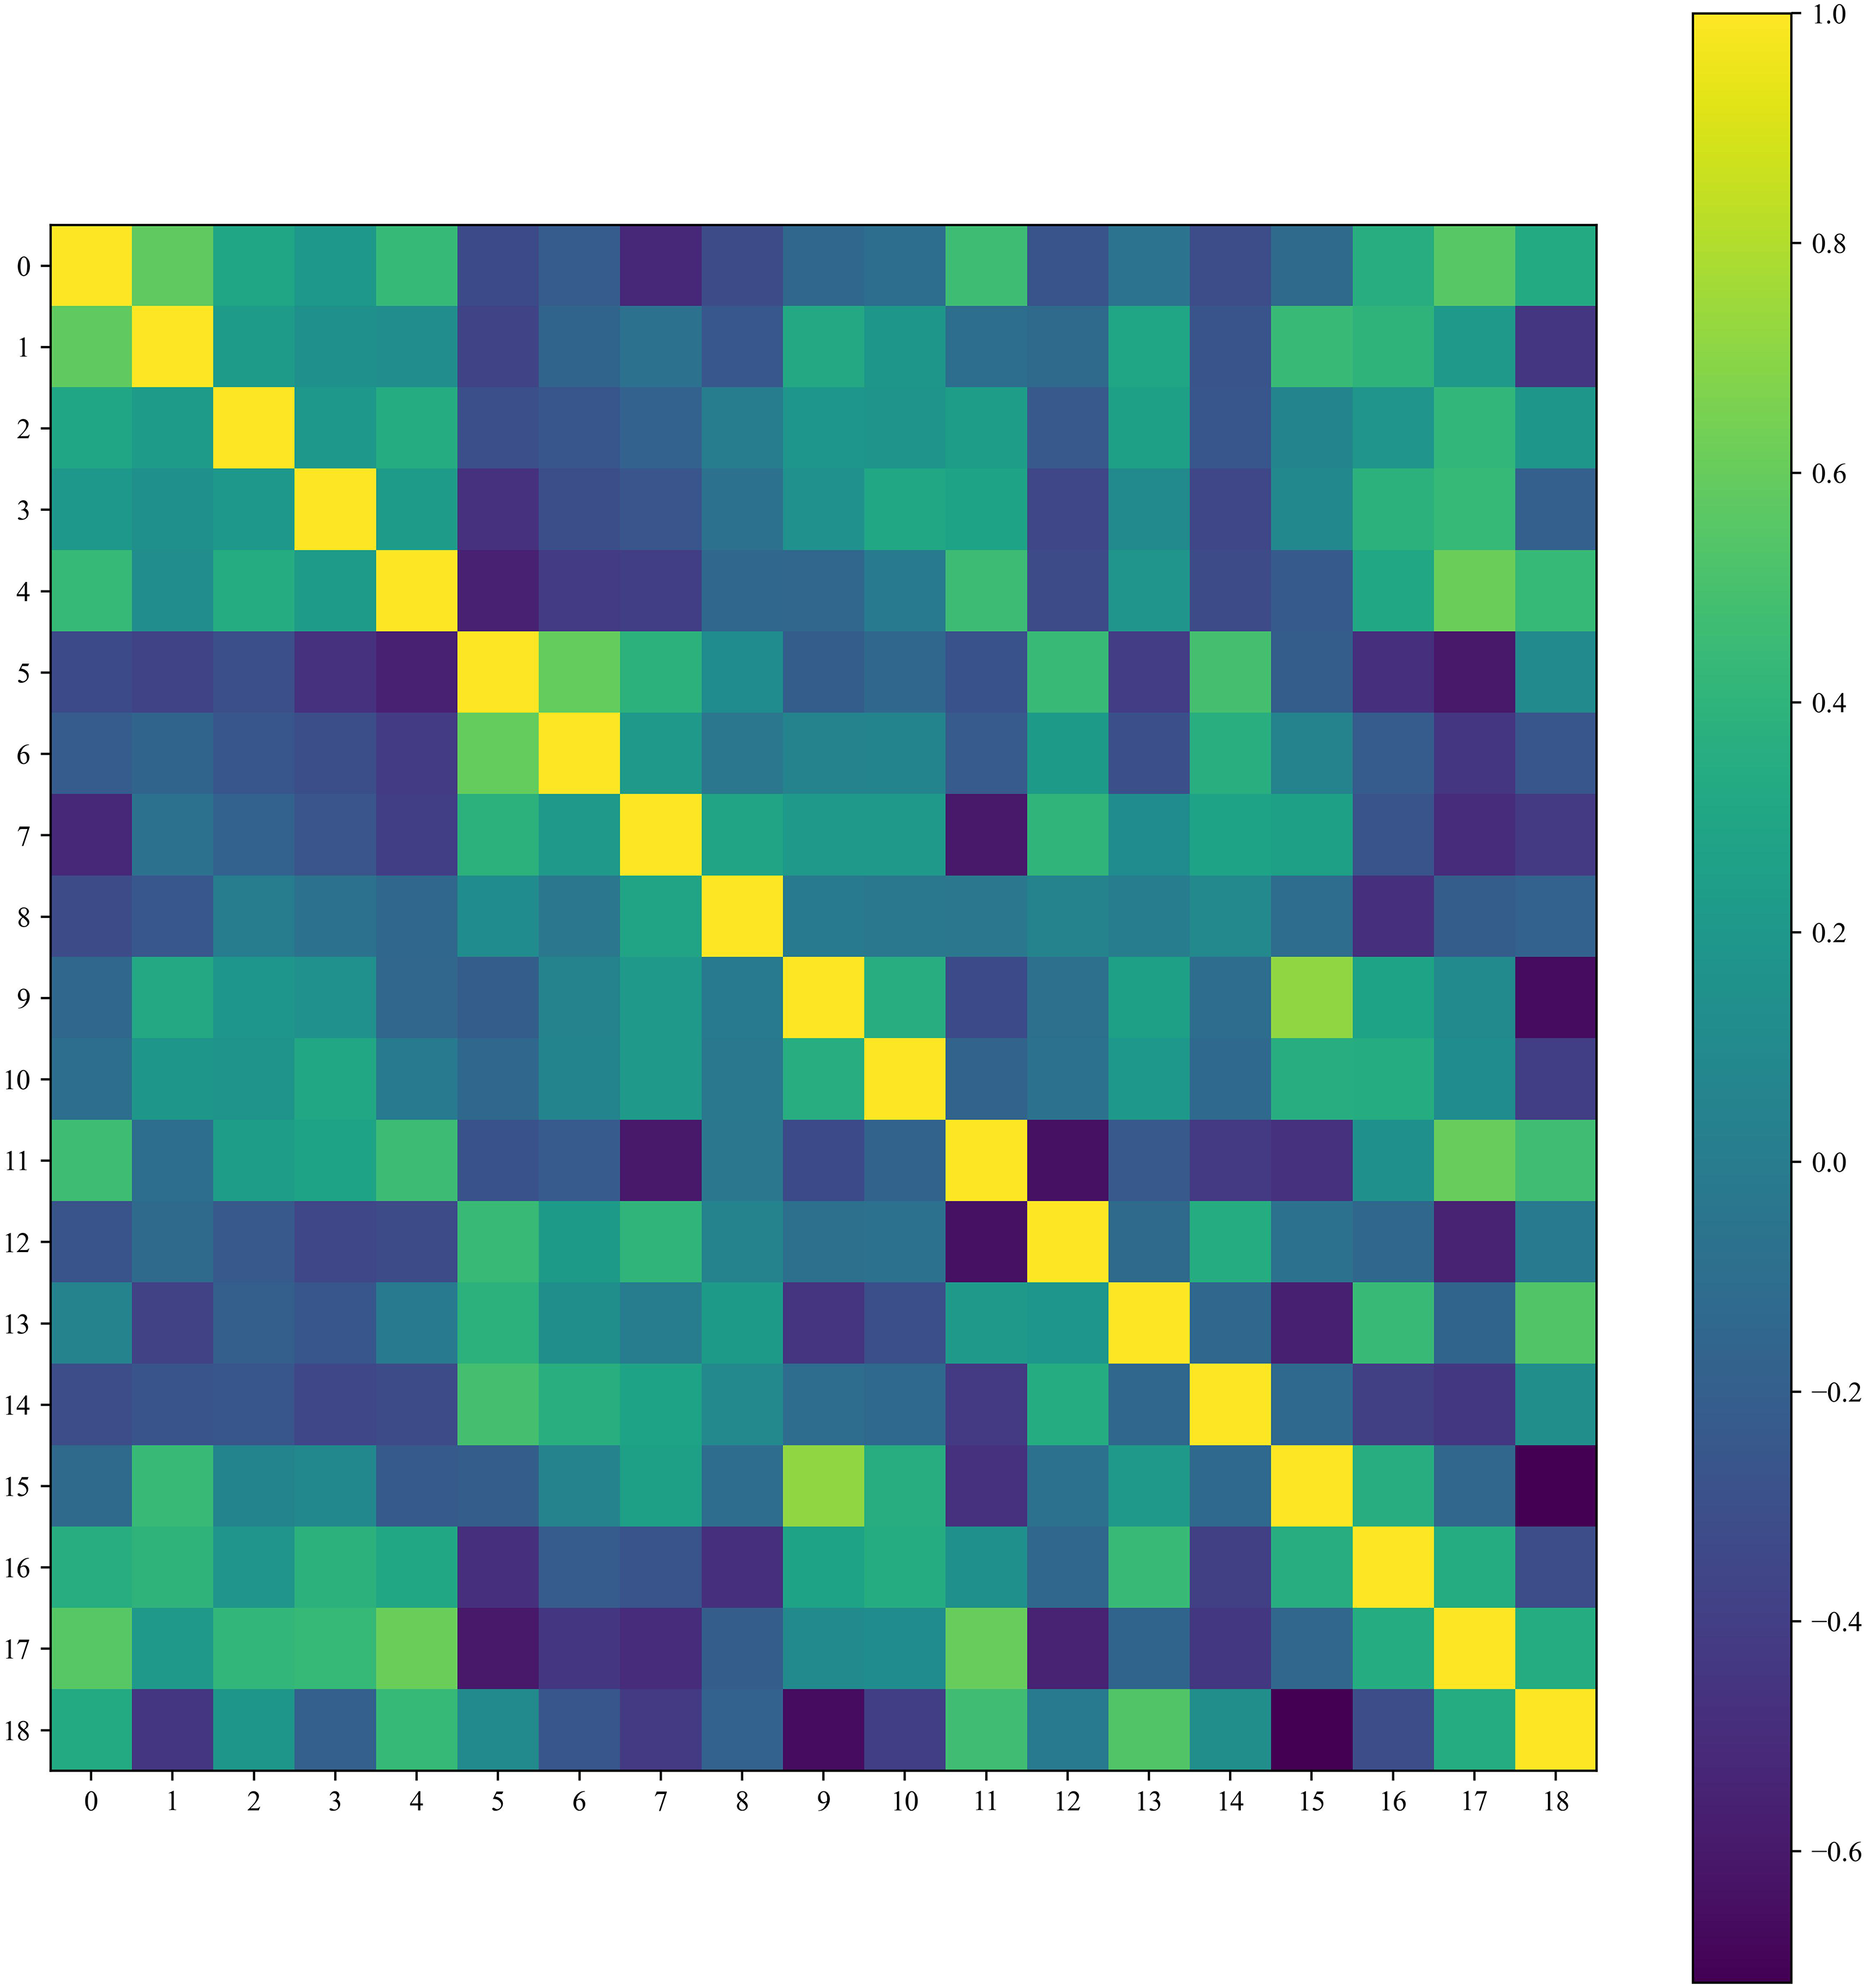
Correlation analysis diagram.
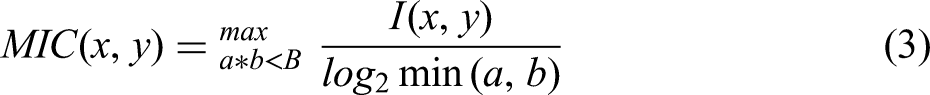
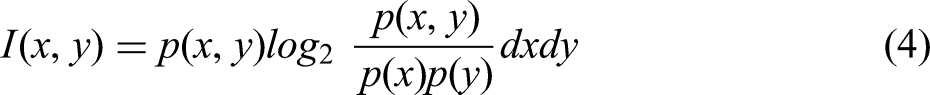
There were non-linear correlations among sintering parameters, and the MIC method could solve for non-linear correlations between variables. As shown in Figure 7, the indicators with strong non-linear correlations with SO2, NOx and PM were, respectively, the gas flow rate of the ignition furnace, coke powder and activated carbon.
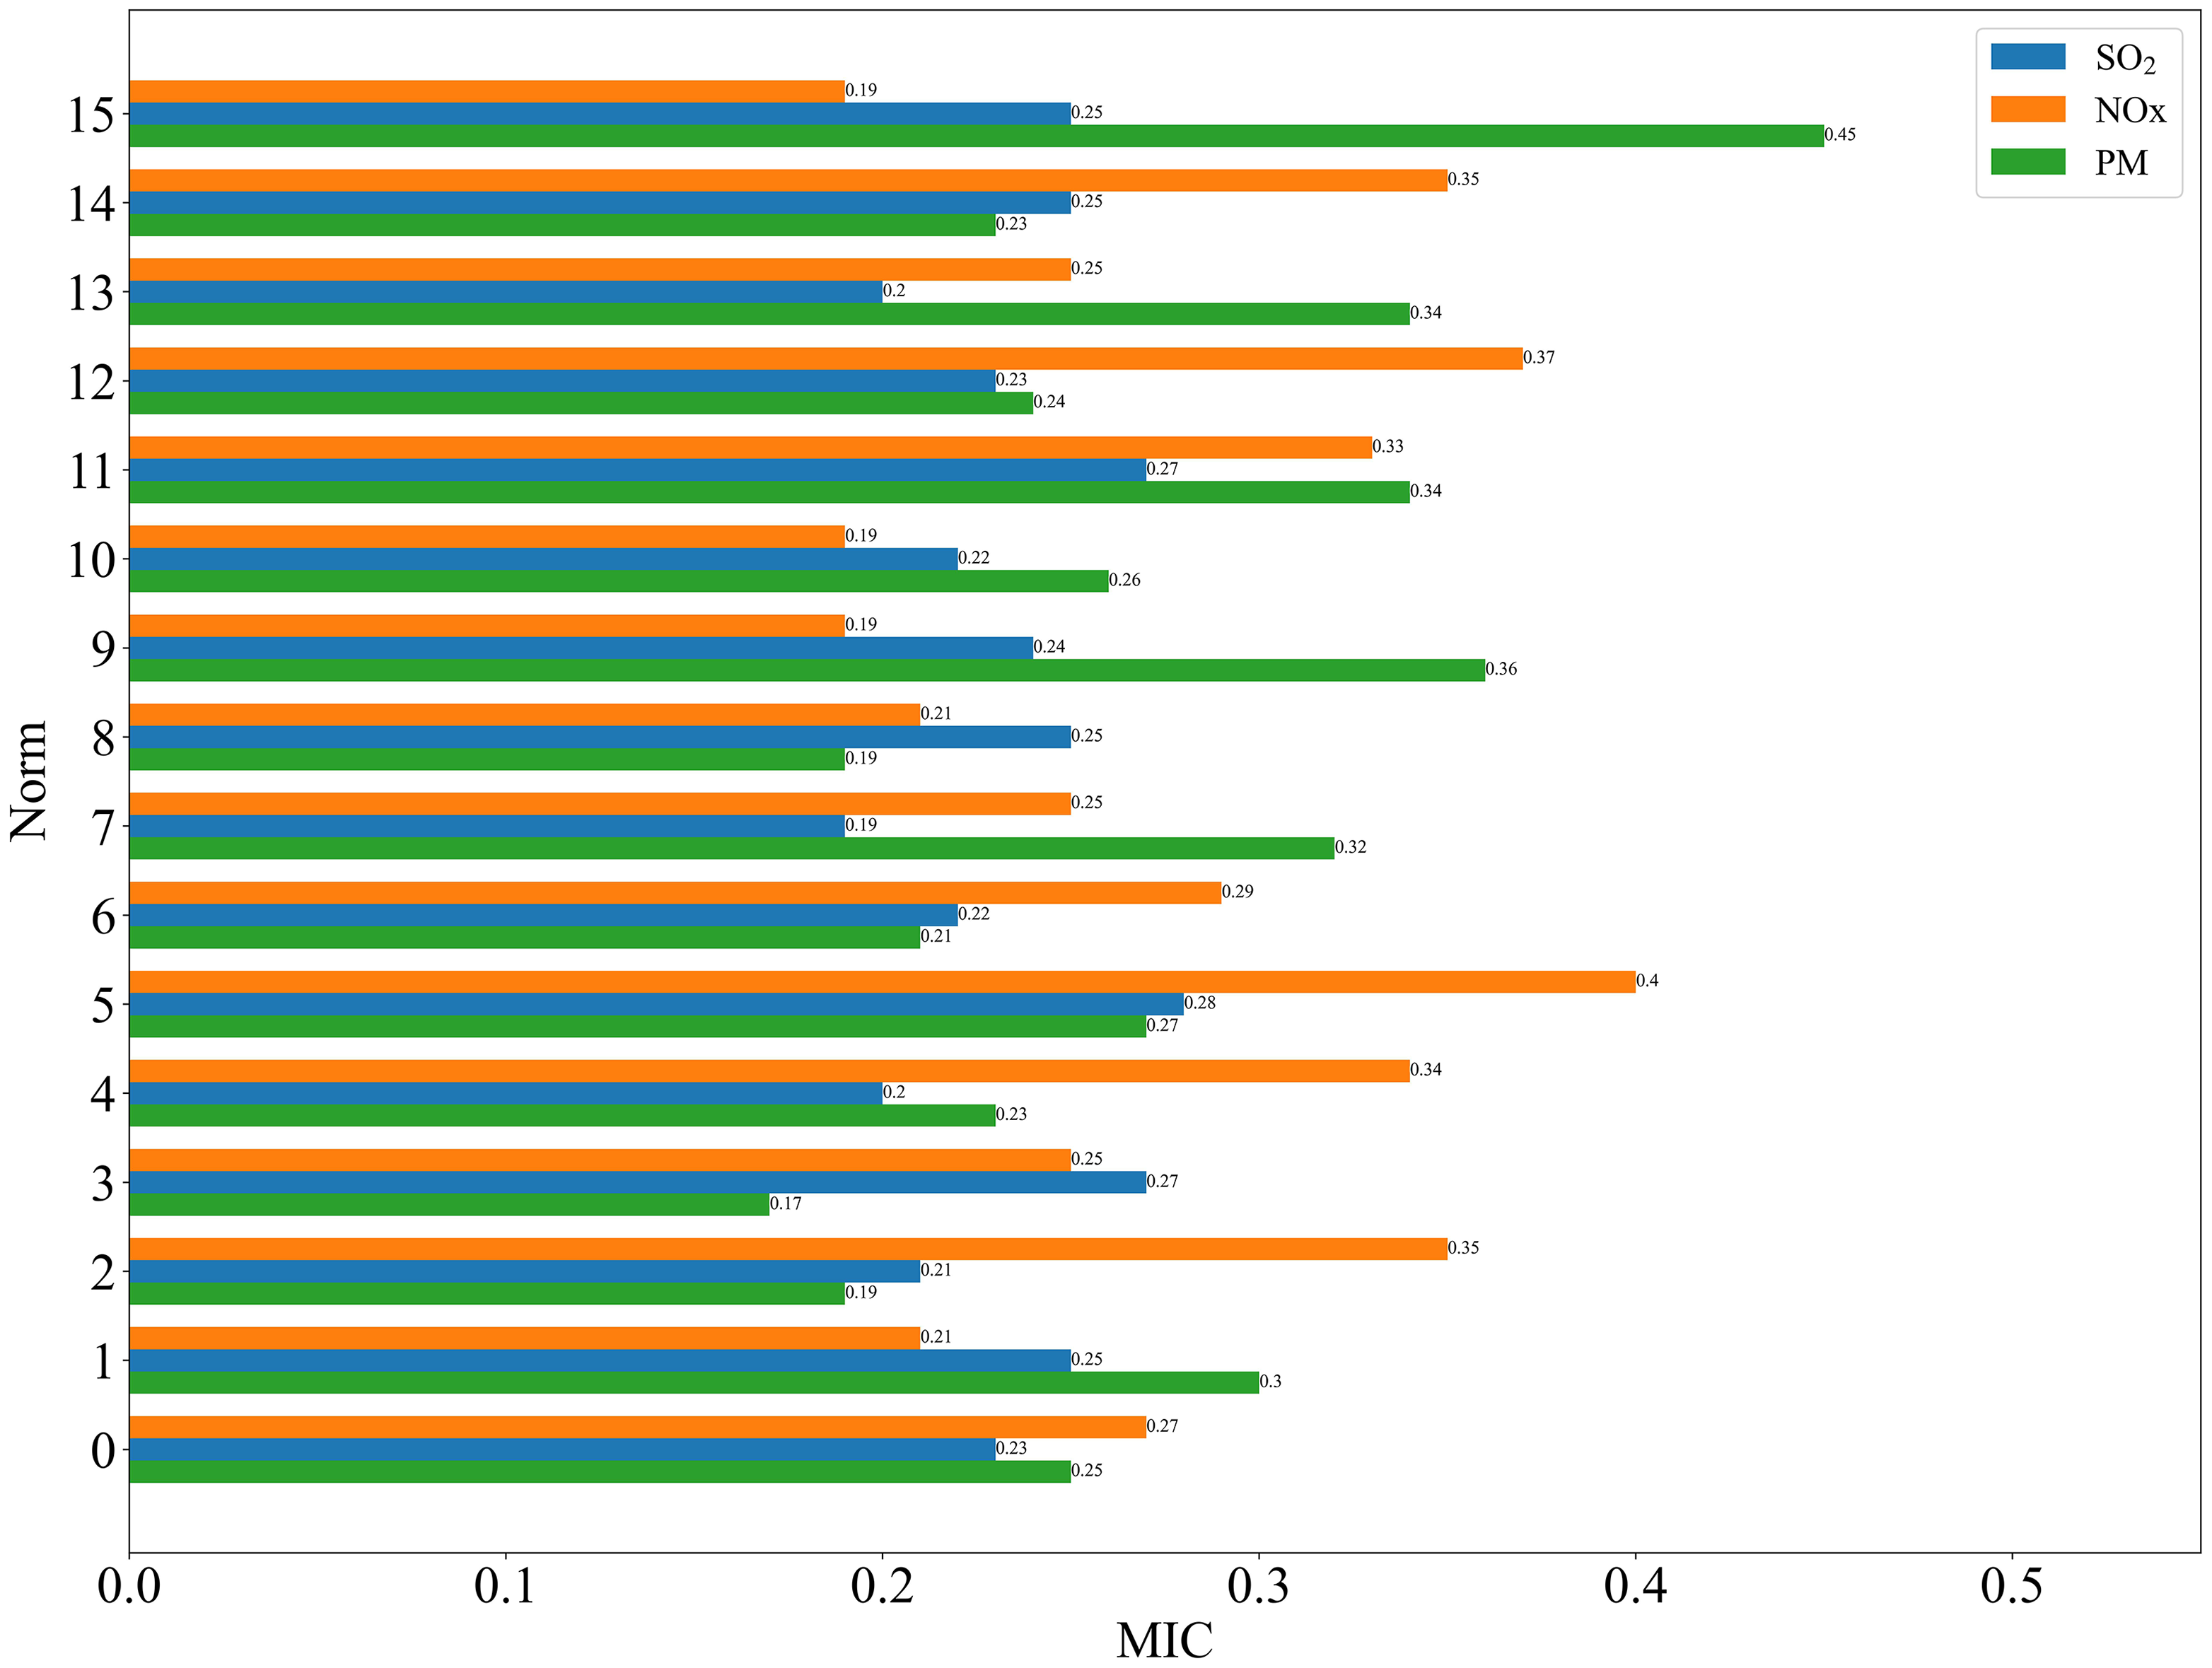
MIC importance analysis. MIC: maximum information coefficient.
Prediction of SO2, NOx and PM during the sintering process
Figure 8 illustrated the impact of different regression algorithms on the prediction of SO2. By comparing models, which was observed that GBDT had the smallest difference between predicted and true values for SO2, resulting in a better simulation effect. When comparing RMSE, MAE and R2 among different models, the GBDT model showed RMSE of 101.61, MAE of 82.77 and R2 of 0.82, while maintaining a hitting rate within the range of ±100.
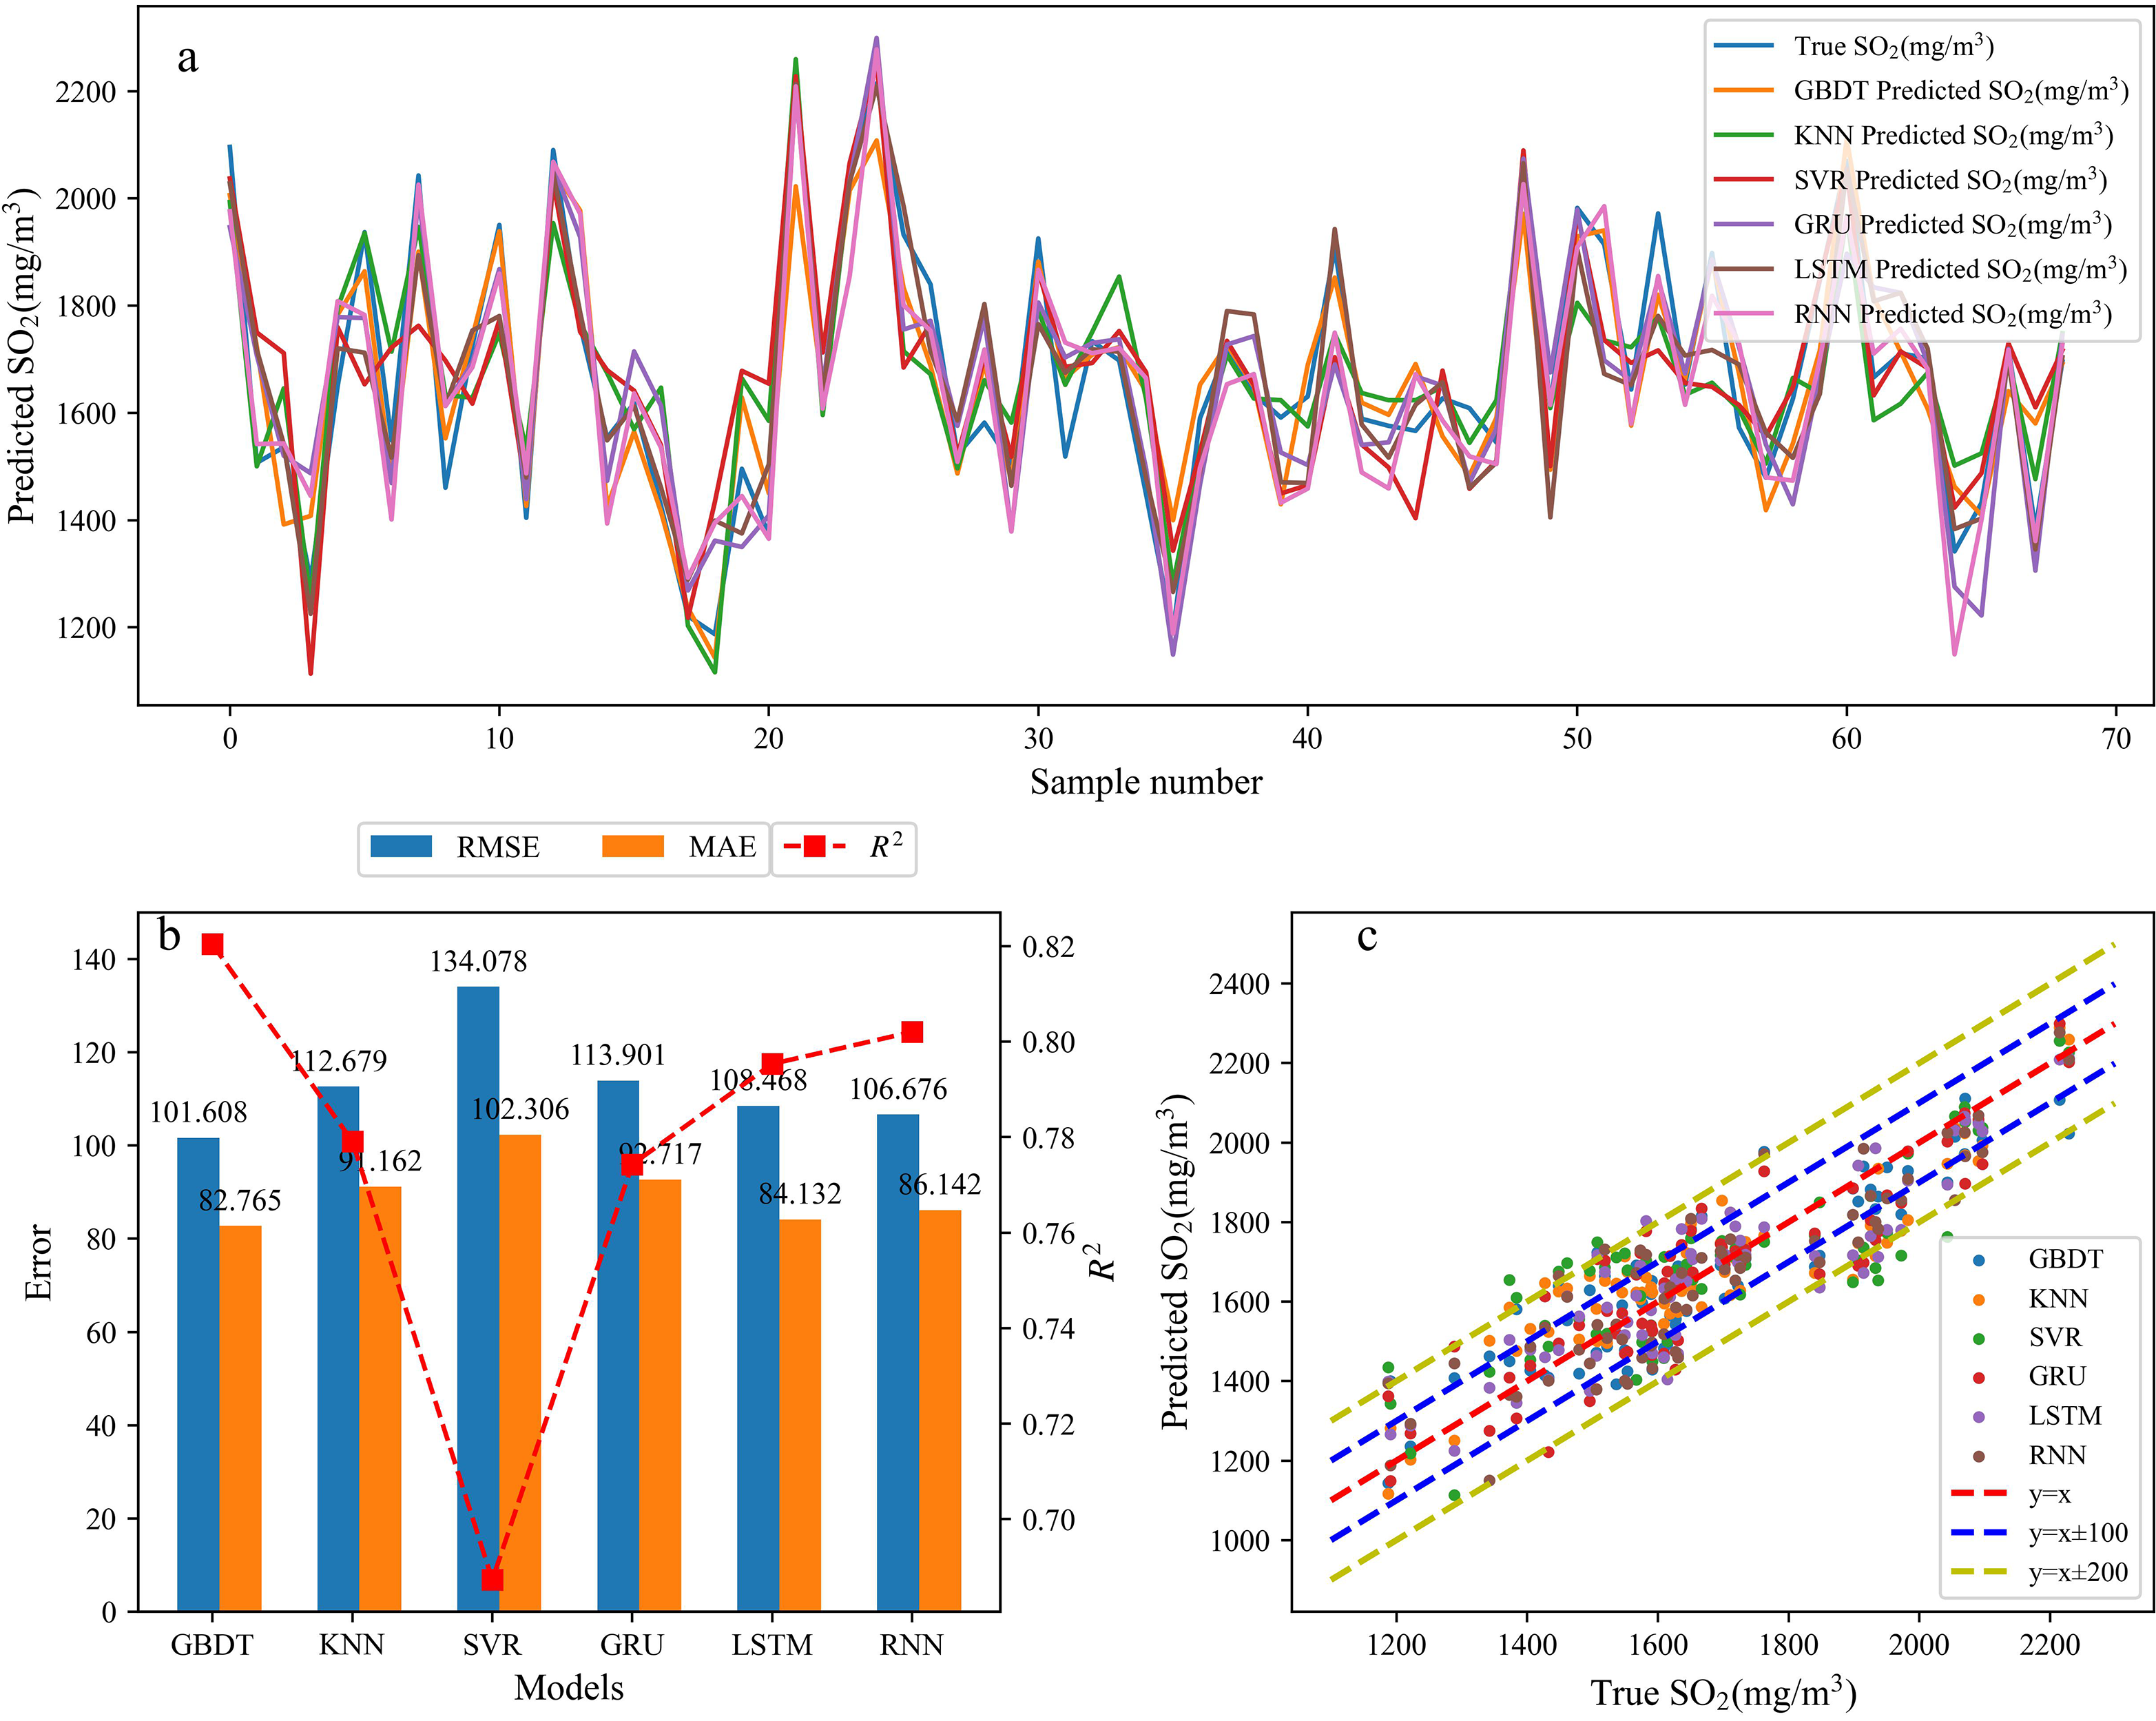
SO2 prediction simulation and error analysis (a simulation chart of SO2 prediction results, b error analysis chart for SO2 prediction results, c hit range chart for SO2 prediction results).
Figure 9 displayed the application of different regression algorithms in predicting NOx. The RNN model demonstrated a high similarity between predicted and true values of NOx. The calculated RMSE, MAE and R2 for different models resulted in values of 11.96, 9.16 and 0.85, respectively, for the RNN model. The hitting rate was controlled within the range of ±15.
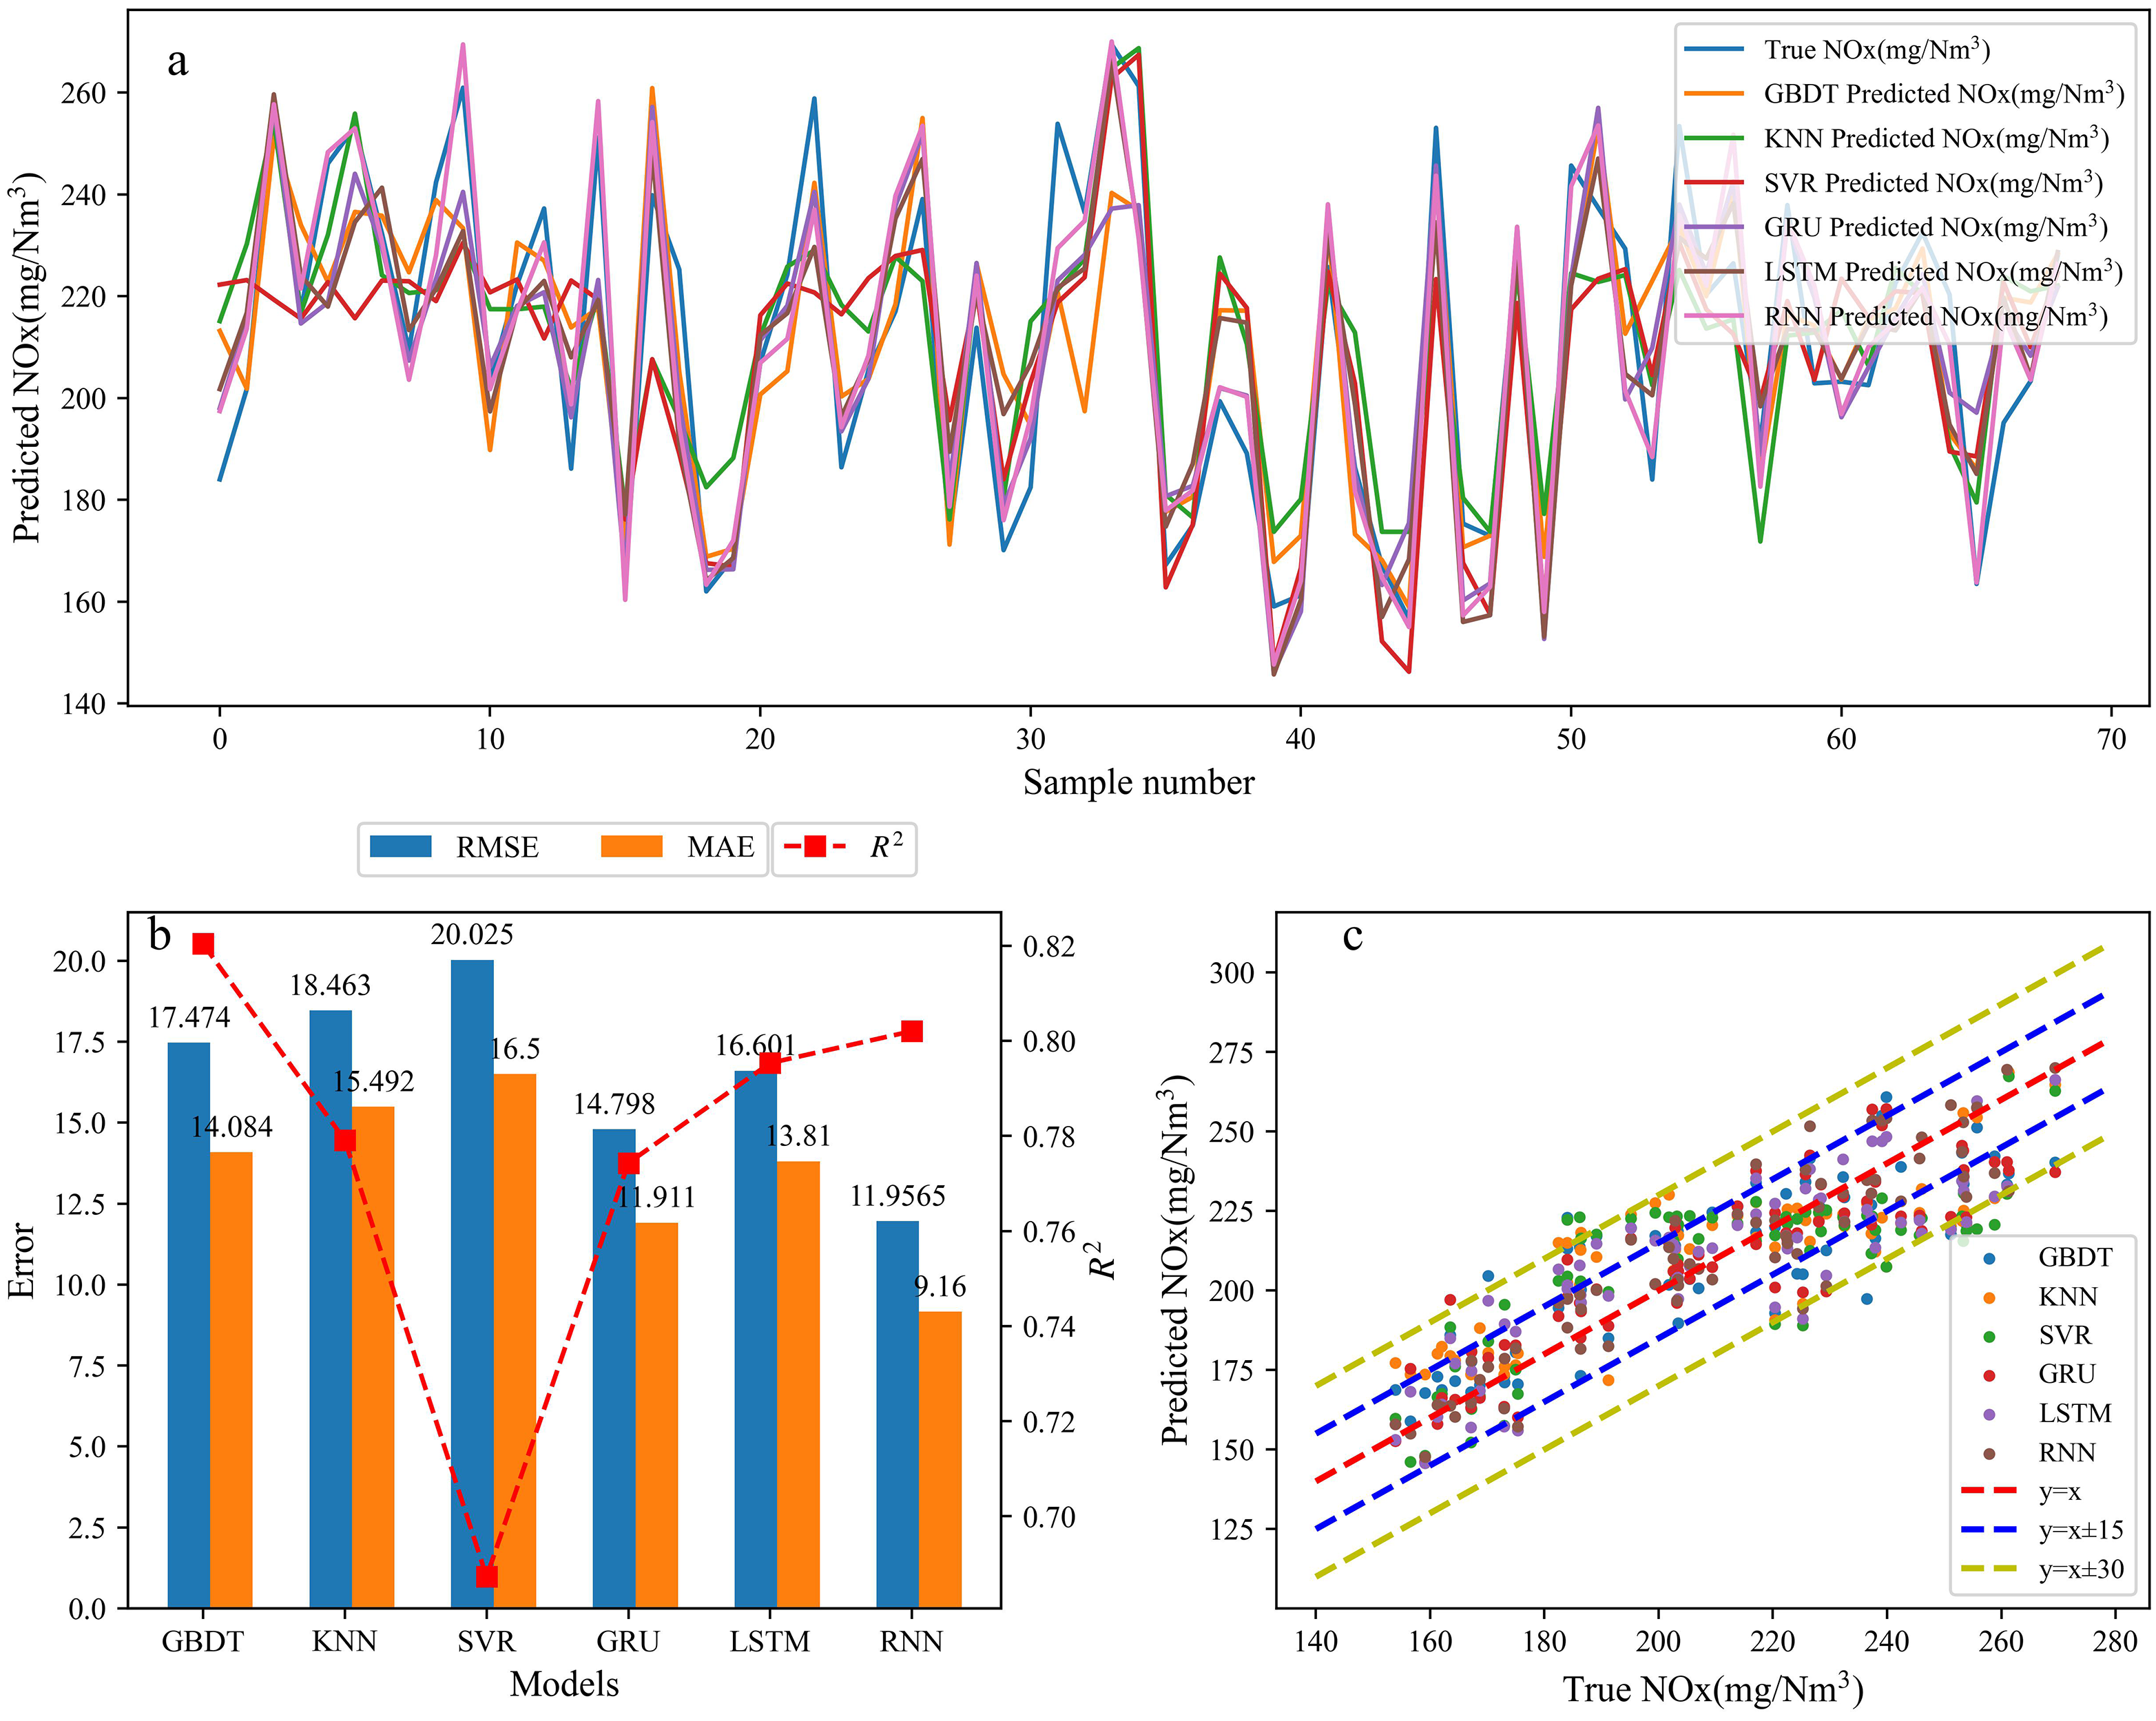
Nox prediction simulation and error analysis (a simulation chart of NOx prediction results, b error analysis chart for NOx prediction results, c hit range chart for NOx prediction results).
PM predictions were simulated using different algorithms for comparison, as illustrated in Figure 10, where the GRU algorithm yields better simulation results for PM forecasting. The GRU model achieving the highest accuracy, with RMSE, MAE and R2 values of 10.36, 7.84 and 0.87, respectively, which maintaining a hit rate controlled within ±10.

Pm prediction simulation and error analysis (a simulation chart of PM prediction results, b error analysis chart for PM prediction results, c hit range chart for PM prediction results).
Conclusions
The box plots, EMD algorithm, Pearson correlation coefficient and MIC methods to select input parameters for the predictive model, and the main indexes affected SO2, NOx and PM in sintering flue gas include gas flow rate, mixed ore, quicklime and gas pressure.
Model comparisons have determined that the algorithms with high accuracy and stability for the predictions of SO2, NOx and PM were GBDT, RNN and GRU respectively, with R2 values of 0.82, 0.86 and 0.87.
The precision of the multi-model ensemble prediction model was greater than 0.82, the denoising treatment of the dataset made the model reliable and could provide guidance for the pollutant treatment process in the sintering site.
Footnotes
Acknowledgements
The present work was financially supported by the Natural Science Basic foundation of China (Program No. 52174325), the Key Research and Development Program of Shaanxi (Grant No. 2020GY-166 and Program No. 2020GY-247) and the Shaanxi Provincial Innovation Capacity Support Plan (Grant No. 2023-CX-TD-53). The authors gratefully acknowledge their support.
Declaration of conflicting interests
The authors declared no potential conflicts of interest with respect to the research, authorship, and/or publication of this article.
Funding
The authors received no financial support for the research, authorship, and/or publication of this article.