
Abstract
Low-carbon-containing Nb microalloyed building structure steel was tested by Gleeble-3500 thermal simulation machine. Based on the thermal simulation data and microstructure analysis of optical microscope (OM), scanning electron microscope (SEM), electron backscatter diffraction (EBSD) and transmission electron microscope (TEM), the effect of different deformation temperatures (900 °C and 850 °C) and deformation amounts (30%, 40% and 50%) on the transformation and the final microstructure was clarified. When the strain amount is constant, with the decrease of deformation temperature from 900 °C to 850 °C, the initial temperature of ferrite transformation increases from 751 °C to 758 °C due to the increase in the amount of dislocation and deformation bands in original austenite grains. Meanwhile, the carbon content in the residual undercooled austenite after ferrite transformation increases, inhibiting the nucleation of medium-temperature bainite and decreasing the bainite transformation temperature from 558 °C to 544 °C. In addition, when the deformation temperature is constant, the grain boundary content of large angle (>15°) increases from 55.7% to 61.3%, and the starting temperature of ferrite transformation gradually increases from 740 °C to 758 °C with the increase of deformation amount from 30% to 50%. It is related to the amount of the second-phase precipitates. It indicates that the increase in deformation amount could promote the ferrite transformation and result in a smaller ferrite grain size.
Introduction
With the continuous improvement of domestic industrial and civil buildings, superior strength-toughness matching is important for the development of steel for buildings. 1 The proper addition of microalloying elements in low carbon microalloyed steel can significantly improve the mechanical properties of steel, such as Nb, V and Ti.2–6 The addition of microalloying element in steel plays not only the role of grain refinement but also the role of precipitation strengthening,7,8 leading to good strength-toughness properties in building structure steels. Therefore, low-carbon microalloyed steel has become an ideal material for modern buildings.9,10
In the process of continuous cooling transformation of microalloyed steel, different microstructures, for example, ferrite, pearlite, bainite and martensite will be obtained due to the influence of the rolling deformation process, chemical composition and cooling rate. 11 Choosing appropriate process parameters plays an important role in improving the forming quality of the metal materials. 12 In addition, these different microstructures and second phases such as retained austenite and precipitates will affect the mechanical properties of microalloyed steel. 13 As is reported in Ref., 14 the stacking fault, strong-coupled shearing and Orowan bypassing decreased with increasing the size of the precipitates. And the intragranular strength also weakened as the precipitates coarsened. In addition, Wang et al. 15 found that the hot rolling process greatly improved mechanical properties and corrosion resistance by controlling the volume fraction of different phases and microstructure morphology. Unfortunately, the deformation process could give rise to springback, which refers to the tendency of the material to partially return to its original shape once the loading force is removed. 16 Therefore, it is an important part of the production process to obtain the microalloyed steel with the required mechanical properties by adjusting the deformation process. 17 In addition, the combination of microalloying process and TMCP (Thermo-Mechanical Control Process) technology has become one of the main methods to achieve superior mechanical properties in real industrial production. 18 TMCP process is a technology to optimise the microstructure and properties of steel by controlling the rolling and cooling process. 19 It can effectively refine the grains and improve microstructure, 20 thereby offsetting the decrease in toughness caused by the carbonitride's precipitation due to the addition of microalloying element and thus allowing the microalloyed steel to meet the requirements of high strength and toughness with the good welding performance. 21 Pourazizi et al. 22 studied the microstructure change of low carbon pipeline steel by designing different TMCP processes. It was found that with the increase in cooling rate, the content of ferrite and pearlite decreased and the content of bainite increased gradually. Additionally, a large number of blocky ferrite was transformed into intragranular ferrite. With the increase of the cooling rate, the supercooling degree increases, and the required energy for ferrite nucleation decreases gradually, 23 which leads to the obvious increase of ferrite nucleation density. It also curbs the movement of grain boundaries and the growth of ferrite grains, thus refining the ferrite grains. 24 Li et al. 25 investigated the effect of the TMCP process on the microstructure and properties of a low carbon microalloyed steel (Q550D). The results showed that when the cooling temperature decreases, the ferrite in the final microstructure increases. Similarly, Ruan et al. 26 found that the finishing rolling temperature in TMCP affected the final microstructure and mechanical properties of 30CrMnTi steel. With the decrease of the finishing rolling temperature, the bainite amount decreases obviously, the content of ferrite and pearlite increases, the tensile strength decreases, and the elongation and the reduction of area increase. 27 On the other hand, the strain amount is also a key parameter to control the microstructure and properties of low carbon microalloyed steel. Xu et al. 28 reported that with the increase of deformation amount, the average grain size decreased and the precipitation of particles near the dislocation was promoted, resulting in the simultaneous improvement of strength and toughness. It is confirmed that under the premise of ensuring the hardening state and transformation kinetics, the strain amount should be controlled to minimise the temperature gradient and microstructure inhomogeneity, so as to improve the overall performance and uniformity of the steel. 29
In summary, the deformation amount and the deformation temperature have an important effect on the transformation and microstructure of the low carbon microalloyed steel, and the microstructure determines the final mechanical properties of the steel.30,31 Therefore, it is necessary to reasonably design the deformation process according to the chemical composition and performance requirements of the steel to achieve the best matching between microstructure and performance. Moreover, in previous studies, the cooling process is relatively simple, either continuous cooling at a constant cooling rate or isothermal cooling, and the segmentation cooling process after deformation is rarely investigated. Therefore, to understand the change in the microstructure and properties of low-carbon containing Nb microalloy steel affected by different processes in the actual industrial production, the segmentation cooling procedure including slow cooling first, then fast cooling and finally slow cooling was designed in this article. Based on this, the effects of deformation temperature and deformation amount on the transformation and microstructure of the experimental steel were analysed by combining with the observation of microstructure morphology and second-phase precipitation distribution. It could provide a reference for the designing of deformation conditions under the TMCP process in the actual industrial production of low-carbon microalloyed building steel.
Materials and experimental procedure
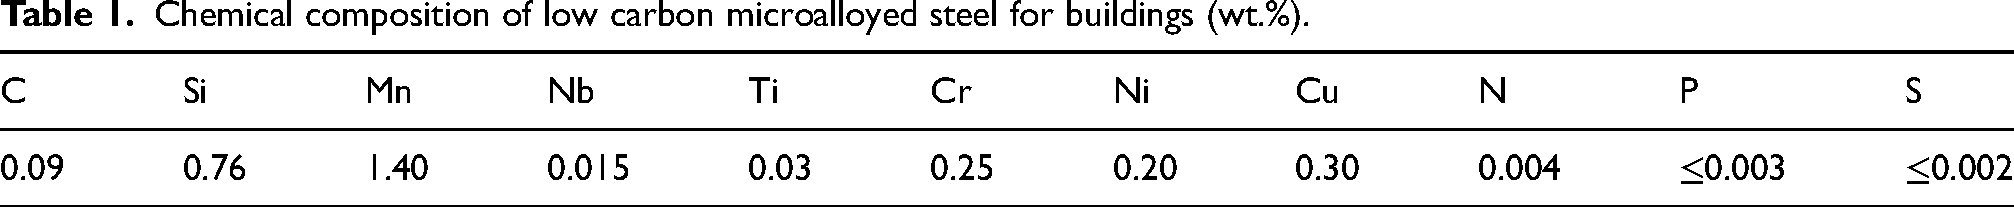
The experimental steel was a low-carbon Nb-containing microalloyed hot-rolled steel plate with a thickness of 20 mm for buildings produced by a domestic steel company. The chemical composition is given in Table 1.
Chemical composition of low carbon microalloyed steel for buildings (wt.%).
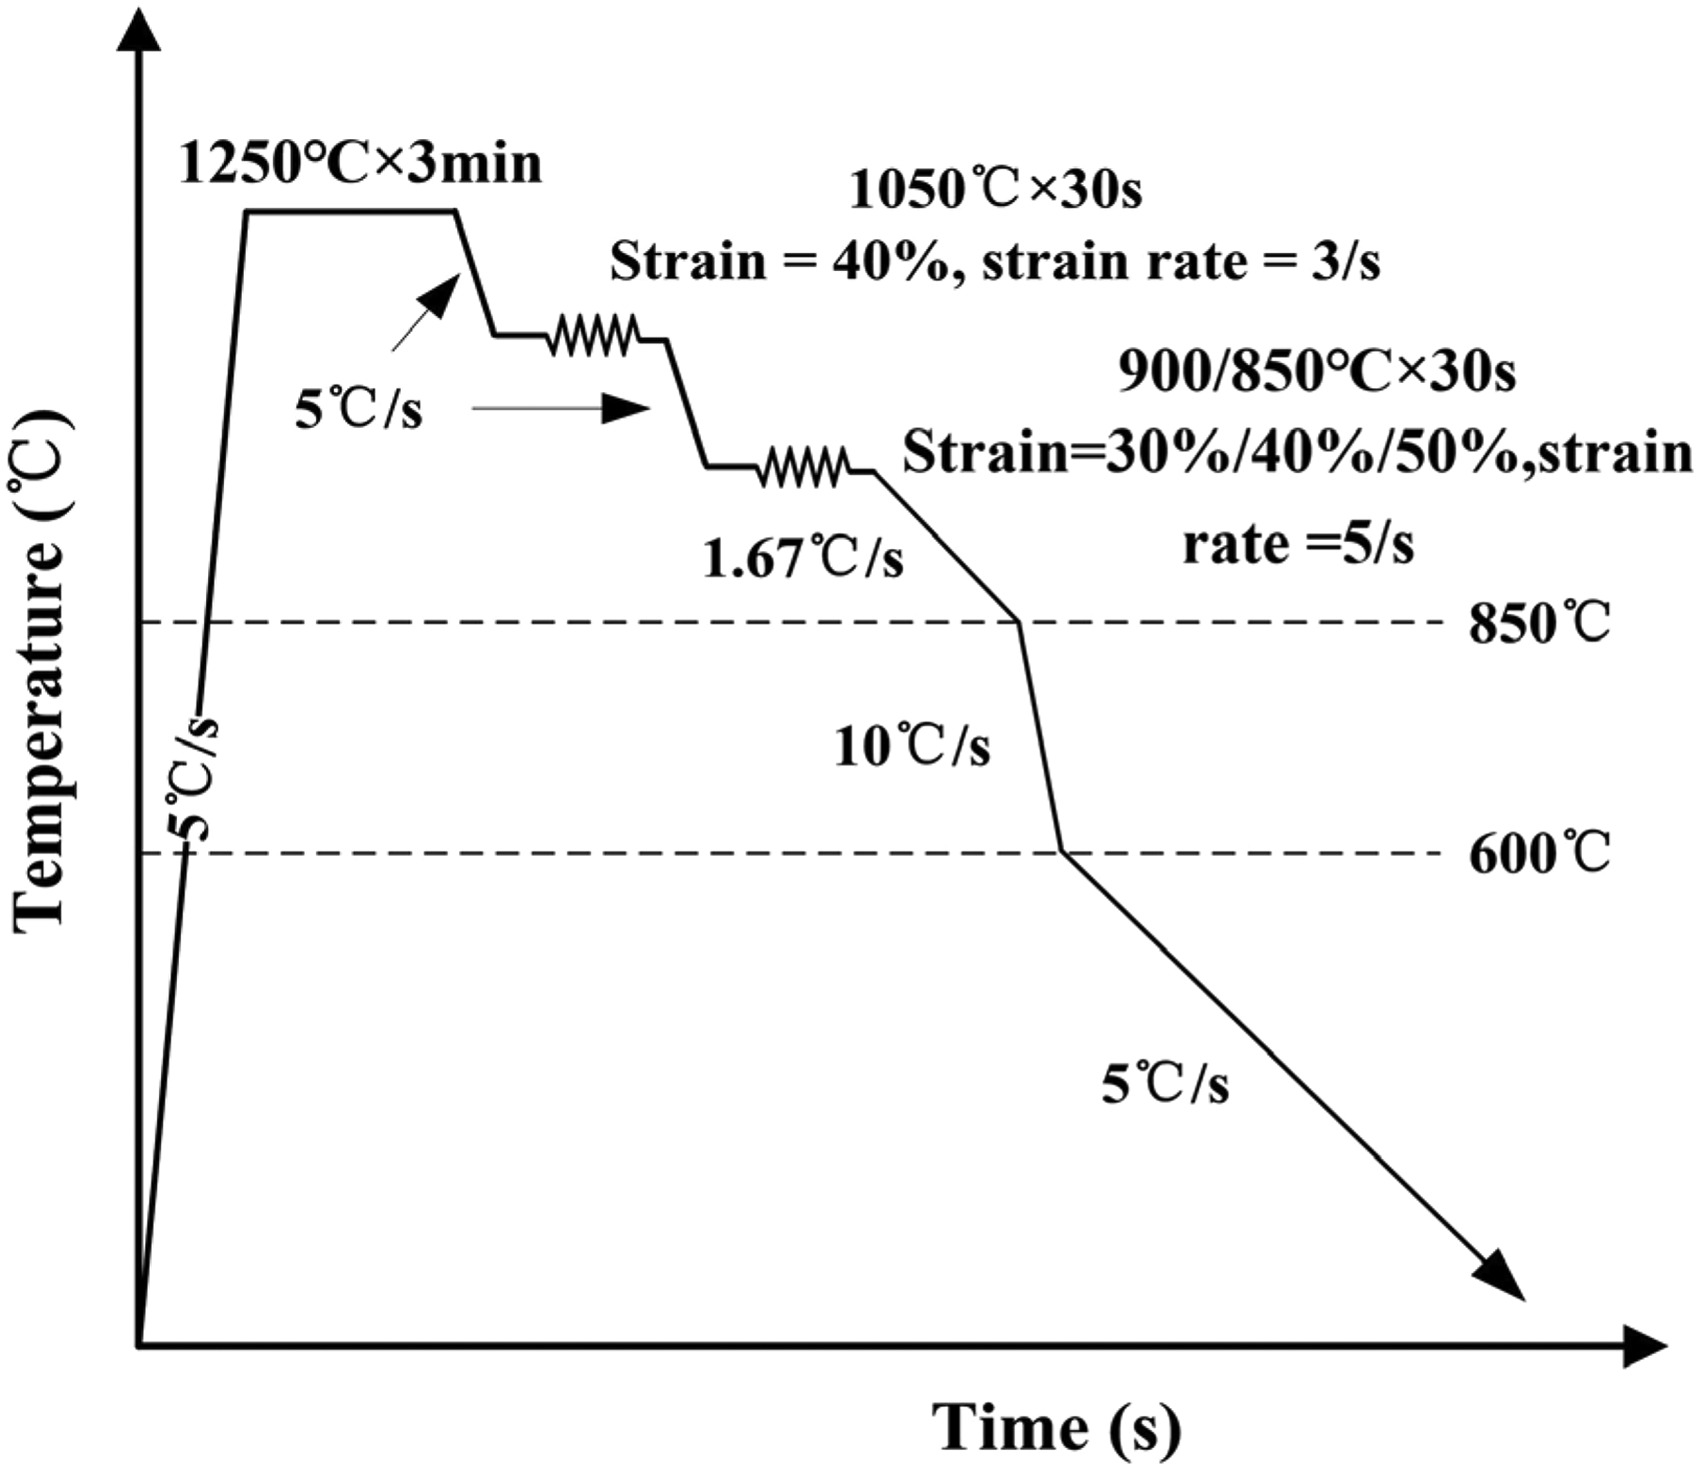
The hot-rolled steel plate was processed and machined as a ‘dumbbell’ shape with a gauge length of φ6 × 15 mm, and the compression experiments with different deformation temperatures and deformation amounts were carried out on a Gleeble-3500 thermal simulation tester. The specific deformation process is shown in Figure 1.
The deformation procedures of experimental steel.
The sample is named as the form of X–Y% according to the deformation temperature and deformation amount. X represents the deformation temperature and Y is the deformation amount (%). For example, 850–30% refers to the 30% deformation amount of the sample deformed at 850 °C. The thermal simulation experiment process is as follows. The samples were heated to 1250 °C at a rate of 5 °C·s−1 and held for 3 min to achieve full austenitising and all solid solutions of microalloying elements. Then the samples were cooled to 1050 °C at a rate of 5 °C·s−1 for the first stage deformation. The deformation amount was 40% and the strain rate was 3 s−1. After deformation, the samples were cooled to 900 °C and 850 °C at a rate of 5 °C·s−1 for the second stage of deformation, respectively. The deformation amounts were 30%, 40% and 50%, respectively, and the strain rate was 5 s−1. The two-stage deformations are used to simulate the rough rolling and finishing rolling stages in actual industrial production. After the deformation is completed, it is cooled to 850 °C at a rate of 1.67 °C·s−1 and then cooled to 600 °C at a rate of 10 °C·s−1 and finally cooled to room temperature at a rate of 5 °C·s−1. The time-temperature-expansion data during the experiment were recorded.
After the thermal simulation experiment, the samples were machined along the diameter direction in the central heating zone, and the Nova Nano 400 field emission scanning electron microscope (FE-SEM) and Zeiss optical microscope (OM) were used to observe the room temperature microstructure of different samples. The FE-SEM equipped with Oxford Symmetry electron backscattered diffraction (EBSD) system was used to analyse the orientation relationship and crystal structure. In addition, the PHILIPS CM12 transmission electron microscope (TEM) was used to observe the shape, size, morphology and chemical composition of the precipitates. The thermal expansion curves under different deformation processes were drawn, and the transformation process in the thermal simulation curves was analysed by the slope method. The starting and ending temperatures of transformation at different stages were measured, and the content of phase products in different samples was determined by combining the critical transformation temperature and the final room microstructure.
Results and discussion
Effect of deformation temperature
Analysis of dilatation
The dynamic CCT curve of the experimental steel and the thermal expansion curve of the experimental steel during the heating stage to show the temperature of Ac1 and Ac3 of the experimental steel were plotted in Figure 2(a) and (b), respectively, based on the authors’ previous research results. 32 Figure 3(a) and (c) are the dilatation-temperature curves of the 850–50% and 900–50% samples. The first derivative results of the curve with respect to temperature, indicating the change of the slope of the expansion curve are shown in Figure 3(b) and (d), respectively, which represent the transformation rate. The temperature range where the slope value remains horizontal means that the change of the expansion amount in this stage is only related to the cooling rate, and the temperature point at which the slope value changes abruptly represents the start or end temperature of transformation. From the dynamic CCT curve of the experimental steel (Figure 2(a)), it can be seen that when the cooling rate is 5–10 °C·s−1, the transformation curve passes through the ferrite and bainite transformation regions, so it can be roughly inferred that the ferrite and bainite transformations occur during the cooling process. During cooling, the first temperature point at which the slope changes from the horizontal segment represents the beginning of the ferrite transformation. It should be noted here that the slope decreases to the lowest point and then increases abruptly, and the lowest point temperature is about 600 °C. It is due to the cooling rate is suddenly decreased from 10 °C·s−1 to 5 °C·s−1 at 600 °C. After the slope value passes the lowest point, it begins to increase continuously, and when it increases to about ‘0’, there is a small stage of flat state. At this stage, the increase in expansion caused by the transformation just offsets the decrease in expansion caused by cooling, which means that the ferrite transformation gradually decreases until the end, and the bainite transformation begins to enter the incubation period.
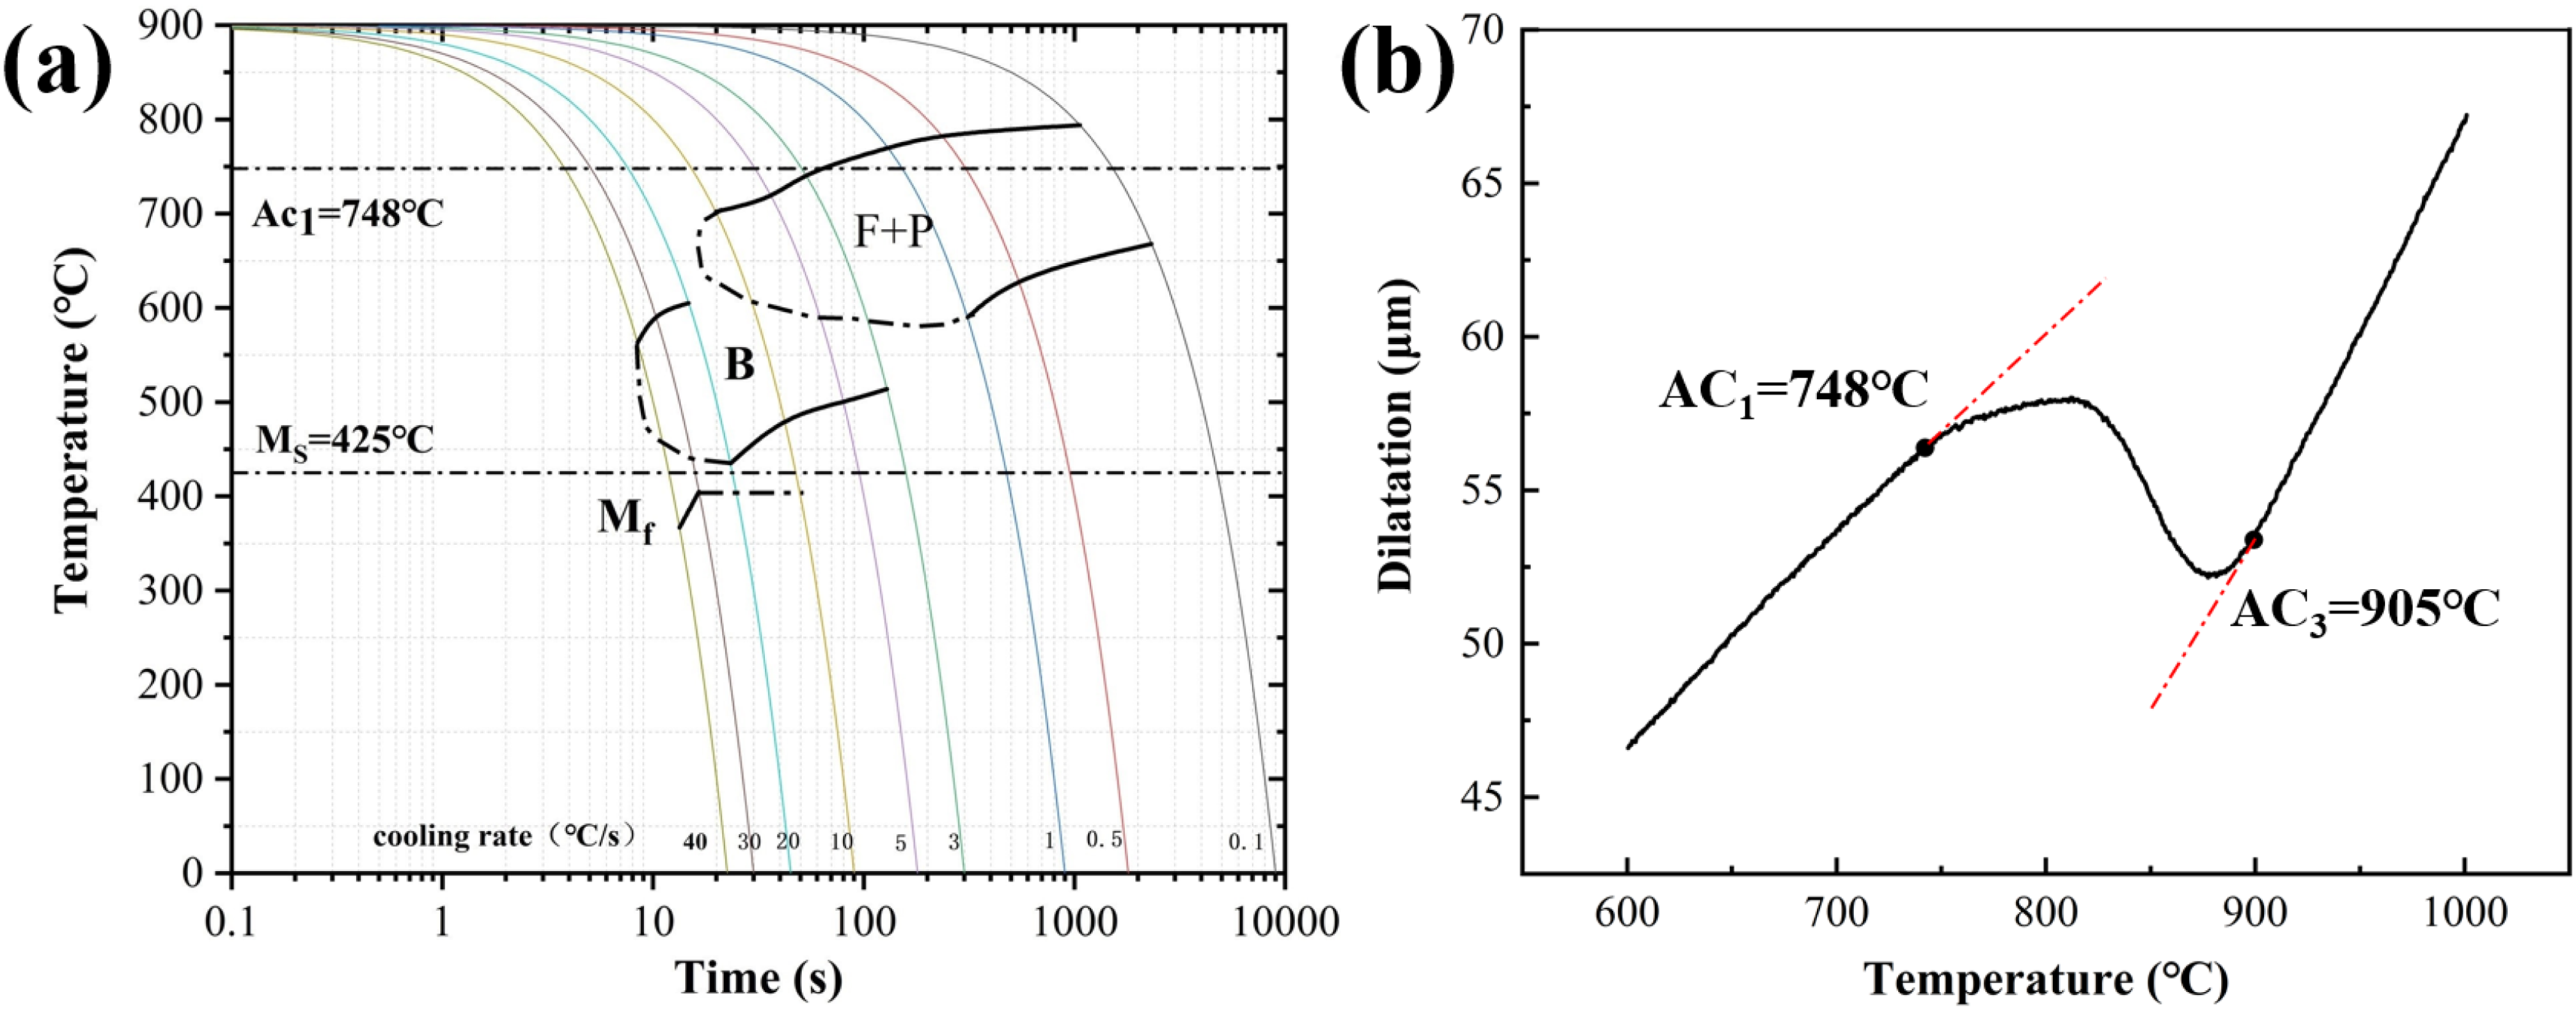
(a) Dynamic CCT curve; (b) thermal expansion curve during heating.
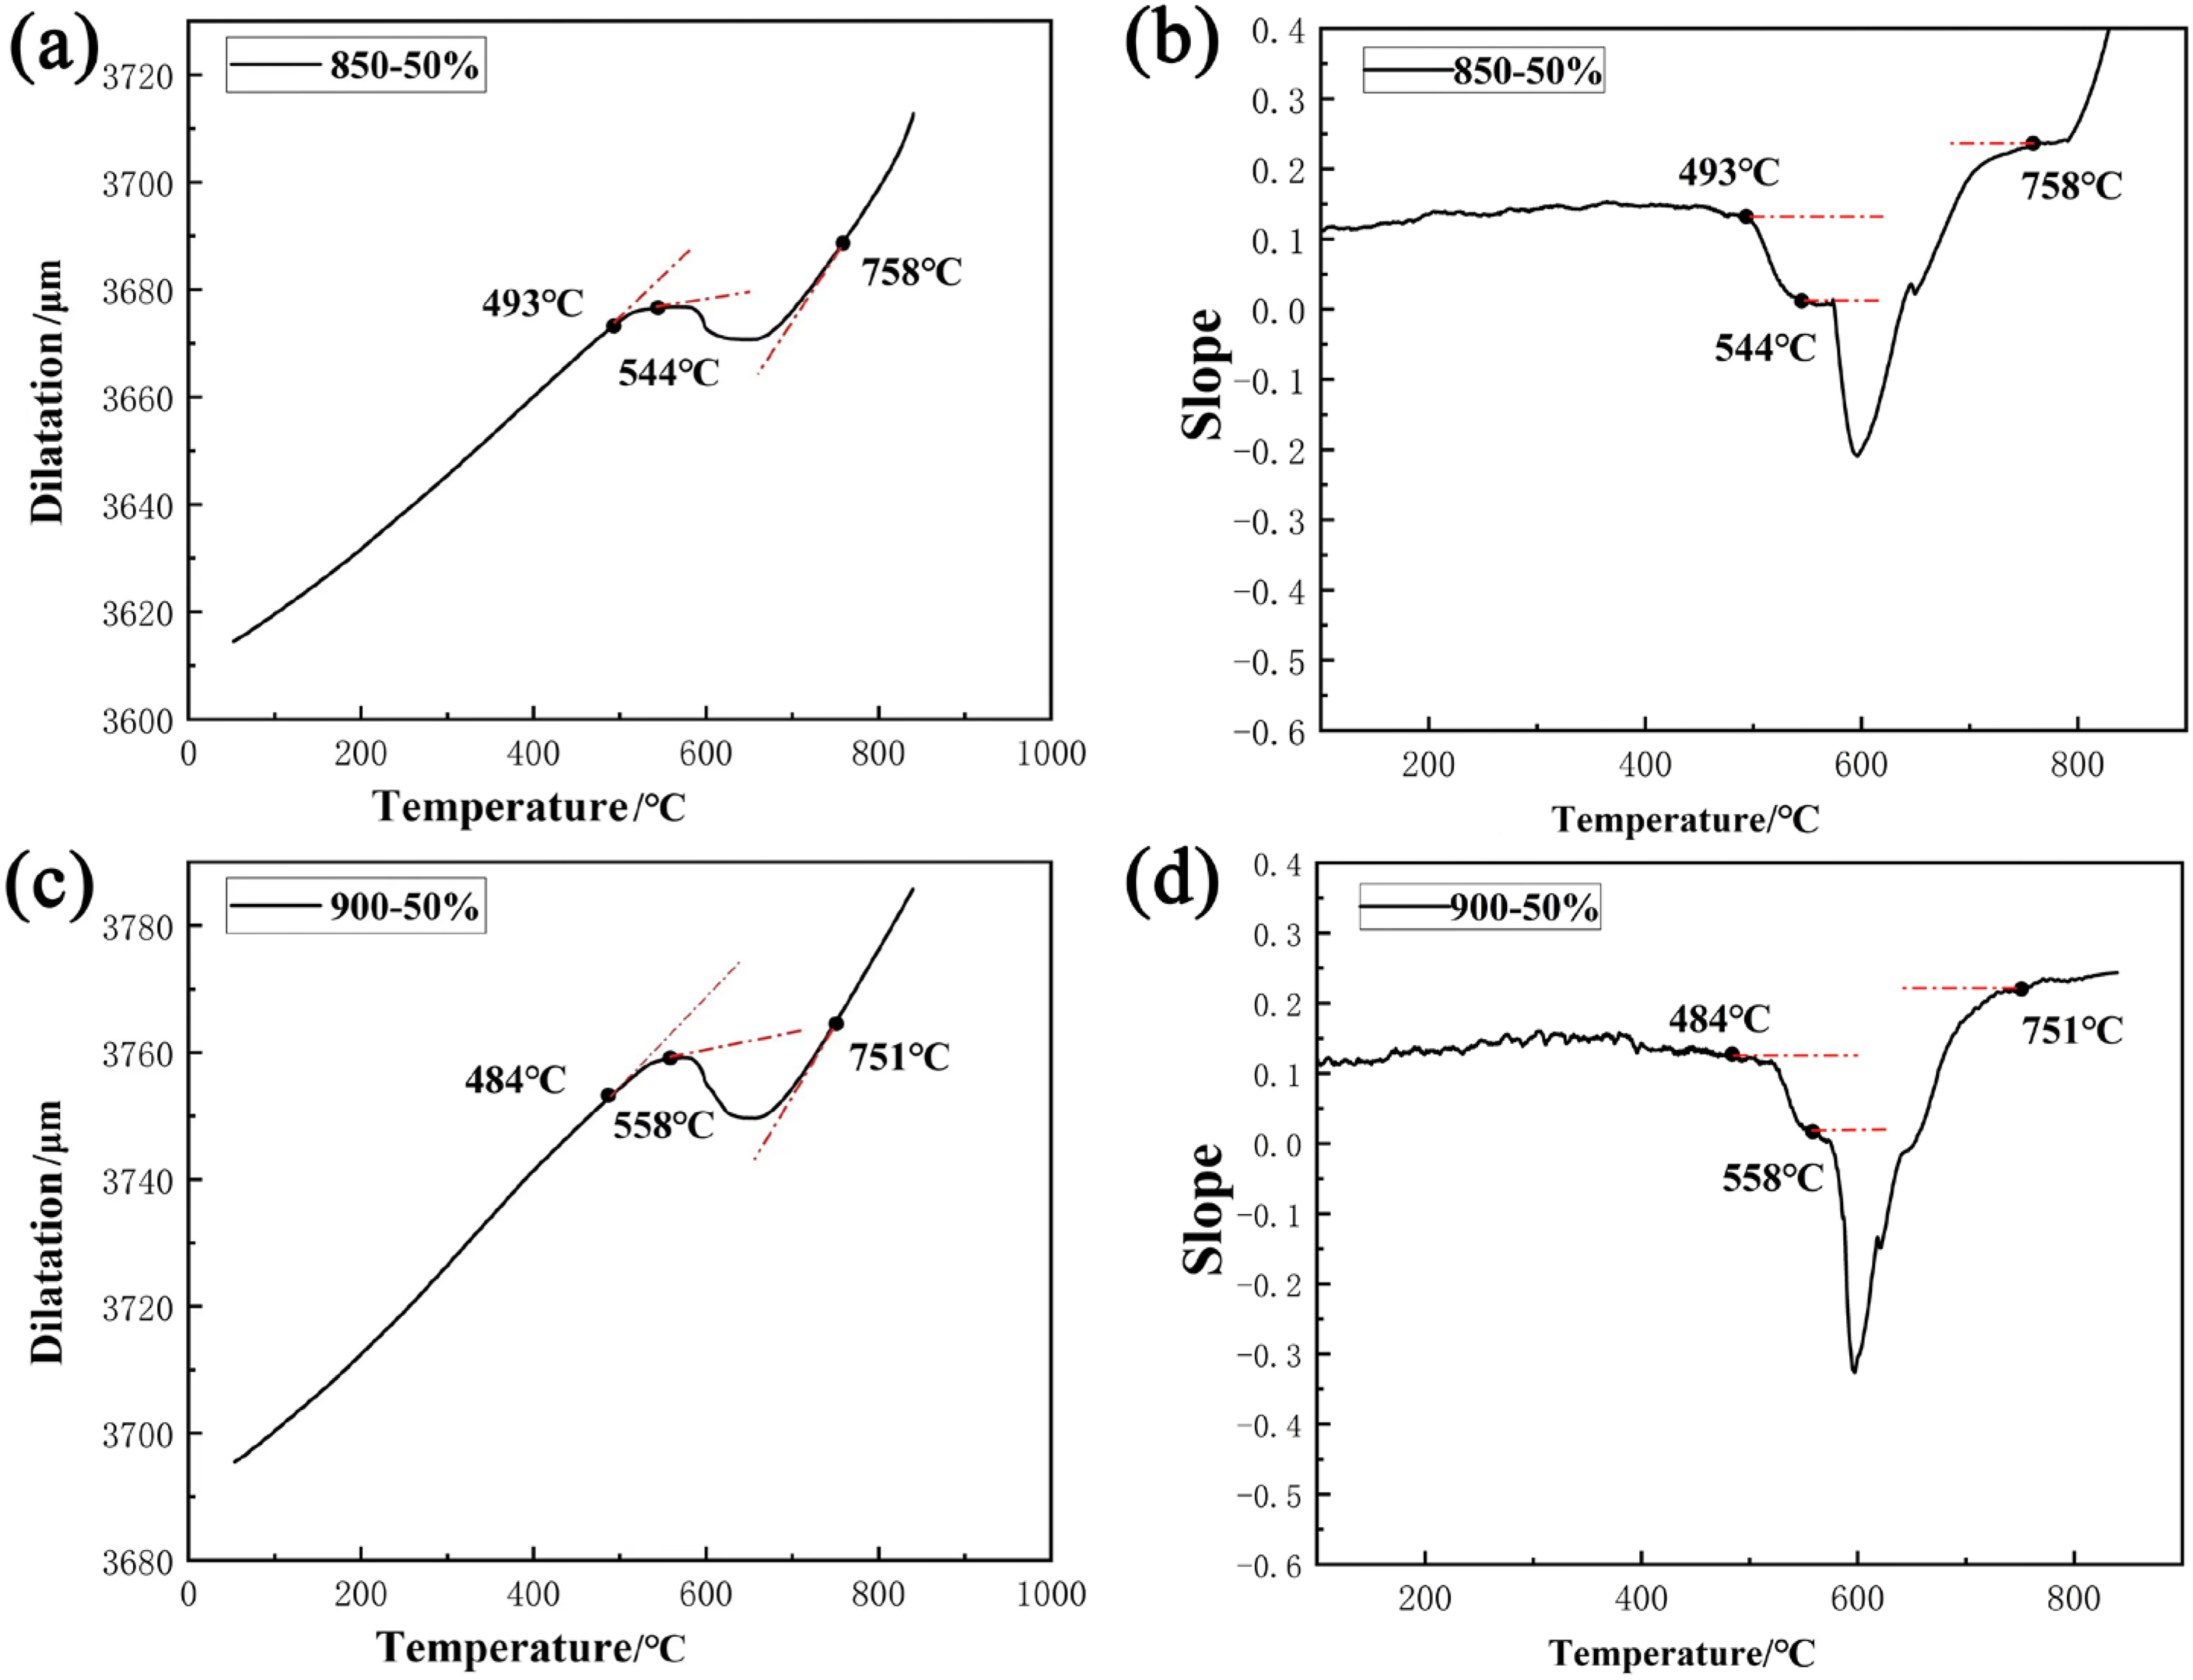
Cooling stage curves of samples at different deformation temperatures: (a) and (c) dilatation vs. temperature curve; (b) and (d) the slope curves representing the transformation rate ((a) and (b) the 850–50% sample; (c) and (d) the 900–50% sample).
When the slope suddenly increases from ‘0’, it represents the beginning of the bainite transformation. Subsequently, the slope curve again becomes a horizontal constant, representing the end of the bainite transformation. Through the change of the slope curve, the starting temperature of ferrite transformation, and the starting and ending temperatures of bainite transformation can be determined. Therefore, it can be obtained from Figure 3 that the starting temperature of ferrite transformation is about 758 °C, the starting temperature of bainite transformation is 544 °C, and the bainite transformation stops when the temperature drops to 493 °C in the 850–50% sample. Similarly, in the 900–50% sample, the starting temperature of ferrite transformation is about 751 °C, and they are about 558 °C and 484 °C, respectively, for the starting and ending temperature of bainite transformation. Overall, it is known from these statistical results that when the deformation temperature increases, the starting temperature of ferrite transformation and the ending temperature of bainite transformation decrease, but the starting temperature of bainite transformation increases.
The lever rule (f = ON/MN; f is the relative volume fraction of transformation including ferrite and bainite) is used to calculate the relative volume fraction of different phases based on temperature-dependent expansion data.33,34 According to the lever law, the curves of the relative phase change volume fraction of 850–50% and 900–50% samples vs. temperature are plotted in Figure 4. It can be seen that the change curves follow a typical ‘S’ curve. In addition, the latter half part of the ‘S’ curve moves to the right and up sides with the increase of the deformation temperature from 850 °C to 900 °C. According to the expansion-temperature curve of each sample, it can be basically determined that the latter half part of the ‘S’ curve undergoes the bainite transformation. It can be found that the increase of the compressive temperature promotes the bainite transformation. The former half part of the ‘S’ curve moves to the left and down sides with the increase of the deformation temperature. It can be found that the increase of the deformation temperature inhibits the ferrite transformation according to the expansion-temperature curve shown in Figure 3. By comparing the starting and ending times of transformation at different deformation temperatures, it can be found that the lower deformation temperature will promote the ferrite transformation. It could be explained that when the undercooled austenite is deformed at a lower temperature, the growth of austenite grains is hindered and the amount of deformation bands in the grains will be increased. In addition, the density of defects caused by the deformation increases, and these defects have a positive role in the ferrite nucleation. As reported by Zhao et al., 35 with the increase in temperature, the motion of dislocation changes from slip to climb and slip. Consequently, the degree of undercooling required for ferrite nucleation is reduced, so the starting temperature of ferrite transformation increases with the decrease of deformation temperature. At the same time, the lower deformation temperature leads to the smaller ferrite grains. The nucleation of ferrite at austenite grain boundaries or defects such as deformation bands is easier, 36 also resulting in the increase of the starting temperature of ferrite transformation.
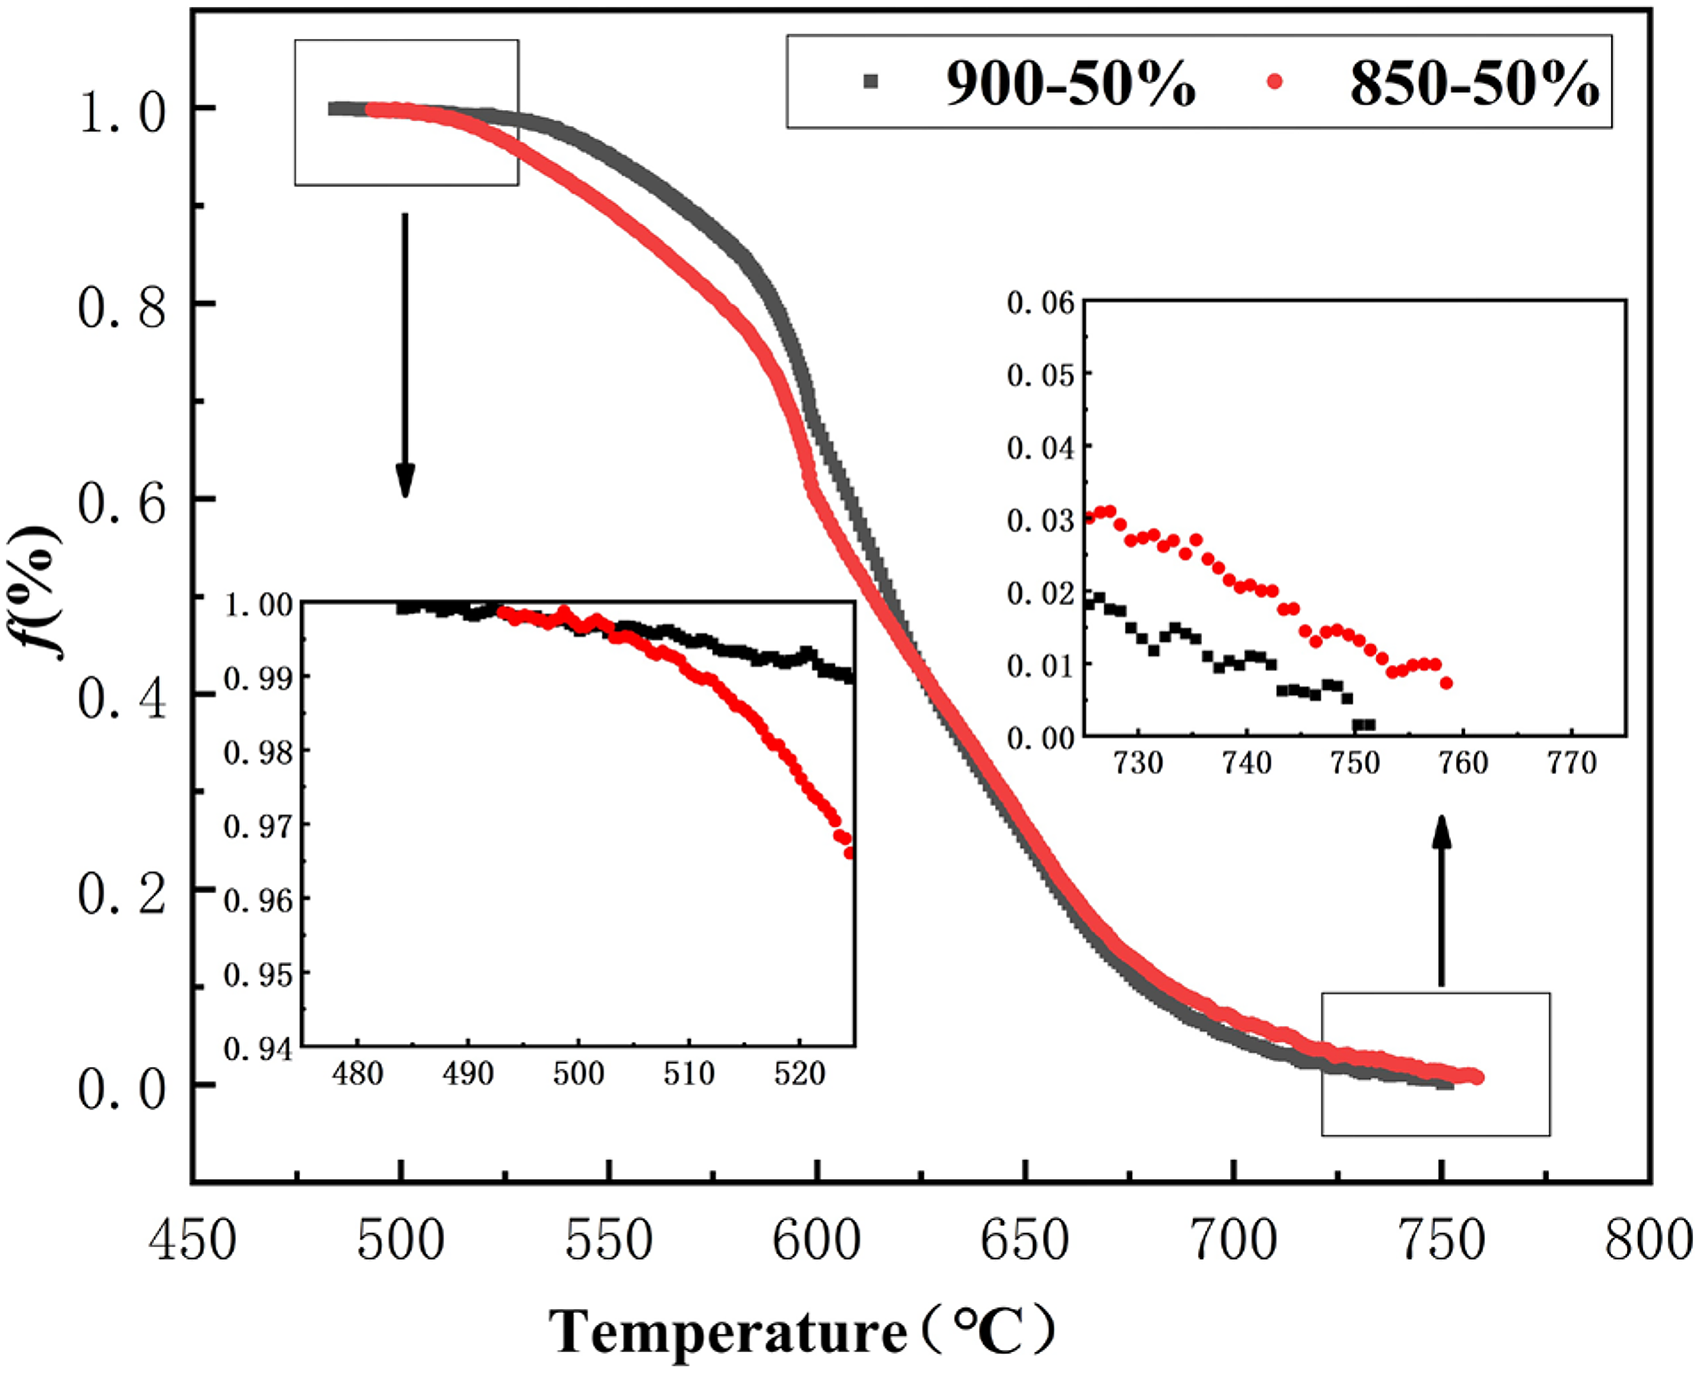
The change curves of the relative volume fraction of transformation with temperature of different samples.
On the contrary, this easier ferrite transformation leads to the increase of the carbon content in residual austenite due to the diffusion type of the ferrite transformation, thus inhibiting the nucleation of medium-temperature bainite transformation. Therefore, the starting temperature of bainite transformation decreases and the ending temperature of bainite transformation increases slightly with the decrease of deformation temperature. Compared with the deformation of the high austenite region, the deformation in the low-temperature region not only inhibits the nucleation of bainite but also shortens the transformation temperature range and transformation time of bainite, which could inhibit the growth of bainite plates, thus refining bainite microstructure. 37
Microstructure
The room temperature SEM and OM microstructures of samples deformed at different temperatures are shown in Figures 5 and 6, respectively. Using the previous microstructure classification method, 38 it can be observed that the microstructure of all samples after the thermal simulation experiment is composed of ferrite and granular bainite. In addition, combined with the microhardness of different microstructures, the ferrite (F) and bainite (B) phases could be accurately determined. The microhardness of the ferrite phase is about 196 ± 5 HV, while it is about 277 ± 8 HV for the bainite phase. The volume fractions of bainite and ferrite are calculated according to their morphology and brightness in the room-temperature microstructure. Figure 6(b) and (d) are given and used as examples to present the process of counting the volume fraction of ferrite in 850–50% and 900–50% samples, respectively. The samples in the OM microstructure contain dark bainite and bright ferrite. It is noted that the adjacent areas of the dark bainite also should be marked as bainite due to the morphological features of granular bainite. Firstly, the blocky and bright areas were manually and carefully coloured to red and their area percentage (labelled as B1, ferrite) was counted by the Image-Pro Plus software (Figure 6(b) and (d)). 39 Secondly, the area percentage of bainite (labelled as B2) was attained by B2 = 100%–B1. Five OM images of the same resolution are counted for each sample. The reported results are averaged, and the final statistical results are shown in Figure 6. It can be seen that with the increase of deformation temperature, the volume fraction of ferrite decreases, while the volume fraction of bainite increases. The statistical results of microstructure are consistent with the results of the dilatation curve.
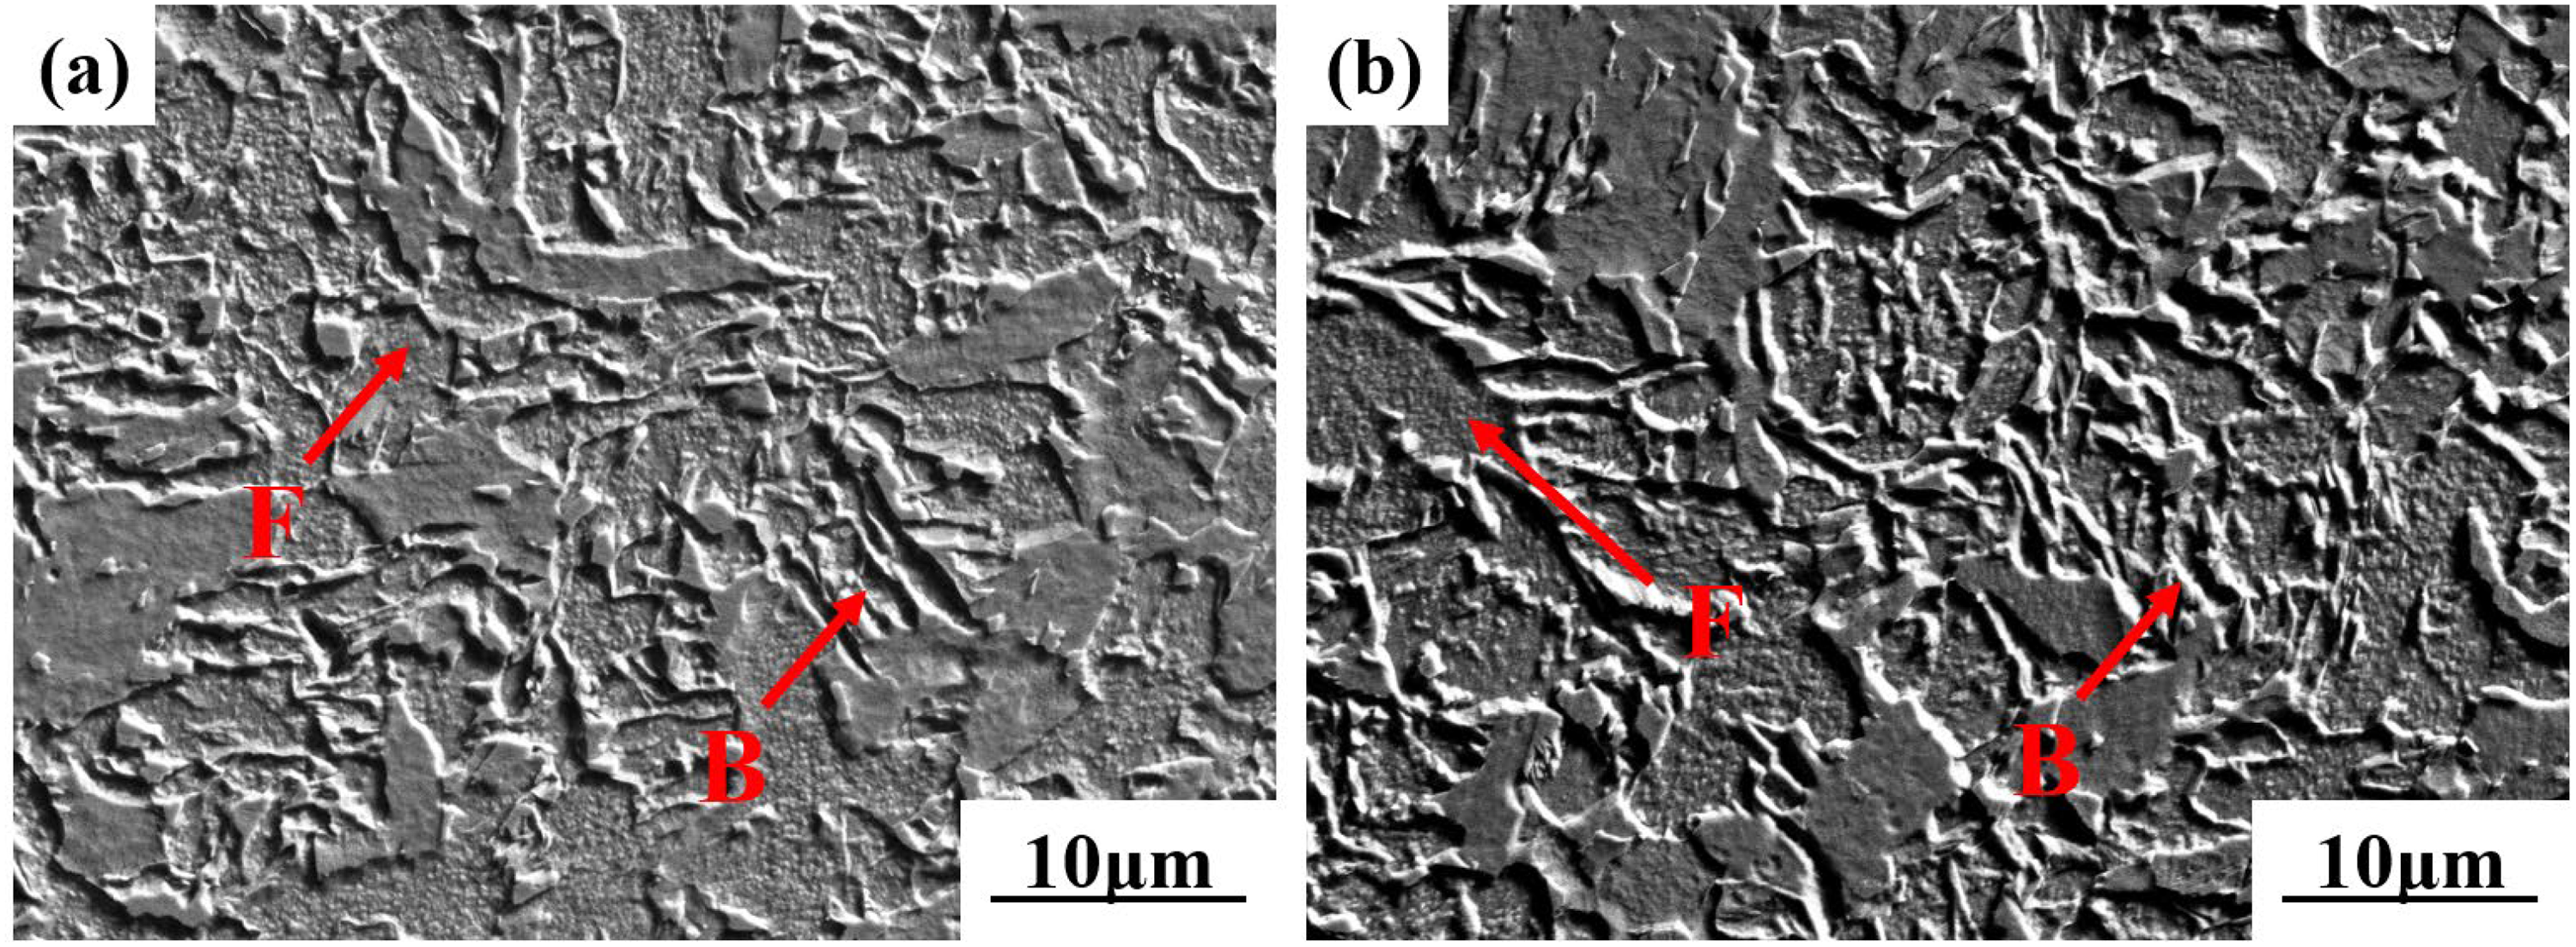
The SEM microstructure of: (a) 850–50% sample; (b) 900–50% sample.
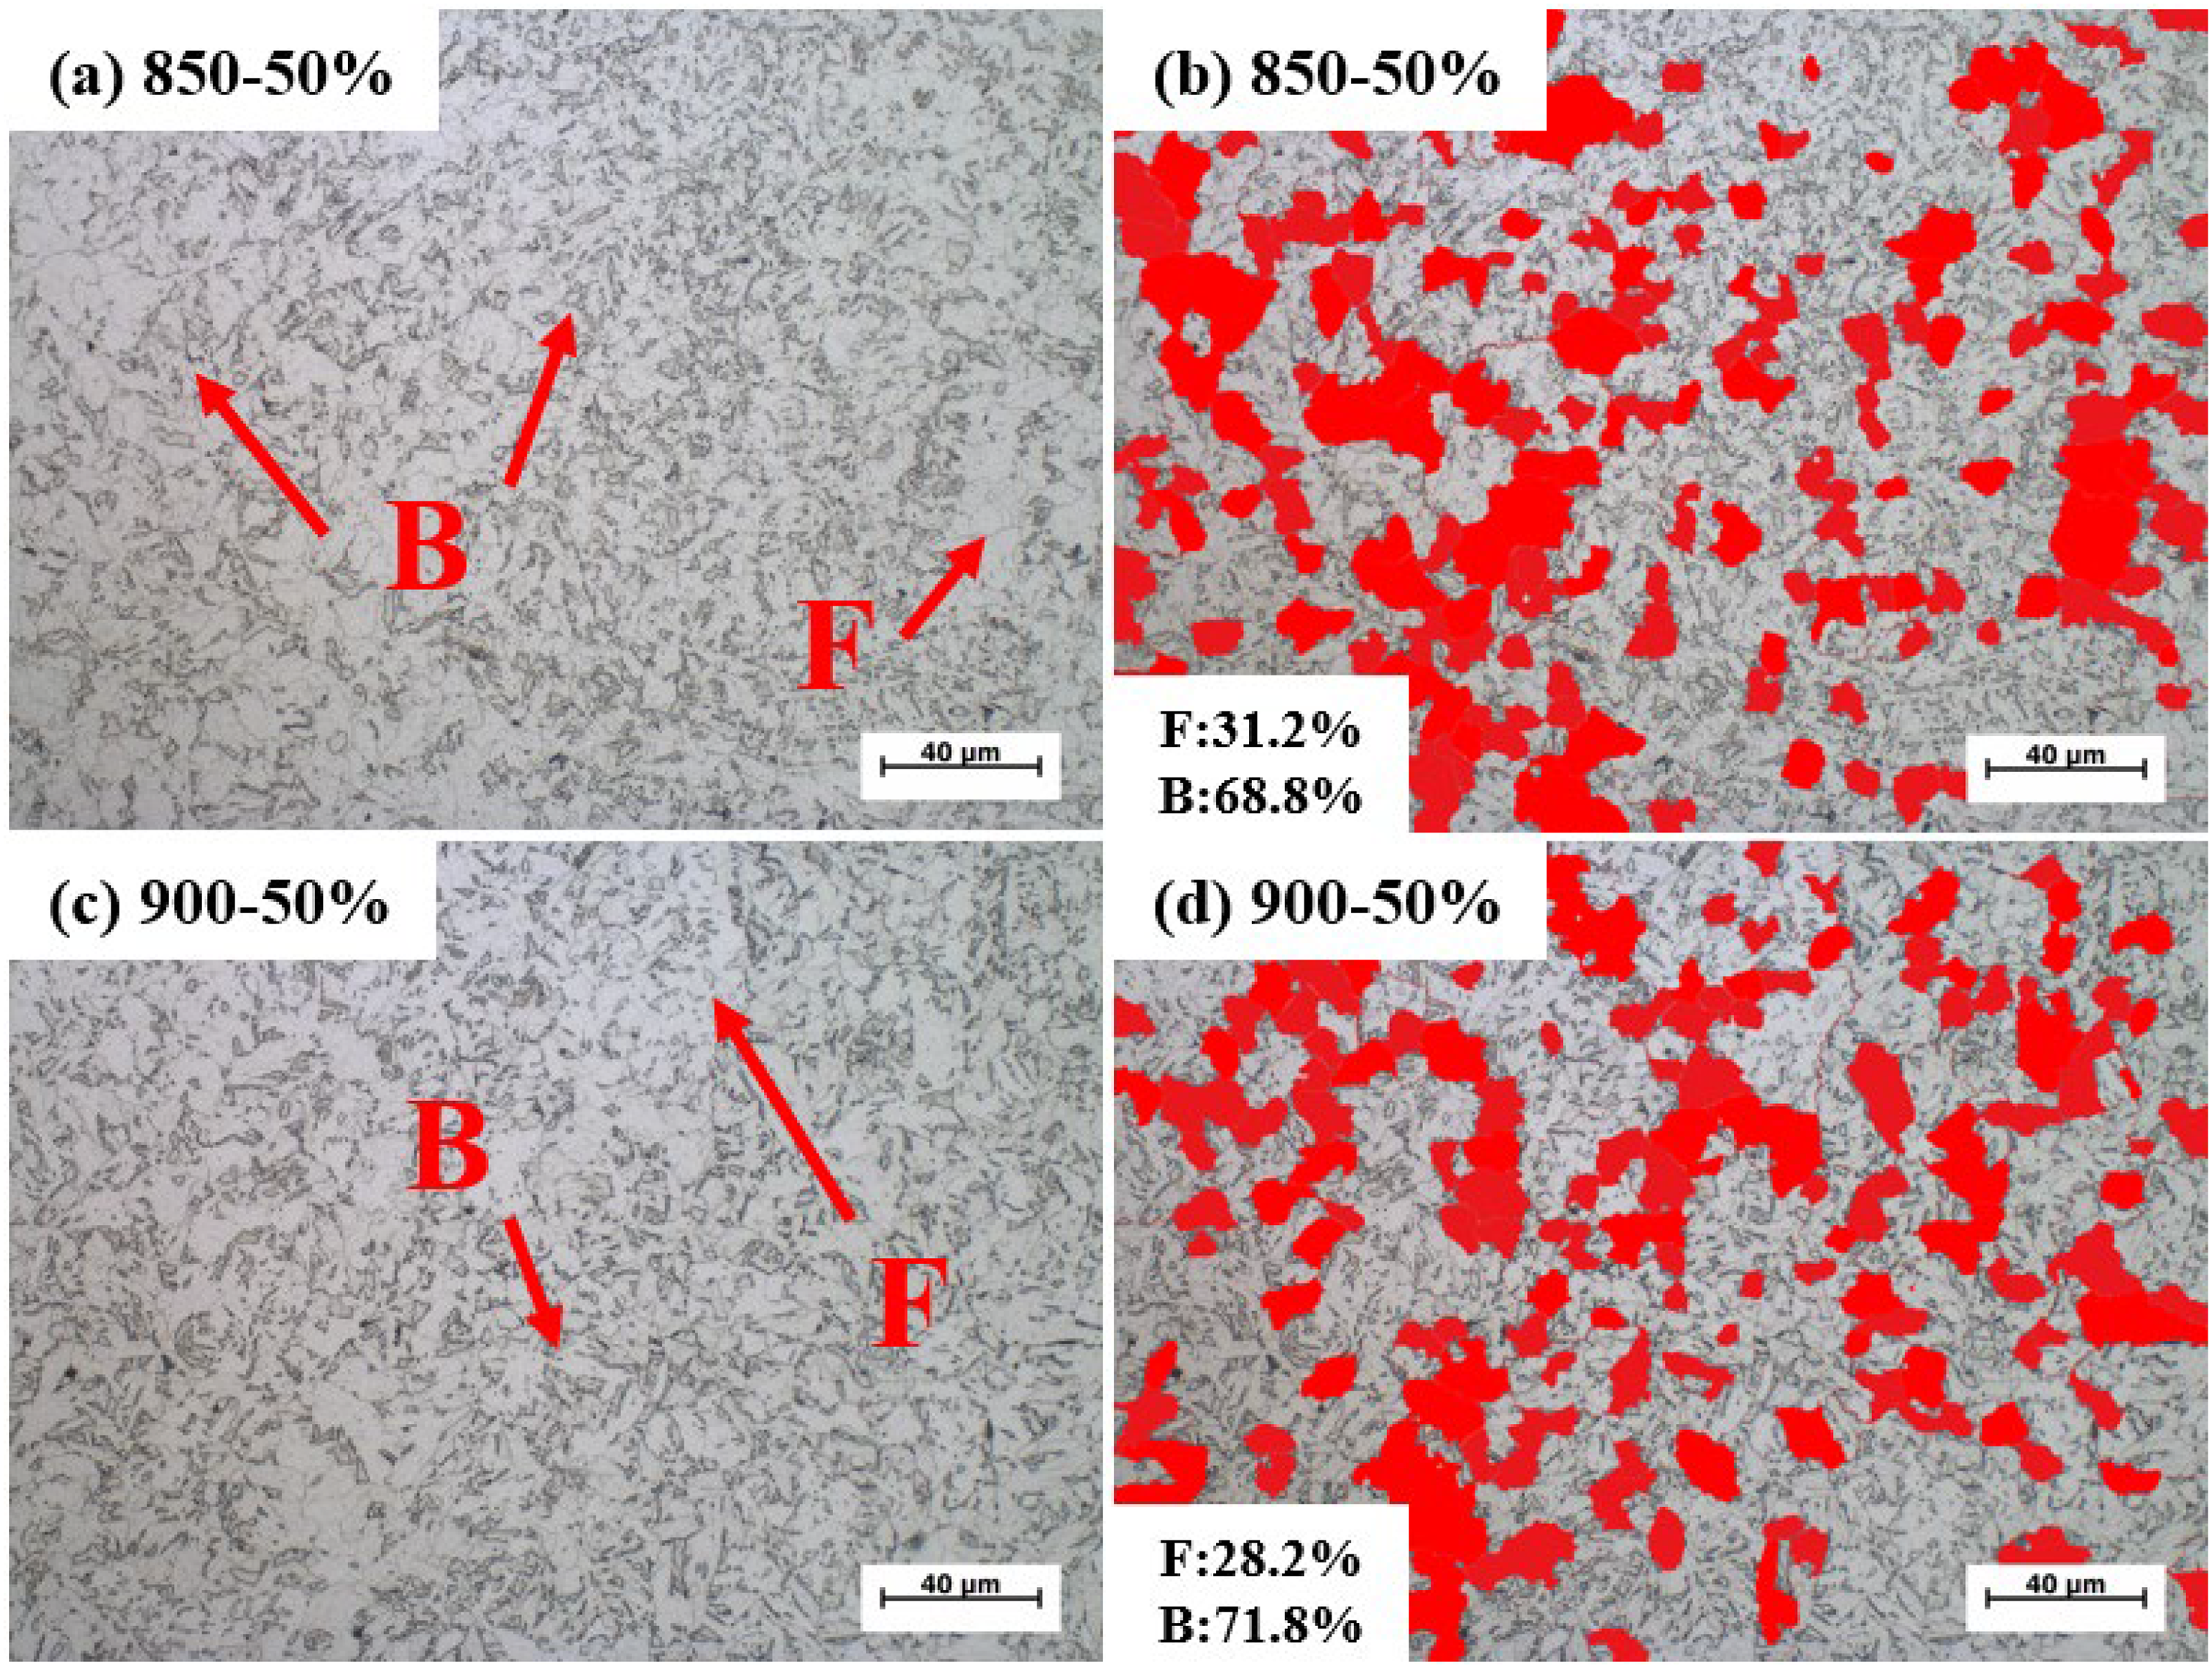
Statistical examples of room temperature OM microstructure: (a) and (c) the original micrograph; (b) and (d) the blocky and bright area are coloured red ((a) and (b) the 850–50% sample; (c) and (d) the 900–50% sample, F: ferrite, B: bainite).
EBSD analysis
Figure 7 gives the EBSD analysis results of 850–50% and 900–50% samples. Figure 7(a) and (b) present the grain orientation distribution map, while Figure 7(c) and (d) show the grain boundary distribution map. Three lines with different colours are used to distinguish the different boundary in the grain boundary distribution map. The black thin line represents the grain boundary with an angle of 2°∼5°, the green midline represents the grain boundary with an angle of 5°∼15°, and the blue thick line represents the grain boundary with an angle greater than 15°. With the decrease of deformation temperature, the grain boundary content of large angle increases from 56.3% to 61.3%, the grain boundary content of 5°∼15° decreases from 25% to 21%, and the grain boundary content of 2°∼5° decreases from 18.7% to 17.7%. As is reported by Qian et al., 40 the interactions between the lattice dislocations and grain boundary redistribute stress from the grain boundary to the grain interior. It indicates that the grain boundary angle has a significant effect on the tensile properties. In addition, Figure 7(e) and (f) are the respective distribution of grain size shown in Figure 7(a) and (b). It is observed that the grain size is located in the range of 0∼24 μm. Apart from this, it is counted that the proportion of small grains of 0∼12 μm reaches 93.93% in the 850–50% sample, while in the 900–50% sample, it is only 91.45%. And the average grain size of 850–50% and 900–50% samples are 4.41 μm and 4.84 μm, respectively. These results indicate that the reduction of the deformation temperature could result in a decrease in grain size and better tensile properties. It is reported by Zhang et al. 41 that the refined grain enables loading stress transfer and weakens the obstruction of dislocation motion, which makes it difficult for cracks to extend, thus improving the mechanical properties.

EBSD analysis of 850–50% sample (a, c and e) and 900–50% sample (b, d and f): (a) and (b) the grain orientation distribution map; (c) and (d) the grain boundary distribution map; (e) and (f) the distribution of grain size.
TEM analysis
Figure 8(a) and (b) are the TEM images of 900–50% and 850–50% samples for observation of finer precipitates, and Figure 8(c) and (d) show the corresponding energy spectra of the precipitates, respectively. They are used to analyse the difference in precipitates after different deformed processes. The diffraction pattern of the precipitate is given in the inset figure in Figure 8(a) to show the type of microalloy precipitates. It indicates that the second-phase precipitation is mainly the particle of NbC. Comparing the distribution of precipitates in the two samples from Figure 8(a) and (b), it is obviously observed that the number of precipitates with a small and black morphology increases with the decrease of the compressive temperature. This is because when the deformation temperature is reduced from 900 °C to 850 °C, the precipitation particles can be not only precipitated on the austenite grain boundary but also in the ferrite phase. 42
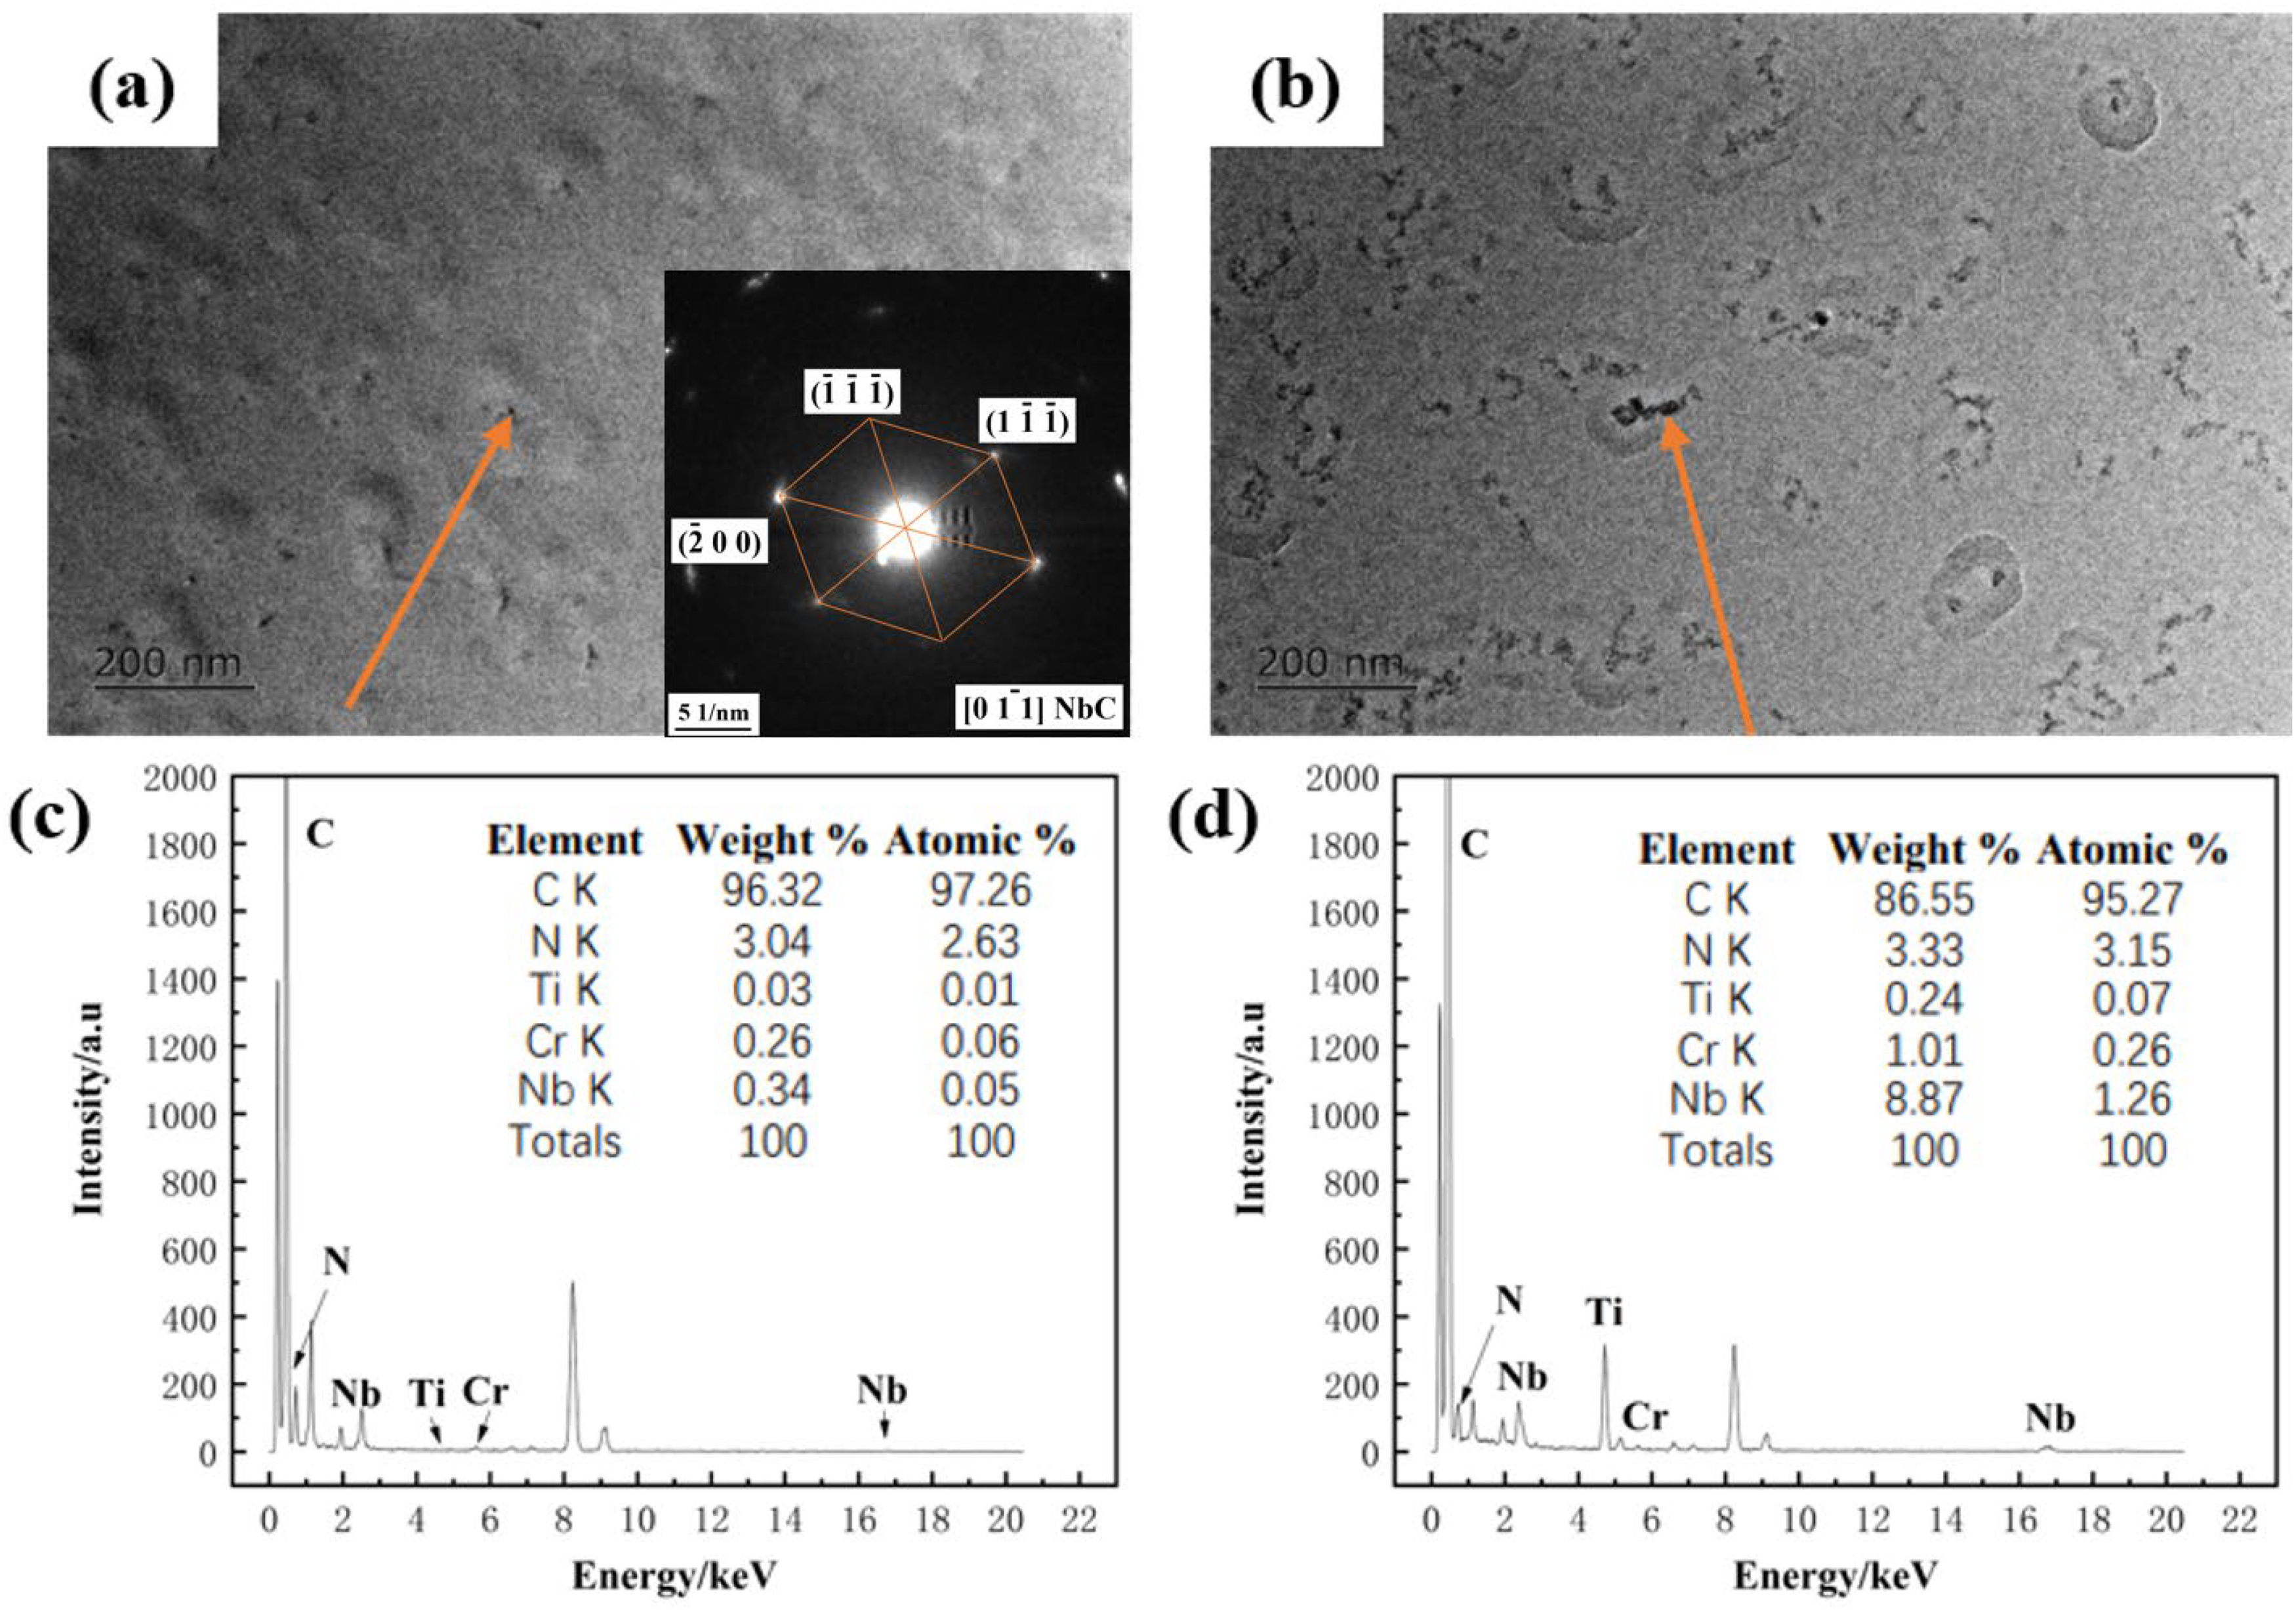
TEM and energy spectrum analysis of precipitates in 900–50% ((a) and (c)) and 850–50% ((b) and (d)) samples.
Effect of strain amount
Analysis of dilatation
Different strain amounts affect the continuous transformation process of undercooled austenite. Taking the 850–30%, 850–40% and 850–50% samples as examples, Figure 9(a), (c) and (e) are the expansion-temperature curves of the 850–30%, 850–40% and 850–50% samples during the cooling stage, respectively. The first derivatives of the corresponding curves with respect to temperature are shown in Figure 9(b), (d) and (f), respectively. It indicates the change in the slope of the expansion curve, which could represent the transformation rate. The temperature range where the slope value remains horizontal means that the change of the expansion amount in this stage is only related to the cooling rate, and the temperature point where the slope value changes abruptly represents the starting or ending temperature of the transformation. Taking 850–30% sample as an example, the initial temperature of ferrite transformation is about 740 °C. When the temperature drops to about 558 °C, the bainite transformation begins, and finally the bainite transformation ends at about 516 °C. It can be seen from the transformation temperatures shown in Figure 8 that when the strain amount increases, the starting temperature of ferrite transformation gradually increases from 740 °C to 758 °C, and the starting temperature and ending temperature of bainite phase transformation gradually decrease.
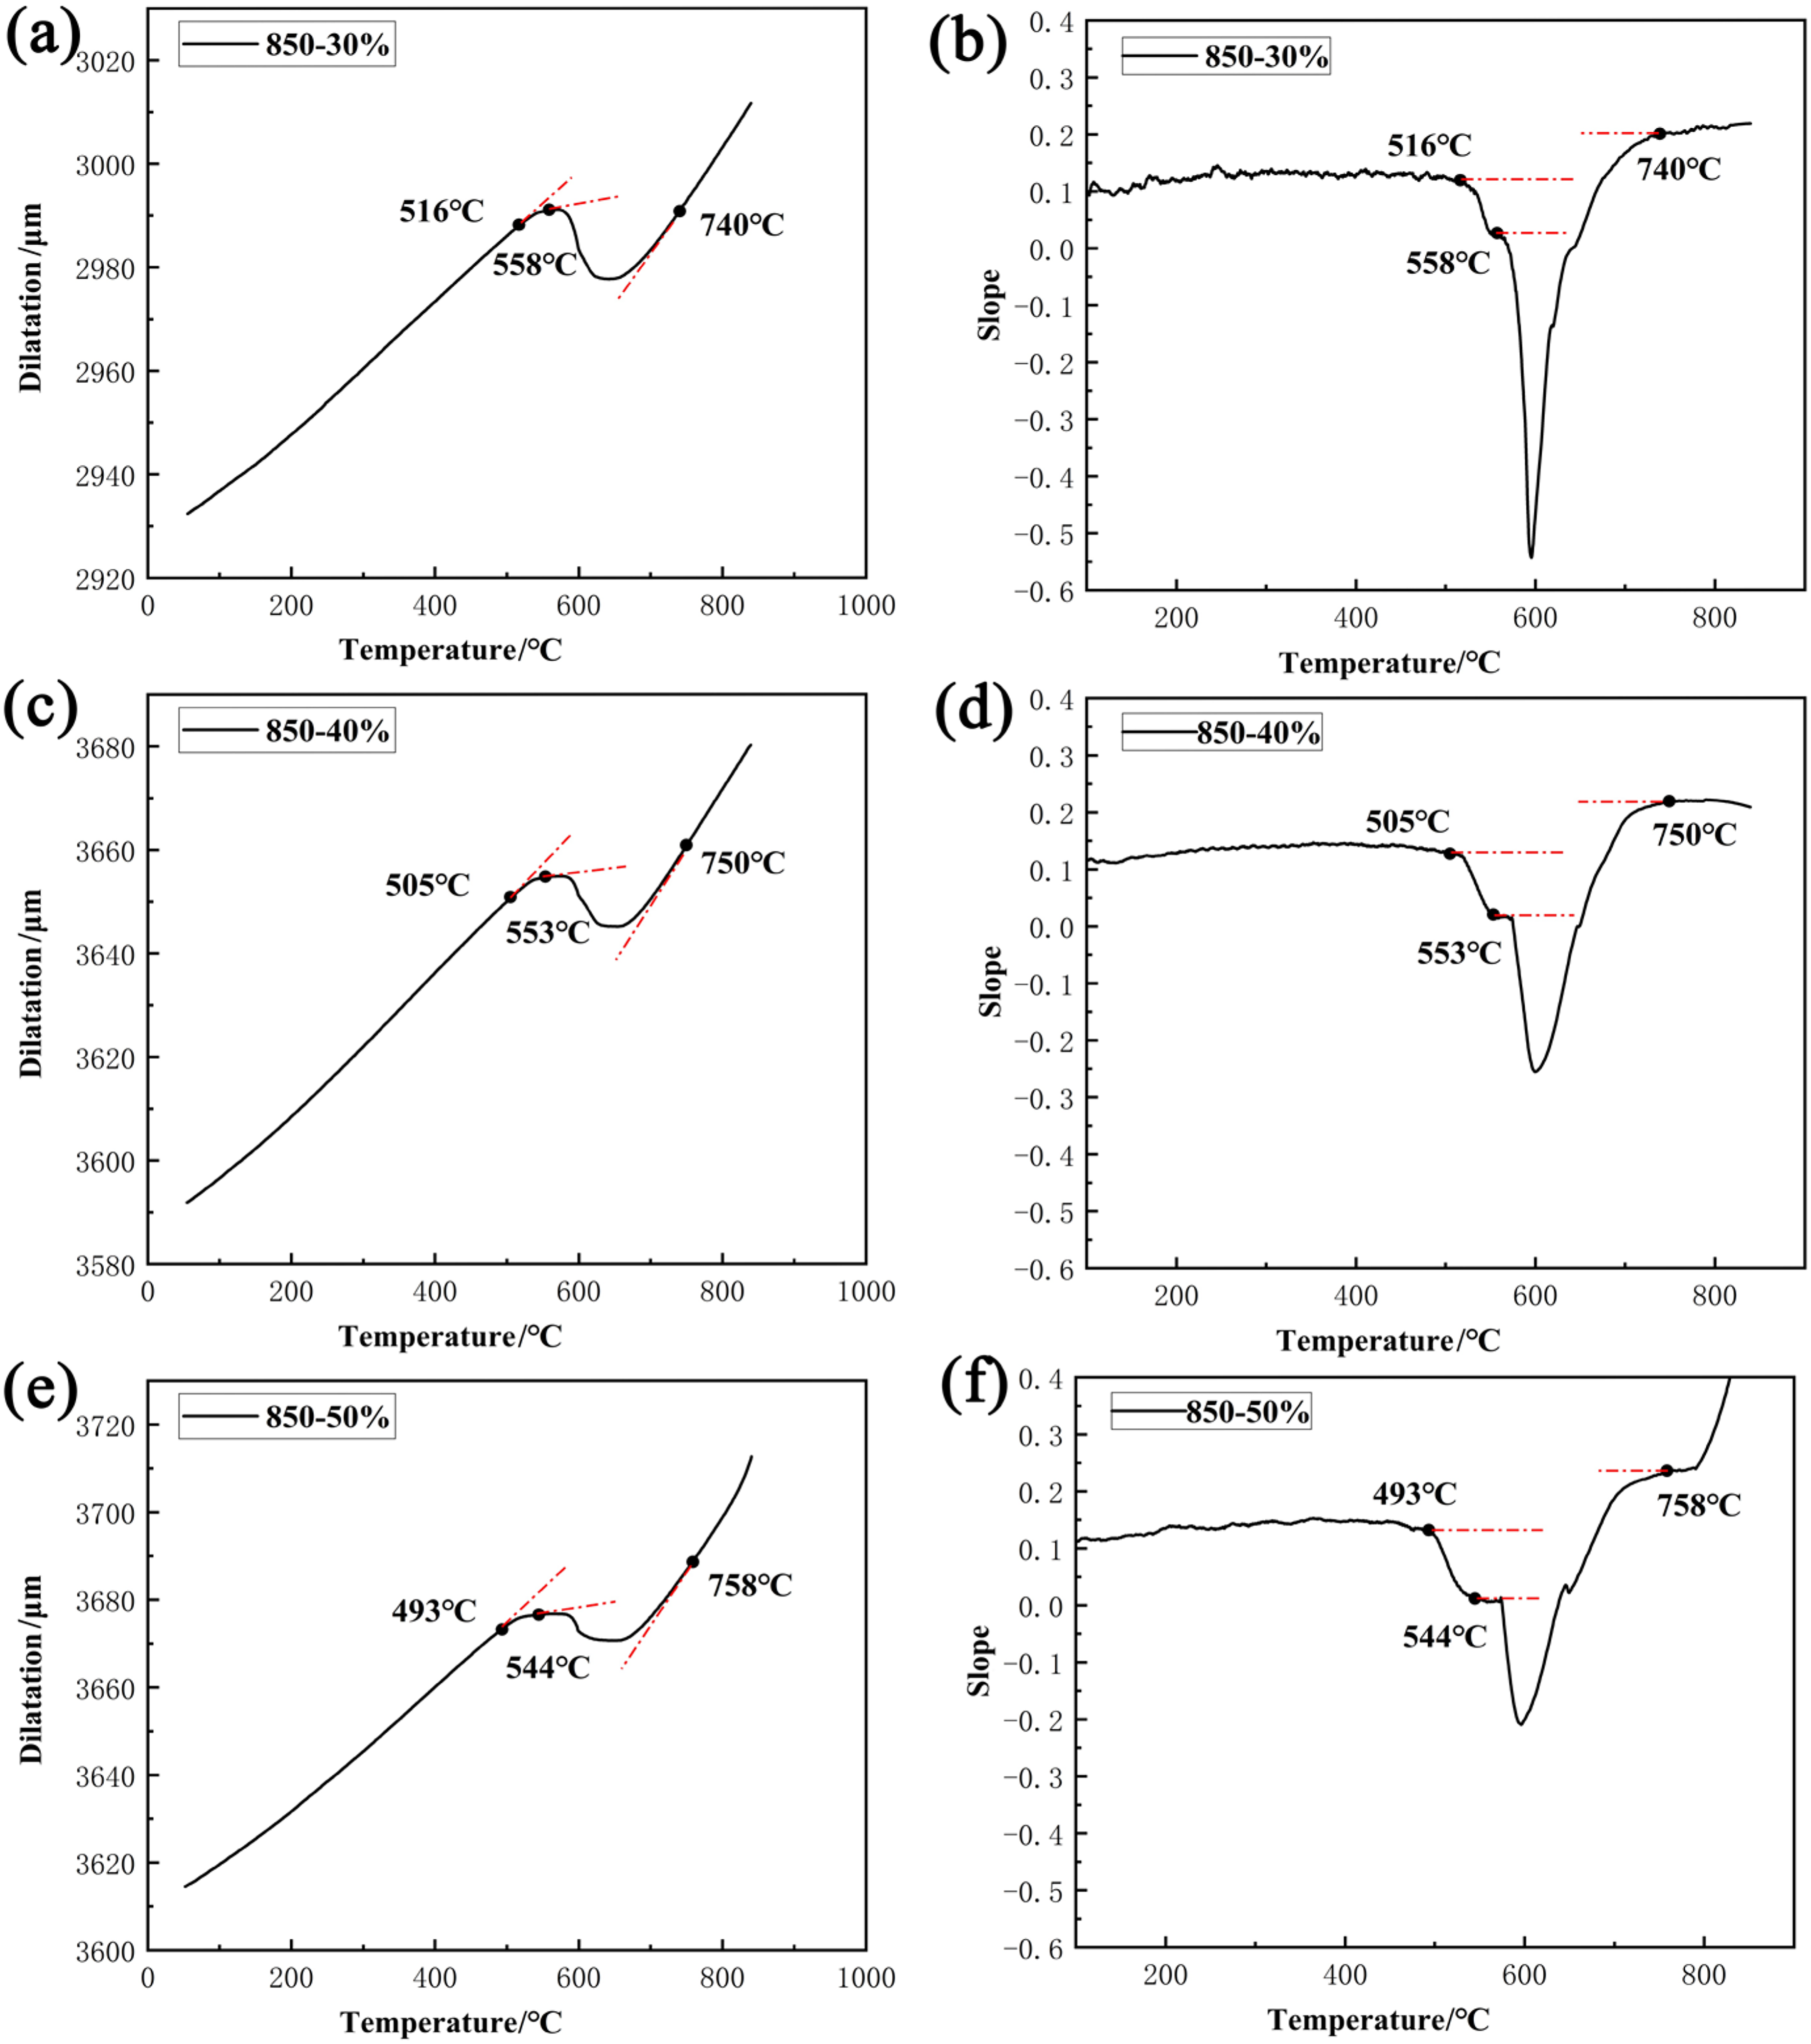
Cooling stage curves of samples with different strain amounts.
According to the lever rule, the curves of relative phase change volume fraction of 850–30% sample, 850–40% sample and 900–50% sample vs. temperature are shown in Figure 10. It is obvious that the change of phase change volume fraction follows a typical ‘S’ curve. In addition, the second (left and up) half of the ‘S’ curve moves to the left with the increase of the strain amount. According to the expansion-temperature curve of each sample (Figure 9), it can be determined that the second half of the ‘S’ curve undergoes bainite transformation. It is easier to obtain that the increase in the strain amount inhibits the bainite transformation. The first (right and down) half of the ‘S’ curve moves to the right with the increase of the strain amount. According to the expansion-temperature curve of each sample, it is explained that the lower half of the ‘S’ curve undergoes ferrite transformation. It means that the increase of the strain amount promotes the ferrite transformation. By comparing the starting temperature of ferrite transformation at different strain amounts, a larger strain amount will promote ferrite transformation. Hanlon et al. 43 studied the effect of plastic deformation of austenite on the ferrite transformation behaviour. They pointed out that the deformation caused a sharp increase in dislocation density, and the deformation energy stored in austenite increased, resulting in an increase in the driving force of transformation, which led to an increase in the starting temperature of ferrite transformation. Ferrite transformation is a typical diffusion-type transformation. Plastic deformation aggravates lattice distortion and increases dislocation density, which is conducive to the diffusion of C and Fe atoms and lattice reorganisation. 44 The larger the strain amount is, the more the internal defects of austenite grains are, the higher the free energy is, and the lower the stability of undercooled austenite is, thus the ferrite transformation is promoted. Under the combined effects of deformation and supercooling, austenite quickly transforms to ferrite, and the temperature of Ar3 increases, leading to a rapider transformation rate.45,46 On the contrary, due to the more ferrite transformation and higher mechanical stability caused by the larger deformation amount, the directional growth of bainite is hindered and the overall bainite transformation is prevented. 47 Therefore, the starting and ending temperatures of bainite transformation are decreased with the increase of strain amount.
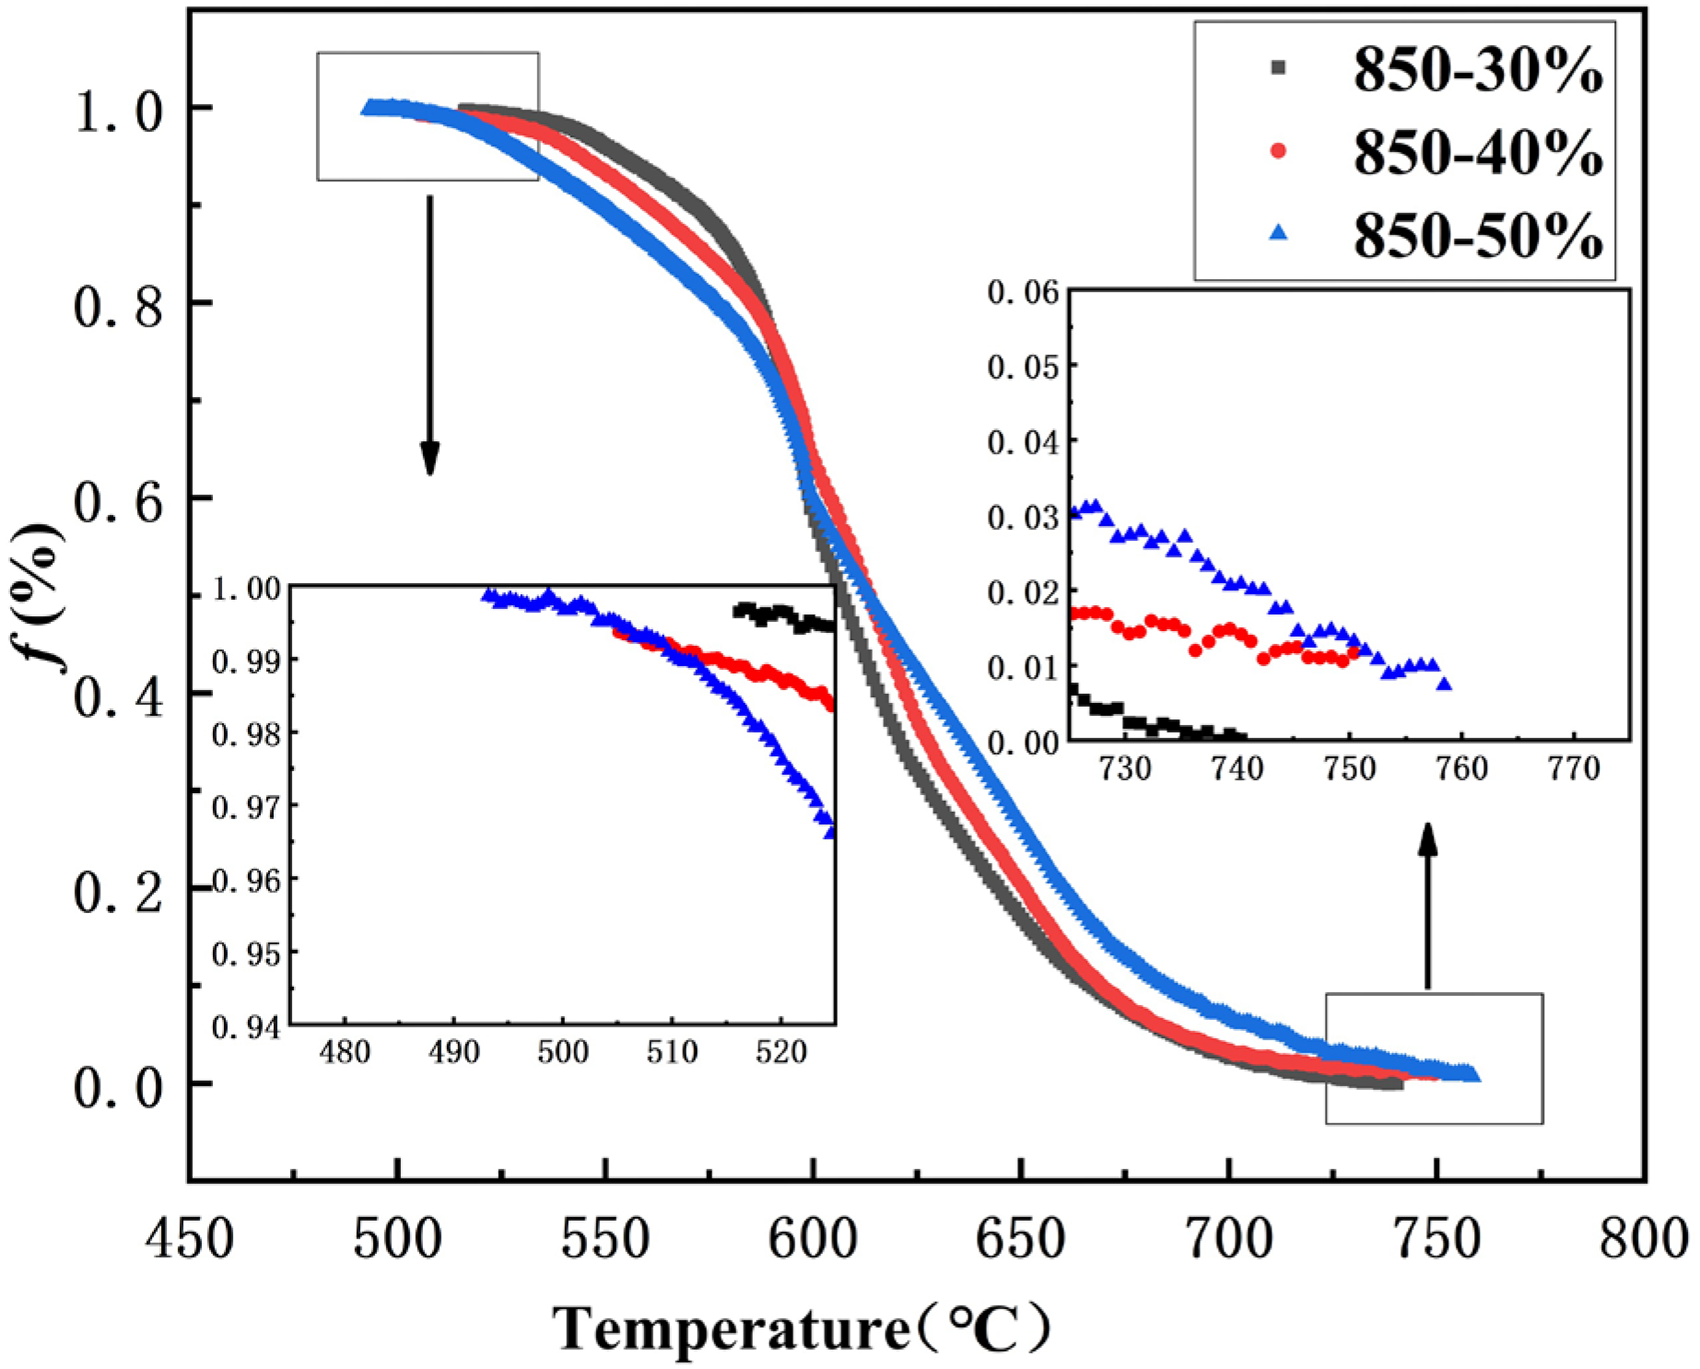
The change curves of the relative volume fraction of transformation with temperature of samples with different strain amounts.
Microstructure
The room temperature SEM and OM microstructures of samples with different strain amounts are shown in Figures 11 and 12, respectively. It can be observed that the room temperature microstructure of all samples after the thermal simulation experiment is composed of ferrite (F) and granular bainite (B). In addition, combined with the microhardness of different phases, the ferrite and bainite could be accurately determined. After measurement, the microhardness of ferrite or bainite in the three samples is basically the same. The microhardness of ferrite is about 196 ± 5 HV, while the microhardness of bainite is about 277 ± 8 HV. The volume fractions of bainite and ferrite are calculated according to the morphology and brightness of different microstructures. Figure 12(b), (d) and (f) are the statistical examples of the volume fraction of ferrite in the three samples, respectively. Five OM images of the same multiple are counted for each strain amount sample, and the reported results are averaged. The final statistical results are shown in Figure 12. It can be seen that with the increase of strain amount, the volume fraction of ferrite increases gradually from 19.1% to 31.2%, while the volume fraction of bainite decreases gradually from 80.9% to 68.8%. It was reported by Hua et al. 48 that although the cold rolling could shorten the incubation period of bainite, the width of the bainite sheaves was limited, thus inhibiting the bainite transformation. It is consistent with the present research results of microstructure and dilatation.
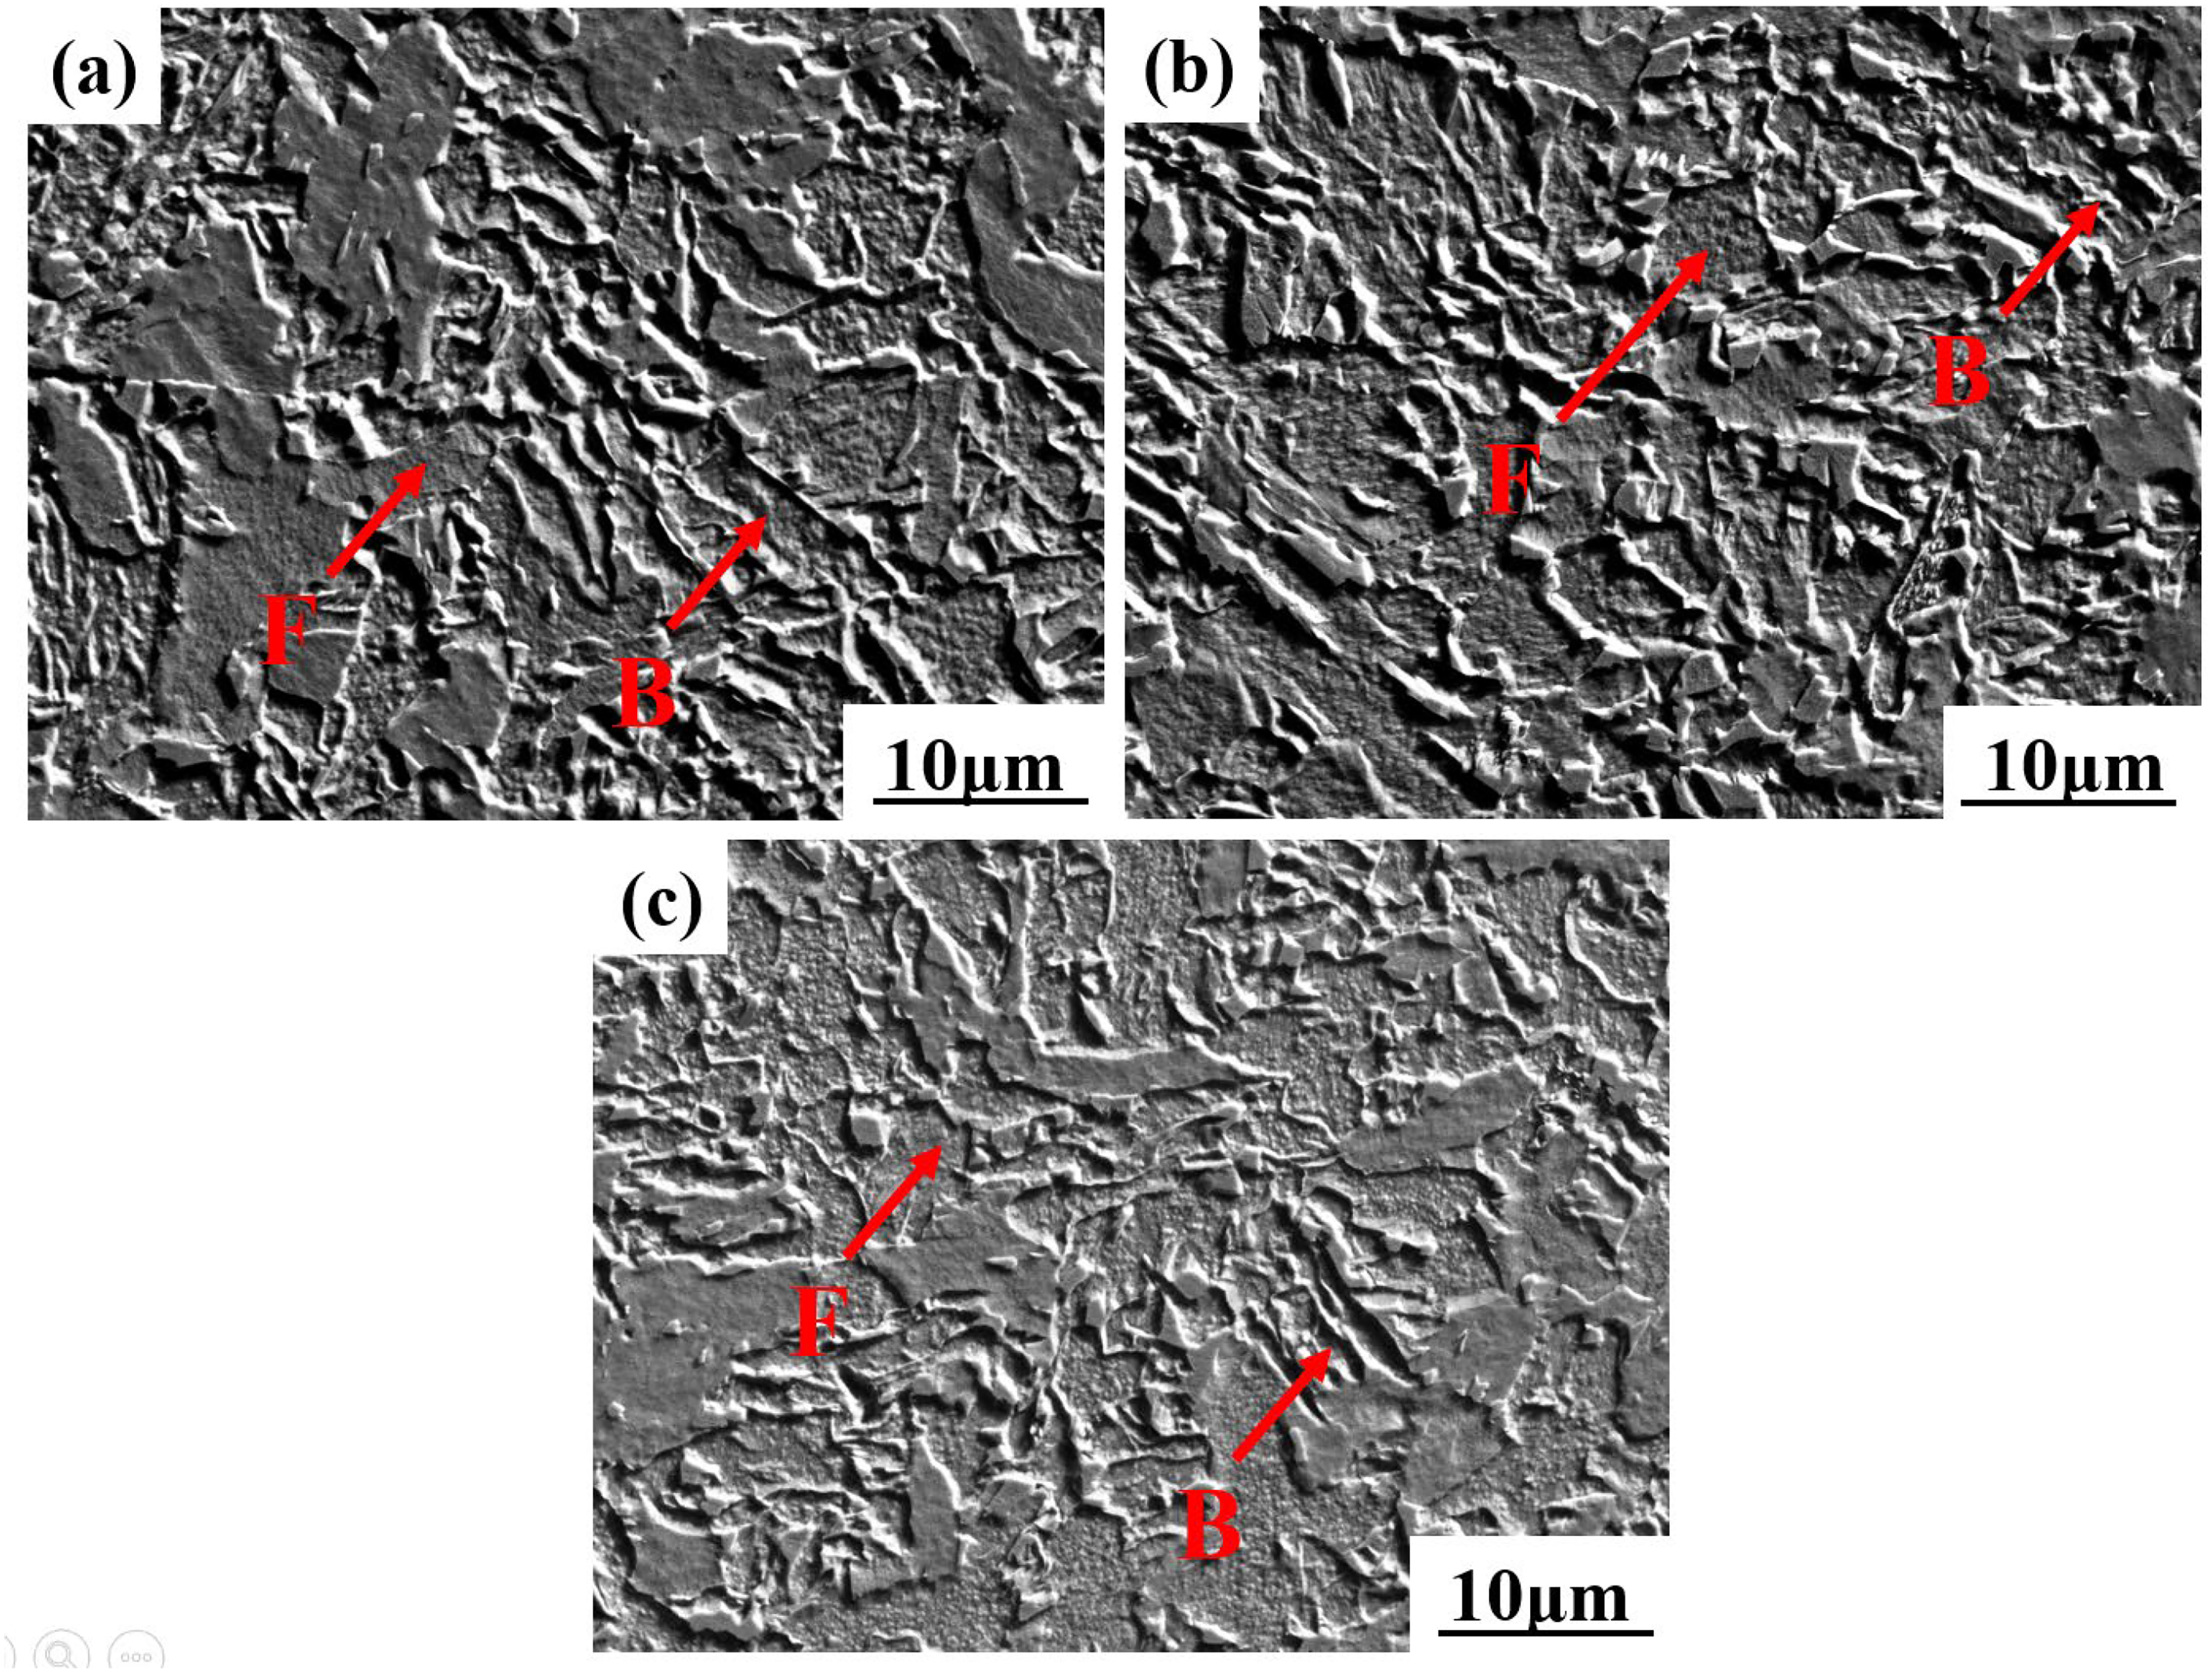
The SEM microstructure of different samples: (a) 850–30%; (b) 850–40%; (c) 850–50%.

Statistical examples of OM microstructure: (a), (c) and (e) the original micrograph; (b), (d) and (f) the blocky and bright area are coloured red ((a) and (b) the 850–30% sample; (c) and (d) the 850–40% sample, (e) and (f) the 850–50% sample. F: ferrite, B: bainite).
EBSD analysis
Taking 850–30% sample as an example, Figure 13 gives the corresponding EBSD analysis diagram. Just like Figure 7, Figure 13(a) presents the grain orientation distribution map, while Figure 13(b) shows the grain boundary distribution map. Combined with the results of 850–50% sample, it is known that the large angle grain boundary with an angle greater than 15° increases with the increase of strain amount. Figure 13(c) is the distribution map of grain size in the area shown in Figure 13(a). It can be observed that the grain size is in the range of 0∼24 μm, and the proportion of small grains in 0–12 μm reaches 93.31%. According to the calculation statistics, the average grain size of the 850–30% sample is 4.72 μm, which is larger than the 4.41 μm of the 850–50% sample (Figure 7(e)), which indicates that the increase of the strain amount can refine the grain, which is consistent with the previous analysis results. In addition, Figure 13(d) shows the corresponding kernel average misorientation (KAM) map of 850–30% sample as an example. It is known that with the reduction of deformation from 50% to 30%, the average KAM value decreases from 0.39 to 0.35. At the same time, the dislocation density of each sample could be calculated by the equation (1). It is seen that the dislocation density is proportional to the value of KAM, indicating that the larger the strain amount is, the higher the dislocation density is.
49
It is consistent with the predicted model proposed by Wang et al.
50

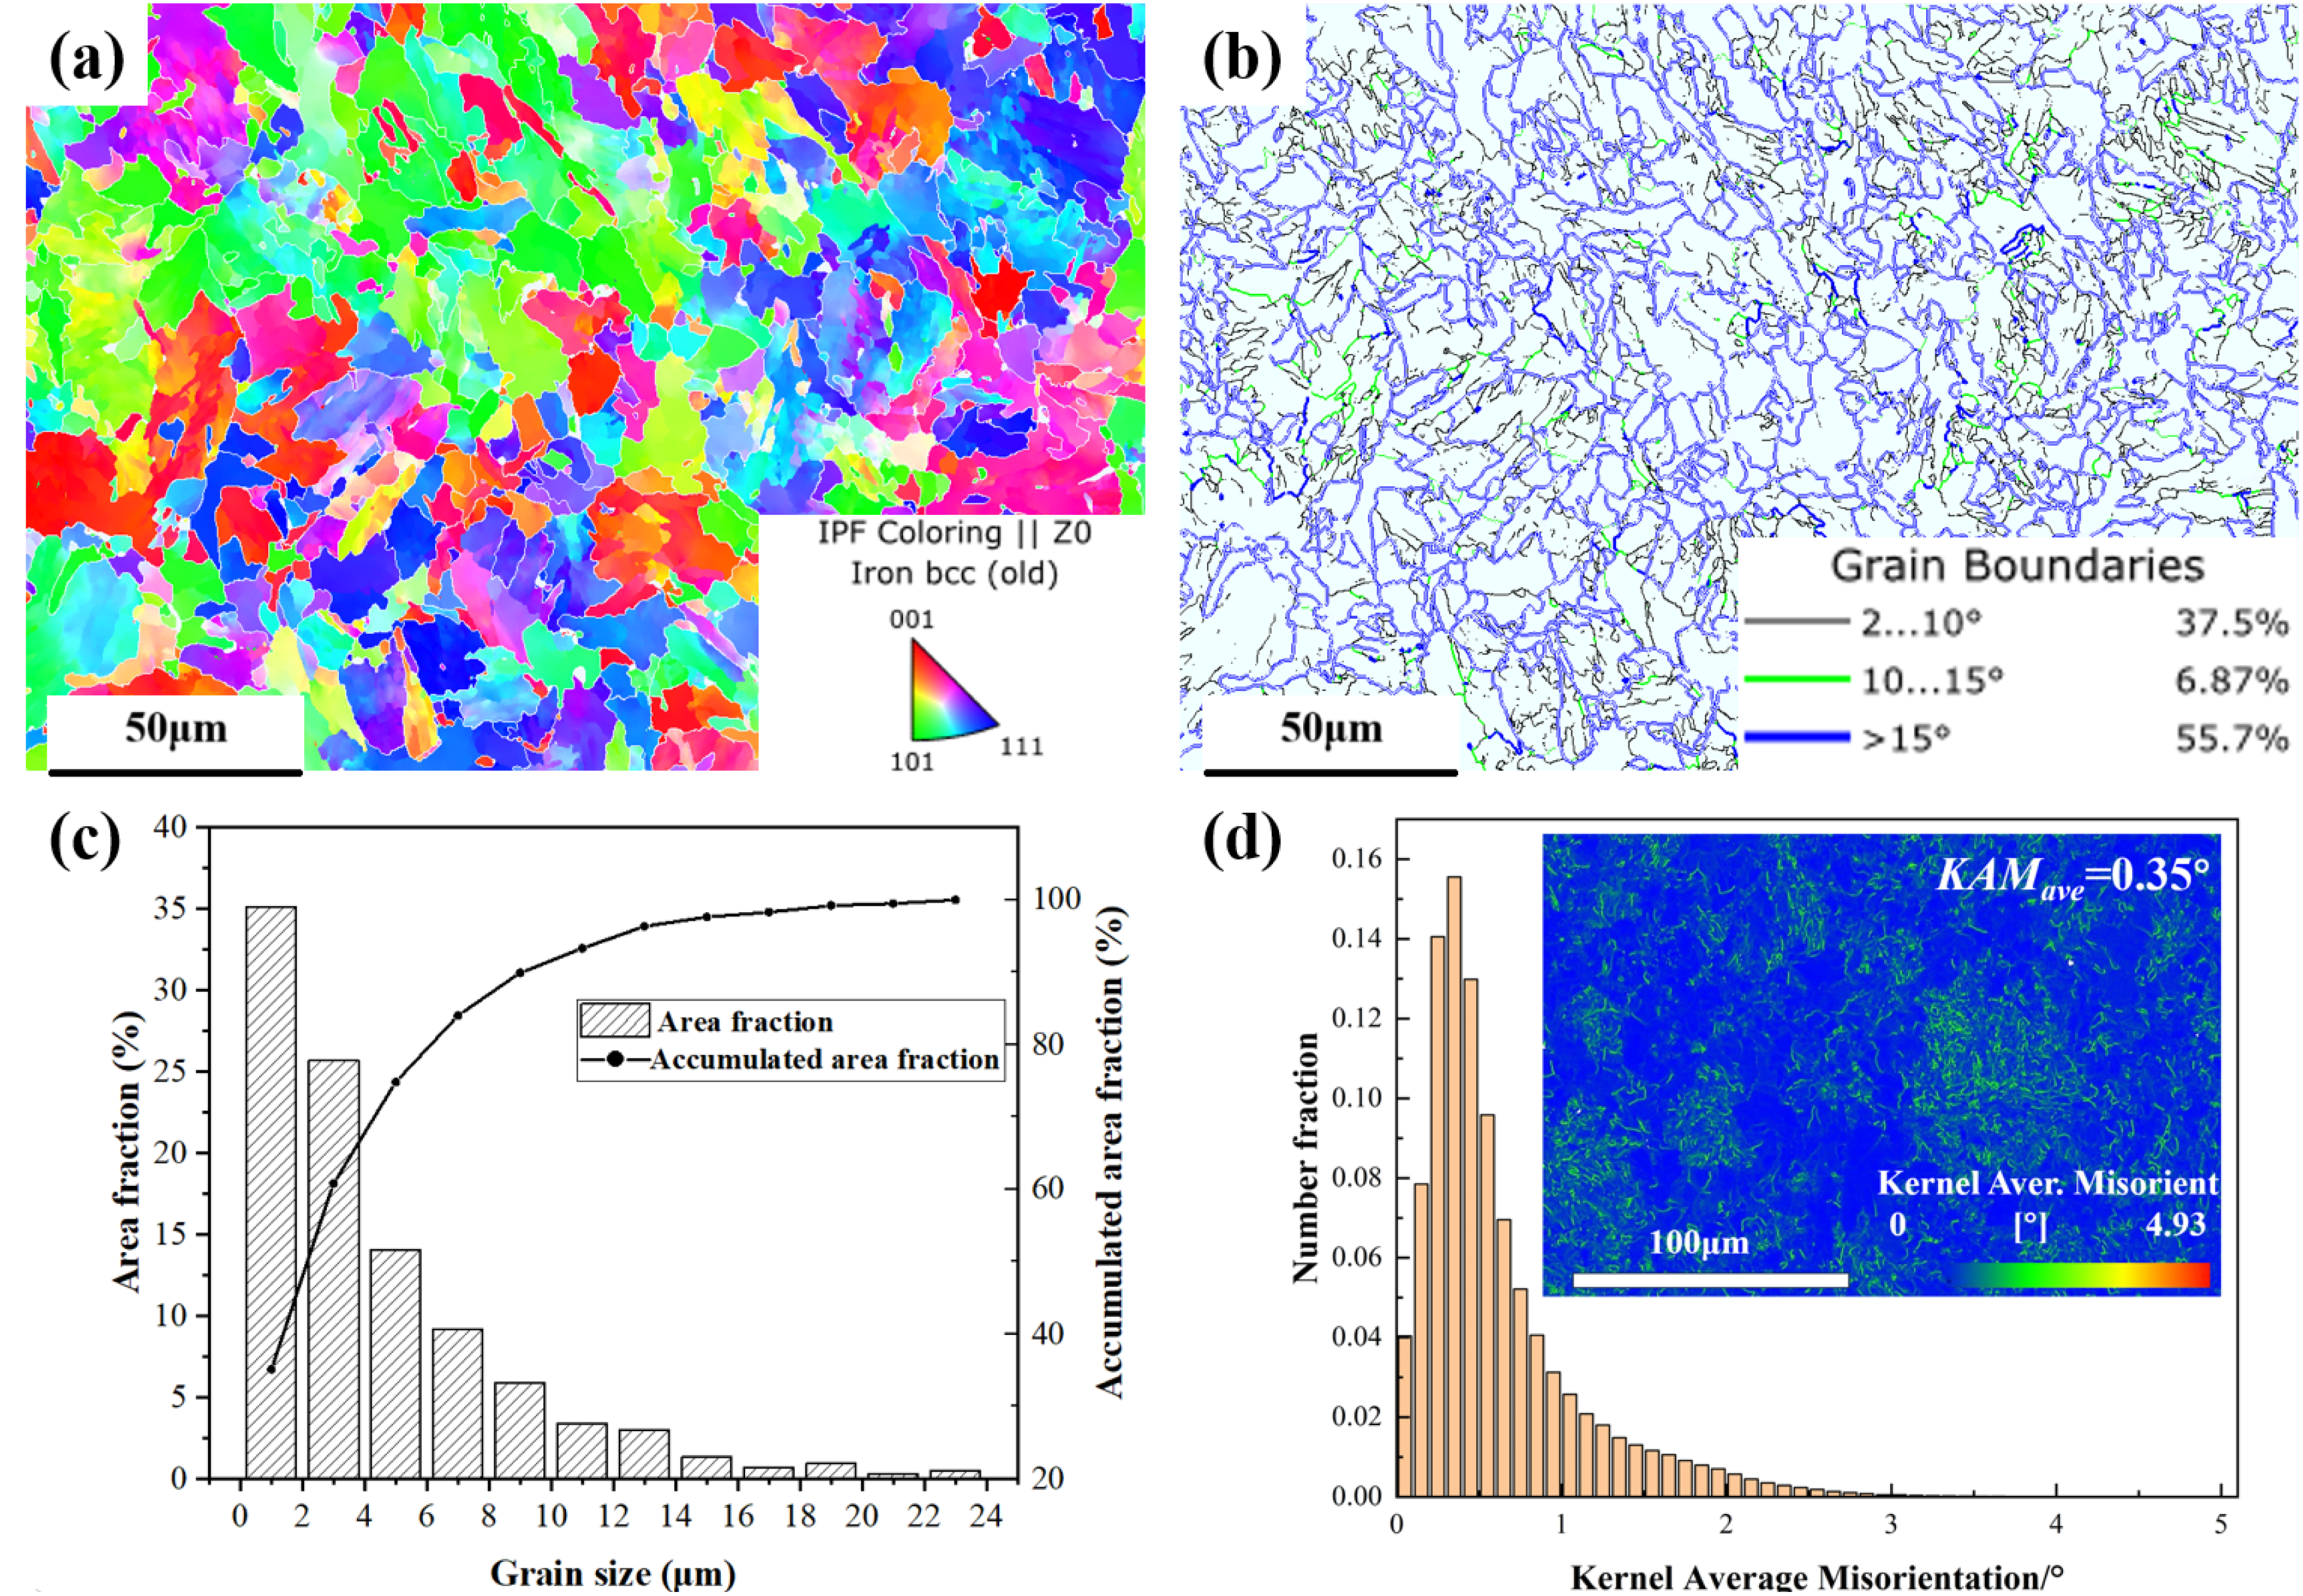
EBSD analysis of 850–30% specimens: (a) the grain orientation distribution map; (b) the grain boundary distribution map; (c) the distribution of grain size; (d) the KAM diagram.
TEM analysis
Figure 14 presents the TEM diagram and energy spectrum analysis of the precipitates of the 850–30% sample. It is noted that the amount of precipitates was measured by the software of Image-Pro Plus, which was previously mentioned in Ref.. 33 In order to accurately obtain the volume fraction of precipitates, carbon duplicate specimens for TEM were used to observe the precipitates and at least three high-resolution TEM micrographs were counted. Compared the counting results of the 850–50% (Figure 8(b)) and 850–30% samples, the amount of Nb-containing carbonitride decreases from 0.075% to 0.059% with the decrease of the strain amount. Gao et al. 51 pointed out that the increase in strain amount makes more microalloyed carbonitride precipitates nucleate near dislocations in the matrix. Similarly, Xu et al. 52 proved that with the increase of hot rolling deformation amount, the average particle size of Nb-containing precipitates observed at grain boundaries and within grains (near dislocations) was decreased, and thus the number of particles per unit area increased. 53 Gu et al. 54 found that when the strain amount increases, the (Nb, Ti)C precipitates gradually replace the precipitation of Fe2Nb, and the amount of (Nb, Ti)C precipitates increases. On the other hand, the increase of the precipitate amount results in the promoting nucleation of ferrite and refined grains. It could be attributed to the inhomogeneous nucleation caused by abnormal nucleation sites due to the presence of (Nb, Ti)C in undercooled austenite. 55 Therefore, the increase of strain amount leads to a higher volume fraction of precipitates and a more refined room temperature microstructure.
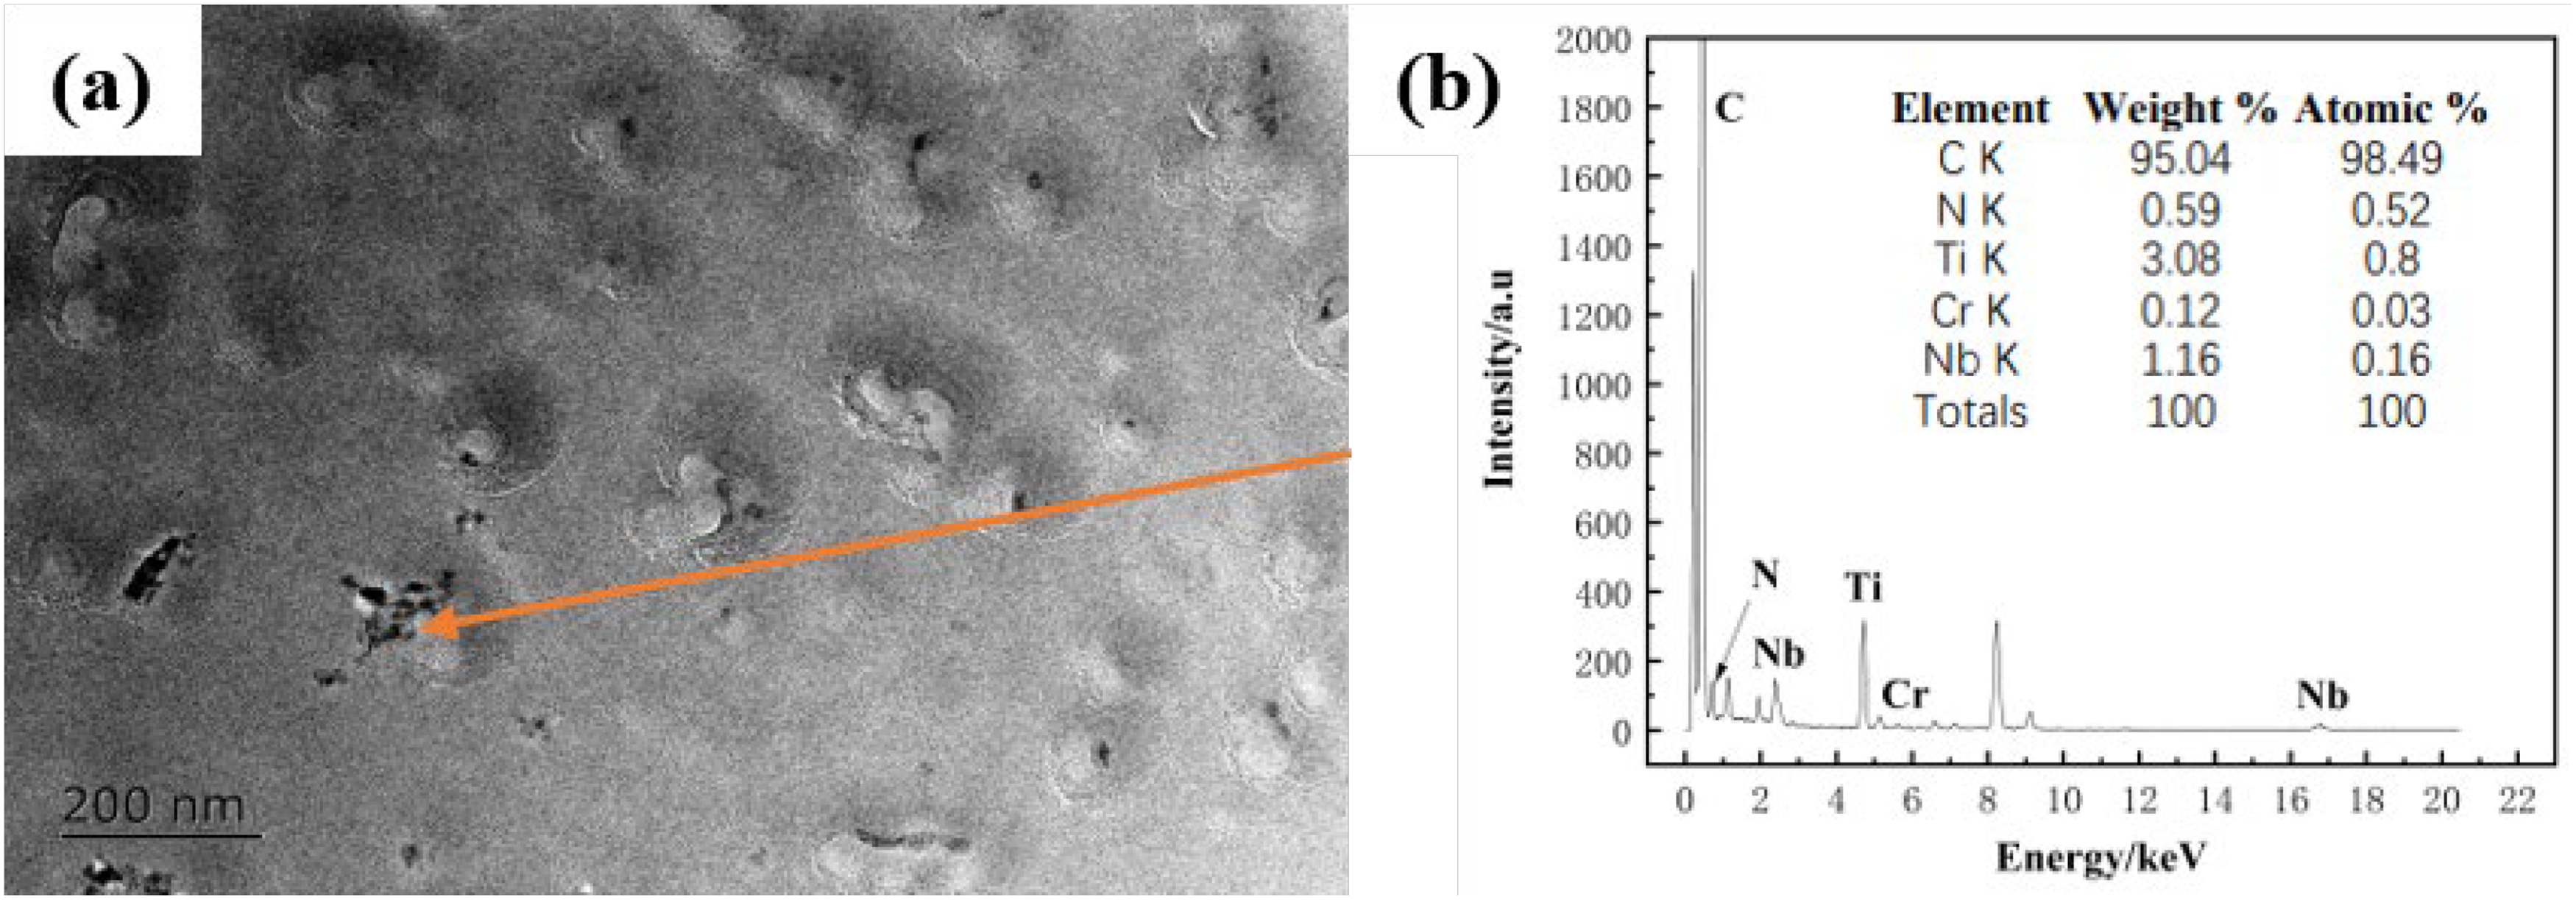
(a) TEM morphology and (b) energy spectrum analysis of precipitates in the 850–30% sample.
Conclusions
Combining the thermal simulation data and the microstructure analysis, the effect of different deformation processes on the transformation and the final microstructure was clarified. The following conclusions were obtained:
When the deformation temperature decreased from 900 °C to 850 °C, although the microstructure of both samples at room temperature was ferrite and granular bainite, the ferrite content increased from 28.2% to 31.2% and the content of high-angle grain boundaries increased from 56.3% to 61.3%. The initial temperature of ferrite transformation was increased from 751 °C to 758 °C and the bainite starting transformation temperature was decreased from 558 °C to 544 °C as the deformation temperature decreased. When the deformation amount was increased at the deformation temperature of 850 °C, the ferrite content was increased from 19.1% to 31.2% and the average grain size was decreased from 4.72 μm to 4.41 μm due to the presence of more precipitates. It indicates that the ferrite transformation was promoted and the grain size could be refined by increasing the deformation amount.
Footnotes
Declaration of conflicting interests
The authors declared no potential conflicts of interest with respect to the research, authorship, and/or publication of this article.
Funding
The authors disclosed receipt of the following financial support for the research, authorship, and/or publication of this article: This work was supported by the National Natural Science Foundation of China (grant number 52104381).