
Abstract
This study experimentally and statistically investigated the effects of machining parameters on surface roughness and upper and lower kerf widths during the laser cutting of AISI 304 stainless steel. The experimental design was based on the L18 orthogonal array of the Taguchi technique. Laser cutting parameters included focal point (−4 mm and 4 mm), gas pressure (5, 10, and 15 bar), and cutting speed (5000, 7500, and 10,000 mm/min). The results showed that cutting speed and gas pressure reduced surface roughness up to a critical threshold. Additionally, increasing cutting speed decreased kerf widths, while higher gas pressure led to increased upper and lower kerf widths. Statistical analysis identified cutting speed as the most influential parameter for surface roughness (56.05%), upper kerf width (35.33%), and lower kerf width (66.33%). Finally, the Taguchi-based Grey relational analysis determined the optimal machining parameters as A2B1C3.
Introduction
LASER, which means light amplification by stimulated emission of radiation, simply means concentrated light. 1 Lasers are used in a wide variety of scientific and technical applications, including material cutting, geology, metrology, computing, image processing, information storage, and clinical medicine. 2 Laser parameters include beam wavelength, maximum laser power output, laser beam quality, properties and thickness of the material to be cut. Cutting parameters include laser power, cutting speed, lens focal length, focal point tracking on the top surface of the material to be cut, assist gas type and pressure, nozzle diameter and distance setting of the nozzle to the top surface of the workpiece. Parameters are changed depending on the material type and thickness. 3
The laser cutting technique has many benefits, including low cost, system flexibility, no tool wear, vibration, and the ability to quickly and precisely cut sheet materials into complex forms.4–7 Since the laser cutting method is contactless, no cutting force or tool wear is. 8 Laser cutting is performed by melting and evaporating the workpiece with the help of the laser's thermal energy. The removal of molten material from the cutting gap of the workpiece is achieved with high gas pressure (Figure 1).9,10
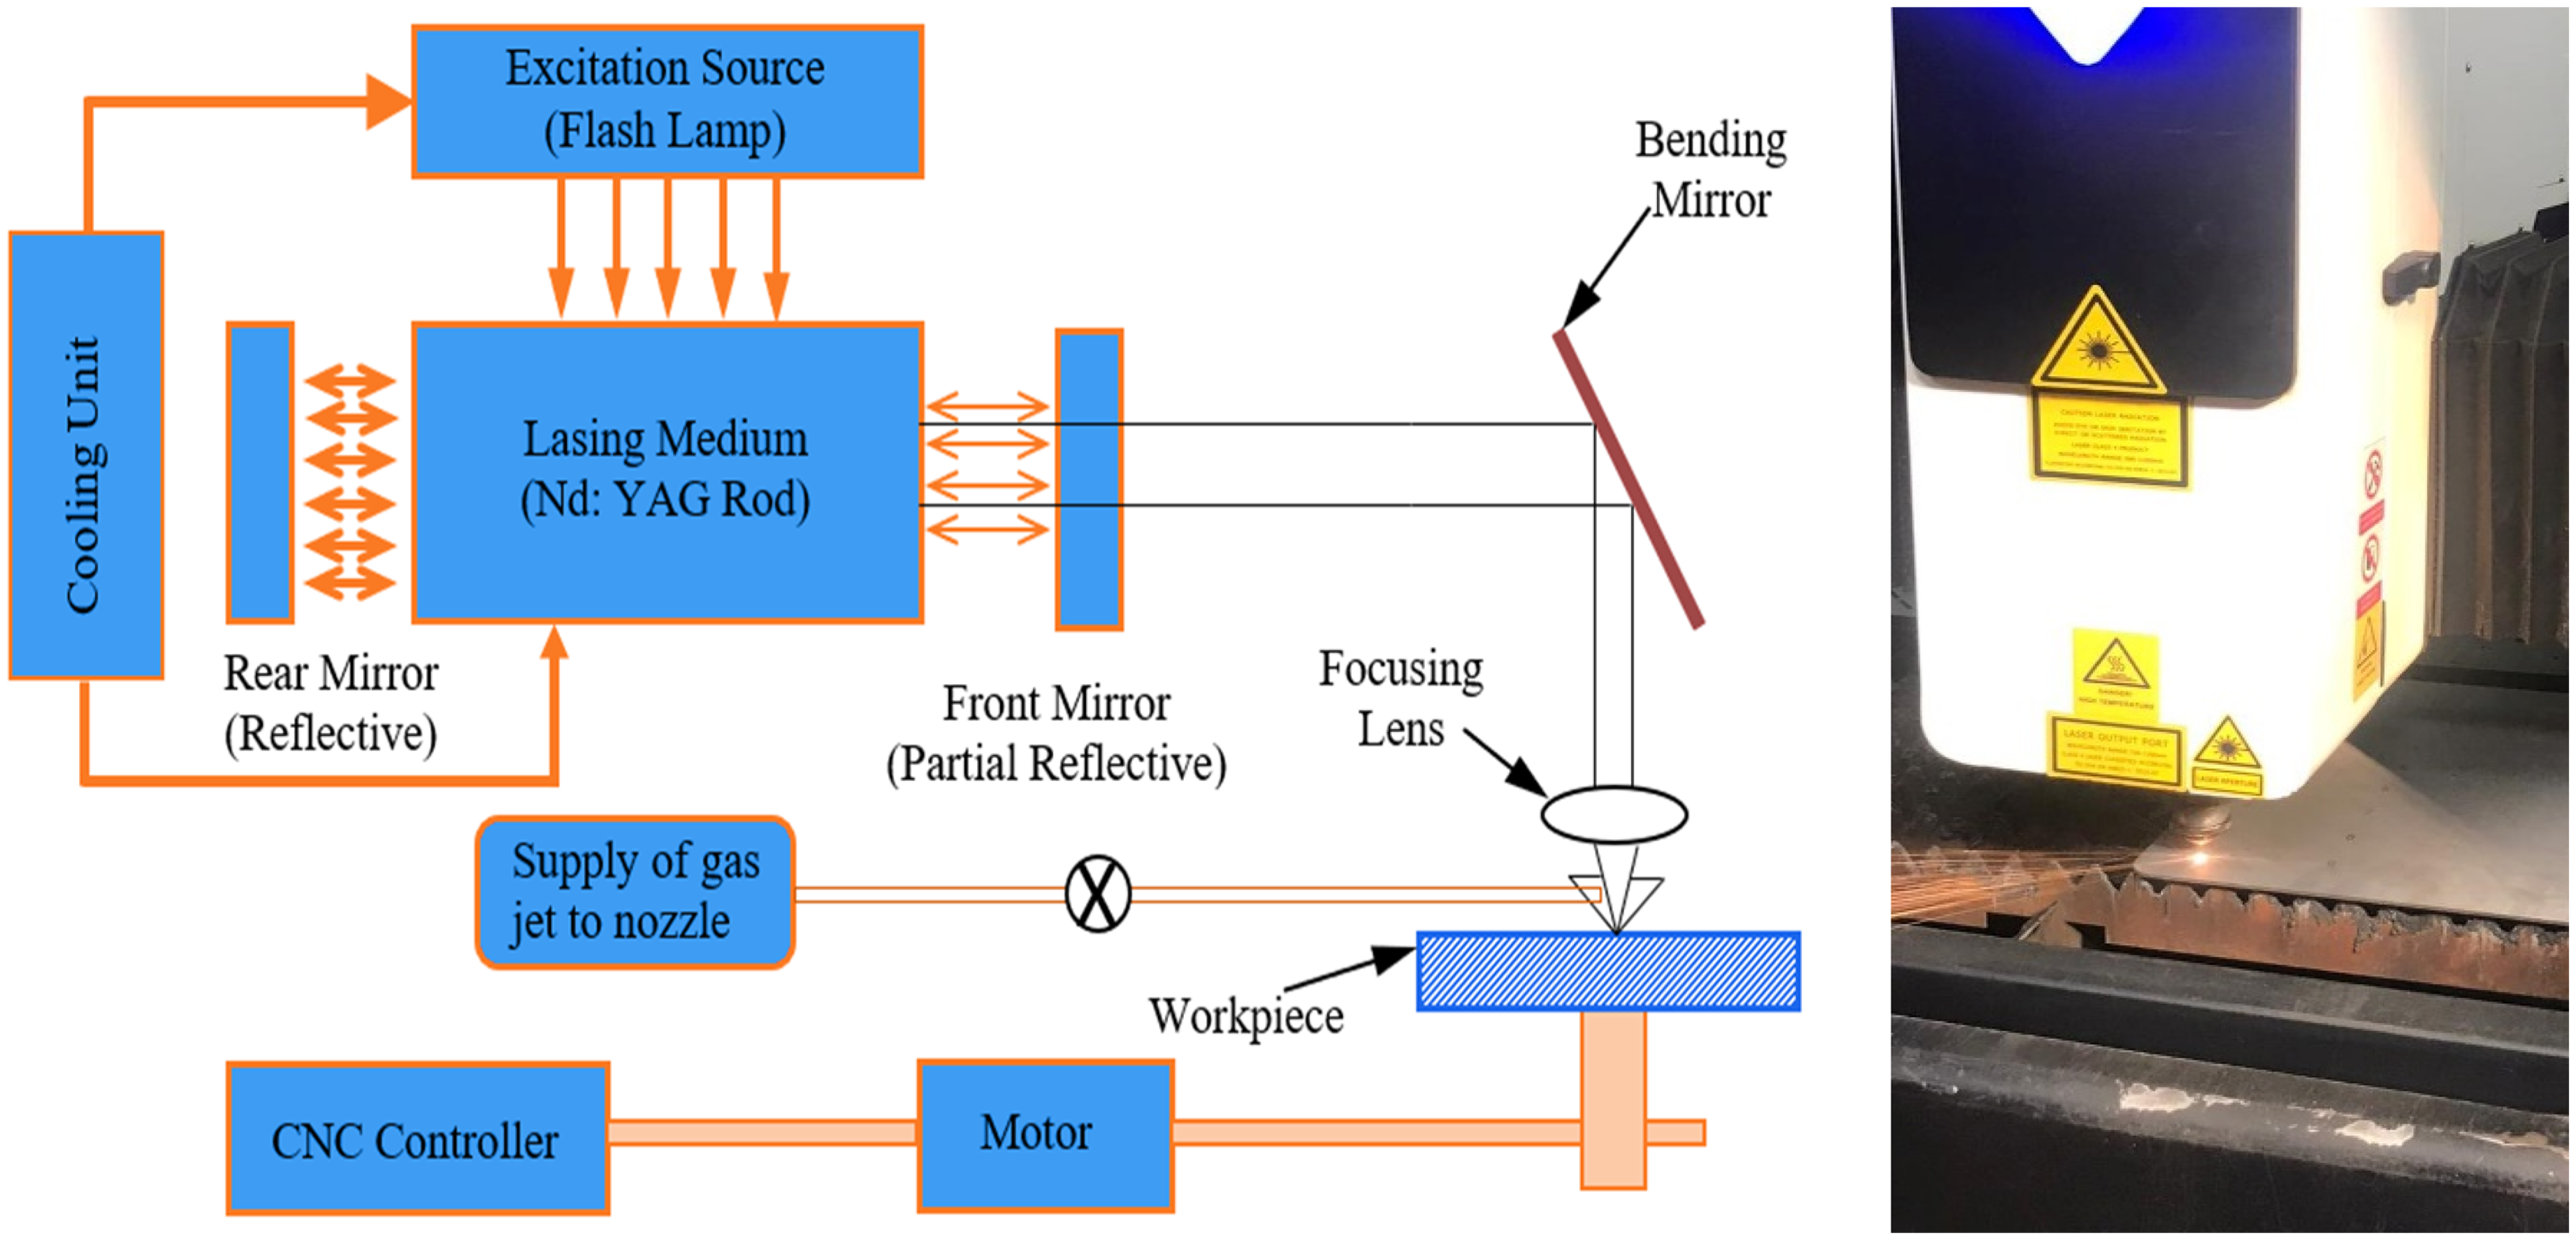
Laser beam cutting system schematic.
While oxygen is generally used in laser metal-cutting processes in the industry, argon or helium gas is preferred for cutting materials such as wood or plastic. The use of oxygen gas in the cuts removes the molten material. It increases the available energy to increase the cutting speed by producing an exothermic reaction in the cutting zones.9,11 As with other machining and chipless manufacturing techniques, picking the best processing parameters is crucial for laser cutting. These characteristics impact output metrics during machining, including kerf transitivity, surface roughness, and heat-affected zone. This is why the literature summarises several earlier experiments to enhance the effectiveness of laser cutting operations and the calibre of output characteristics. Pramanik et al. cut 1-mm thick AISI 316 L stainless steel in different parameters with a 50-watt low-power fibre laser. The obtained results used central compound design and response surface methodology (RSM) methodologies to explore the impact of machining settings on the kerf cone. 12 The experiments were verified with the models used and stated that the kerf taper could be optimised by determining the optimum cutting parameters. Li performed the duplex stainless steel cutting process using the fibre laser cutting method in his study. Process variables like cutting speed, focal length, and laser power were employed as machining parameters. Kerf width, cutting temperature and surface roughness values were obtained as output parameters and the results were analyzed experimentally and statistically (RSM). The study's findings showed that an increase in laser power had a noticeable impact on the kerf width, cutting temperature, and a 45% reduction in the value of surface roughness. 13 Jadhav and Kumar cut 20-mm thick AISI 304 stainless steel using laser cutting. The impacts of process variables on the surface roughness were examined in the studies, which used variables including laser power, cutting speed, and gas pressure. The study's findings showed that while the surface roughness value of the cut surface grew with increasing cutting speed, it reduced with increasing laser power and gas pressure. 1 To cut 3-mm thick SS-304 stainless sheet material with the fibre laser cutting technology, Kotadiya et al. concentrated on the parametric analysis of the cutting parameters for the best surface roughness value and the smallest kerf width. The experiments selected the cutting parameters of laser power, cutting speed, and gas pressure. The study discovered that laser power is the most efficient parameter for perfect surface roughness and the smallest kerf width. 14 To cut AISI 304 stainless steel that is 10-mm thick using a fibre laser, Wandera and Kujanpää examined the effects of the cutting parameters on the kerf width, surface roughness, and burr height. The study showed that cutting at lower speeds generated burr-free edges and improved the product's surface roughness value. 15 Laser cutting parameters of AlMg3 aluminium alloy, St37–2 low carbon steel, and AISI 304 stainless steel with various thicknesses were the subject of Genna et al.'s research. 4 When laser cutting medium carbon steel that was 2-mm thick, Yılbaş 16 looked at how different cutting parameters affected the kerf size. Ozlü 17 used experimental and statistical methods to examine the influence of parameters for cutting on kerf quality and roughness of the surface in the laser-cutting of Al 5083 alloy with various parameters. Anike and friends cut AISI 304 stainless steel material with a laser cutting method at different processing parameters and examined the surface roughness values of the cut surfaces. Cutting speed, gas pressure, and laser power were measured as cutting parameters. The study found that the two most significant factors influencing the surface roughness rating were gas pressure and laser power. As laser power and gas pressure increased, the surface roughness value rose as well. 1 In their study, Durukan and his colleagues performed laser cutting of AISI 304 stainless steel in different shapes and processing parameters. They used statistical and experimental methods to investigate how processing parameters affected dimensional accuracy. The study's findings indicate that laser power, cutting feed, and focal point are the most efficient processing parameters for the components’ dimensional correctness. 18 In his study, Yüce examined the effects of processing parameters (laser power, cutting speed and focal distance) on the surface roughness and kerf width of the cut surfaces in laser cutting of AISI 304-quality stainless steel material. The study's findings indicated that the focal distance has the greatest influence on surface roughness and kerf width, whereas feed speed has little impact. 19 Cebeci et al.'s study examined how processing parameters affected burr height, kerf breadth, and surface roughness when laser cutting stainless steel of AISI 304 quality. As a result of the study, it was observed that as the pulse frequency value increased, the surface roughness and burr height decreased and the kerf width increased. 20 Rao et al. tried to estimate the surface roughness, notch width and metal removal rate using the vibration signals measured while cutting AISI 304 stainless steel material using laser cutting. The experimental design of their study was created according to the Taguchi L9 experimental design. Laser cutting parameters were determined as laser power, frequency, and cutting speed. The study found that sheet vibration along the cutting direction accelerated the metal removal rate. In contrast, sheet vibration perpendicular to the cutting direction caused surface roughness. 21 Türkkan and his colleagues cut AISI 304L stainless steel using laser cutting. The study's experimental design was created using the optimisation method, and the cutting parameters used in the experiments were selected, such as cutting speed, focus position, frequency, and duty cycle. As a result of the study, it was determined that the parameters that most affected surface roughness and kerf width were duty cycle and frequency. 22
Industrial businesses use laser cutting techniques that demand high accuracy, precision, and low cost. Thus, selecting the best parameters that determine cut quality is crucial. When literature studies are examined, experimental and statistical studies have been carried out on the effects of processing parameters such as surface quality and kerf width of the processed material. In the statistical studies carried out, models were created for the most ideal processing. Experiments performed with the selected processing parameters according to the Taguchi full-factor method are analyzed and the model (S/N) that gives the best processing parameters is obtained. It is requested to repeat the experiments with the created model. Since the experiments are performed according to the full factorial method, repetition of the experiment is prevented and material consumption, processing cost and loss of time are prevented. 23
This study examined cutting speed, gas pressure, and focus point impacts to determine how these factors affect the cut quality (surface roughness, upper kerf width, and lower kerf width) when laser cutting AISI 304 stainless steel. The results obtained were analyzed statistically according to Taguchi and Grey Taguchi methods. Taguchi's analysis it aimed to determine the ideal processing parameters for each output parameter, and the grey relation analysis aimed to determine the ideal processing parameter that each output parameter will create together. It aimed to efficiently use time, cost and energy by determining the ideal processing parameters to guide subsequent studies with the same material.
Experimental method
Workpiece material
Steel alloy AISI 304, used in many industries such as chemistry, petrochemistry, household appliances, industrial kitchens, the automotive supply industry, and the food industry, was used as the workpiece material in laser cutting tests. The materials were supplied with a thickness of 4 mm and dimensions of 400 × 450 mm. The laser cutting plan of the plate used in the experimental study was designed as in Figure 2. The rectangular shapes shown in red are planned for surface roughness values, and the straight lines shown in blue are planned for upper and lower kerf width measurements. Numbering was performed on the plate to prevent the cut parts from being mixed up.
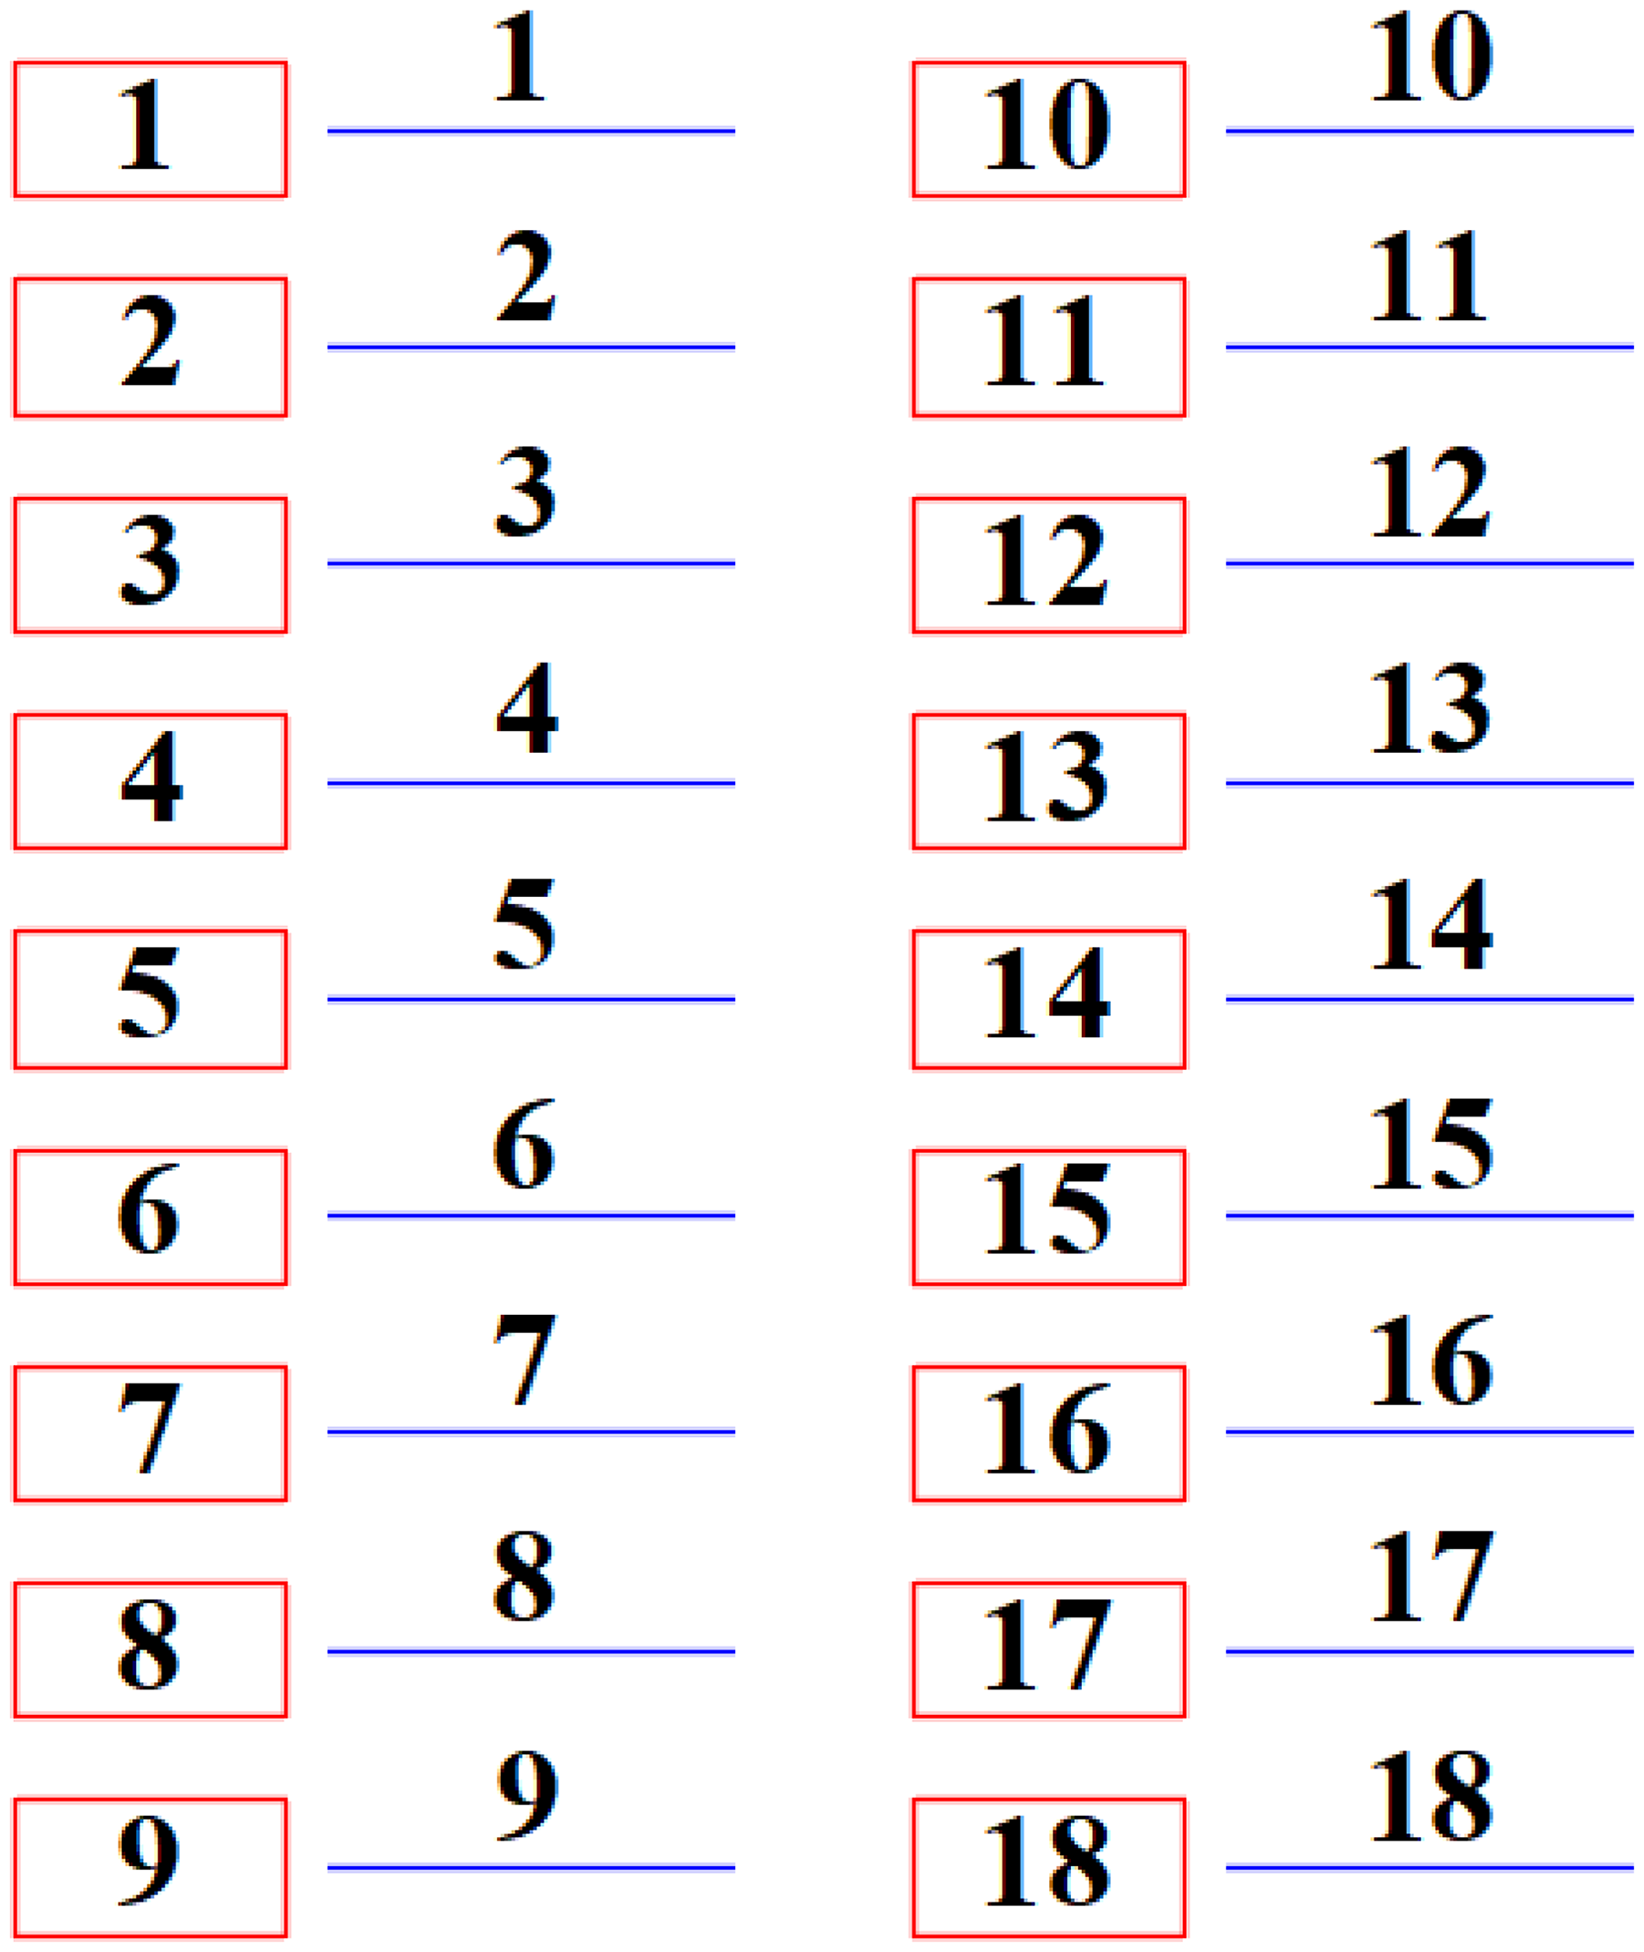
Laser cutting plan.
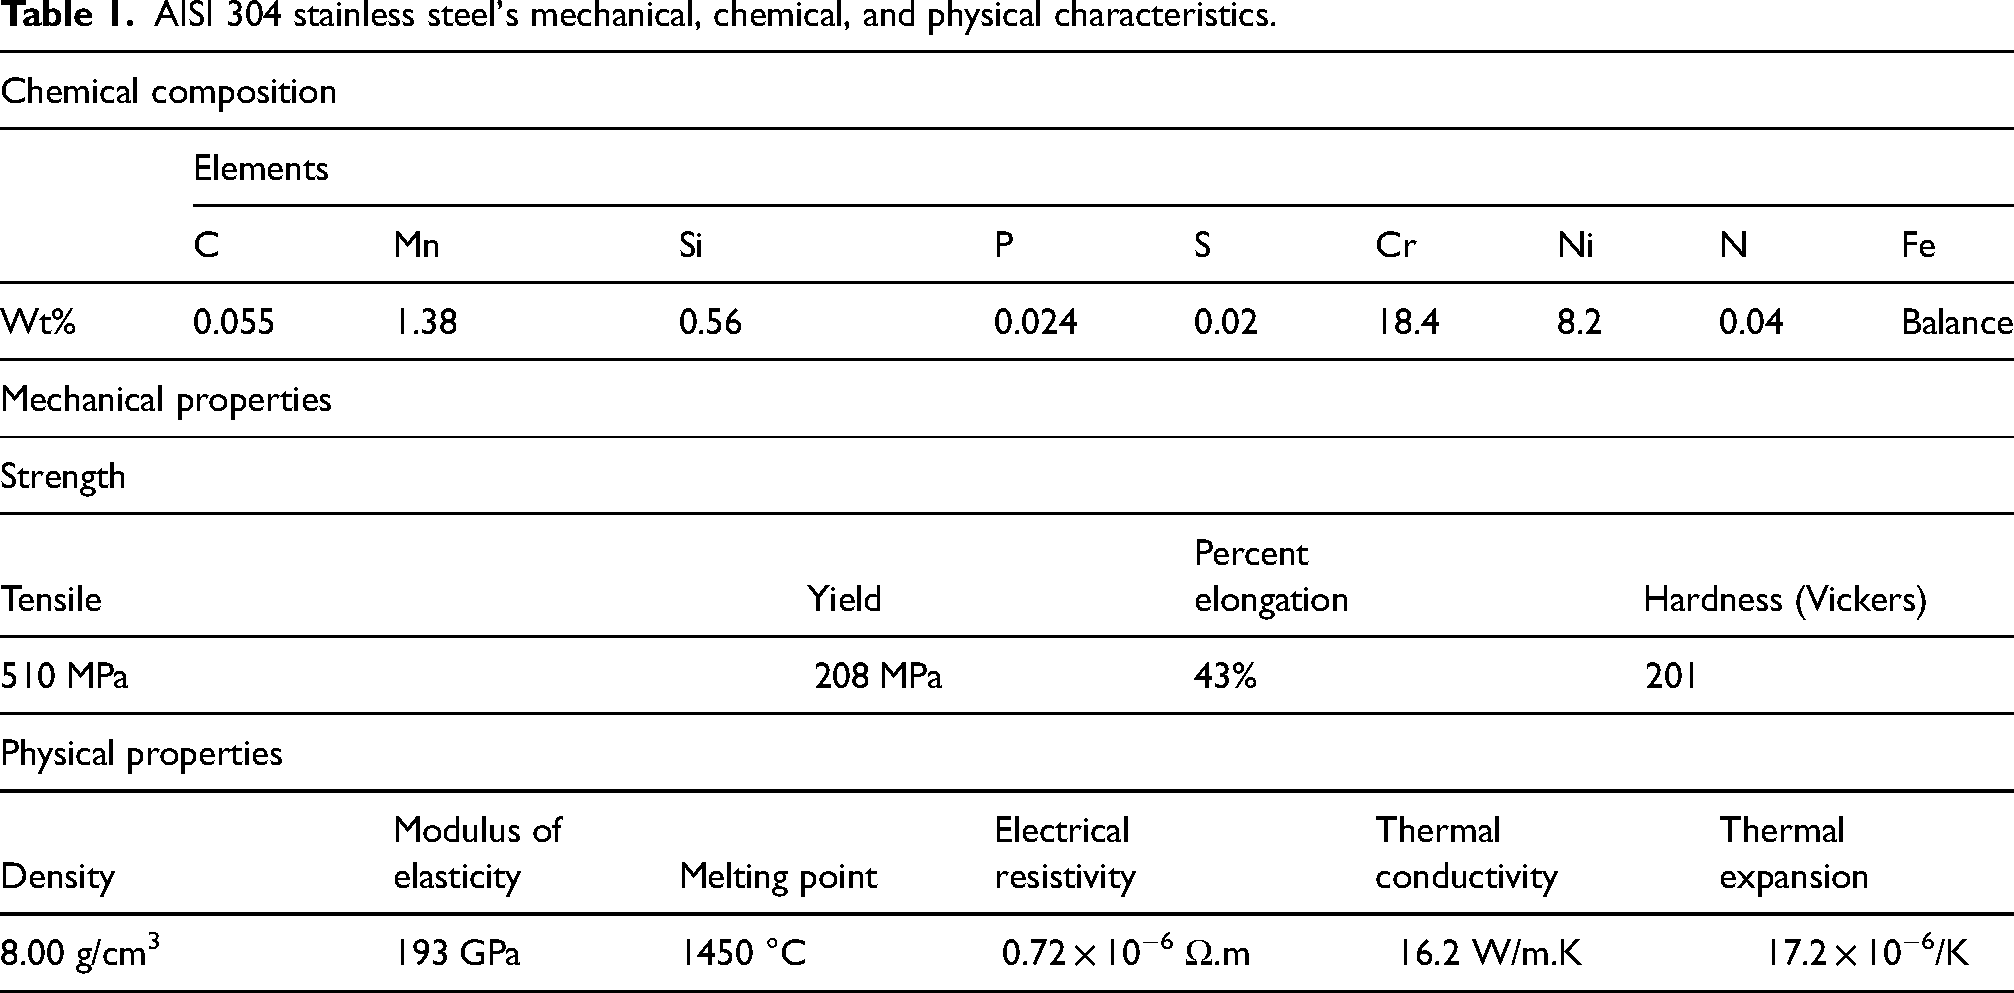
Table 1 lists the chemical structure and mechanical characteristics of AISI 304 stainless steel.
AISI 304 stainless steel's mechanical, chemical, and physical characteristics.
Experimental parameters
Literature research and preliminary experiments are required to see the effects of process parameters in determining the cutting surface quality and kerf widths in different material types. By examining the preliminary experiments and the results obtained from the literature afterward, it was seen that the process parameters that have the most effect on cutting quality and kerf widths are focal point (FP-mm), gas pressure (GP-Bar), and cutting speed (CS-m/min). Therefore, process parameters were determined based on literature and preliminary experiments. The parameters and levels determined are given in Table 2. Taguchi L18 (21×32) experimental design was used to determine the cutting parameters and levels.
Laser cutting parameters and levels for Taguchi's L18.
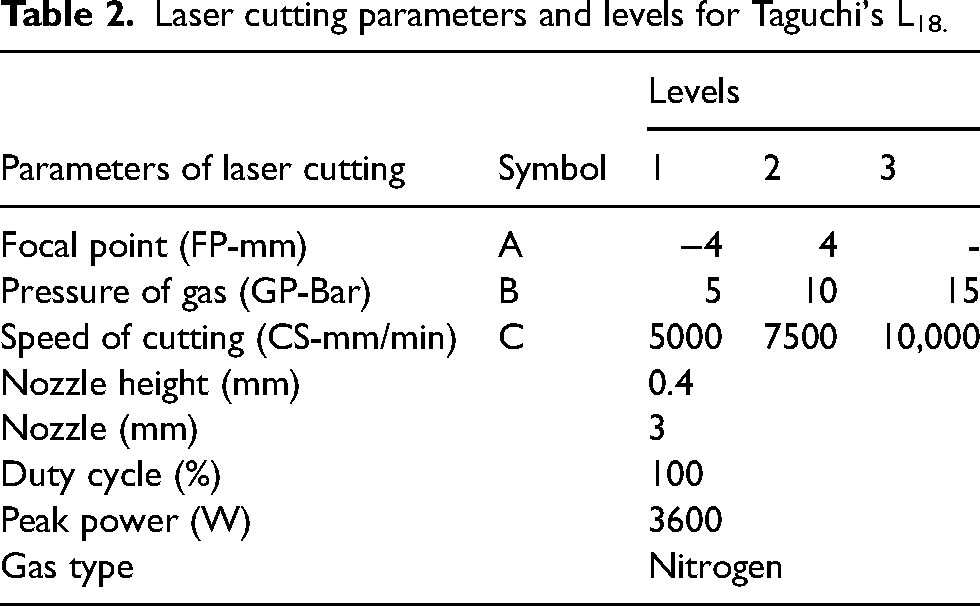
It is known that the focal point setting impacts the formation of kerf widths. The effects of these selected focal point parameters on the upper and lower kerf widths will be examined.
Machining tests
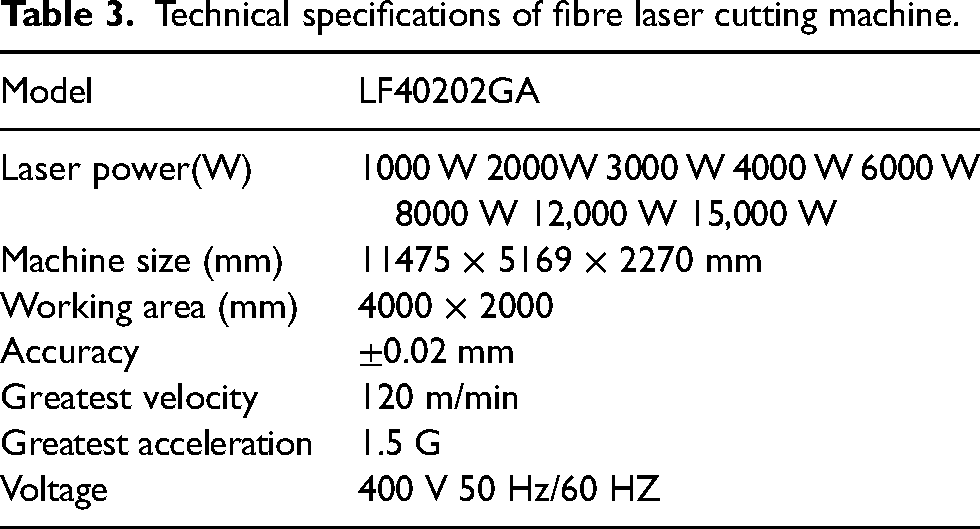
The Gweike LF-4020GA (Table 3) fibre laser cutting machine was used for laser cutting studies. Lens diameter (d mm), nozzle diameter (b mm), and pulse frequency values (c Hz) were held constant throughout the studies.
Technical specifications of fibre laser cutting machine.
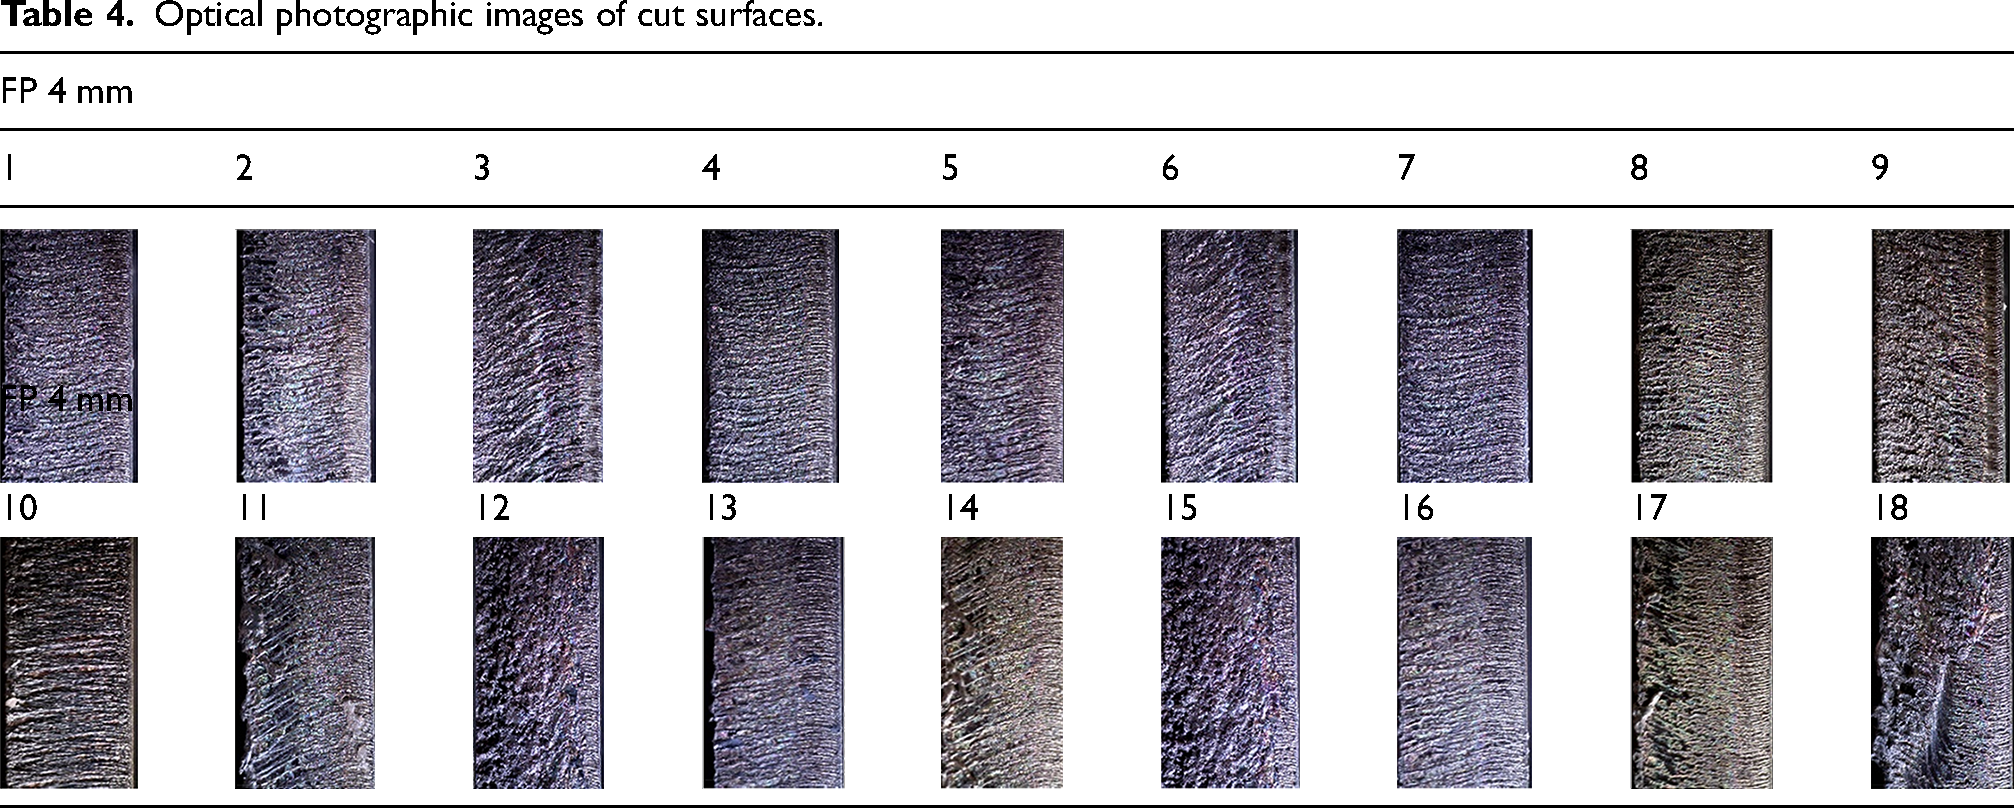
The cut surfaces in the experimental investigation are shown in Table 4 as optical photographs.
Optical photographic images of cut surfaces.
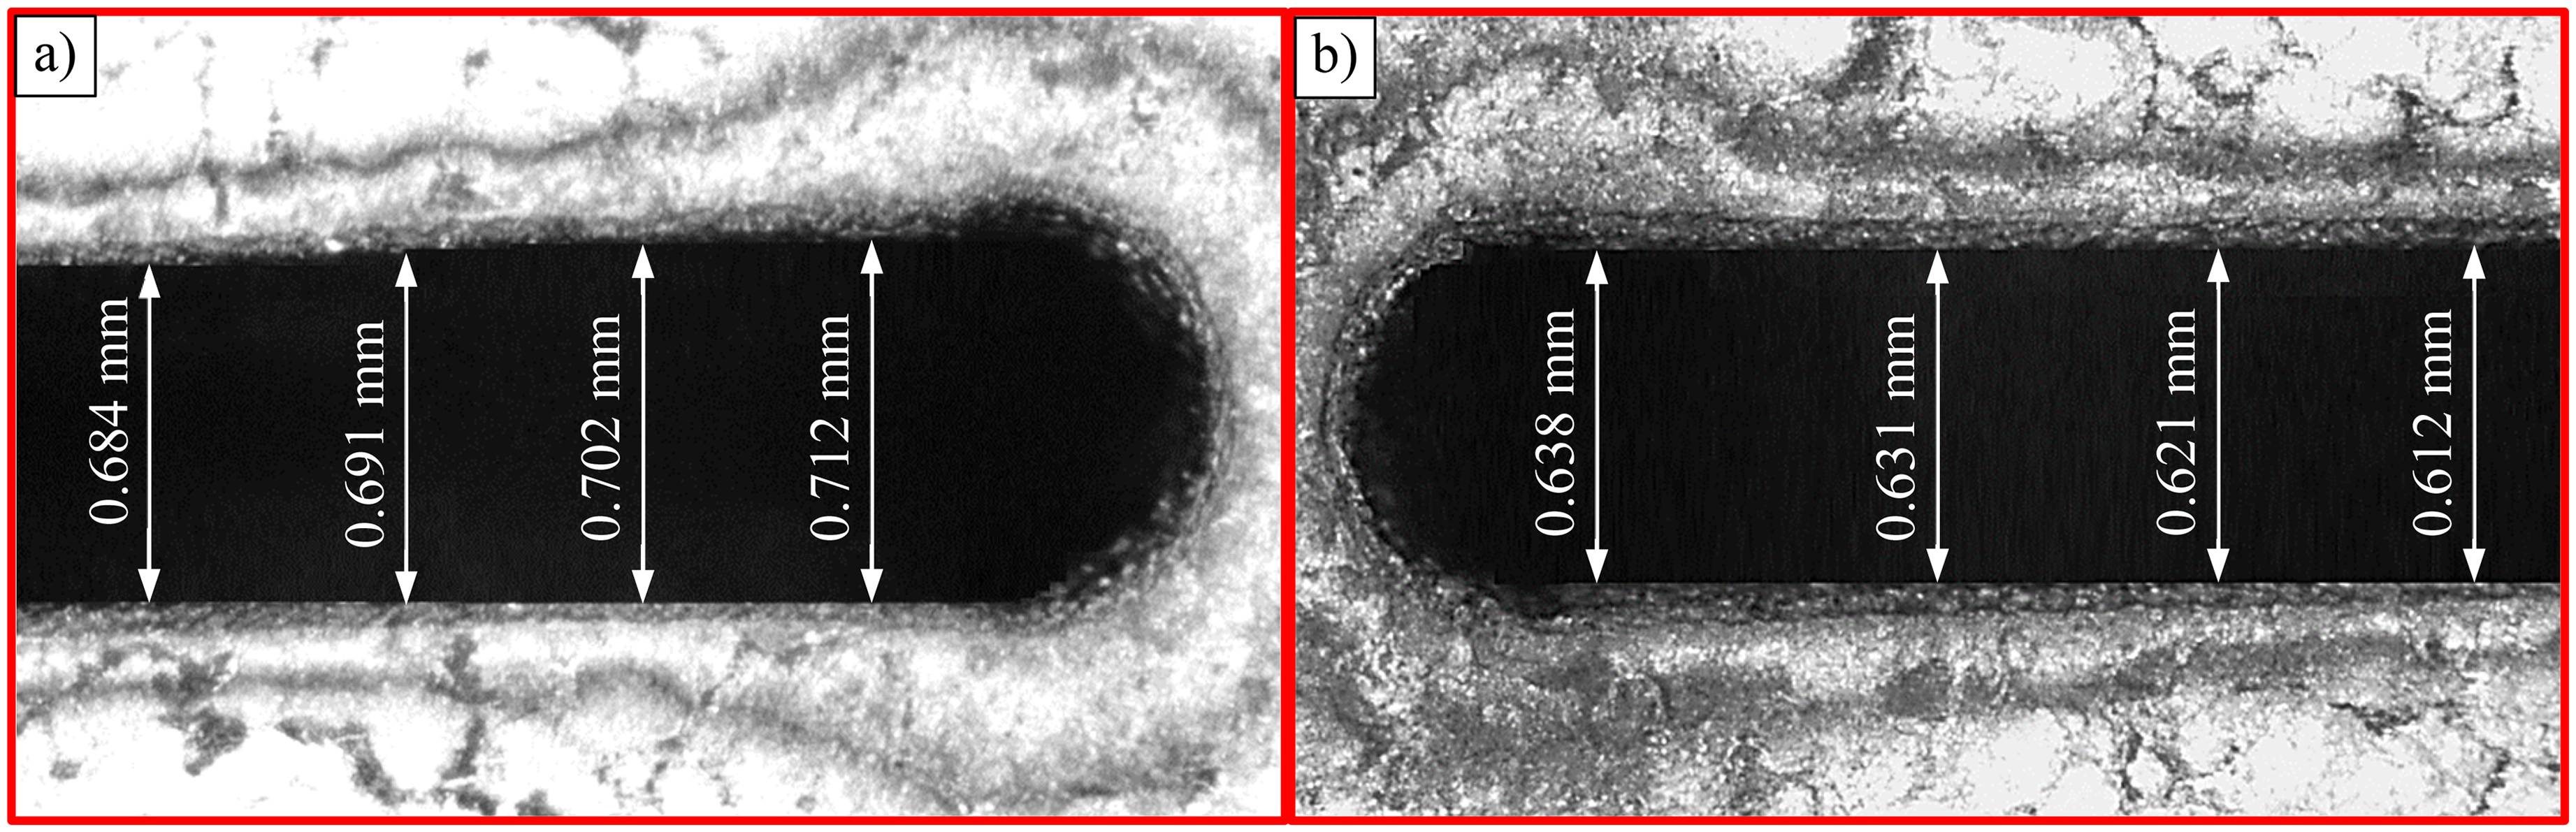
Four separate sites on the samples acquired from the laser cutting trials were used to measure the lower and upper kerf widths (Figure 3(a)). A Dino-Lite AM 4113ZT-type polarised optical microscope was used to calculate the kerf widths. At the end of the laser cutting process, obtaining the desired surface roughness without a second process also reduces production costs and machining time. Surface roughness measurements of the cut parts of the products obtained from laser cutting experiments were carried out with a PS 10 portable (Mahr Marsurf) surface roughness device. The mean of the measurement values taken from four different regions of the cut surfaces (Figure 3(b)) determined the average surface roughness values.
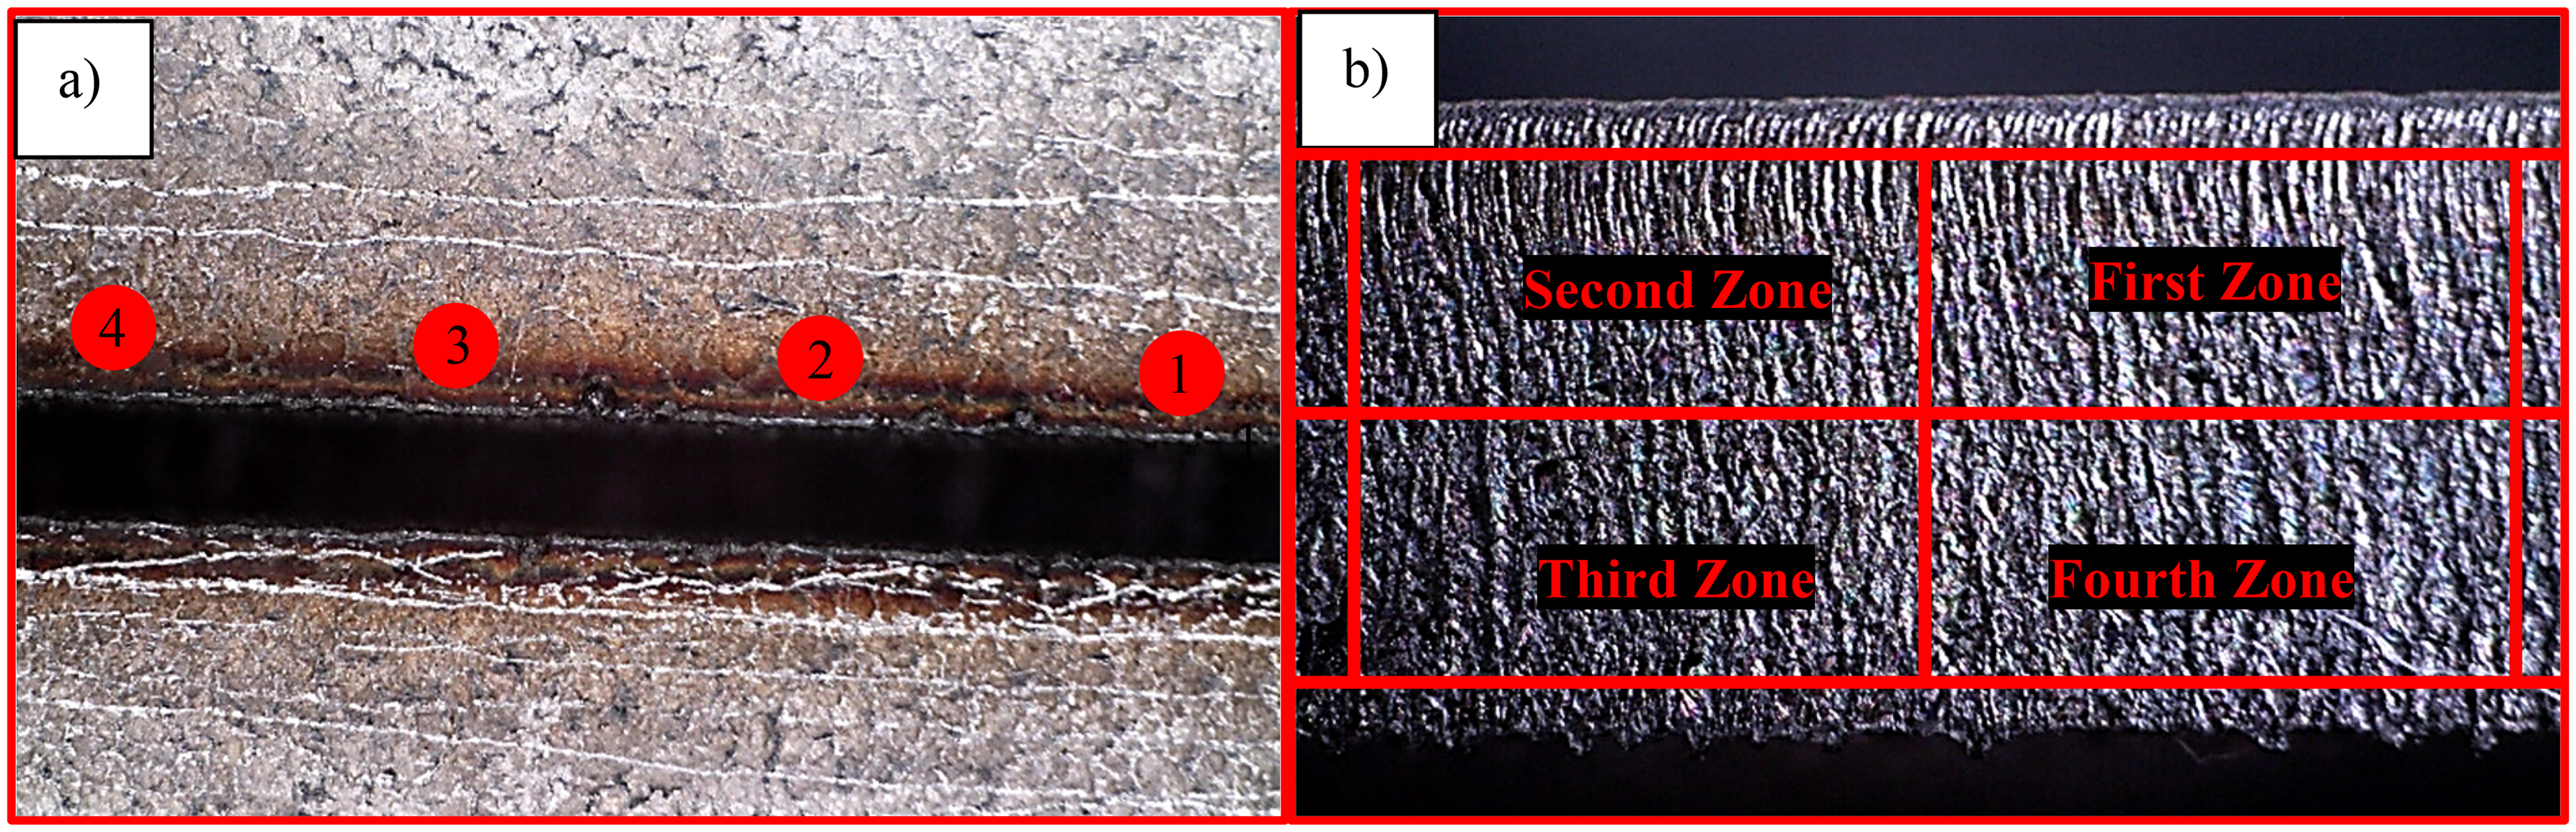
(a) Kerf width measurement points, (b) zone where surface roughness is measured.
The three-dimensional (3D) surface topography of the surfaces obtained from the laser cutting experiments was obtained using the Phase View optical profilometer device. To better understand the changes on the surfaces obtained from cutting, the images of the surfaces of the samples were taken with an FEG 250 scanning electron microscope (SEM). The experimental configuration, which shows laser cutting, sample measurement, and process flow, is given in Figure 4.
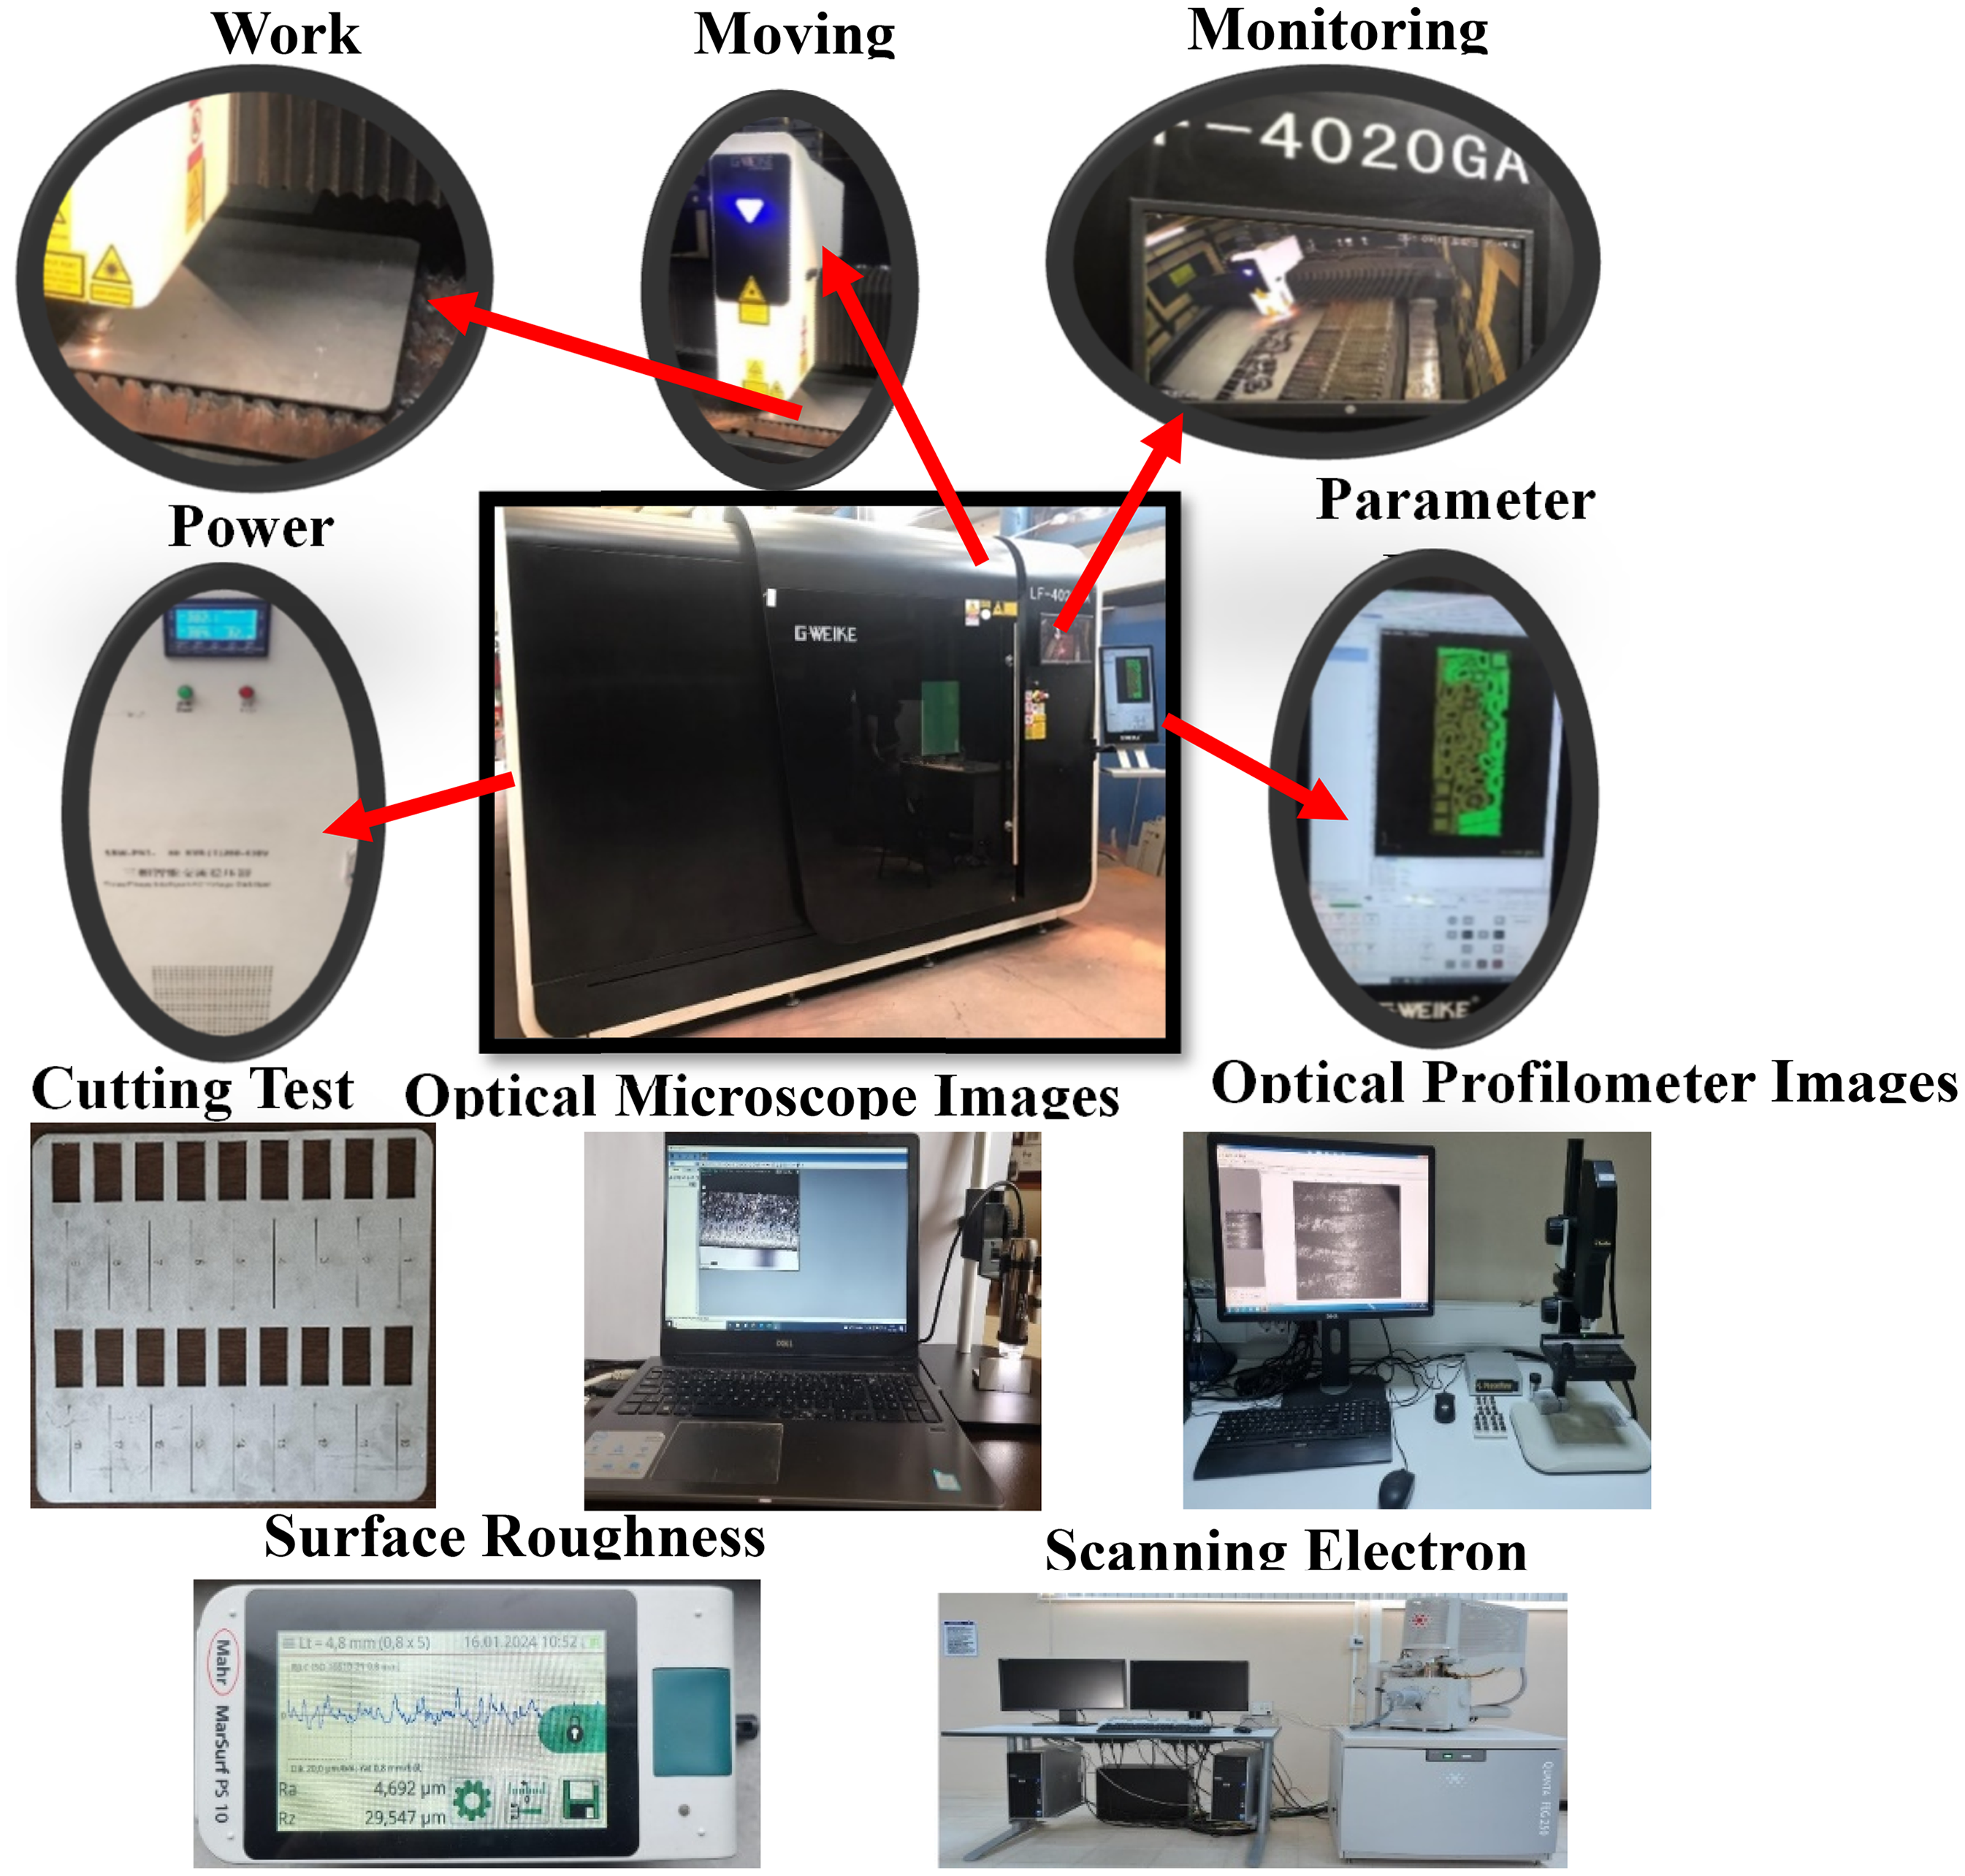
Experiment design showing laser cutting, sample measurement and process flow.
Taguchi experimental design
The technique of Taguchi is one of the statistical methods applied to increase product quality by reducing the number of experiments, improving the production process, and minimising product costs.
24
This method is frequently employed in experimental research and the manufacturing sector. It makes it possible to control variables that cannot be controlled in the traditional experimental design. The Taguchi technique converts the test results to the signal–noise (S/N) ratio.25,26 Since the lowest surface roughness and lower and upper kerf width values were aimed in the study, the ideal laser cutting settings were established using the ratio of S/N. Equation 1's ‘smallest is best’ method was selected for this specific selection.
26
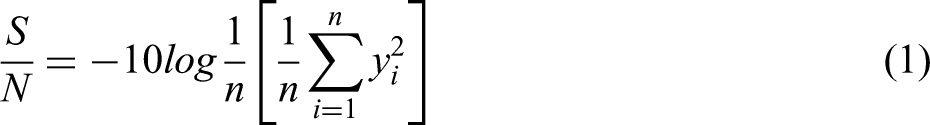
In equation 1, y is the measured value, and n is the number of experiments.
Grey relational analysis
The main objective of the experimental study was to determine the optimum cutting parameters for surface roughness, upper kerf width and lower kerf width. Taguchi's technique is a popular statistical method for overcoming problems with generally single-objective optimisation approaches. However, it is insufficient in multi-objective optimisation studies. For this reason, Taguchi-based grey correlation analysis is most commonly preferred for optimising the parameters used in processing experiments based on multiple output parameters.27,28 Taguchi-based grey relational analysis (GRA) steps are as follows:
Here,
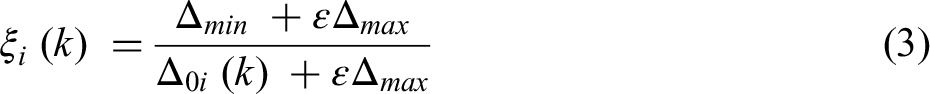


Identification coefficient ɛ, this number is between 0 and 1. After the GRC is generated, the GRC's average value is used in the grey relational degree (GRD) statistical calculation. 30
GRD is obtained by multiplying each GRC by its specific coefficient. GRD is calculated using equation 7.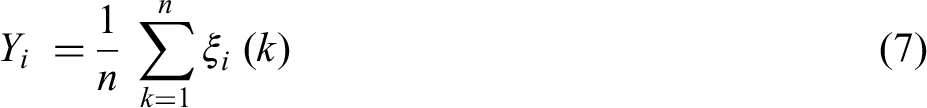
A high GRD indicates that the processing parameters are approaching the optimum level.
Results and discussion
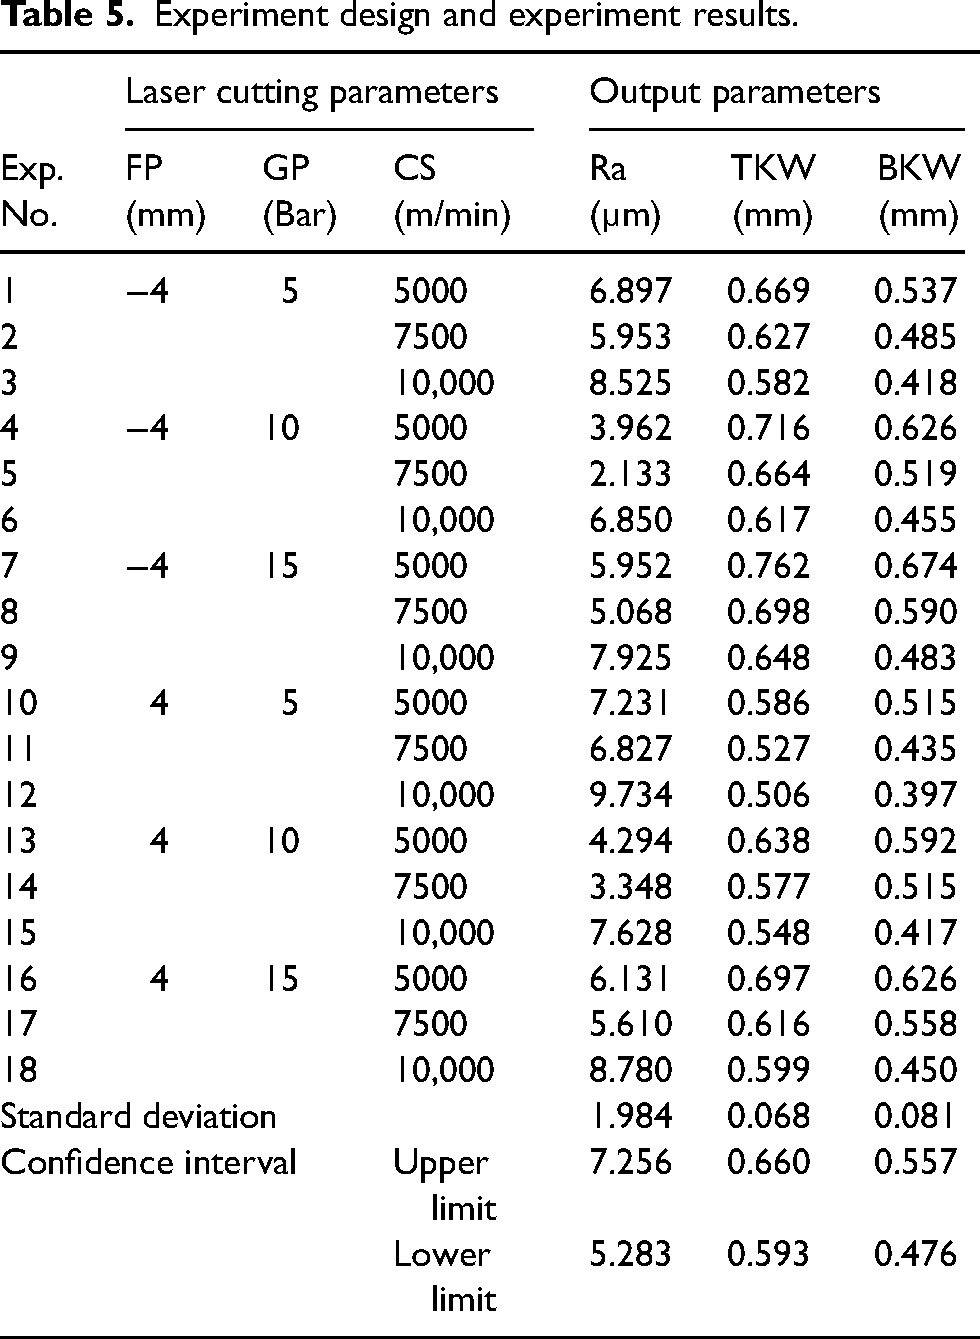
This study investigated the surface roughness, upper and lower kerf width changes experimentally and statistically in cutting AISI 304 stainless sheet material with laser cutting method in different cutting parameters. Laser cutting parameters and output parameters obtained from the cut materials are shown in Table 5. The standard deviations and confidence interval values of the obtained values were obtained using equations 8 and 9. s is the standard deviation, 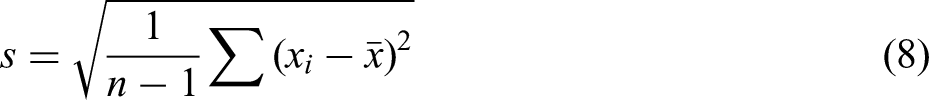

Experiment design and experiment results.
Evaluation of surface roughness
The surface roughness of products produced by machining is a critical quality indicator that directly affects the produced part's tribological properties and fatigue strength.31,32 Because of this, the surface roughness must be reduced to the lowest level by choosing the cutting parameters correctly in the laser cutting process. This section evaluated the effect of cutting parameters on the surface topography due to cutting AISI 304 sheet material using various cutting parameters.
The surface roughness values of the samples obtained from laser cutting vary between 2.133 and 9.734 µm. In the experimental study performed at different gas pressures at −4 and 4 mm focal points in Figure 5, it was observed that the surface roughness decreased by increasing the cutting speed from 5000 mm/min to 7500 mm/min. For example, the surface roughness value was measured as 6.897 µm at −4 mm focal point at 5000 mm/min cutting speed and 5 bar gas pressure. By removing the cutting speed to 7500 mm/min, there was an improvement of 13.7% in the surface roughness (5.953 µm). It has been reported that the decrease in surface roughness due to increased cutting speed is the proper removal of the molten metal from the cutting zone. The laser cutting process's low cutting speed increases the heat produced in the cutting area. The amount of melt in the cutting zone increases due to this circumstance. When the amount of melt formed is discharged with gas, the amount, depth, and irregularity of the pattern formed on the surface will increase, causing an increase in the surface roughness value. 33 However, in the experiments performed at different gas pressures at the −4 and 4 mm focal points, the surface roughness increased again as the cutting speed increased from 7500 mm/min to 10,000 mm/min. By subtracting the cutting speed from 7500 mm/min to 10,000 mm/min at 5 bar gas pressure at the −4 mm focal point, the surface roughness value was negatively affected and became 8.525 µm with an increase of 43.21%. According to the study, the amount, depth, and irregularity of the pattern on the cut surface increase as the cutting speed is increased to its maximum level, resulting in the development of coarser lines. 34
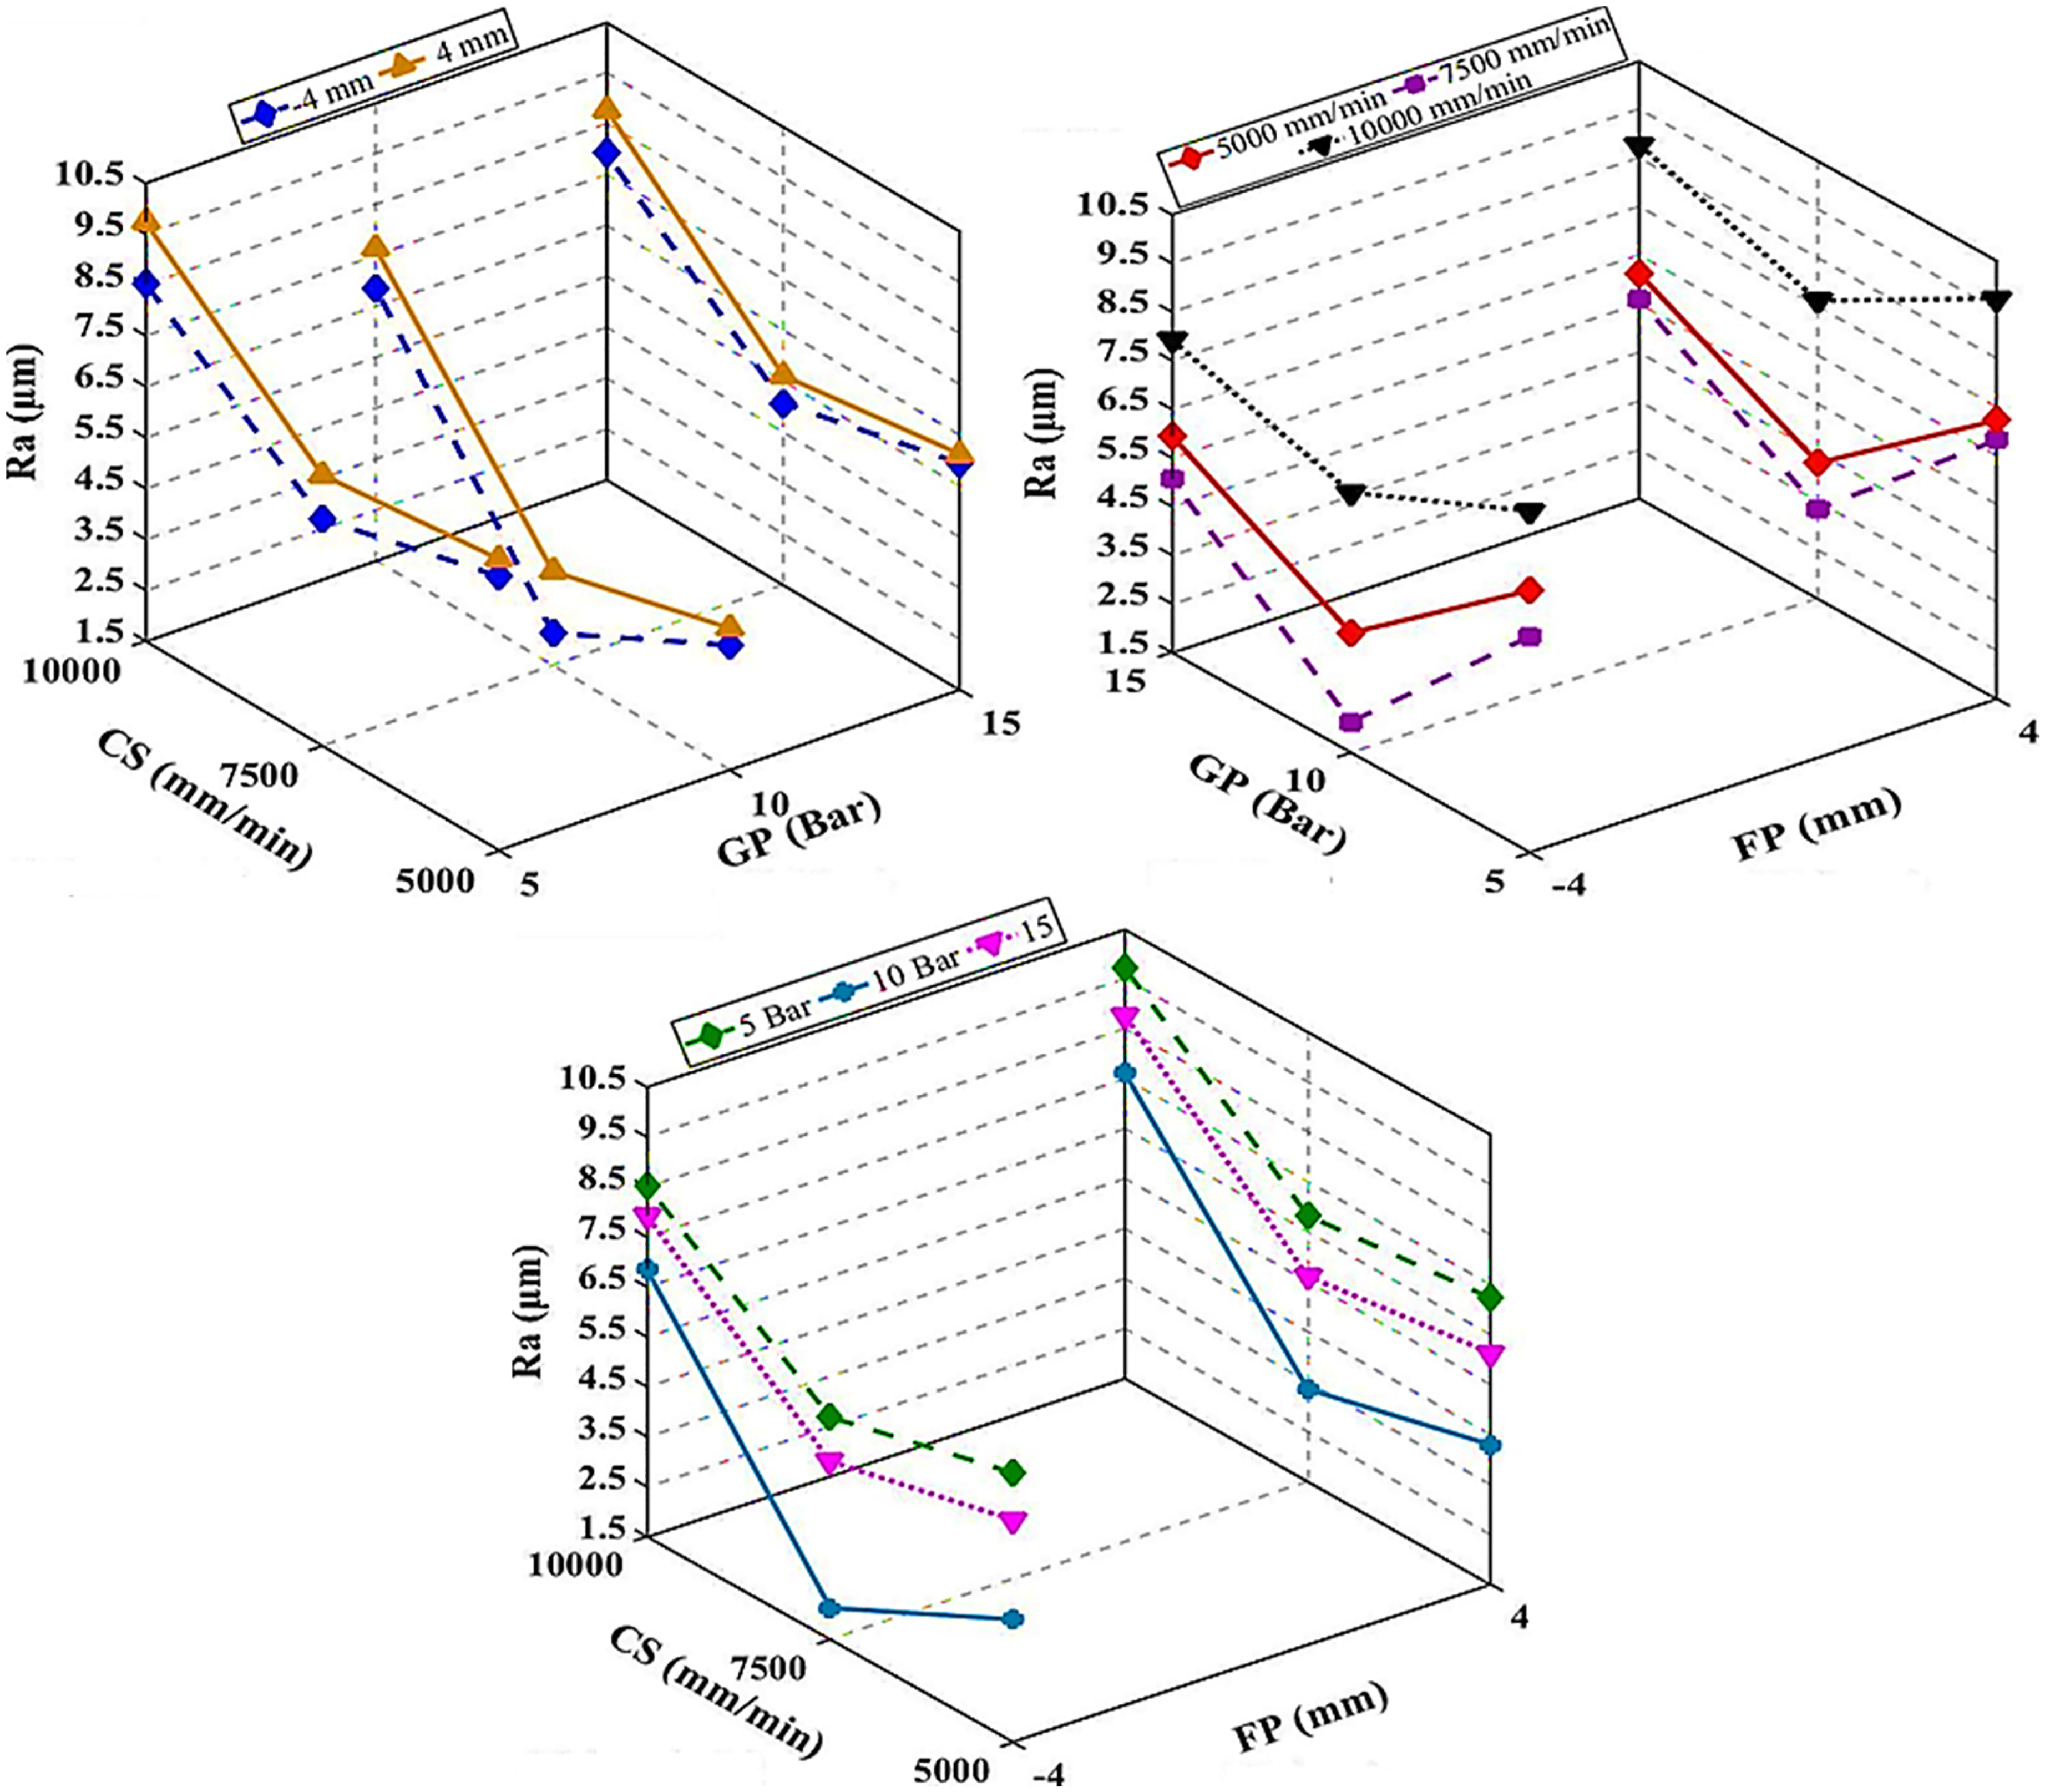
Surface roughness variation depends on cutting speed and gas pressure at −4 mm and 4 mm focal points.
Figure 5 shows that the gas pressure ranges from 5 to 10 bar in the experiments performed at different cutting speeds (5000 mm/min, 7500 mm/min and 10,000 mm/min) and different focal points (−4 mm and 4 mm). It was observed that the cutting speed decreased up to a certain value and then the surface roughness increased with the increase of the cutting speed. For example, surface roughness was measured as 6.897 µm and 7.231 µm, respectively, at 5000 mm/min cutting speed, −4 mm and 4 mm focal point and 5 bar gas pressure.
It is observed that the surface roughness values decrease by 42.56% and 40.62%, respectively, by increasing the gas pressure to 10 Bar at the cutting speed of 5000 mm/min at the −4 mm and 4 mm focal points. By increasing the gas pressure up to 10 bar, the decrease in the surface roughness was probably caused by the proper removal of the molten metal formed on the cut surface to obtain a clean surface. However, the surface roughness increased with gas pressure from 10 bar to 15 bar at different cutting speeds (5000 mm/min, 7500 mm/min and 10,000 mm/min) and different focus points (−4 mm and 4 mm). It has been reported that the turbulence caused by the increased gas pressure in the cutting region during the laser cutting process will increase the surface roughness due to the increase in the gas pressure. In addition, it has been stated that the instabilities in the gas flow in the kerf region during laser cutting and the occurrence of different aerodynamic events (shock waves, boundary layer separation, etc.) will increase the surface roughness values.35,36 The experiments observed that the surface roughness value decreased as the focal point approached (4 mm) from the workpiece towards the inside (−4 mm). This situation parallels the results of studies in the literature. 15 Profilometer and SEM, images of the samples from which minimum (a) and maximum (b) surface roughness were obtained are presented in Figures 6 and 7, respectively.
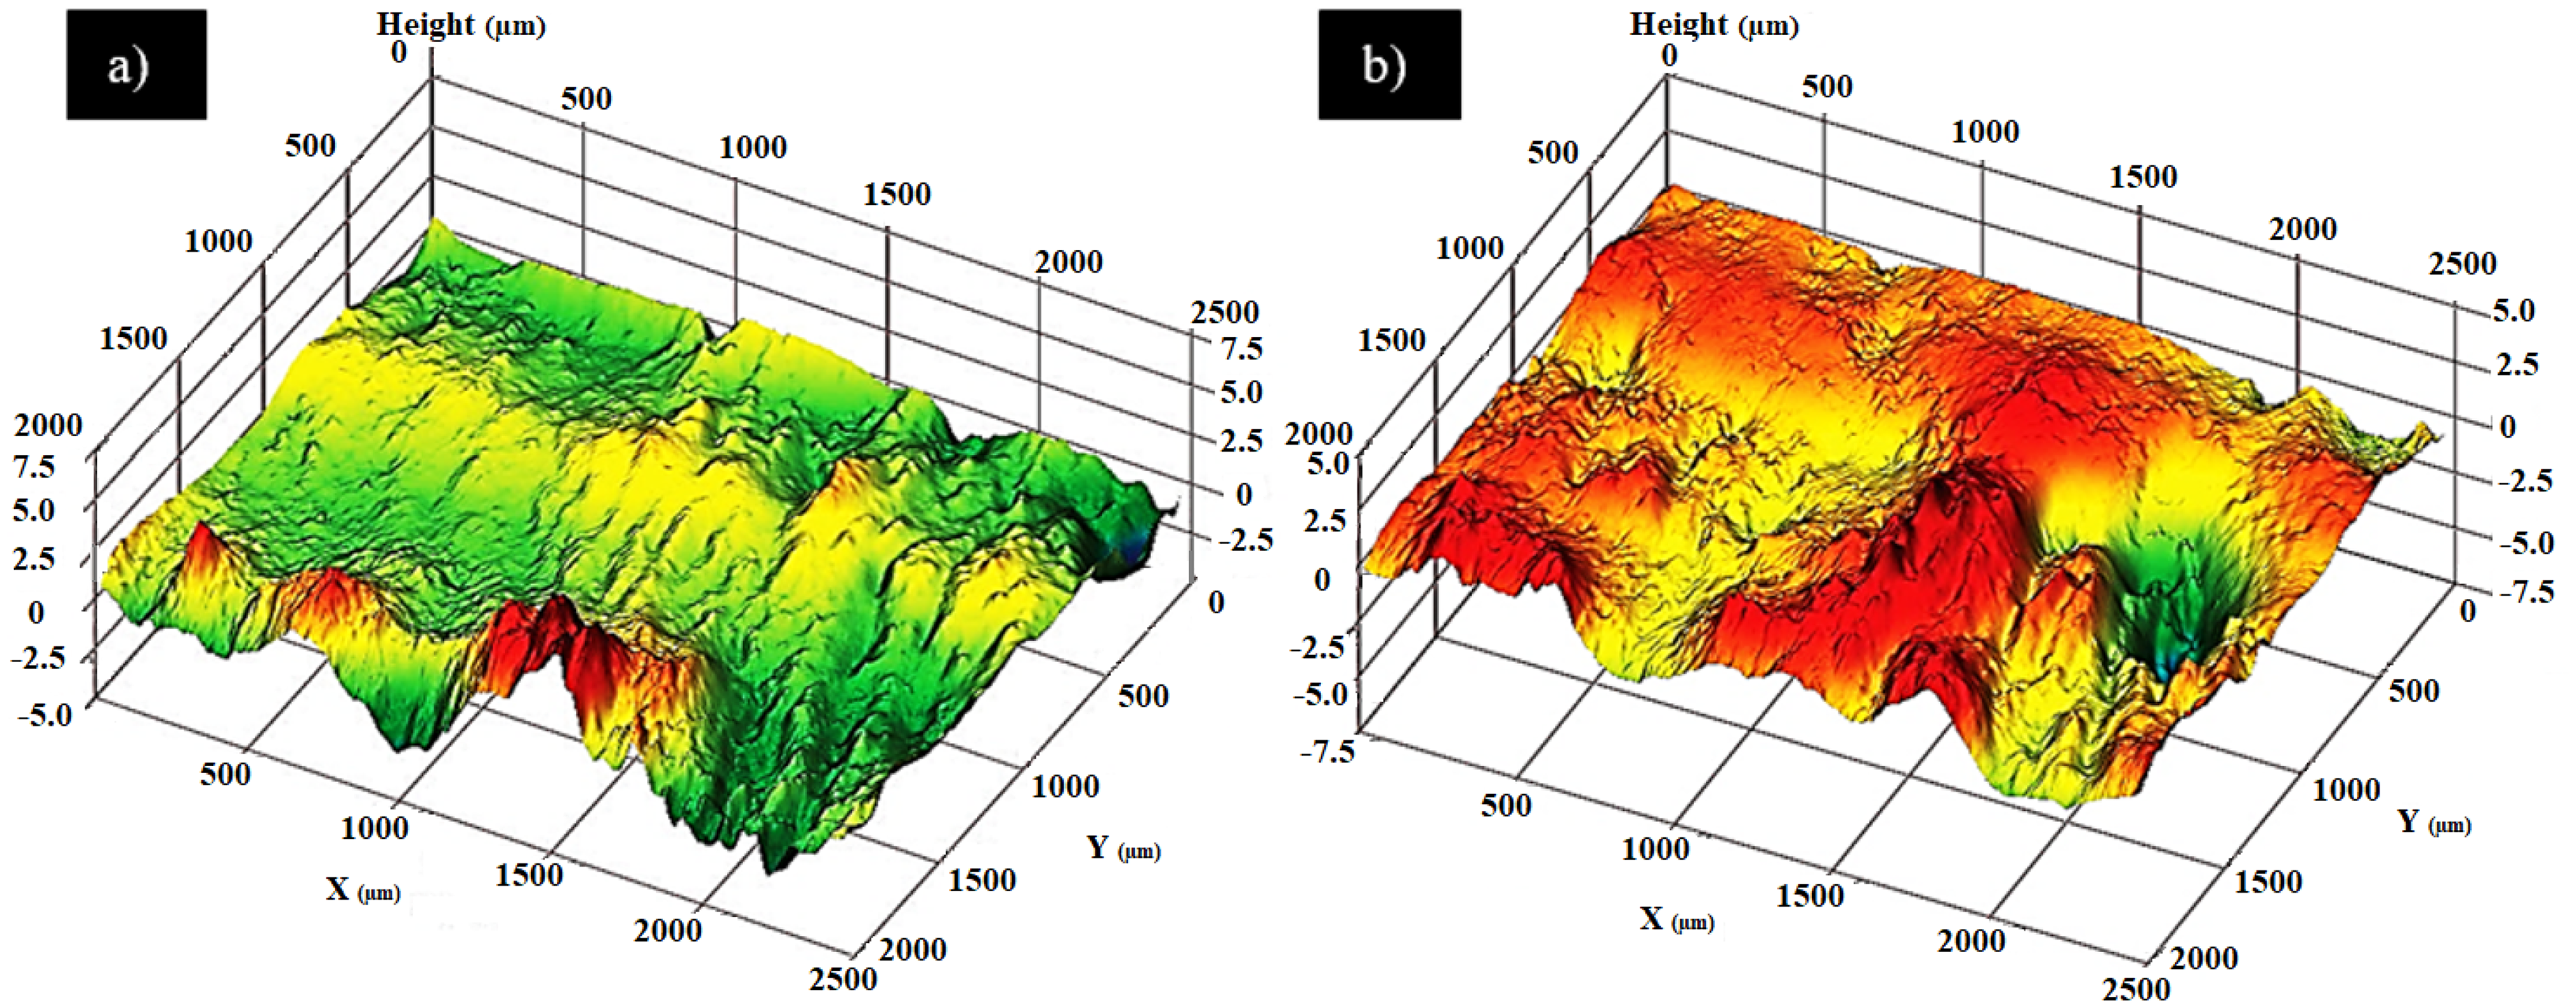
Surface topographies of the samples (a) −4 mm focal point, 10 bar gas pressure, 7500 m/min cutting speed, (b) 4 mm focal point, 5 bar gas pressure, 10,000 m/min cutting speed.
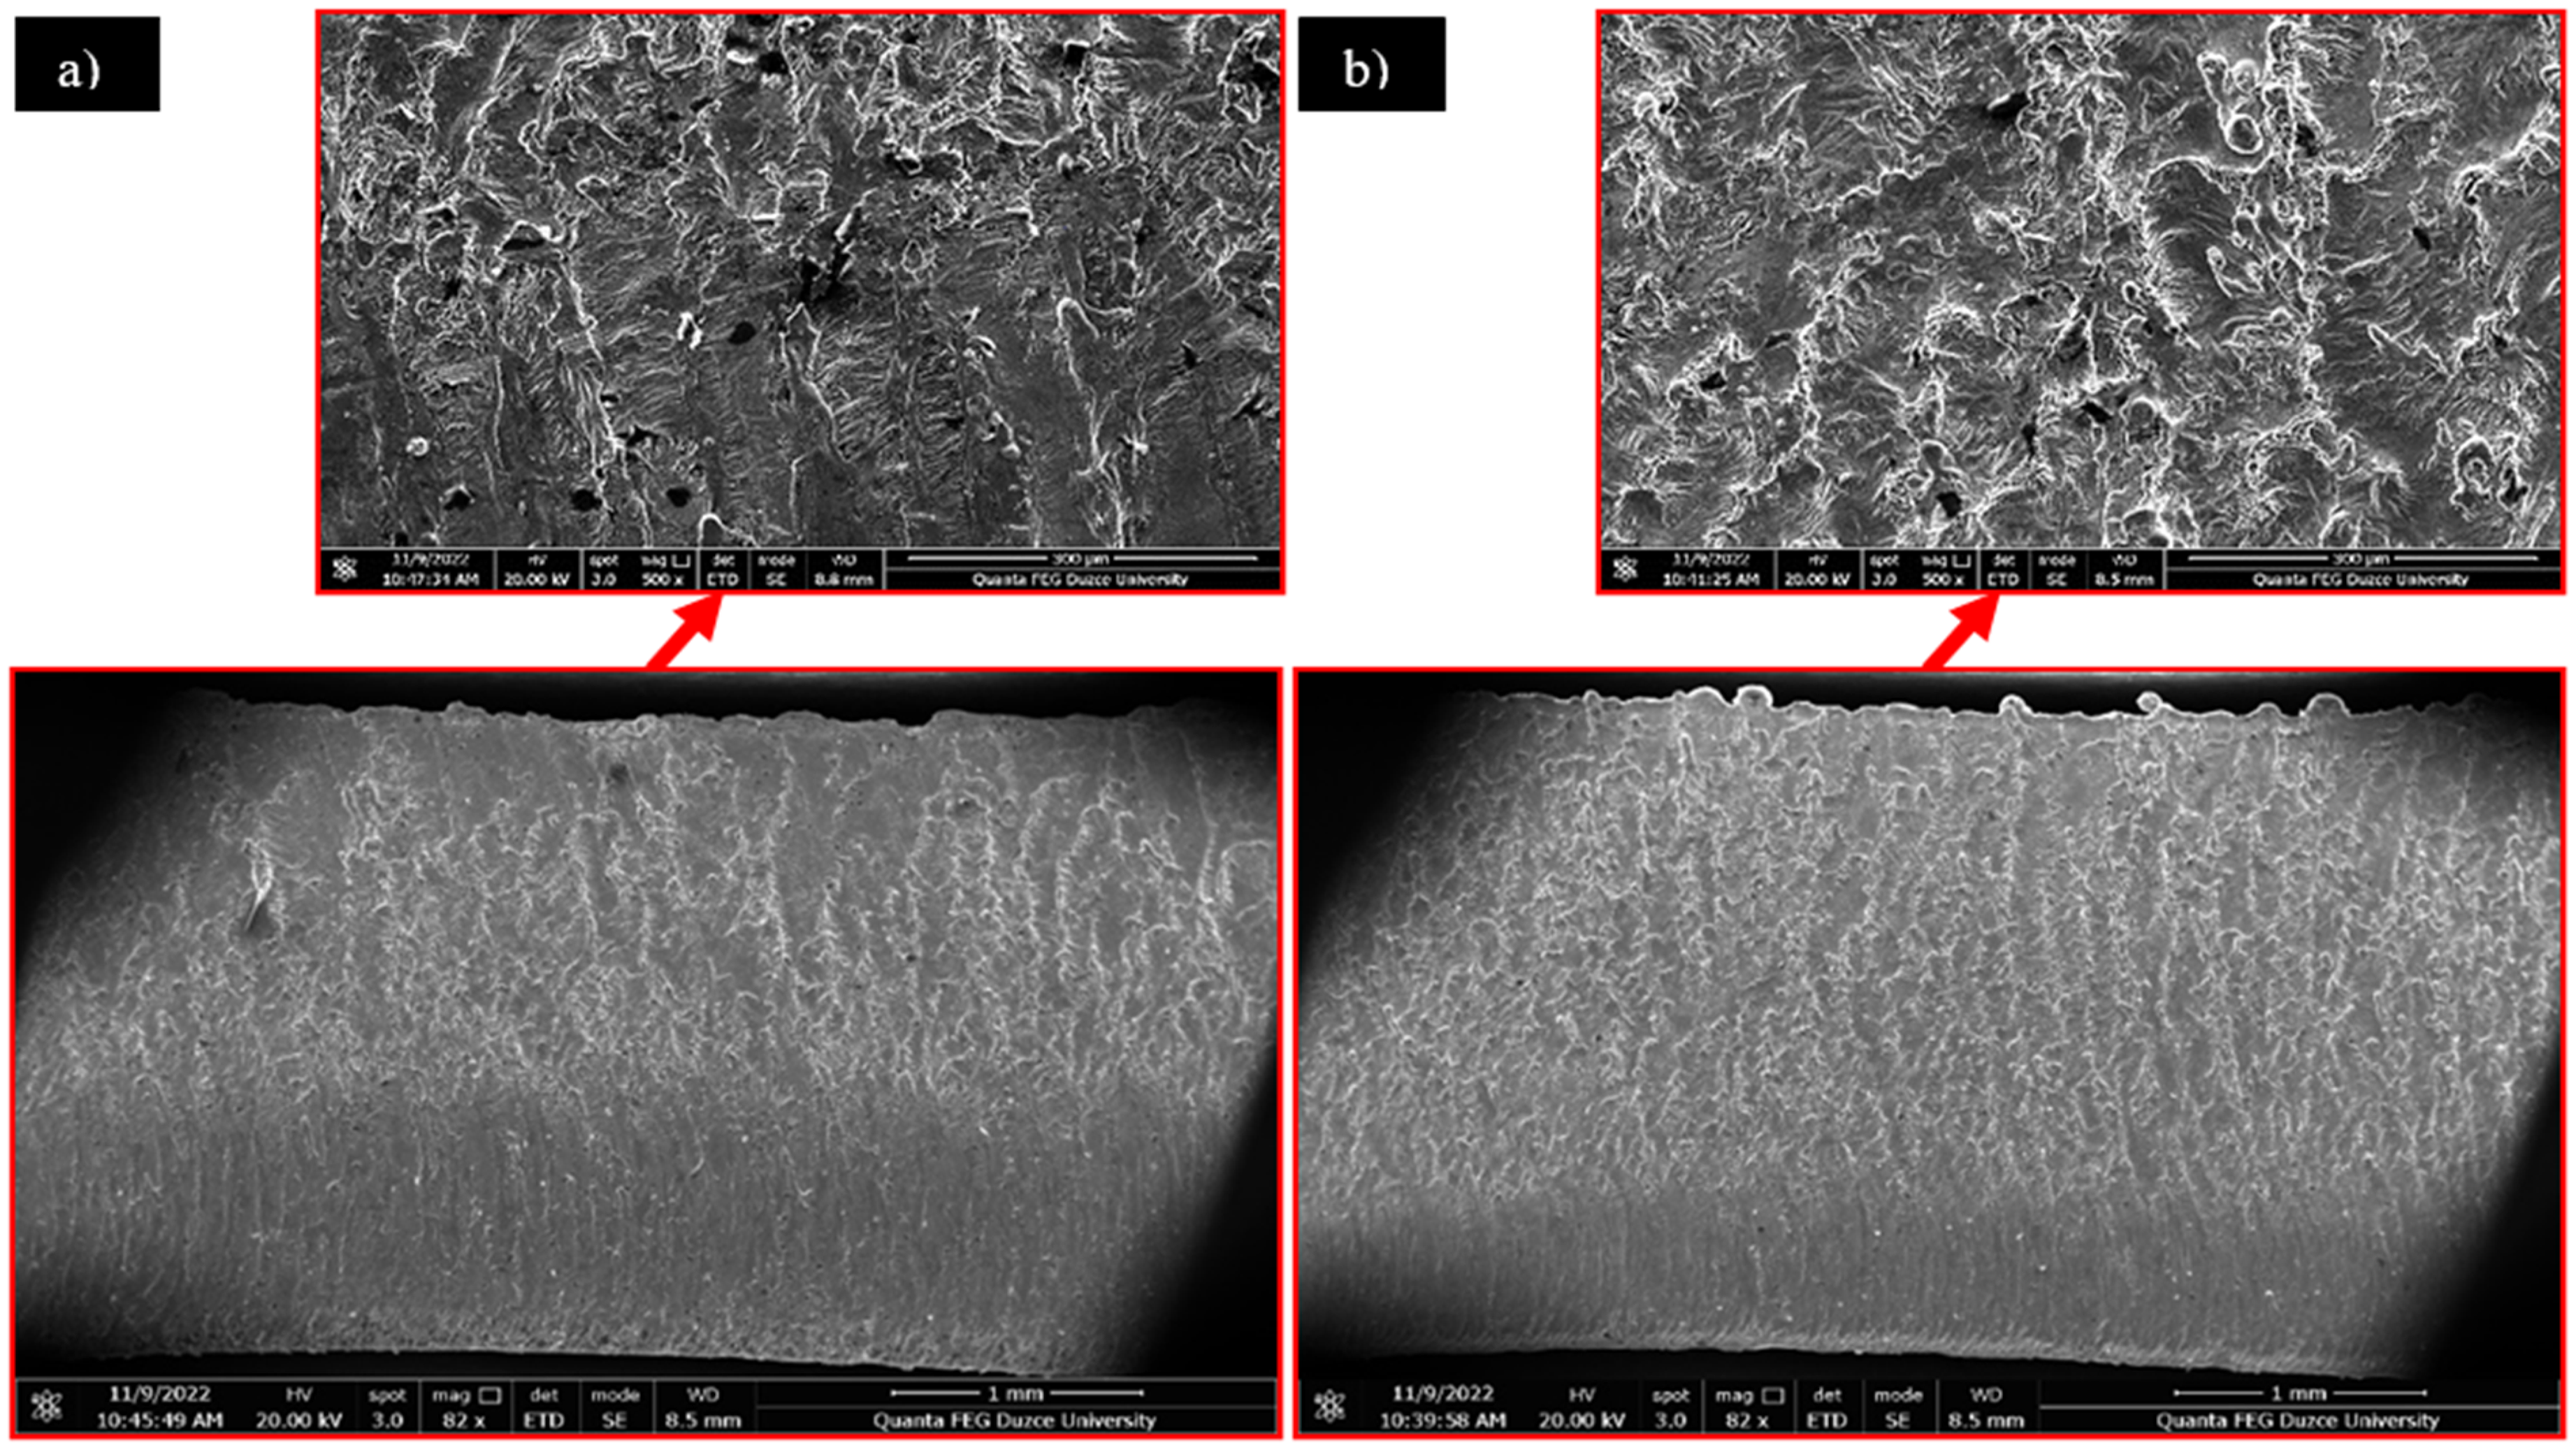
SEM images of sample surfaces (a) −4 mm focal point, 10 bar gas pressure, 75,000 m/min cutting speed, (b) 4 mm focal point, 5 bar gas pressure, 10,000 m/min cutting speed.
Assessment of kerf width (top and bottom)
The effects of laser cutting parameters on the upper kerf width and the lower kerf width in laser cutting of AISI 304 sheet material are shown in Figure 8.
(a) Upper kerf width, (b) lower kerf width measurement results.
After the experiments, the upper kerf width and lower kerf width data along the cutting length were calculated using the arithmetic average of four measurement results from different points. The first striking result in the upper and lower kerf width measurements was that the upper and lower kerf widths increased along the cut's length from the cut's starting point to the endpoint. When literature studies are examined, it has been reported that the reason for this is the accumulation of heat in front of the laser during the cutting and the removal of the molten metal amount formed in the cutting zone with the help of gas pressure.34,37 The measurement results given in Figure 9 also confirm this situation. Figure 9 shows the variation in the top kerf width based on the laser cutting parameters.
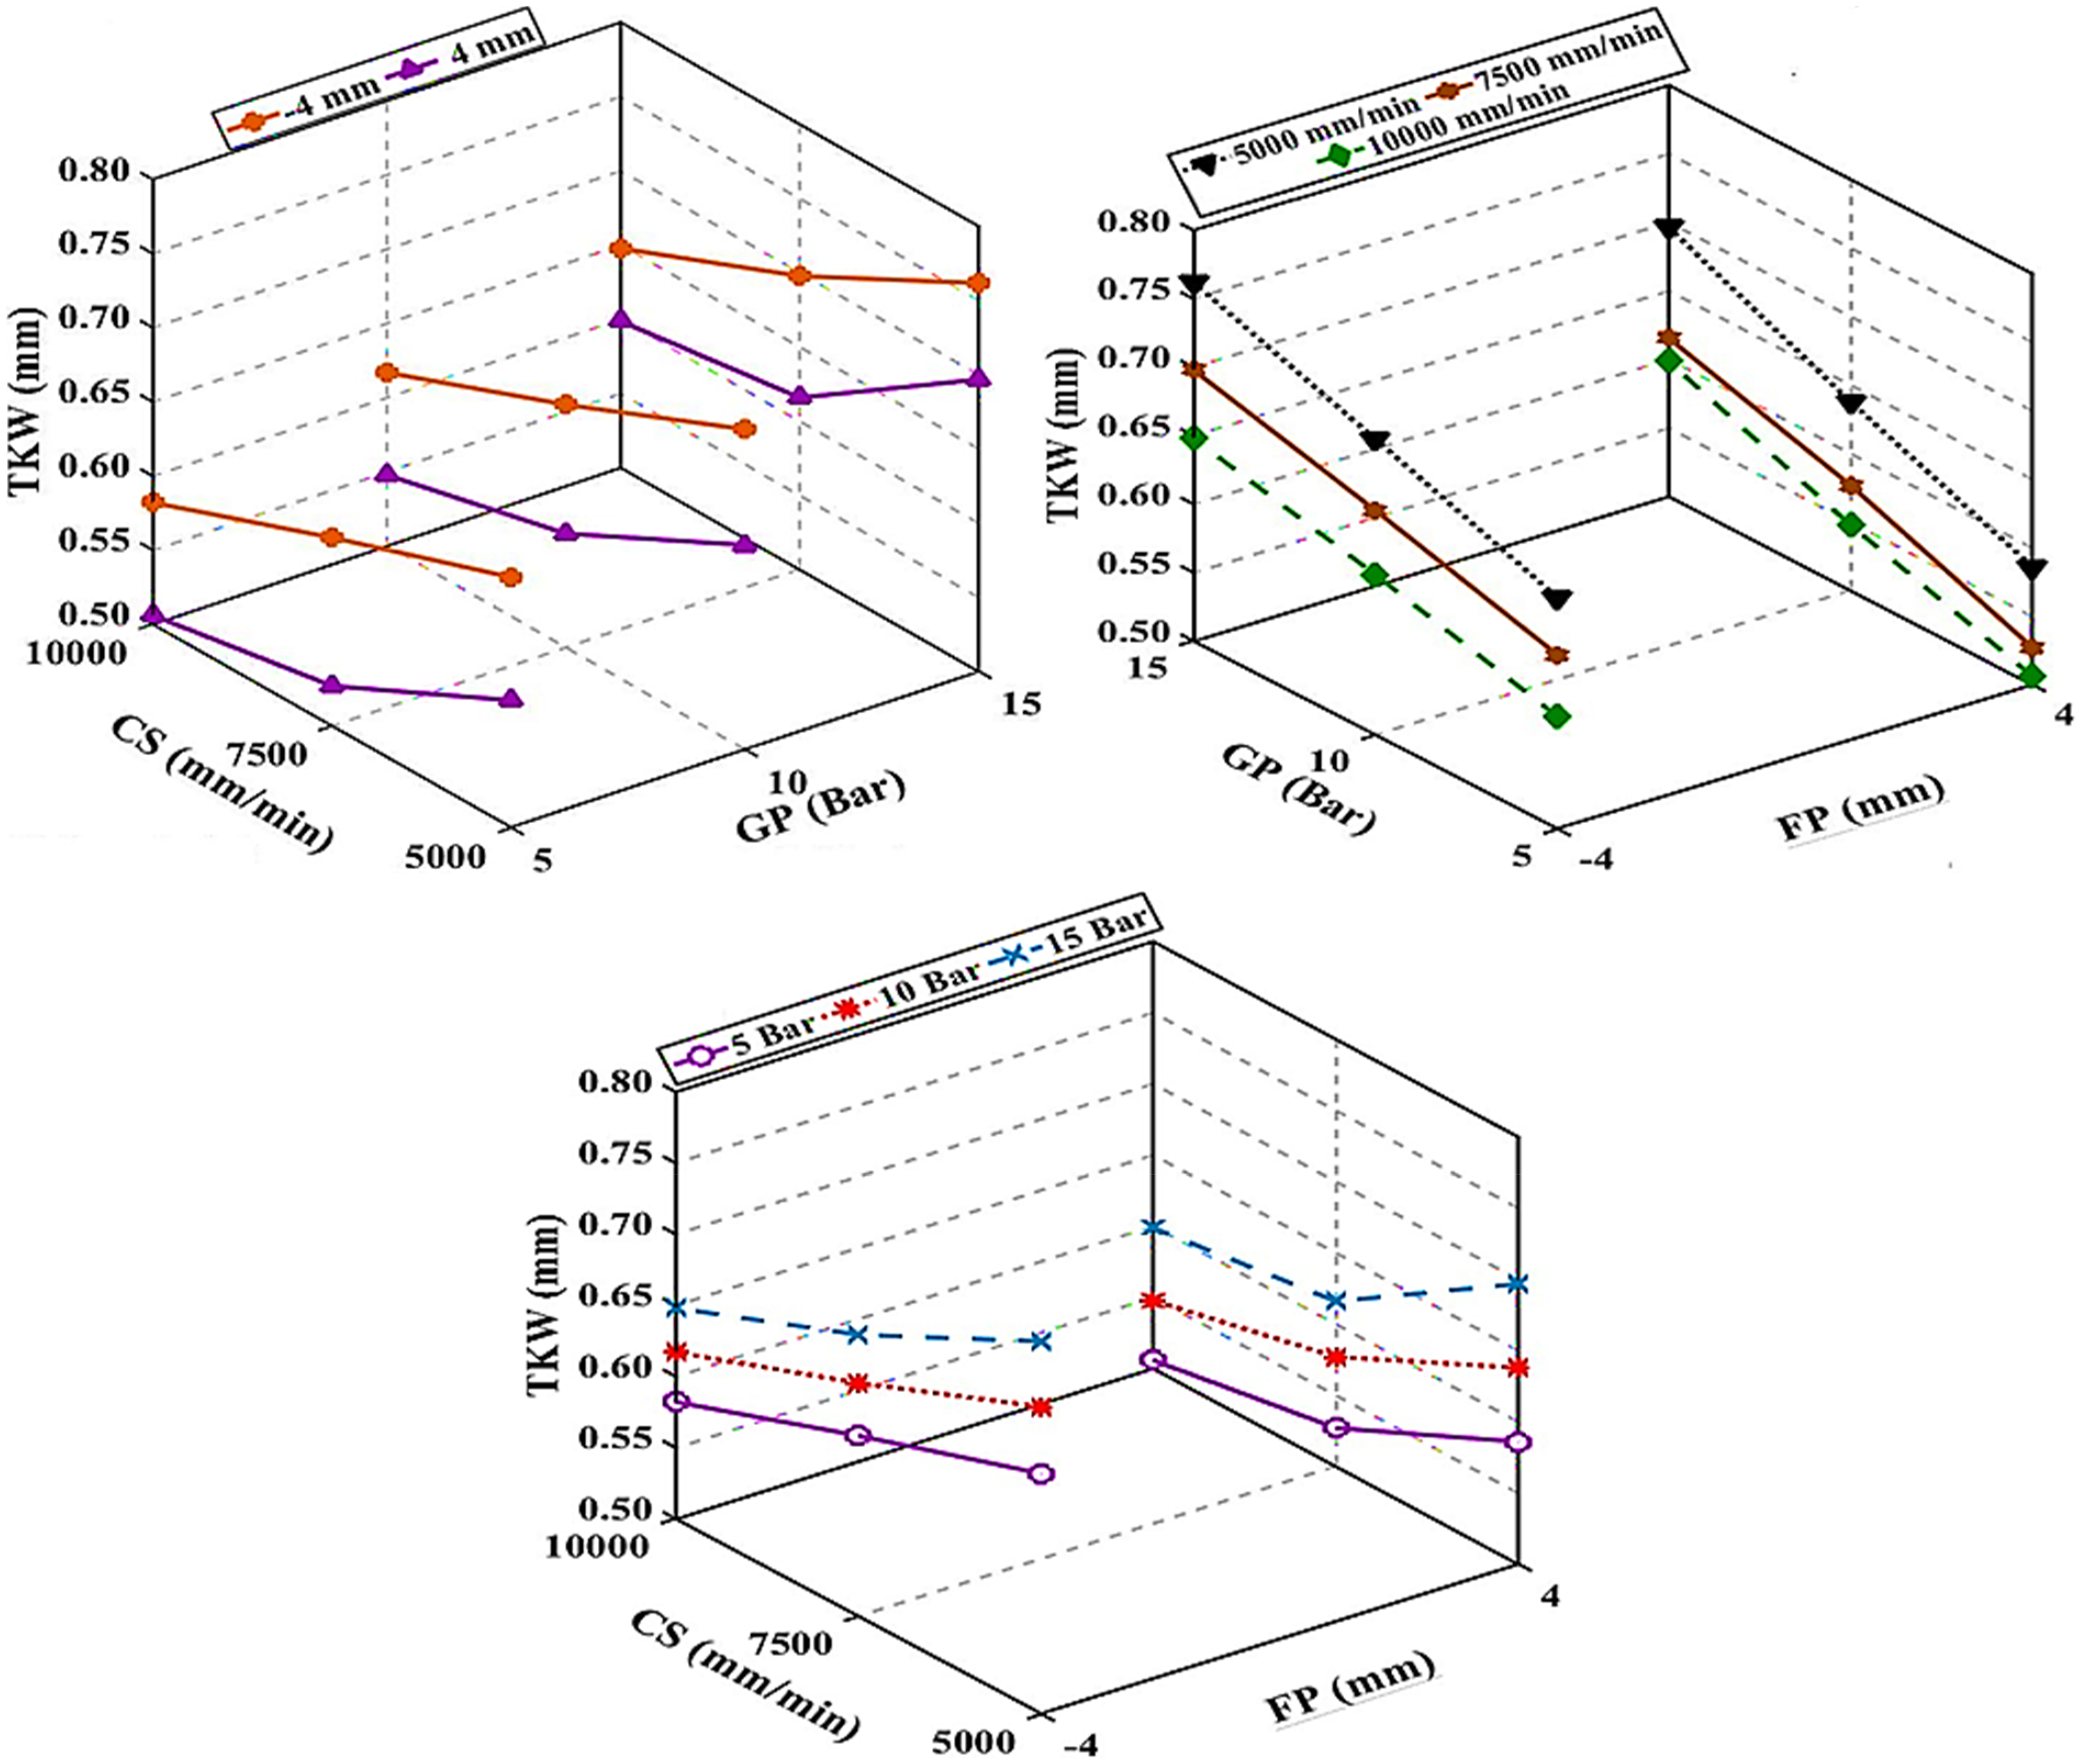
The effect of cutting parameters used in laser cutting experiments on the change of top kerf width.
When the auxiliary gas pressure is high and the cutting speed is low, the value of the kerf inclination angle decreases significantly. This situation ensures sufficient interaction between the laser beam and the material surface and that the metal melted through the thickness of the material during this period is removed from the cutting zone without solidification in the lower part with the help of high gas pressure. 38 Decreasing the cutting speed prolongs the time when a high-temperature oxidation reaction occurs on the workpiece surface. The low laser power also reduces the heat accumulation on the workpiece. This results in lower top and bottom hole tolerances since the molten metal cannot be removed from the cutting zone at low gas pressure. 39
Figure 9 shows that the upper kerf width varies between 0.582 and 0.762 mm in the test results obtained at the −4 mm focal point. According to the test results, the top kerf width was measured as 0.669 mm at a cutting speed 40 of 5000 m/min, a gas pressure of 5 bar and a focal point of −4 mm. The decrease in the upper kerf width was observed to reach 6.27% and 13%, respectively, by increasing the cutting speed from 5000 m/min to 7500 m/min and 10,000 m/min, respectively. The increase in the upper kerf width reached 7.03% and 13.90%, respectively, by subtracting the gas pressure from 5 bar to 10 bar and 15 bar, respectively. As a result of the laser cutting experiments performed at the 4 mm focal point, the upper kerf width changed between 0.506 and 0.697 mm. According to the test results, the upper kerf width 41 was measured as 0.586 mm at a cutting speed of 5000 m/min and a gas pressure of 5 bar at a 4 mm focal point. By increasing the cutting speed from 5000 m/min to 7500 m/min and 10,000 m/min, the reduction in upper kerf width is 10.07% and 13.70%, respectively. By subtracting the gas pressure from 5 bar to 10 bar and 15 bar, the increase in the upper kerf width was 8.87% and 18.94%, respectively. When all the test results were examined, it was determined that the upper kerf width of the experiments performed at the 4 mm focal point was 13.2% less on average than at the −4 mm focal point – the change in the bottom kerf widths after the laser cutting process is shown in Figure 10.
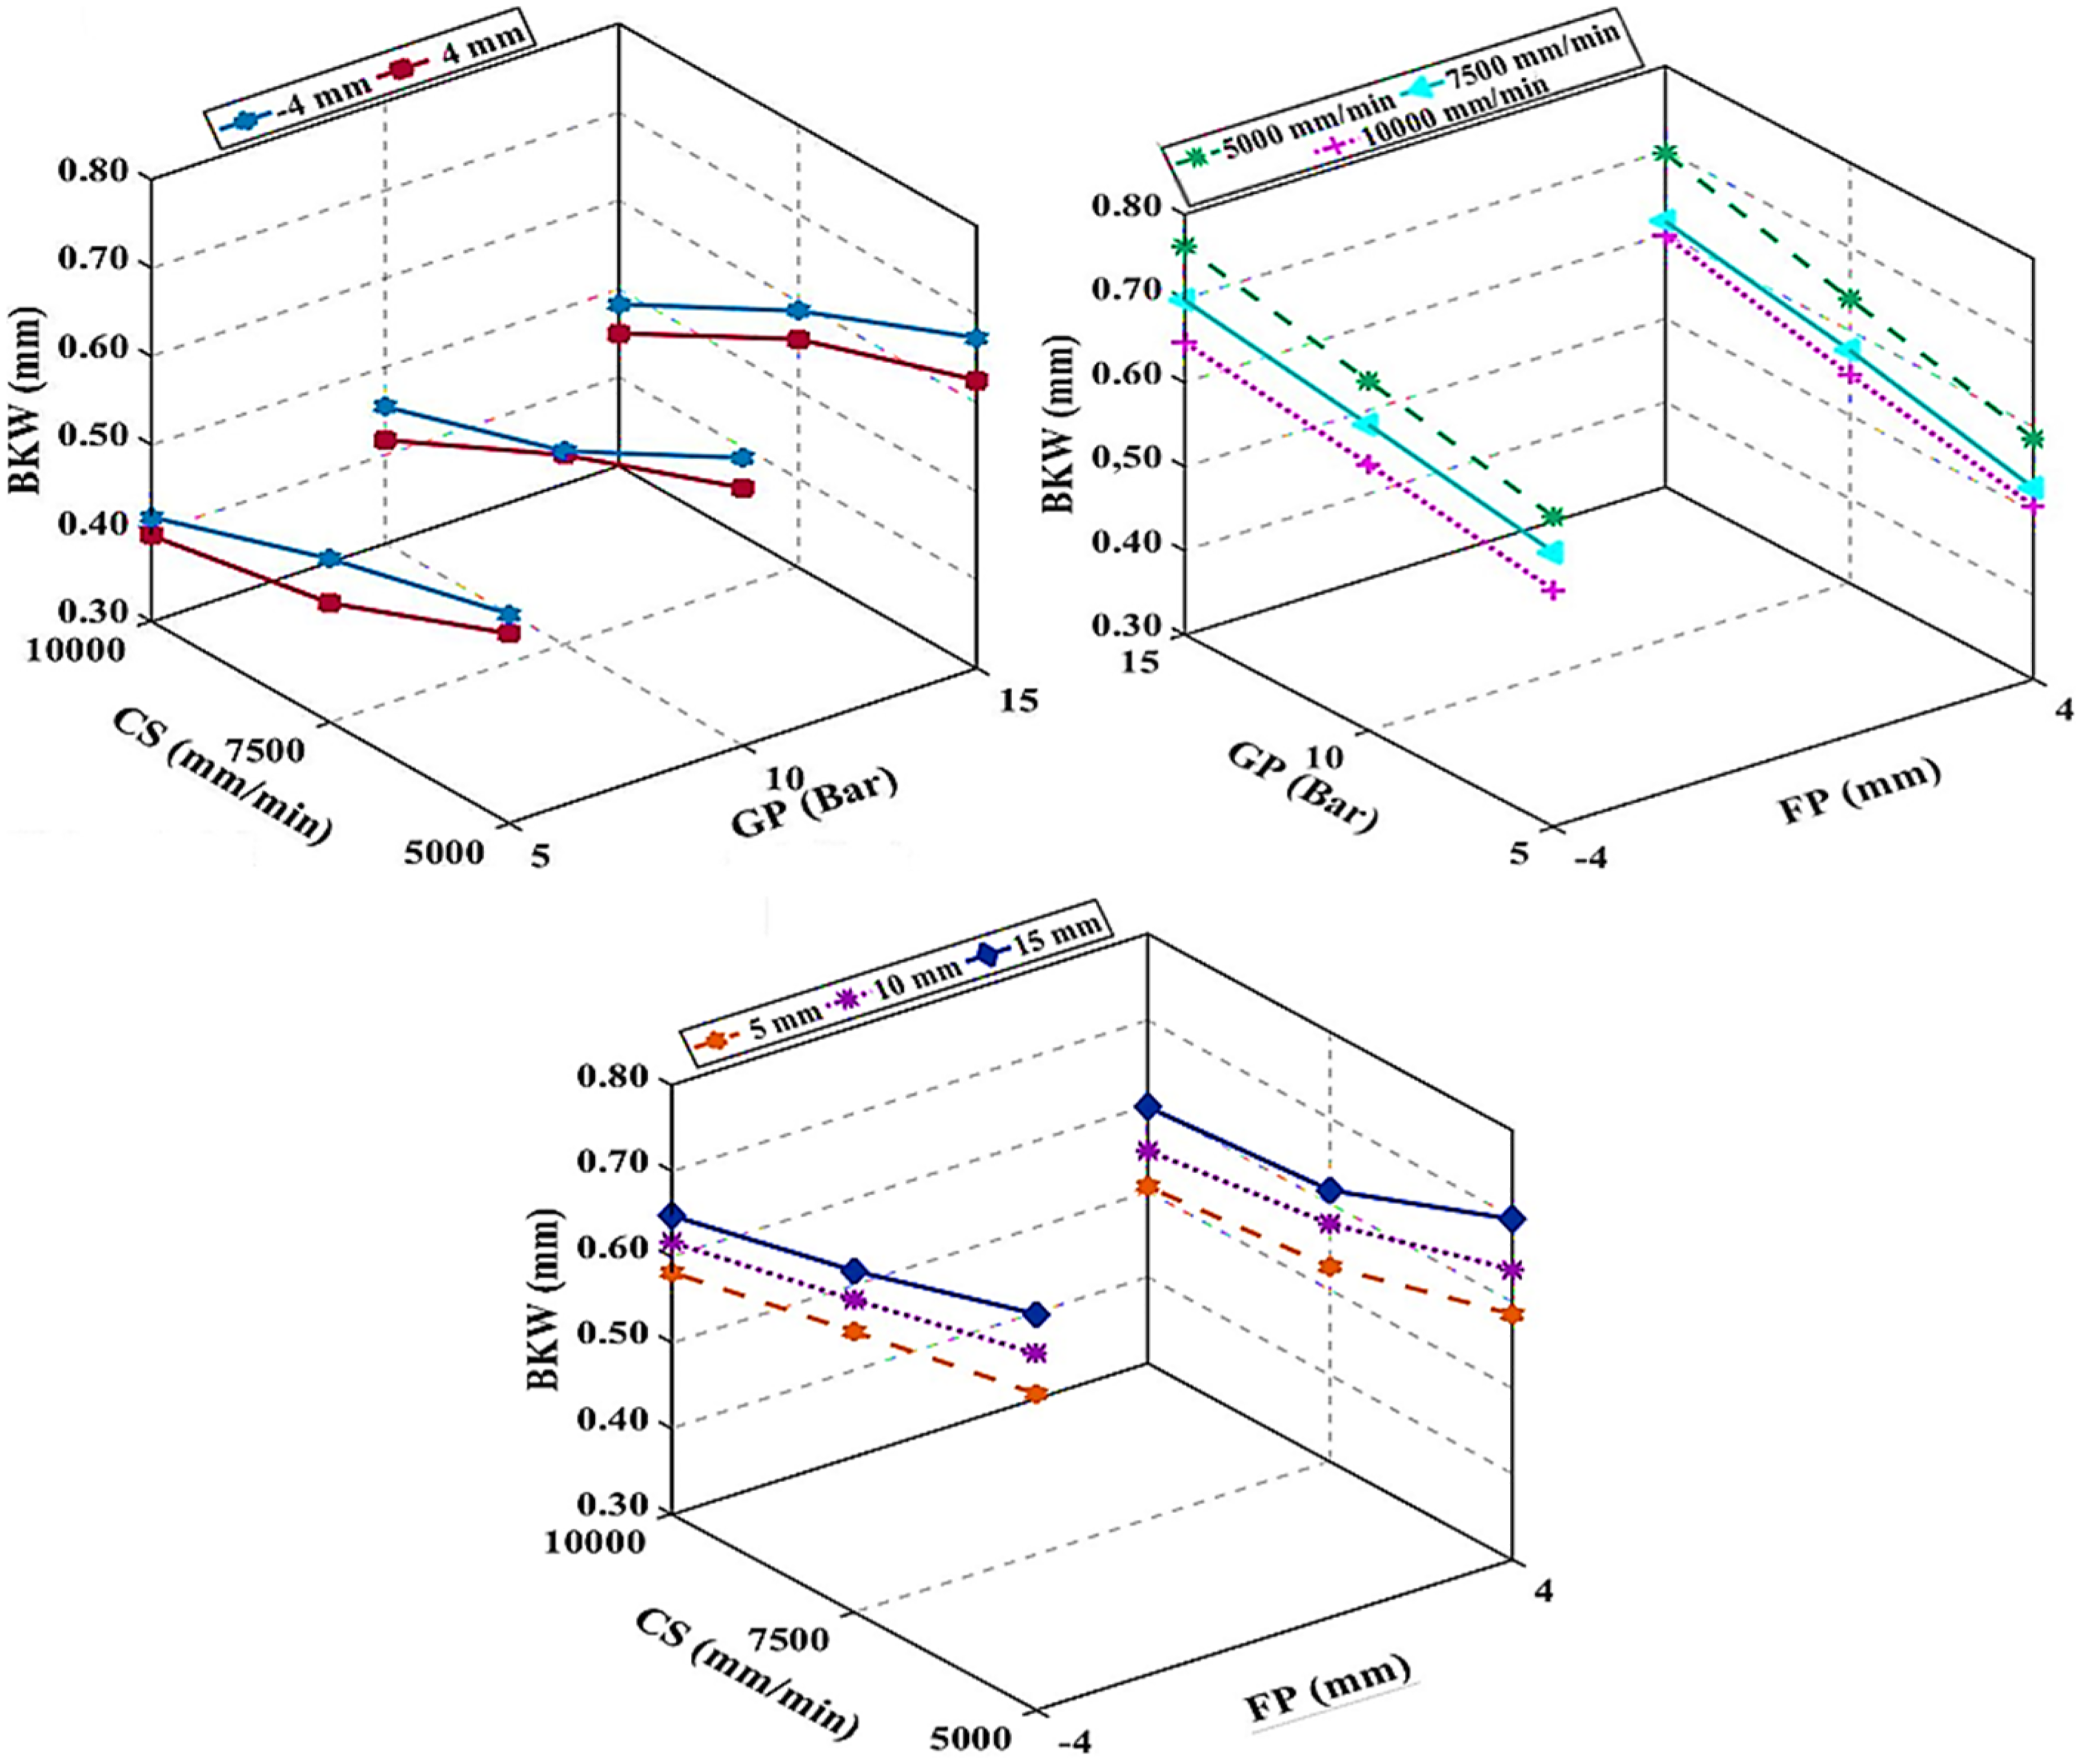
Lower kerf width change graph of cutting parameters.
When Figure 10 is examined, it is seen that there is a change between 0.418 and 0.674 mm in the lower kerf width depending on the cutting speed and gas pressure at the −4 mm focal point. When the test results were examined, the cutting speed of 5000 m/min at the −4 mm focal point and the lower kerf width was 0.537 mm at 5 bar gas pressure. At 5 bar gas pressure, the reduction in lower kerf width was calculated as 9.68% and 22.16%, respectively, by increasing the cutting speed from 5000 m/min to 7500 m/min and 10,000 m/min, respectively. At a cutting speed of 5000 m/min, the lower kerf width values increased by 16.57% and 25.58%, respectively, by subtracting the gas pressure from 5 bar to 10 bar and 15 bar, respectively. It was observed that the lower kerf width values for the 4 mm focal point varied between 0.397 and 0.626 mm. The lower kerf width was measured at 0.515 mm at a focal point of 4 mm, a cutting speed of 5000 m/min, and a gas pressure of 5 bar. By increasing the cutting speed from 5000 m/min to 7500 m/min and 10,000 m/min, the lower kerf width was reduced by 15.53% and 22.91%, respectively. At a gas pressure of 5 bar and a shear rate of 5000 m/min, increasing the gas pressure to 10 bar and 15 bar increased the lower kerf width of 14.95% and 21.55%, respectively. In all experiments performed at the 4 mm focal point, it was observed that the lower kerf width was formed on average 6.4% less than the −4 mm focal point. Figures 8–9 show that the upper and lower kerf widths decrease significantly with increasing cutting speed. With the increase in cutting speed, the interaction time of the laser with the workpiece decreases. This causes less molten material to form in the cutting zone. Thus, less material removed from the cutting zone results in lower kerf dimensions. 42 The reduction of the upper and lower kerf widths at high cutting speeds was similar to the literature.43,44 The study determined that the upper and lower kerf widths increased significantly with gas pressure.
High gas pressure causes the molten metal to be removed in large quantities from the cutting zone.17,45 Finally, it has been observed that forming the focal point within the workpiece significantly increases the upper and lower kerf widths. The formation of the focal point inside the workpiece causes the laser power to spread over a wider area, resulting in a wider kerf width. 46
ANOVA
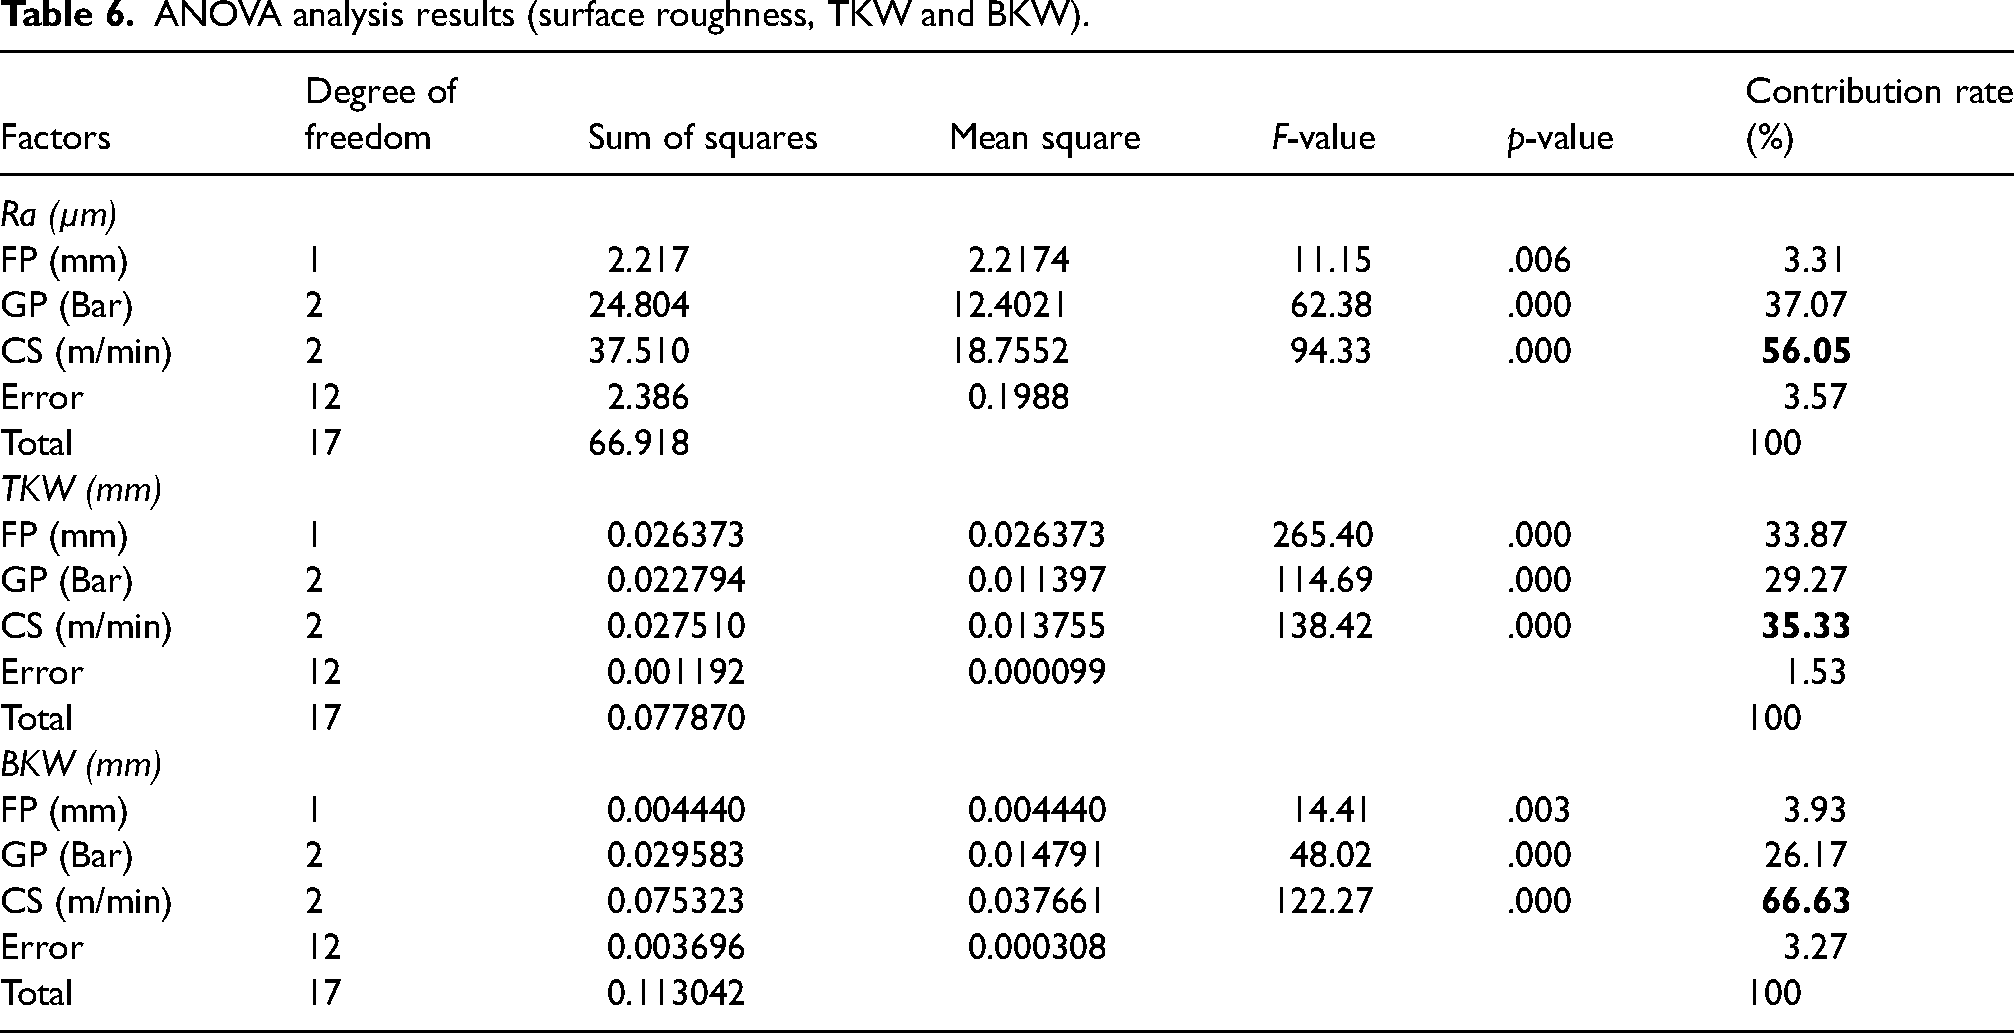
This part of the research determined the effect ratios of focal point, gas pressure and cutting speed on surface roughness, upper kerf width and lower kerf width. ANOVA analysis was performed to determine the effect rates. ANOVA analyses were conducted at 5% significance levels and with a 95% confidence level. 47 ANOVA analysis results are given in Table 6. Consequently, the computed impacts of laser cutting settings on the roughness were 56.05% cutting speed, 37.07% gas pressure and 3.31% focal point, respectively. The effect ratios calculated for the upper kerf width were 35.33% shear rate, 33.87% focal point and 29.27% gas pressure, respectively, while 66.33% shear rate, 26.17% gas pressure and 3.93% focal point for the lower kerf width, respectively.
ANOVA analysis results (surface roughness, TKW and BKW).
Multi-response optimisation with GRA
GRA determined the ideal laser cutting parameter order for AISI 304 stainless steel. The study aims to reach the lowest surface roughness values, upper kerf width and lower kerf width values. According to the test results, the lowest surface roughness value (A1B2C2) was obtained in the fifth test, while the lowest upper and lower kerf width was obtained in the 12th test (A2B1C3) (Table 3).
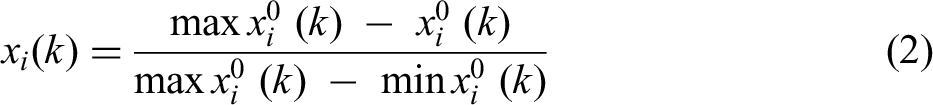
Taguchi-based GRA results for surface roughness, upper kerf and lower kerf width values are given in Table 7. In the GRA performed in the first stage, our data were normalised between 0 and 1 by using equation 2 for the lowest surface roughness and the upper and lower kerf widths simultaneously. After the normalisation process, the GRC of the values obtained for the surface roughness, upper and lower kerf width were calculated in equations 3, 4, 5 and 6, respectively. Equation 7 was used to determine the effects of surface roughness, top and bottom kerf width on performance and GRD was calculated.
Grey association analysis results for Ra, TKW and BKW.
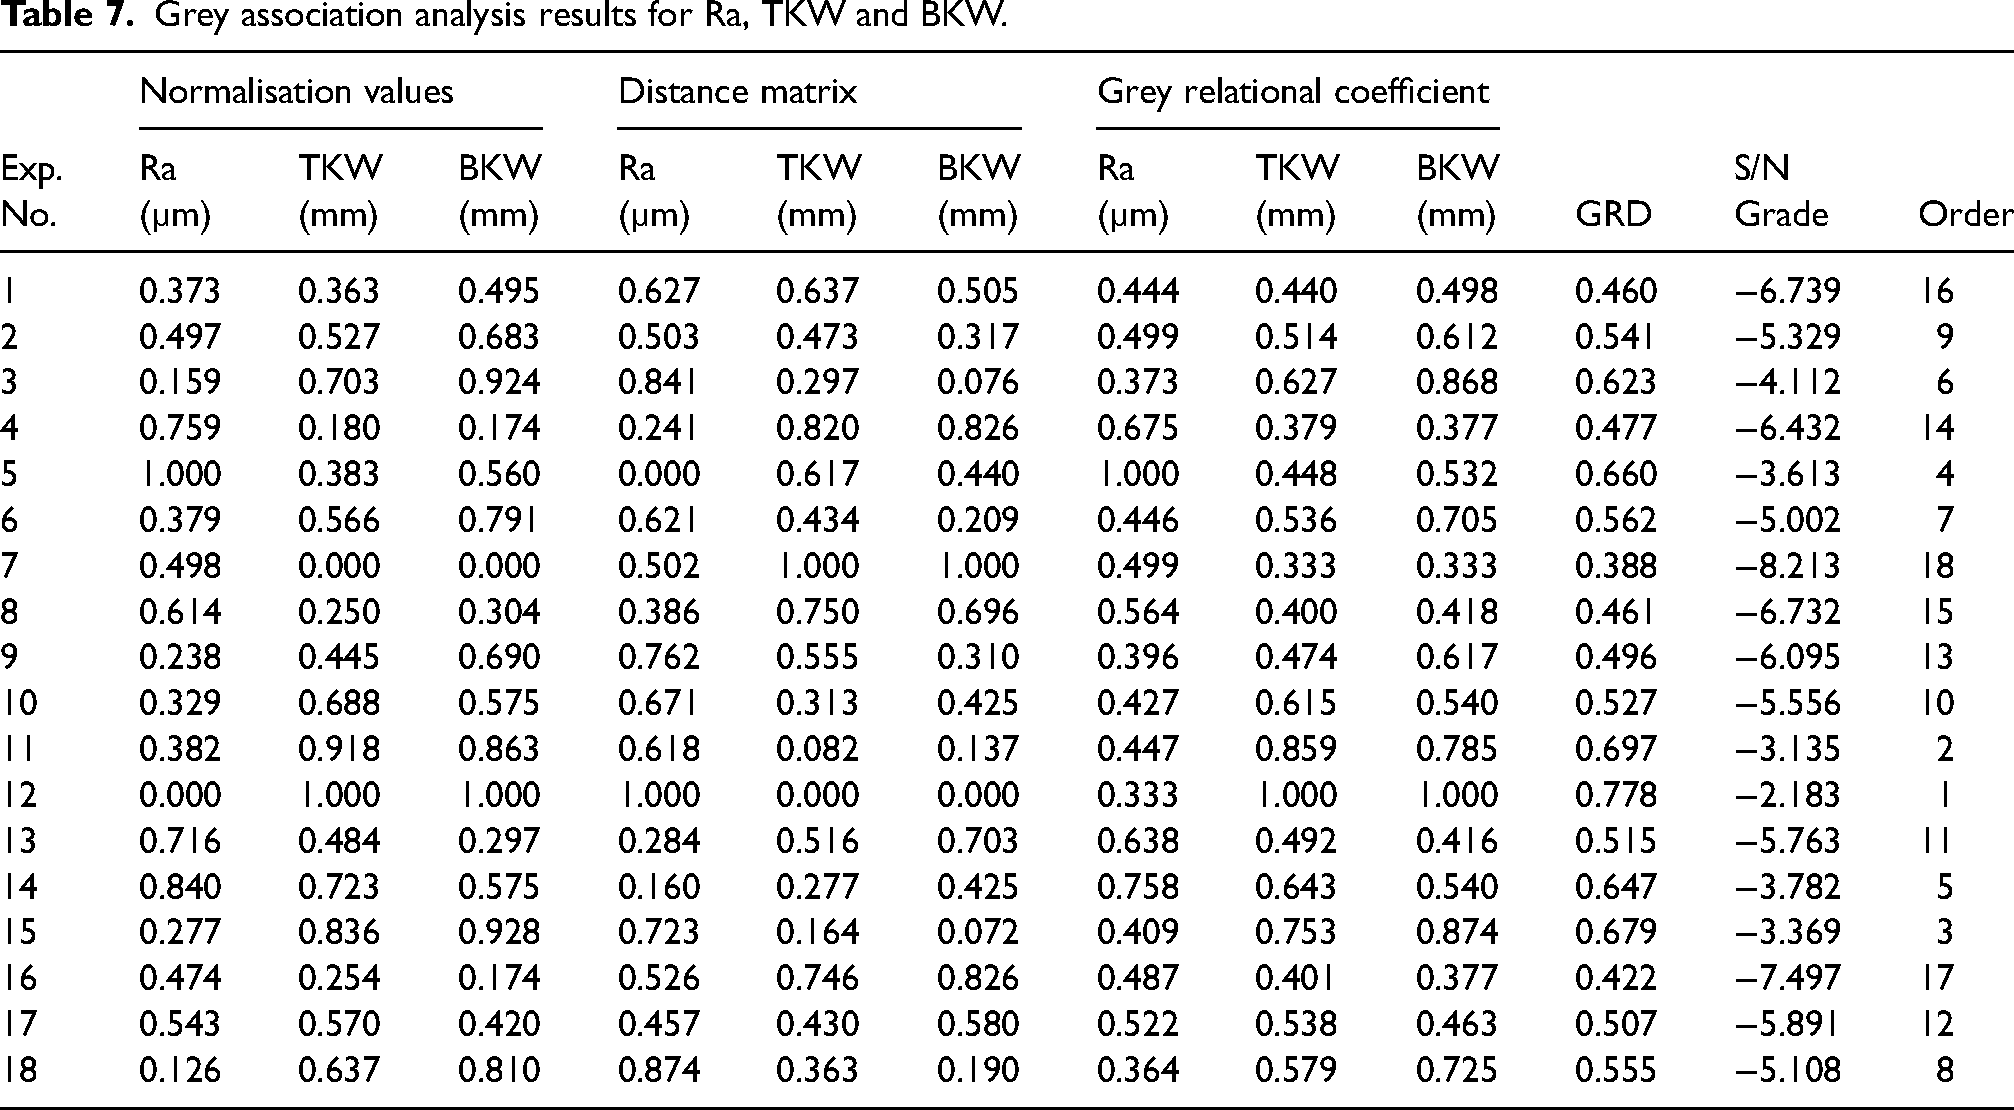
High GRD is the cause of a substantial connection between the experimental and post-normalisation outcomes. A high GRD value indicates that the laser cutting parameters are approaching their optimum level. In addition, Table 8 gives optimum levels for GRA.
A grey relational grade response table.
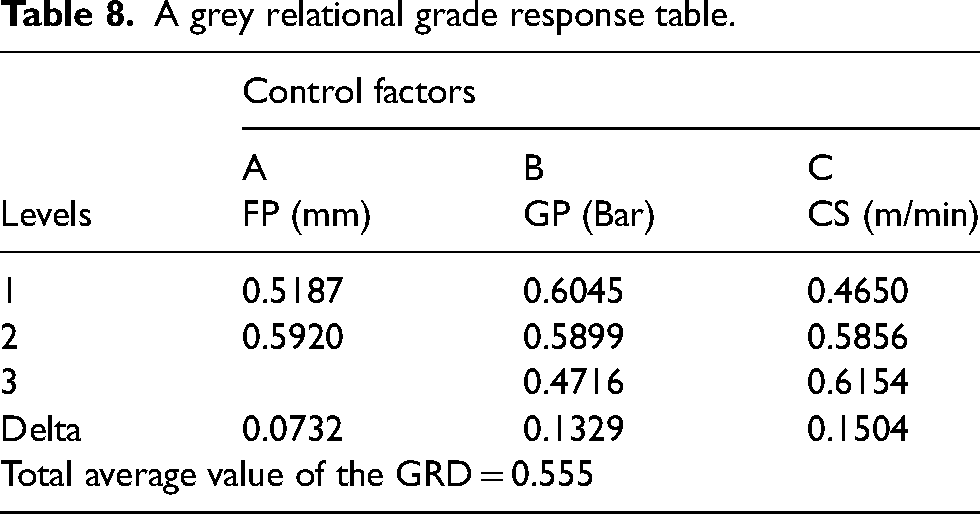
The ideal values are indicated in this table by the maximum values that correspond to each parameter. Accordingly, according to the GRA results, it is seen that the optimum machining parameter levels for surface roughness, upper and lower kerf width are obtained with A2B1C3 (4 mm, 5 bar and 10,000 m/min). In addition, as seen in Table 8, the total mean GRD of 18 experiments was calculated as 0.555. The graph of the mean S/N ratios for GRD of the obtained results is shown in Figure 11.
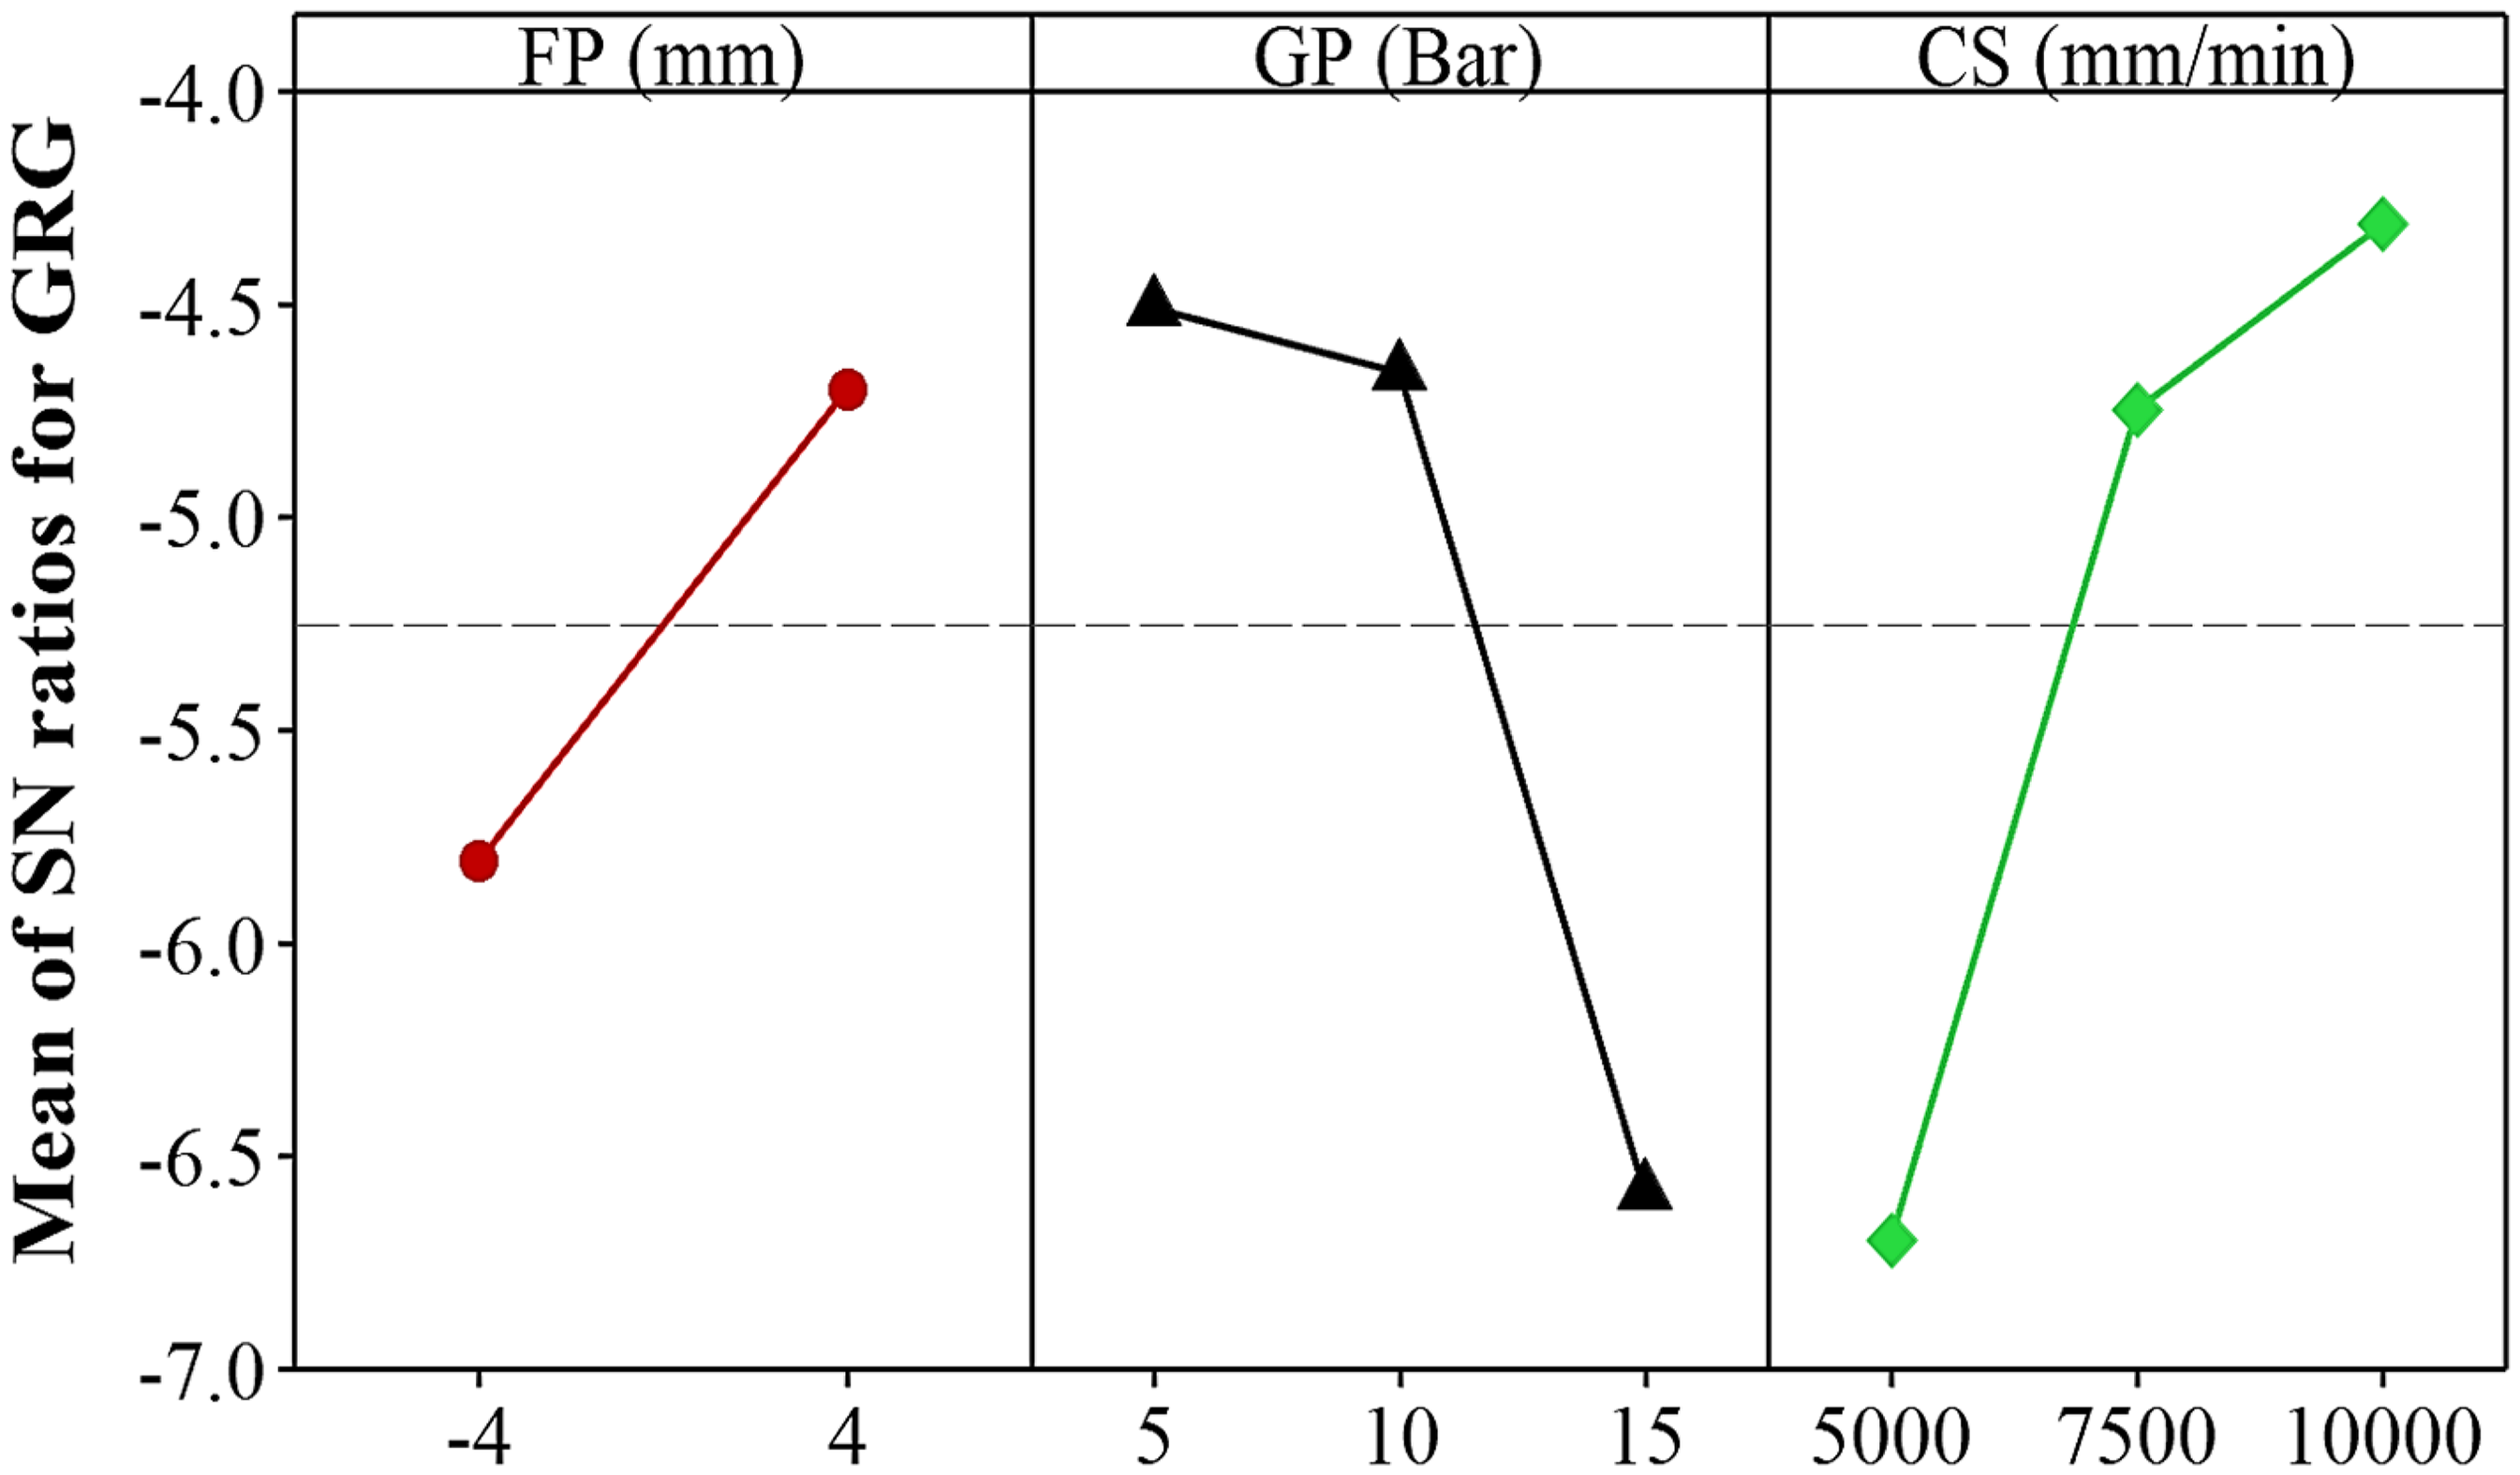
Graph of mean S/N ratios for GRD.
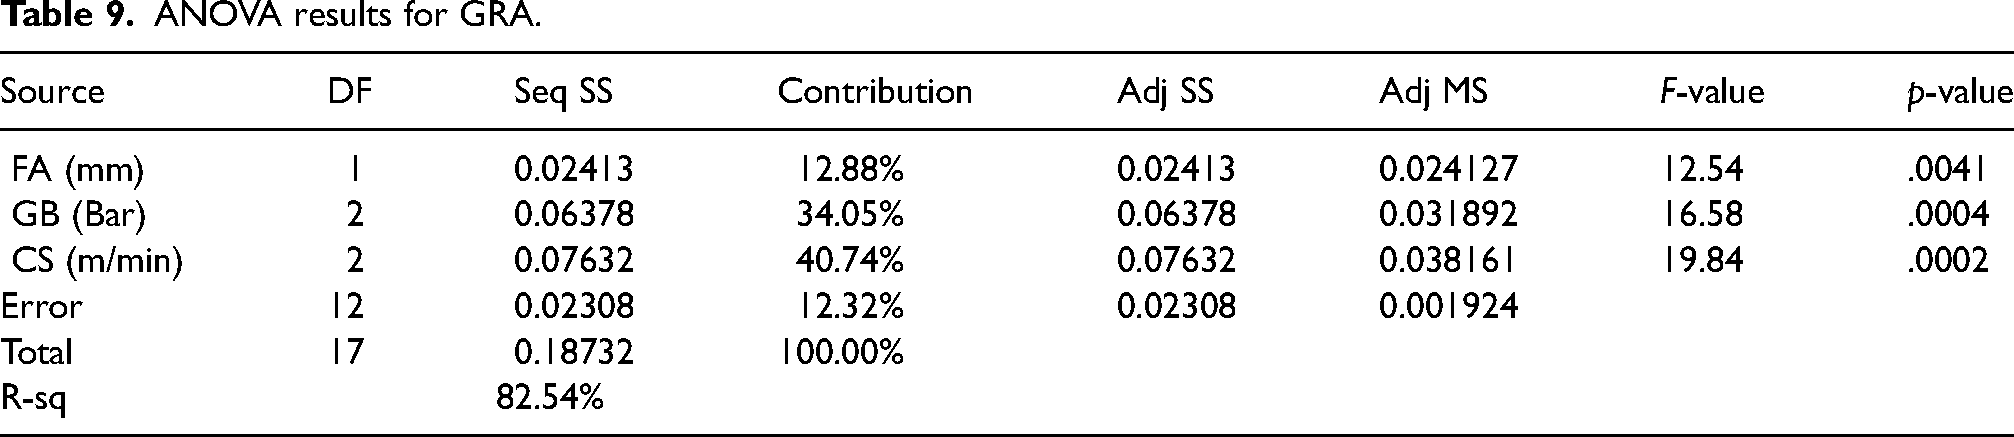
ANOVA analysis was performed at a 95% confidence level and 5% significance level to determine the effect levels of the parameters. 48 The results of the ANOVA performed are presented in Table 9. Table 9 shows that the most effective laser cutting parameter on GRA is cutting speed at 40.74%, followed by gas pressure at 34.05% and focal point at 12.88%, respectively.
ANOVA results for GRA.
Validation of GRA optimisation
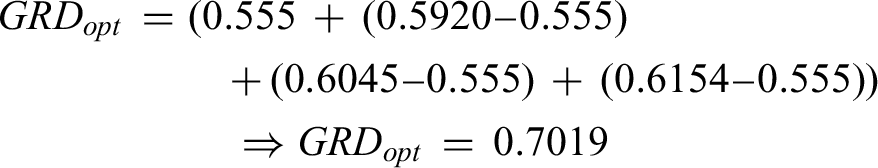
In the last part of the study, validation experiments are carried out for the experimental results at the optimum laser cutting parameter levels determined and the experimental results at randomly selected levels to check the accuracy of the Taguchi-based GRA. First, the GRDopt value was estimated using equation 9. The mean of the TGRA values given in equation 9 is the highest of the GRD values in Table 6. Equation 9 calculated the GRDopt value as 0.7019.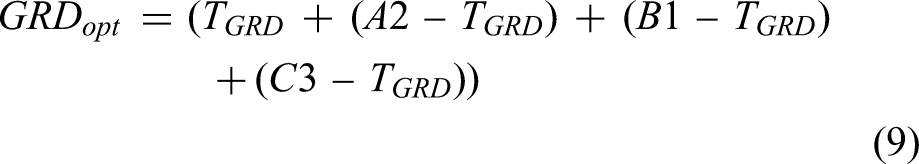
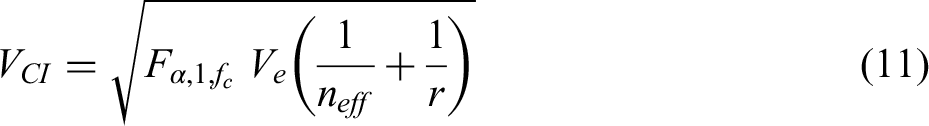
For this, equations 10 and 11 were used to compute the confidence interval (CI) for GRD. N is the total number of experiments in equation 10, and Tdof is the GRD's total degree of freedom; in equation 11, Fα,1,ƒc is 95% confidence level, α is the significance level, ƒc is the degree of freedom of error, Ve error variance, neff is the number of repeated events, and R represents the number of replicates for validation experiments. The CI value for GRD was calculated as 0.07775 by applying equation 11.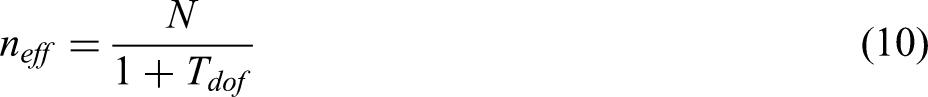
To validate the Taguchi-based GRD results, a comparison was made between the experimental and estimated results and the optimum GRD value of 0.7019 was calculated.
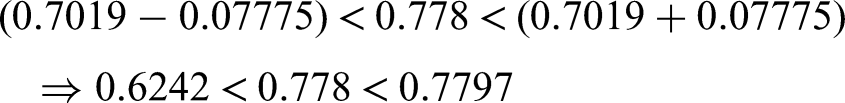
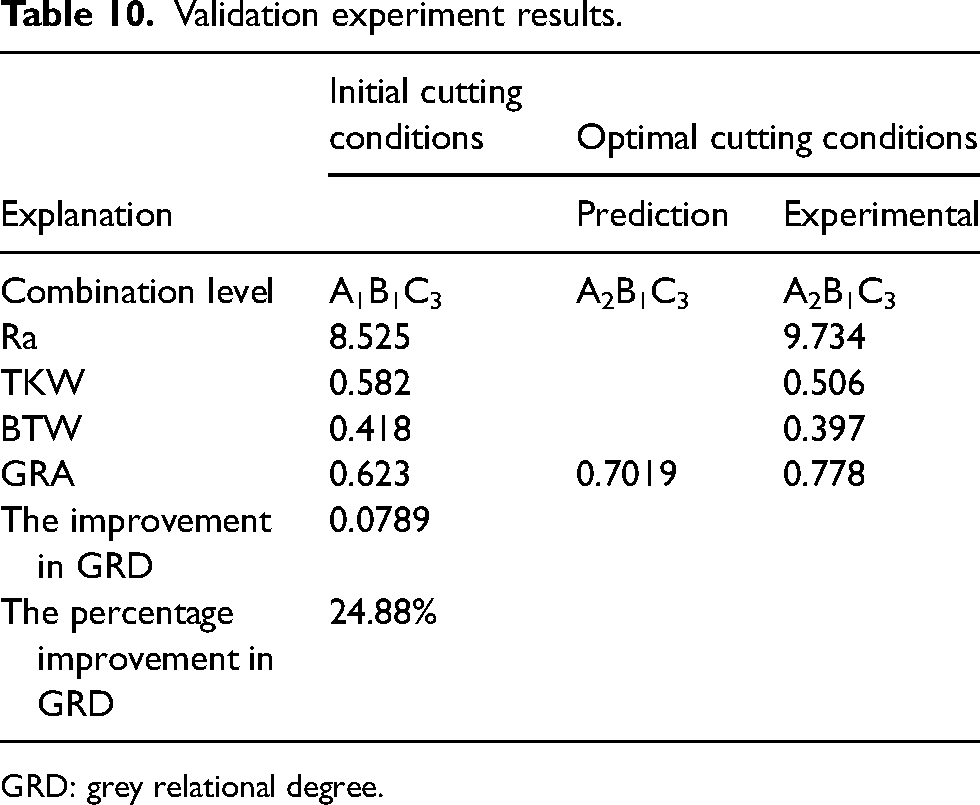
The comparison between the GRD (0.778) at the optimum level reached as a result of the experiments and the GRD (0.7019) results estimated as a result of the calculations is shown in Table 8. The change from the A1B1C3 factor combination randomly selected from Table 8 to the A2B1C3 optimum factor combination obtained as a result of the experiments was 0.0789. This showed a 24.88% improvement in GRD. The result obtained showed that the optimisation was successful (Table 10).
Validation experiment results.
GRD: grey relational degree.
As a result of the GRA based on the experimental data, the GRD value in the A2B1C3 experimental combination was 0.778, while the predicted GRD value was 0.7019. The percentage error deviation rate between the two values was calculated using equation 1.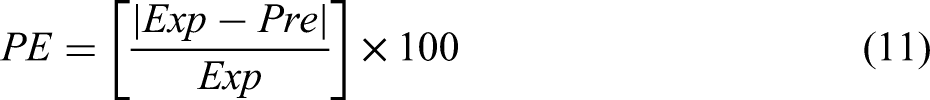
As a result of the calculation, the percentage error deviation rate between the two values was determined to be 9.78%. Li and Tsai focused on optimising the laser cutting of electronic printed circuit board carrier substrates using GRA. They observed that the optimum laser cutting parameters used in the experiments were successfully obtained by GRA. Karthikeyan et al. focused on selecting optimum parameters using GRA to minimise kerf quality, such as kerf width and kerf taper, during CO2 laser cutting of mild steel. He stated that the results obtained reflect the actual results regarding kerf width and kerf taper with GRA.49,50 As a result of the literature review, it has been observed that Taguchi-based GRA application increases work efficiency in studies with more than one output parameter.
Conclusions
The effects of cutting parameters on surface roughness
47
,
51
upper and lower kerf width were investigated both experimentally and statistically in cutting AISI 304 stainless steel by the laser cutting method. The results obtained after the experiment with input parameters are summarised below.
The best surface quality was measured as 2.133 µm at −4 mm focal point, 10 Bar gas pressure and 7500 mm/min cutting speed (A1B2C2). The worst surface quality was realised at 9.734 µm at a 4 mm focal point, 10 Bar gas pressure and 10,000 mm/min cutting speed (A1B2C2). The lowest upper and lower kerf widths were 0.506 mm and 0.397 mm, respectively, at the 4 mm focal point, 5 Bar gas pressure and 10,000 mm/min cutting speed (A2B1C3). Maximum upper and lower kerf widths were obtained as 0.762 mm and 0.674 mm, respectively, at the focal point of −4 mm, at a gas pressure of 15 Bar and a cutting speed of 5000 mm/min (A2B1C3). For surface roughness, upper and lower kerf width, the most effective laser cutting parameter was the cutting speed with an additive of 56.05%, 35.33% and 66.33%, respectively. After Taguchi-based GRA in experiment 12 (A2B1C3), ideal laser cutting parameters were reached at a 4 mm focal point, 5 Bar gas pressure and 10,000 mm/min cutting speed. It has been determined that in laser cutting of AISI 304 stainless steel, processing under the workpiece surface of the focal point positively affects the surface roughness value.
Footnotes
Declaration of conflicting interests
The authors declared no potential conflicts of interest with respect to the research, authorship, and/or publication of this article.
Funding
The authors received no financial support for the research, authorship, and/or publication of this article.