
Abstract
This study examines factors that influence firm forecasting regarding their labour expansion in Vietnam. Conventional wisdom has it that foreign-owned and large private firms make more accurate forecasts since they have more resources and experience than their smaller and state-owned counterparts. However, this study empirically shows that state-owned and small firms make more accurate forecasting values. There are two possibilities that can explain this counterintuitive result: (1) the institutional incompleteness in the post-communist economy and (2) systematic underestimation of their own performance by foreign and large private firms, which results from the institutional complexity in Vietnam. These unique findings provide valuable information for both academia and practitioners.
Keywords
Introduction
Forecasting is an important task when doing business (Cassar, 2014) as it reflects organizational learning about the surrounding environments (e.g. competition and industry movements). Of the different types of forecasting, labour expansion forecasting is particularly important because it strongly affects the planning and recruitment of the workforce for future operations (Efendic et al., 2015). Extant literature suggests that firm resources (such as finance, human and management) play an important role in determining forecasting accuracy. For example, resources help reduce market uncertainties by facilitating investments in data collection, analysis, interpretation and implementation (Cummings et al., 2006). Entrepreneurs who have sufficient resources to facilitate rigorous analyses will likely be more well-informed, able to make more accurate forecasts, thereby responding more effectively to environmental uncertainties than those who do not.
Given Vietnam’s institutional complexity (Do et al., 2019a, 2019b), this study draws upon both resource-based theory (RBT) and institutional theory (IT) to measure how salient firm resource abundance is to forecasting accuracy. Two variables are utilized: firm ownership and firm size (O’Toole and Newman, 2017). RBT states that the resources advantages of foreign-owned and large domestic private (FOLDP) firms may assist them in making more accurate forecasts than state-owned and small private (SOSP) firms (Driffield and Love, 2003). This study tests this proposition by analysing a large and representative data set of more than 100,000 firms in Vietnam. Intriguingly, the study’s findings reject the proposition, finding that it is SOSP firms rather than FOLDP ones that are the most accurate forecasters. Given this counter-intuitive finding, this study further examines the nature of the inaccuracies made by FOLDP firms. The findings suggest that their forecasting discrepancy derives mainly from them underestimating their future labour expansion, thereby prompting the speculation that forecasting variation may not be a simple function of resource abundance but may also derive from the institutional complexity in which the organization is embedded.
In explaining this paradox, this study draws on IT (DiMaggio and Powell, 1991) to argue that institutions may influence business activities by rationalizing which activities are legal/legitimate and which ones are not. Entrepreneurs/managers are likely to select legitimized activities even if the choice reduces their efficiency (DiMaggio and Powell, 1991). Thus, although informal institutions (e.g. corruption and the relationship-based principle of doing business in post-communist economies) are not entrepreneurship-friendly, entrepreneurs have no choice but to accept these (negative) norms and practices to secure their business survival (Nguyen et al., 2018). Furthermore, their cognizance of these unfavourable institutional environments may impel them to deliberately set a lower-than-expected forecasting value.
It is also noteworthy that FOLDP firms with strong financial capabilities may make use of the weaknesses of the institutional system (e.g. corruption) to build a back-door relationship with politicians (Du et al., 2015). This kind of relationship may enable FOLDP firms to create a source of competitive advantage that is unavailable to smaller firms and which may be a key tool for boosting business expansion without improving forecasting values. Small businesses, being resource constrained, may lag behind their larger counterparts in the race to gain political alliances. This inferiority restricts small firms’ expansion and therefore their actual expansion does not significantly exceed their forecasting values.
Another interesting proposition is whether the incompleteness of the post-communist institutional systems may influence the accurate forecasting of state-owned firms (SOEs). In contrast to small businesses, whose expansion is constrained by external institutional obstacles (e.g. discrimination from state-owned banks), the expansion of SOEs is internally constrained in that managers of SOEs intentionally restrict their expansion. This behaviour can be influenced by the incentive structure of the post-communist formal institutional system, which is not geared up to rewarding the managers of SOEs for exceeding set targets (Dana, 1994).
Thus, IT theory recognizes that the growth of firms in developing countries is better understood when examined in their historical and institutional contexts (e.g. Nguyen et al., 2018). By emphasizing the institutional environment and its importance to addressing the experience of organizations in a particular setting, IT provides a highly relevant theoretical framework that underpins how firm ownership and size may influence the accuracy of forecasting. Specifically, accuracy of forecasting is determined neither by how well a firm understands its markets nor its ability to anticipate the coming trends, but rather by how well the firm can exploit the weaknesses of the institutional systems to achieve its objectives. By highlighting that the institutional environment potentially influences the accuracy of forecasting, this study is of importance to both management scholars and organizational practitioners who recognize that improving forecasting accuracy is a prerequisite for adequate preparation for business expansion.
Hypothesis development
Business forecasting is principally a process of quantifying uncertainties (McMullen and Shepherd, 2006) that involves assessing (1) market conditions, business opportunities, technologies and business landscapes that may affect future outcomes, and (2) entrepreneurs’ self-evaluated abilities in dealing with unknowns to meet preset expectations (Cassar, 2006). While the former is fairly explicit and could be alleviated by investing in forecasting facilities, the latter is more implicit, being concerned with entrepreneurs’ cognitive self-assessments (Baron, 2007). As such, this study takes into account both RBT and IT to evaluate the relative importance of these uncertainties in forecasting.
RBT proposes that firms abundant in resources are able to make more accurate forecasting than firms without sufficient resources (Kapler, 2007). Financial and management resources might improve forecasting accuracy by facilitating forecast-related activities, such as data collection, analysis, storage and usage. For example, firms with an enterprise resource planning system can make more accurate forecasting than firms without the system (Issa and Kogan, 2014). Experience is also an essential resource that can greatly improve forecasting accuracy. Firms with abundant industry experience are exposed to a larger pool of information, which is an important input of forecasting activity (Cassar, 2014). As such, RBT suggests that resource abundance is positively associated with forecasting accuracy.
While resources may reduce market uncertainties by making managers well informed about market conditions, their inner uncertainties are influenced by their cognitive patterns, which serve as a function of the surrounding institutional settings (Forbes, 2005). IT proposes that entrepreneurs’ cognition is a product of regulative forces (laws, rules and policies) and normative forces (values, norms and beliefs) (DiMaggio and Powell, 1991). In post-communist economies, the normative environments are not entrepreneurship-friendly because the prevailing values are those such as risk-aversion, relationship-based principles and collectivism (Dana, 1994). Moreover, the regulative infrastructure (legislation) is underdeveloped and is intrinsically biased against the private sector (O’Toole and Newman, 2017). Also, a weak formal legal framework allows local authorities to have substantial room to interpret central laws and regulations to their own end rather than for the social good. In such inefficient institutional settings, managers will adjust (scale down) their expected growth rates since the perceived transaction costs may discourage them from targeting the optimal level of expansion.
RBT and forecasting accuracy
Coupled with the extant literature regarding cut-off points for the degrees of resource abundance, this study classifies firms by types of ownership and size (Du and Girma, 2012). Firm ownership may significantly influence forecasting ability because each type of ownership has different pools of resources and experience. Foreign-owned enterprises (FOEs) have substantial resources to facilitate forecasting activities (Blomstrom, 1986), including advanced management skills, appropriate organization structure and skilful human resource. With a comprehensive set of resources at hand, FOEs can make more accurate forecasting. Foreign firms set value on forecasting activities because doing business outside of one’s own country is naturally riskier (Gueorguiev and Malesky, 2012). The costs of inadequate preparation and insufficient resource reservation entail additional time, efforts and finance devoted to ex-post adjustments. As such, FOEs devote attention to improving their ex-ante forecasting accuracy.
To illustrate this further using RBT, it is argued that domestic firms possess fewer facilities and experience to conduct rigorous forecasting activities. This is particularly so for SOEs who operate along centrally planned ideological lines, rendering forecasting activities redundant (Dang, 2013). Therefore, RBT suggests that foreign-owned firms make the most accurate forecasting, followed by domestic private firms, while SOEs make the least accurate forecasting.
This study expects a similar pattern to apply to firm size, which is another popular measure of resource abundance. In line with RBT, larger firms are expected to make more accurate forecasting because they are more abundant in resources than their smaller counterparts. Also, larger firms possess more experience since they position themselves at a higher level on the industry-learning curve than smaller firms do (Du and Mickiewicz, 2016). Moreover, large firms are somewhat inflexible and cannot adapt to changes as quickly as new ventures can. It is therefore difficult for them to meet unexpected market demands unless these were included in the forecast (Gilliland, 2017).
In a nutshell, the RBT suggests a pecking order of forecasting ability among different types of firm ownership and firm size, whereby forecasting accuracy is positively associated with resource abundance. However, this may not hold true in weak institutional environments, such as those in developing countries. This is especially the case where the organization is embedded in an environment with high institutional complexity, such as may be found in Vietnam.
IT and forecasting accuracy
The new neo-institutionalism offers non-economic explanations for organizational behaviours (Bruton et al., 2010). It thus addresses the irrational decisions of economic agents, which the neo-classical models cannot. In the context of this study, it is argued that SOEs may make a set of irrational (i.e. non-optimal) decisions that allow them, out of all the types of ownership, to reach the most accurate forecasting values. First, rather than setting business expansion goals that challenge themselves, SOEs’ growth targets tend to be relatively conservative and easily achievable. Du and Girma (2012) point out that the political, regulatory and financial institutions in emerging countries are intrinsically biased towards the state sector. These (biased) institutional arrangements are designed to provide SOEs with several privileges and resources while entailing no additional requirements of performance and growth (Gan, 2009). As a result, SOEs typically face inadequate competition pressure, allowing them to set a relatively conservative growth rate.
Second, agency costs, due to ineffective monitoring systems, may also impact the way SOEs’ managers perceive the functions of forecasting. The managers of SOEs are inclined to set conservative objectives that guarantee they can achieve their preset goals at the end of the term (Kalra, 2015). This behaviour not only restricts the managers from striving for optimal growth but also discourages innovation and productivity within the firm (Girma et al., 2009). As this behaviour becomes more common, it gradually establishes a norm (practice of doing business) that adversely affects the perceived abilities of the managers of SOEs to deal with the unknown (Forbes, 2005). Specifically, the managers who habitually do not pursue optimal objectives may lose the confidence in their ability to pursue ambitious goals in the future (Matthews et al., 1994).
Third, SOEs have little incentive to surpass preset goals once these have been reached because of their poor and loose monitoring systems, which primarily occur because of the significant informational asymmetries between the owners of SOEs (i.e. the people) and the management (i.e. the assigned officials from the central government) (Tong, 2009). These institutional shortcomings pave the way for the managers of SOEs to manipulate their powers towards serving their private interests instead of pursuing business expansion. This is especially true in the case of the post-communist economies, where the performance of SOEs is judged to be best when they achieve the set goals proposed by the higher-level authority (Hoang, 2016). Thus, the combination of a poor incentive structure with ineffective monitoring systems may restrain the managers of SOEs from striving for higher-than-assigned achievements.
In short, SOEs in post-communist economies are inclined to set conservative forecasting values because of the incompleteness in the institutional settings. More importantly, the formal institutions do not motivate SOEs to overreach their preset goals but rather to regard these as a ceiling, even where the opportunity exists to achieve higher levels of expansion. SOEs can therefore meet their planned schedule with minimum forecasting errors and will even forego business opportunities to do so. On this basis, this study hypothesizes the following:
Rooted in insights from the IT, it is argued that small firms can make more accurate forecasting than large ones. There are several important reasons that help explain this mechanism. First, small firms tend to establish relatively achievable goals for their business expansion. This behaviour relates to the informal institutions embedded in the post-communist society (McCulloch et al., 2013). Dana (1994) demonstrates that Vietnamese entrepreneurs are exposed to values such as collectivism, failure-aversion and risk-aversion, and thus they are inclined to be more conservative and less ambitious in setting their goals for business expansion. Following this logic, entrepreneurs in such environments tend to set attainable rather than optimal targets of business expansion.
It is noteworthy that both SOEs and small firms are keen to set conservative forecasting values. However, the nature of the decision-making may vary between them. SOEs set low growth expectations because of the incompleteness in the formal institutional frameworks (i.e. the weaknesses in the laws and monitoring systems). Meanwhile, small businesses set low growth expectations primarily because of the unfavourable informal institutions (i.e. the communist values and beliefs that are unfriendly to entrepreneurship).
Entrepreneurs may set a conservative forecasting value because their cognitive pattern is institutionalized. In other words, they take a low goal of business expansion for granted because this is the prevailing norm of doing business in the economy. They are inclined to accept this conservative practice so as to gain legitimacy for their activities. However, it is argued that not all entrepreneurs’ mindsets are institutionalized; some entrepreneurs’ cognitive patterns may outgrow the scope of institutional constraints (Lim et al., 2010). However, these entrepreneurs, being aware of the intrinsic discriminations against entrepreneurship in their surrounding environments, are no less reluctant to set a significantly higher goal than their conservative counterparts. In other words, whether they do so out of habit or because they are more sensitive to the realities of their environments, the net result remains the same: entrepreneurs in such environments set suboptimal objectives for growth.
Like SOEs, small firms tend to not surpass their preset goals. While SOEs purposely maintain their labour size at the preset forecasting value, small businesses may be impelled to do so because they cannot mobilize sufficient resources to support further development. Du et al. (2015) claim that legal discrimination restricts the scope of operations in the private sector and that there is insufficient policy support for small businesses. Additionally, small firms suffer from financial discrimination that may restrict them from accessing formal finance (bank loans).
Moreover, the entrepreneurship literature suggests that small businesses face age and size liabilities, including a lack of track records, insufficient collaterals and inadequate social and political capital for building ‘back-door’ relationships with local authorities (Carreira and Silva, 2010; Du et al., 2015). These constraints may restrict small businesses’ expansion to their modest forecasting values. Therefore, unless the (legal and financial) institutional environments become more entrepreneurship-friendly, small firms are likely to have difficulty in outperforming their preset goals. In short, small firms tend to set conservative expansion goals due to the limitations of the informal institutions, and they cannot exceed these goals because of the limitations imposed by the legal and financial institutions. Therefore, this study proposes the following:
Data and methodology
Data
This study tests the proposed hypotheses using the Enterprise Annual Survey conducted by the Vietnam General Statistics Office (GSO). The data set provides comprehensive and rich firm-level information, including ownership and owners’ characteristics, firm employment, capital structure and performance for manufacturing, mining and service industries.
In 2012, in addition to the standard survey, there was a supplemental questionnaire concerning firm self-estimation of their expansion for the coming year (2013). Specifically, surveyed firms were required to forecast their next year’s labour size expansion (the percentage growth of the number of employees). This information is used to construct this study’s independent variables.
The GSO Annual Statistics Books are used to collect control variables at the provincial level. The books include information about provincial population, consumption power, labour supply, population density and distance from a province to the closest municipal city (business and political centre).
Variables and summary statistics
Dependent variables
The dependent variable of interest is firm forecasting variations with regard to their future labour expansion. Specifically, the forecasting variation variable is the difference between the actual percentage growth in the number of employees and the forecast percentage growth in the number of employees. Given the seven levels of expected labour size expansion specified in the 2012 survey, this study calculates the corresponding seven levels of actual labour size expansion using the 2013 data, one year after the firms made their forecasts. It is noteworthy that for level (4) – unchanged labour size – this study allows the actual change of the number of employees to vary in the range of (−0.5%) to 0.5%; this is a relatively insignificant change that allows for the fact that most firms do not maintain the exact same number of employees over a 2-year period. This setting allows the forecasting variation variable to be constructed, being the pairwise difference between the actual labour size and the forecast labour size (actual values minus forecast values). The forecasting variation variable takes values from (−6) to 6 as the actual labour size and the forecast labour size takes values from 1 to 7.
Despite its meaningfulness, the forecasting variation variable is of little application to regression analysis because of the structure of its values where zero – the middle value – is the most desired (i.e. the best outcome). This problem can be resolved by taking the absolute value of the forecasting variations to construct the absolute forecasting variation variable. This variable takes values from 0 to 6, with higher values reflecting larger forecasting errors (whether these be over- or underestimation). Besides the general forecasting variation, however, it is important to distinguish between overestimation and underestimation. Therefore, this study constructs the following variables: Overestimation takes the absolute values of the forecasting variation variable’s negative values, that is, converting [−6, 0] to [0, 6]. Meanwhile, Underestimation takes positive values [0, 6] of the forecasting variation variable. In general, the construction of the dependent variables is summarized in Table 1.
Values of dependent variables.
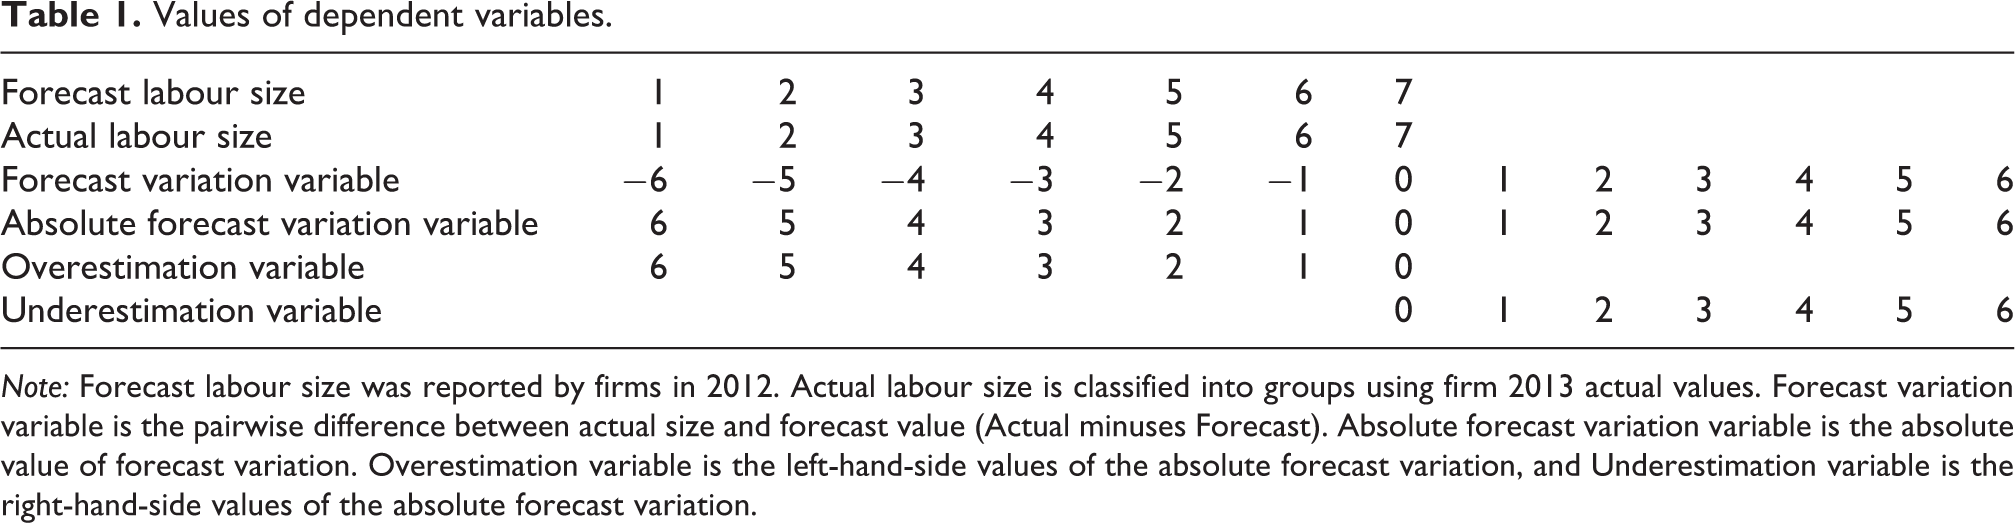
Note: Forecast labour size was reported by firms in 2012. Actual labour size is classified into groups using firm 2013 actual values. Forecast variation variable is the pairwise difference between actual size and forecast value (Actual minuses Forecast). Absolute forecast variation variable is the absolute value of forecast variation. Overestimation variable is the left-hand-side values of the absolute forecast variation, and Underestimation variable is the right-hand-side values of the absolute forecast variation.
This study measures labour size as it is more reliable than the financial alternatives (Nguyen et al., 2018). Intended labour size forecasting is the expected percentage change in the number of employees between 2012 and 2013. Employee numbers are typically more difficult to manipulate through accounting tricks (McMillan and Woodruff, 1999) and the costs of hiring and firing employees are high in terms of negotiating with employees and registering with local authorities (Cooke and Lin, 2012). These attributes imply that intended labour size should be carefully considered in all businesses (Efendic et al., 2015).
Independent variables
The two independent variables that are proposed to have an impact on firm forecasting variations are ownership and firm size. Ownership is composed of three dummies: State-owned variable takes value 1 for state-owned firms and 0 otherwise; Private variable takes value 1 for domestic private firms and 0 otherwise; and Foreign-owned takes value 1 for foreign-owned firms and 0 otherwise. With respect to firm size, this study constructs three variables distinguishing micro-firms, small and medium-sized enterprises (SMEs) and large firms, according to the Company Law of Vietnam.
Control variables
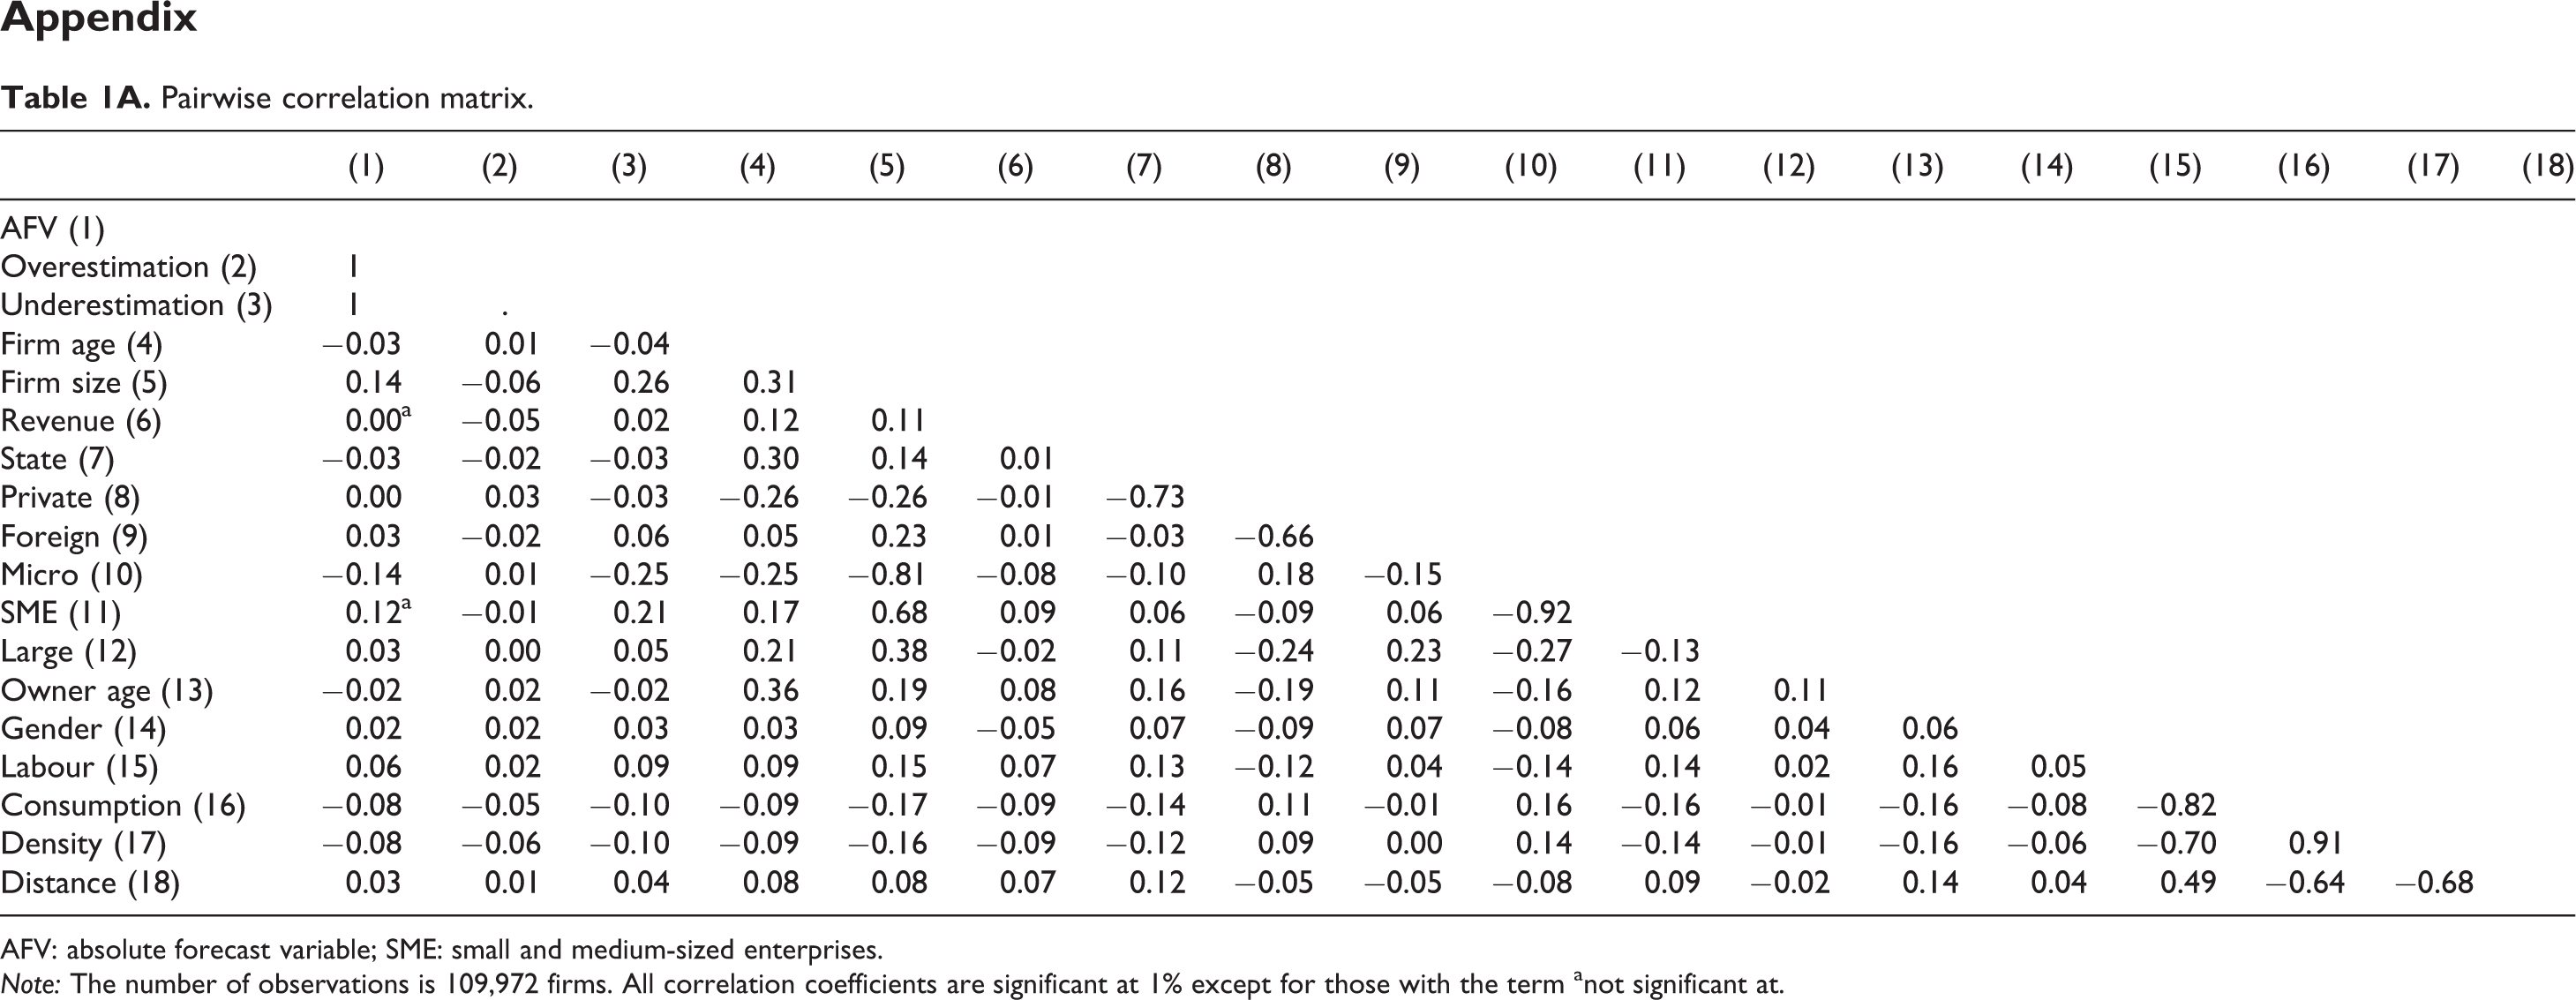
There are factors that may influence forecasting variation, and these are controlled by a set of control variables at different levels. At the firm level, this study includes firm age, firm size, operating industry (two-digit industry codes) and revenue performance. At the entrepreneur level, owner age, education and gender are controlled since these factors may affect forecast ability (Tran and Santarelli, 2014). Then, following Nguyen et al. (2018), this study takes into account factors at the macro-socioeconomic level by including provincial labour supply, provincial consumption per capita, population density and distance from a province to the closest municipal city to control for their geographical interactions (Driffield and Munday, 2000). Definition and summary statistics of variables are presented in Table 2. The pairwise correlation matrix is in Table 1A. (see Appendix 1).
Variable definition and summary statistics.
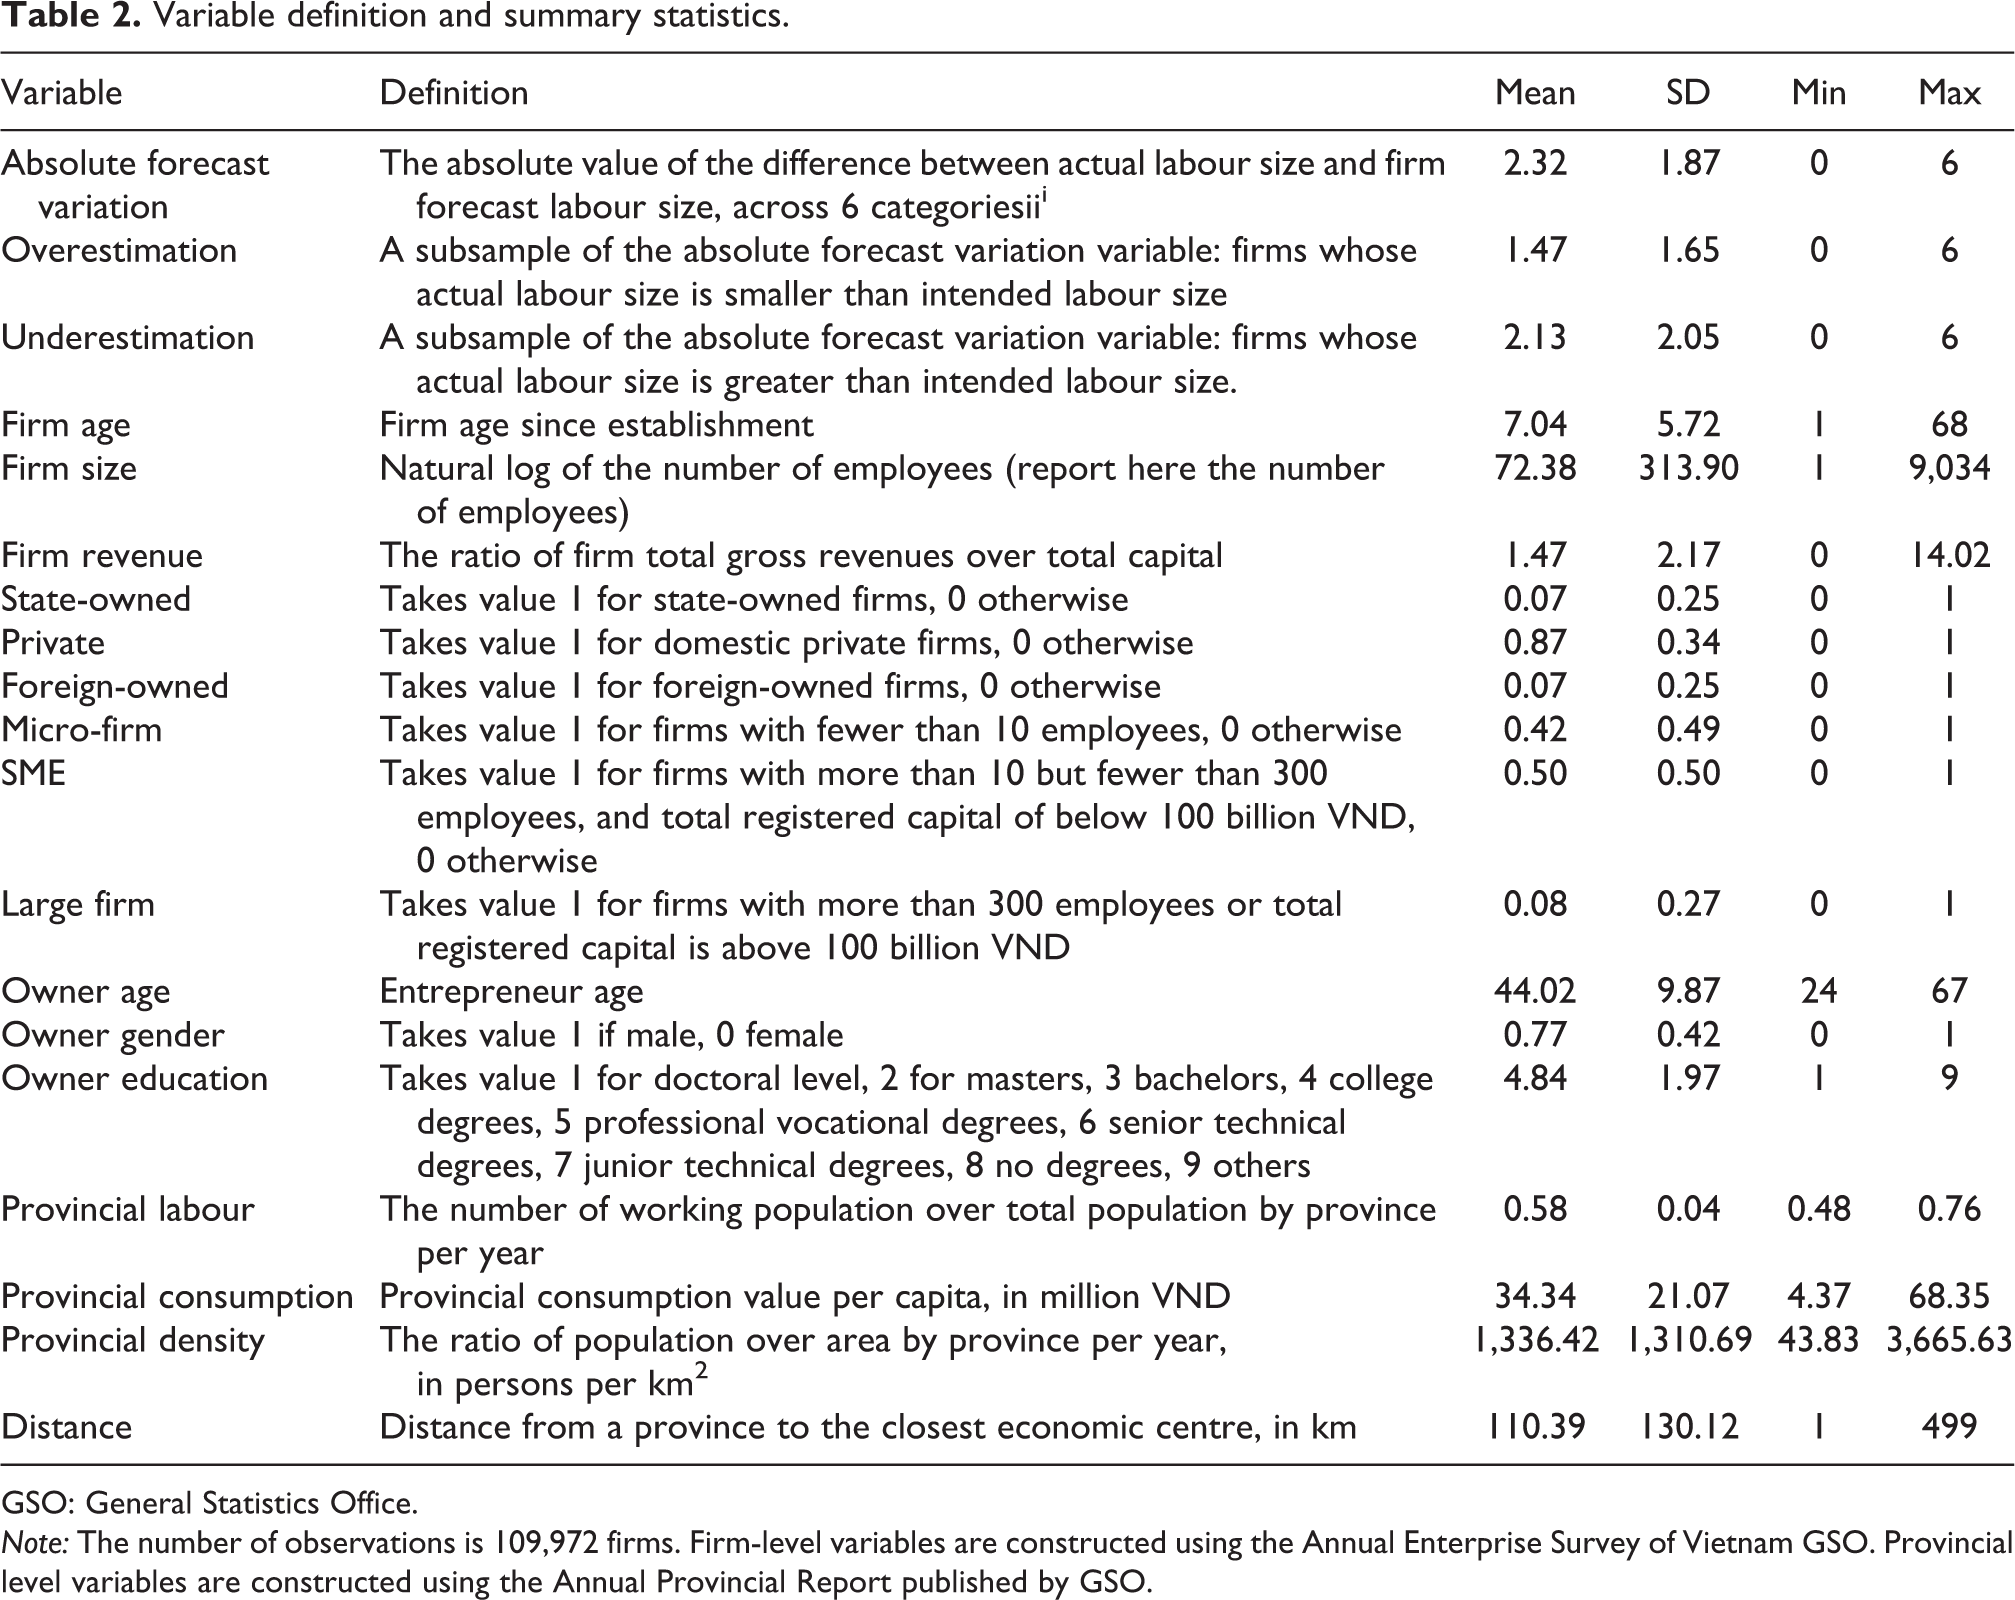
GSO: General Statistics Office.
Note: The number of observations is 109,972 firms. Firm-level variables are constructed using the Annual Enterprise Survey of Vietnam GSO. Provincial level variables are constructed using the Annual Provincial Report published by GSO.
The table shows that on average, forecasted value is 2.32 levels away from the actual value. Also, the magnitude of underestimation is greater than overestimation, indicating that, on average, firms operating in Vietnam are overly pessimistic in assessing their likely expansion. As regards ownership, private firms dominate the total business population at 87%, with foreign-owned and state-owned firms each being 7% of the total registered businesses. With regard to firm size distribution, 50% of the observations are SMEs while large firms account for only 8% of the sample. The remaining 42% is micro-firms.
Empirical estimation
Coupled with the literature investigating entrepreneurs’ growth expectation, this study proposes the following specification to estimate labour size forecast variation:
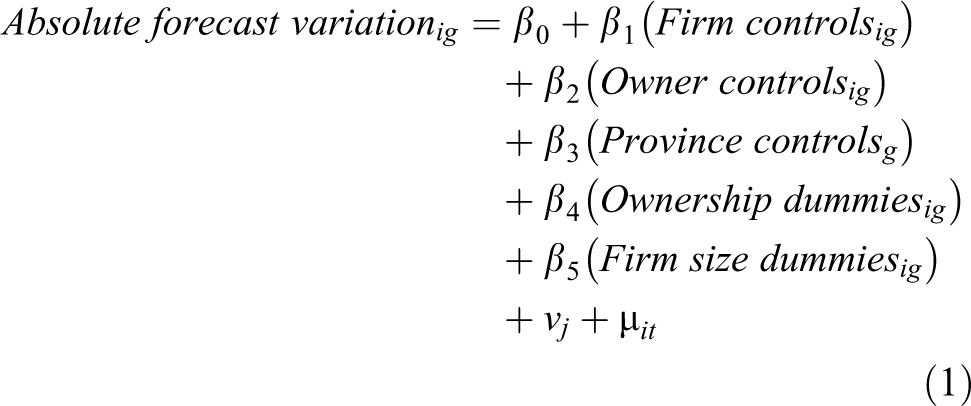
where i denotes an individual firm and g is a province. As such,
To further investigate the effects of ownership and firm size on overestimation and underestimation, this study proposes the following additional specifications: one is the sub-sample of firms that overestimate, and the other is the sub-sample of firms that underestimate. These specification settings allow for the identification of factors that influence the direction of forecasting variation, which is more meaningful than the general absolute variations.
Since the forecasting survey is 1-year cross-sectional data, following Cassar (2014), this study employs the ordinary least square as the best linear unbiased estimator to estimate forecasting variations. The reason for this is the number of categories (seven levels of forecasting variations, from 0 to 6); moreover, the distance between any two adjacent levels is roughly 10%. These features allow the dependent variables to be treated as continuous variables (Fullerton, 2009). The study makes use of the lagged values of firm size and firm revenues in 2012 rather than the 2013 values to reduce potential endogeneity-related issues. The regression results are reported in the following section.
Empirical findings
Table 3 presents the regression results. The Variance inflation factor (VIF) test shows that there are no significant heterogeneity-related issues.
Regression results using OLS.
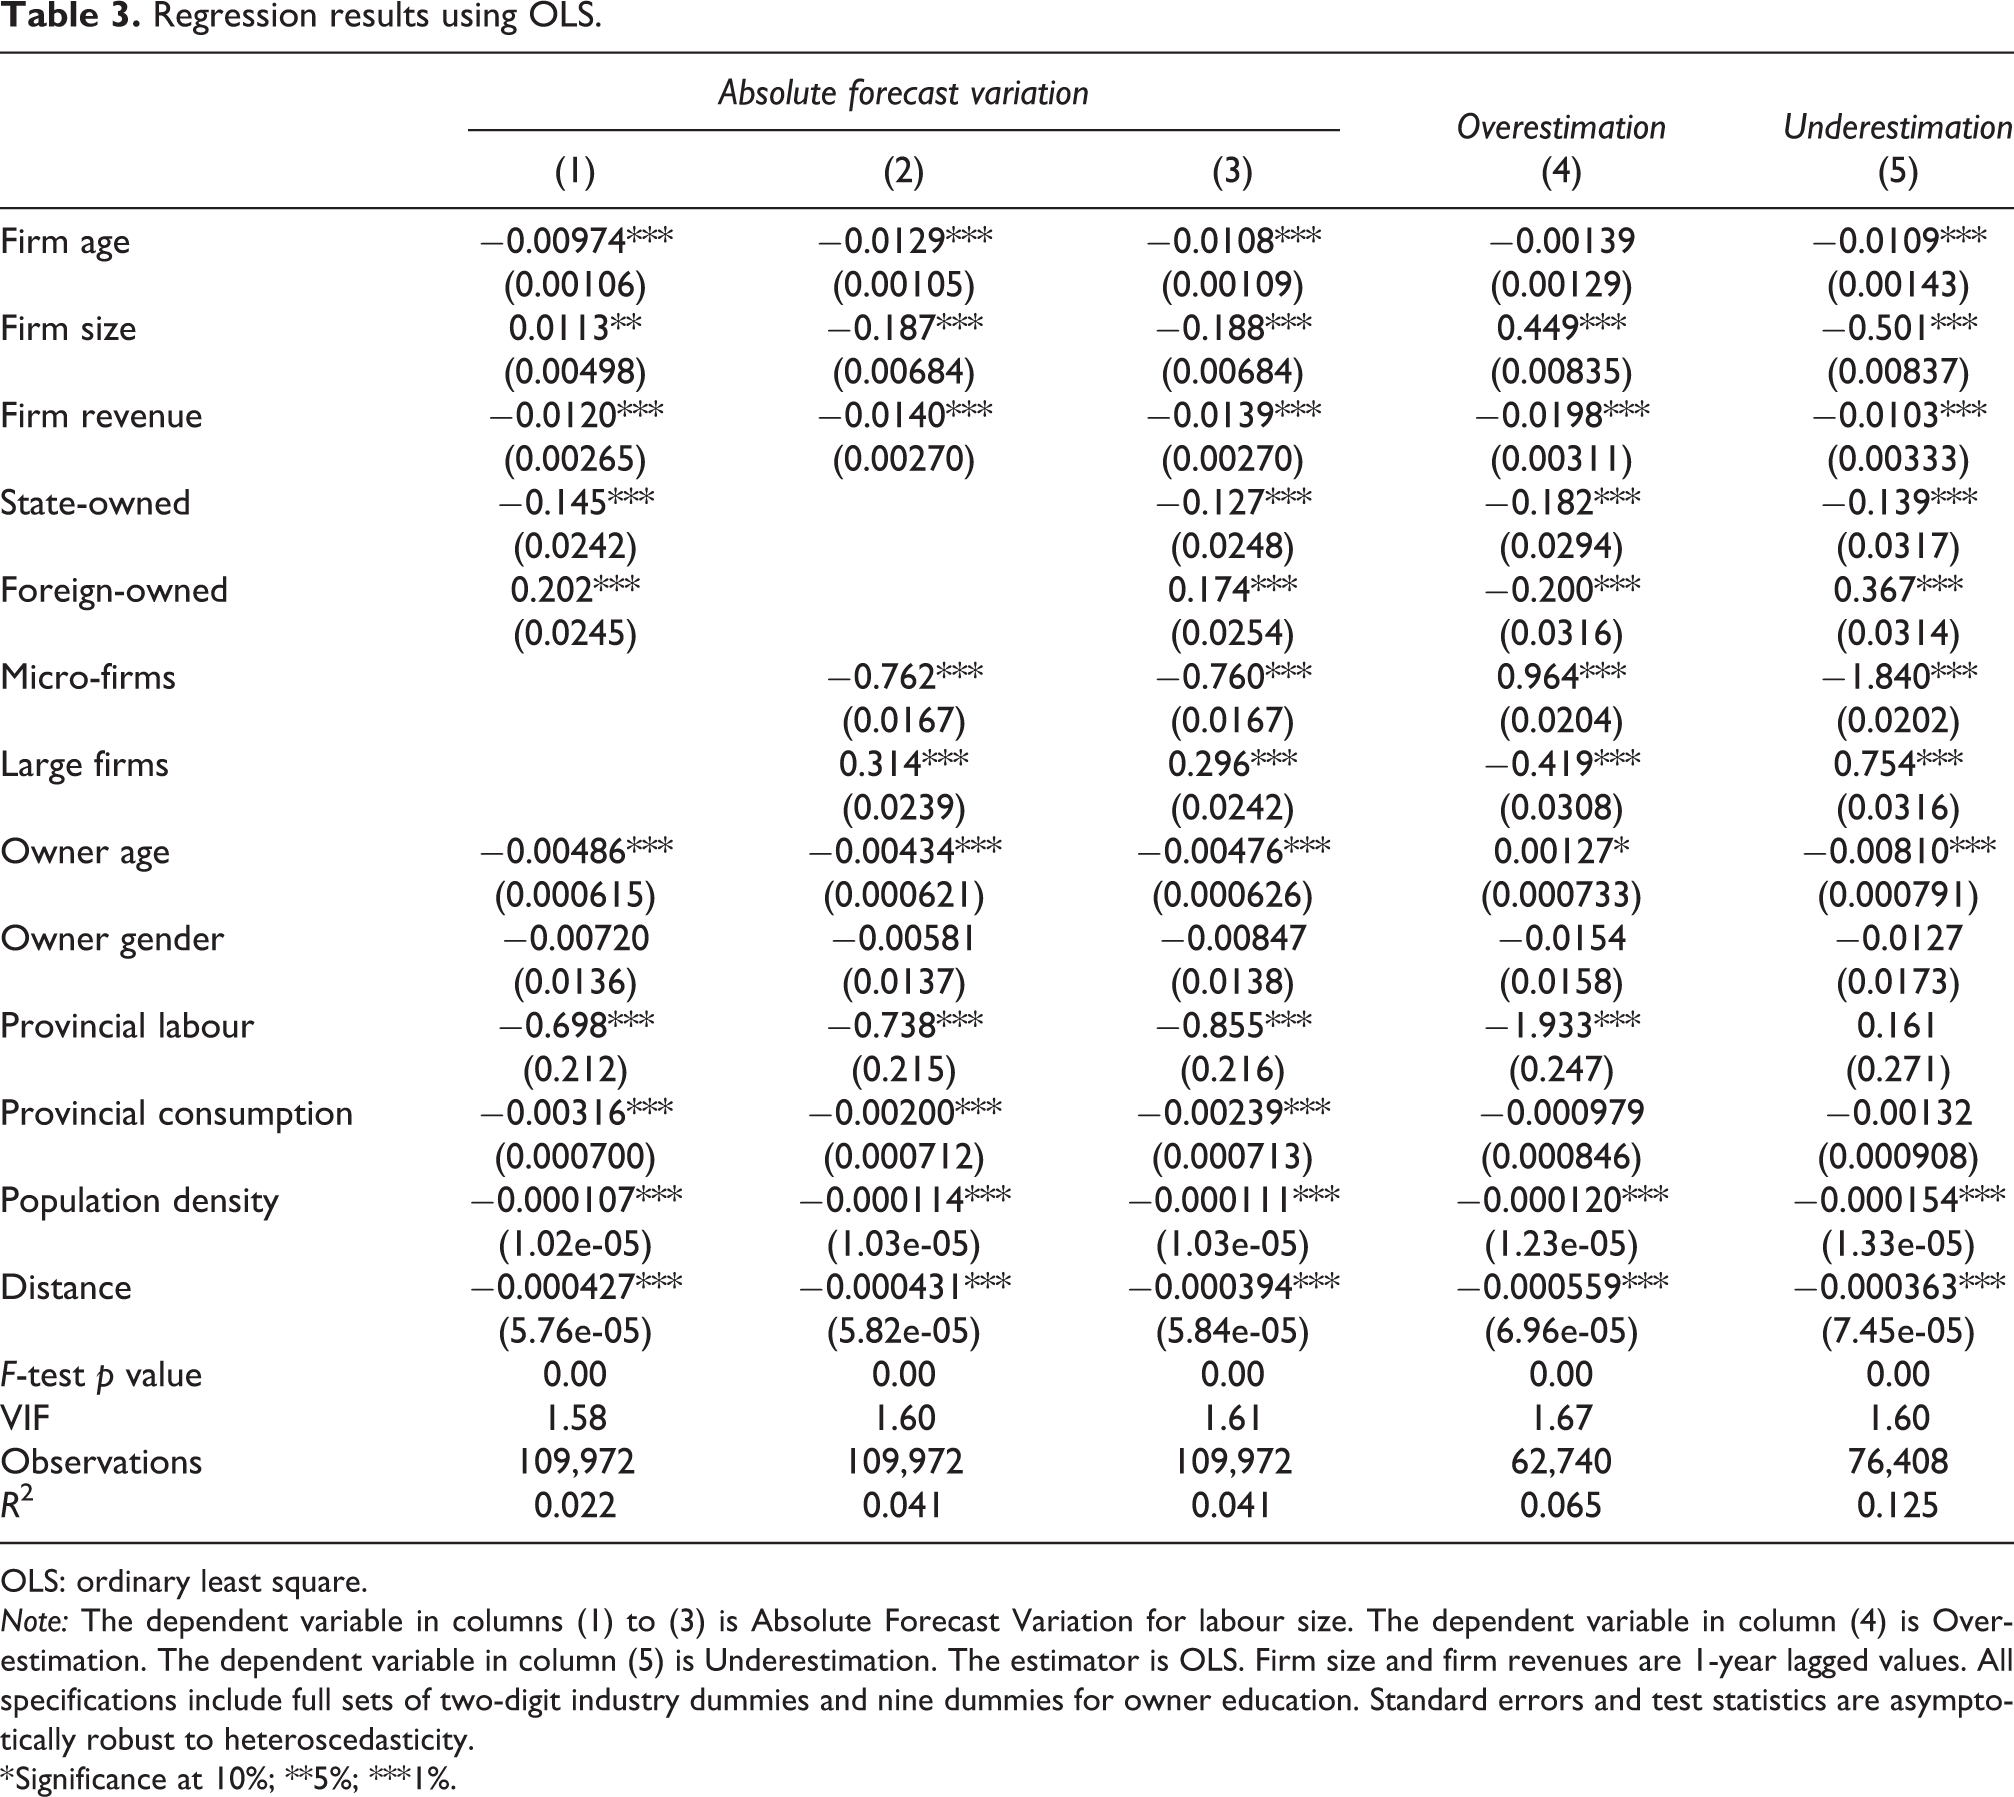
OLS: ordinary least square.
Note: The dependent variable in columns (1) to (3) is Absolute Forecast Variation for labour size. The dependent variable in column (4) is Overestimation. The dependent variable in column (5) is Underestimation. The estimator is OLS. Firm size and firm revenues are 1-year lagged values. All specifications include full sets of two-digit industry dummies and nine dummies for owner education. Standard errors and test statistics are asymptotically robust to heteroscedasticity.
* Significance at 10%; **5%; ***1%.
In columns (1) to (3), the coefficients associated with state ownership are negative and statistically significant, while the coefficients associated with foreign ownership are positive and precisely determined. This finding indicates that SOEs, of the three ownership types, make the most accurate forecasting regarding their intended labour size. This evidence lends support to hypothesis 1 that posits that state-owned firms make the most accurate forecasting. Regarding firm size, the empirical evidence in columns (1) to (3) also supports hypothesis 2, by showing that micro-firms make more accurate forecasting than SMEs and large firms do.
Columns (4) and (5) provide detailed insights to examine the nature of the variation (overestimation and underestimation) in forecasting. To assist insightful interpretation, the values of the forecasting variation variable are presented in Figure 1.

Forecast variation variable.
Figure 1 enables the plotting of the average forecasting values for different types of ownership. The coefficients associated with state ownership are negative and statistically significant in both the overestimation (column 4) and underestimation (column 5) specifications, indicating that SOEs make more accurate forecasting (fewer forecasting variations) than private firms (the benchmark). As such, the average forecasting value of SOEs in Figure 1 should be closer to the zero point than the average forecasting value of private firms. Meanwhile, the coefficient associated with foreign ownership in the overestimation equation (column 4) is negative, but it is positive in the underestimation equation (column 5), indicating that foreign firms make less overestimation and more underestimation than private firms on average do. This finding implies that the average forecasting value of FOEs is skewed towards the right-hand side of Figure 1 (in the underestimation direction). Given that the forecasting value of SOEs is closest to 0, the forecasting value of foreign firm must strictly locate to the right-hand side of the 0 value. Also, according to the findings in columns (1) to (3), the average forecasting value of private firms should be between those of state-owned and foreign-owned firms (see Figure 2).

Average forecast values by ownership types. Note: The average forecast value of SOEs may locate slightly to the left or right of the 0 point, but it should be the most accurate forecasts. Meanwhile, the forecast values of private firms and FOEs must be strict to the right of the 0 point. SOE: state-owned firms; FOE: foreign-owned enterprise.
Employing a similar inference for firm size variables, it can be seen from the specifications in columns (1), (2) and (3) that the average forecasting value of micro-firms should be closest to the zero point as they make the least forecasting variation. Meanwhile, the coefficient associated with large firms in the overestimation equation (column 4) is negative, but is positive in the underestimation equation (column 5), indicating that large firms make less overestimation and more underestimation than do SMEs (the benchmark) on average. Given that the forecasting value of micro-firms is closest to 0, the forecasting value of large firms must strictly locate to the right-hand side of the point 0. Also, because SMEs’ average forecasting value is between those of SOEs and FOEs, as indicated by the results in columns (1), (2) and (3), this study has the following result in Figure 3.

Average forecast values by firm size. Note: The average forecast value of micro-firms may locate slightly to the left or right of the 0 point, but it should be the most accurate forecasts. Meanwhile, the forecast values of SMEs and large firms must be strict to the right of the 0 point. SME: small and medium-sized enterprise.
In short, the findings indicate that firms in Vietnam tend to underestimate their forecasting. It is argued that this conservative behaviour is a result of the post-communist institutional settings, which are intrinsically unfriendly to entrepreneurship.
Robustness checks were conducted using ordered logistic regression, financial forecasting and comparing the efficiency of a simple forecasting model with the forecast values of the entrepreneurs. The results are found to be consistent with the main findings (results are available upon request).
Discussion and implications
This study investigates why some firms make more accurate forecasting than others. Two contrasting theoretical perspectives are proposed that provide insight into the nature of this phenomenon. First, this study suggests that resources play an essential role in determining forecasting accuracy. However, institutional context could also significantly affect the process of producing forecasting values, depending on the reward structure that is provided for economic players. Testing the validity of these theoretical arguments using a large data set of more than 100,000 firms in Vietnam, this study’s findings demonstrate that SOEs make more accurate forecasting than other ownership types, as do micro-firms in comparison with their larger counterparts.
Since SOEs are less likely to have the will and micro-firms are less likely to have the resources to invest in their forecasting facilities, this study opts for the IT to explain how the accurate forecasting of SOEs and small businesses is generated by the incompleteness of their local institutional settings. Furthermore, this study distinguishes overestimation from underestimation and finds that non-state-owned and large firms tend to under-evaluate their business expansion potential.
In linking to the extant literature on state-ownership in emerging countries, this study provides a novel understanding of SOEs. It empirically evidences that while their behaviour may reduce their forecasting inaccuracies, it materially restricts their optimal growth rates. This ineffective behaviour is, however, widely adopted by SOEs in post-communist emerging countries (e.g. Vietnam and China) due to the planned economy ideology, which is known to be a side-product of the old communism. In the context of SOEs, planning accurately and achieving the exact forecasting value is regarded as the best outcome (Cai et al., 2015).
Moreover, this study significantly contributes to the entrepreneurship literature by highlighting that small firms make more accurate forecasts than large ones. But in the context of weak institutional settings, it is argued that this should not actually be considered to be a desirable outcome. While large and old firms in the same institutional settings could surpass their preset goals, the accurate forecasts of small firms should be interpreted as the effect of the resource limitation that is imposed on them. It is likely that small businesses cannot achieve higher growth rates even if they want to, being encumbered with institutional and financial constraints/discriminations.
Finally, this study provides several important implications for policymakers. As SOEs make the most accurate forecasts but achieve the lowest levels of business expansion while non-state companies systematically underestimate their growth potential, governments should adjust the distribution and allocation of resources among these economic players. In particular, governments should reduce financial and political discriminations against the private sector. Only when the private sector obtains sufficient financial capital/political support will they be able to set high growth expectations and be ready for aspirational expansion.
However, it is noteworthy that firms may cope with financial constraints more easily than they do with cognitive constraints. The tendency to avoid risks and be satisfied with merely maintaining stable performance derives from firms’ embeddedness in negative informal institutions (Fritsch and Storey, 2014). This study therefore argues that mitigating entrepreneurial cognitive constraints is not an easy task and that governments should focus on boosting governance quality to build trust in society and reduce the uncertainties and transaction costs (e.g. property rights protection, corruption controls) in doing businesses.
Conclusion
This study aims to investigate the determinants of Vietnamese firm forecasting accuracy. The results indicate that state-owned and small firms make more accurate forecasting values than their larger counterparts. There are two possibilities that can explain this counterintuitive result: (1) the institutional incompleteness in the post-communist economy and (2) systematic underestimation of the performance of foreign and large private firms, which results from the institutional complexity in Vietnam. This finding implies that institutional forces are a decisive factor that impacts firm forecasting.
Footnotes
Declaration of conflicting interests
The authors declared no potential conflicts of interest with respect to the research, authorship, and/or publication of this article.
Funding
The authors received no financial support for the research, authorship, and/or publication of this article.
Appendix
Pairwise correlation matrix.
| (1) | (2) | (3) | (4) | (5) | (6) | (7) | (8) | (9) | (10) | (11) | (12) | (13) | (14) | (15) | (16) | (17) | (18) | |
|---|---|---|---|---|---|---|---|---|---|---|---|---|---|---|---|---|---|---|
| AFV (1) | ||||||||||||||||||
| Overestimation (2) | 1 | |||||||||||||||||
| Underestimation (3) | 1 | . | ||||||||||||||||
| Firm age (4) | −0.03 | 0.01 | −0.04 | |||||||||||||||
| Firm size (5) | 0.14 | −0.06 | 0.26 | 0.31 | ||||||||||||||
| Revenue (6) | 0.00a | −0.05 | 0.02 | 0.12 | 0.11 | |||||||||||||
| State (7) | −0.03 | −0.02 | −0.03 | 0.30 | 0.14 | 0.01 | ||||||||||||
| Private (8) | 0.00 | 0.03 | −0.03 | −0.26 | −0.26 | −0.01 | −0.73 | |||||||||||
| Foreign (9) | 0.03 | −0.02 | 0.06 | 0.05 | 0.23 | 0.01 | −0.03 | −0.66 | ||||||||||
| Micro (10) | −0.14 | 0.01 | −0.25 | −0.25 | −0.81 | −0.08 | −0.10 | 0.18 | −0.15 | |||||||||
| SME (11) | 0.12a | −0.01 | 0.21 | 0.17 | 0.68 | 0.09 | 0.06 | −0.09 | 0.06 | −0.92 | ||||||||
| Large (12) | 0.03 | 0.00 | 0.05 | 0.21 | 0.38 | −0.02 | 0.11 | −0.24 | 0.23 | −0.27 | −0.13 | |||||||
| Owner age (13) | −0.02 | 0.02 | −0.02 | 0.36 | 0.19 | 0.08 | 0.16 | −0.19 | 0.11 | −0.16 | 0.12 | 0.11 | ||||||
| Gender (14) | 0.02 | 0.02 | 0.03 | 0.03 | 0.09 | −0.05 | 0.07 | −0.09 | 0.07 | −0.08 | 0.06 | 0.04 | 0.06 | |||||
| Labour (15) | 0.06 | 0.02 | 0.09 | 0.09 | 0.15 | 0.07 | 0.13 | −0.12 | 0.04 | −0.14 | 0.14 | 0.02 | 0.16 | 0.05 | ||||
| Consumption (16) | −0.08 | −0.05 | −0.10 | −0.09 | −0.17 | −0.09 | −0.14 | 0.11 | −0.01 | 0.16 | −0.16 | −0.01 | −0.16 | −0.08 | −0.82 | |||
| Density (17) | −0.08 | −0.06 | −0.10 | −0.09 | −0.16 | −0.09 | −0.12 | 0.09 | 0.00 | 0.14 | −0.14 | −0.01 | −0.16 | −0.06 | −0.70 | 0.91 | ||
| Distance (18) | 0.03 | 0.01 | 0.04 | 0.08 | 0.08 | 0.07 | 0.12 | −0.05 | −0.05 | −0.08 | 0.09 | −0.02 | 0.14 | 0.04 | 0.49 | −0.64 | −0.68 |
AFV: absolute forecast variable; SME: small and medium-sized enterprises.
Note: The number of observations is 109,972 firms. All correlation coefficients are significant at 1% except for those with the term anot significant at.