
Abstract
Peer assessment has been a subject of great debate in recent years. The way students perceive assessment and what motivates them when assessing may differ significantly from the tutor. This paper discusses a study designed to correlate students’ marking with the marks awarded by their tutors when peer assessing one another from in-class oral presentations. A new and alternative approach to correlate results is presented, which is based on the normalisation of the quantitative judgements based on determined criteria. The methodology was blind and holistic, as described in previous works: some guidelines were provided to the students on what is considered acceptable without getting into detail (holistic marking), and peer-assessment marks were made confidential (blind approach). It was observed that students have a tendency to overrate fellow students – especially where lower marks might be awarded. There is, however, direct agreement with the tutor’s marking in terms of qualitative judgements, which is highlighted by the presented correlation method used to adjust students’ marks. The presented methodology to correlate marks between the students and tutor showed to be a promising one. After processing the data with this simple and straightforward algorithm, peer and tutor assessment practically showed a perfect match.
Introduction
Orsmond, 1 in his review on assessment within the higher education context, discriminates three ways of considering assessment in relationship to learning: assessment of learning, assessment for learning and assessment as learning. The widely accepted practice for assessment still is in terms of being of learning. Typically, students are assessed through summative assessment, e.g. an end of module examination in which the students’ amount of learning is fully assessed by the tutor. However, Boud and Falchicov 2 consider this approach as short-termed under the context of higher education, in which new material must be gradually appreciated through an iterative updating process, so that life-long self-learning is stimulated after graduation.
The conceptual shift of assessment from ‘of learning’ to ‘for learning’ and then to ‘as learning’ can be traced back to Gipps 3 and Earl, 4 respectively. Although with different emphasis, both acknowledge the introduction of student self-assessment, in which the student assumes an important role in the assessment and judgement of his own work. Another frequently adopted method in which students are involved in the appreciation and appraisal of learning is peer assessment. 5 According to Orsmond, 1 ‘peer-assessment shares most of the key features of self-assessment’ and ‘feeds self-assessment activities particularly through the act of receiving and giving feedback’. Prompt feedback is appreciated by students, because it gives them an early opportunity to assess their understanding of the course material, as acknowledged by Cotner et al. 6 when introducing scratch-off immediate feedback assessment technique forms and classroom response system (clickers) in large cohorts of students.
For peer assessment to work effectively, some authors argue that one of the requirements is that the student and the tutor discuss and agree – or at least clarify and reflect on – assessment criteria. 7 Tsivitanidou et al., 8 on a study investigating secondary school students’ unmediated peer-assessment skills, observed that students already have the basic skills required for the implementation of peer assessment, although they recognised that ‘reciprocal peer assessment is a rather complex procedure that requires well developed peer assessment related skills’ and that ‘students need to receive explicit training’. However, Norton 9 points out that students may become strategic learners who end up selecting what they identify as being the key aspects to obtain marks instead of spreading their attention to the whole span of the learning range. On the other hand, one might argue that students tend not to perceive assessment criteria as tutors do. Most often, they are not provided with the proper tools that would enable them to self-monitor their own learning 10 and they still have little involvement in assessment design, marking and evaluation. 1
Nevertheless, peer assessment is an approach to learning that is nowadays recognised as a tool capable of getting the students more involved, making them take more responsibility, encouraging self-critical analysis and self-evaluation of student work and fostering debate and communication.11,12 Even if a poor correlation between students self-assessed marking and the tutor marking is observed, some authors (e.g. Kirby and Downs 13 ) continue advocating in favour of self-assessment for learning – which is strongly correlated to peer assessment according to Orsmond. 1
Peer assessment can be used as a tool to give students an opportunity to learn by making them aware of the different approaches employed by other students: an aspect highlighted by Van Gennip et al. 14 by mentioning the social and interpersonal bonds involved in peer assessment, from which students, by assessing one another, are actually learning from their peers. For example, Chuck and Young 15 designed a formative assessment task to improve the scientific report writing skills of university students. This used a combination of peer- and self-assessment against specific criteria, where students were required to submit an amended report. It was shown that those that participated in this cohort-driven assessment task got better results on average compared with those that would have been obtained after the first submission.
With the above points in mind, a peer-assessment assignment was introduced in the modules of Technical Design and Geometrical Modelling I and II (first-year students) of Engineering undergraduate degrees taught in Instituto Superior Técnico of the Technical University of Lisbon in Portugal.
The peer-assessment case study discussed in this paper took place during the semester’s last week (before examinations) and was focused on a part of the students’ group assignment. The students were invited to mark one another’s oral presentations on sheets of paper (similar to voting bulletins). These were later returned to the tutor in such a way that the peer-assessment marks were kept anonymous.
Using the terminology from Russel et al., 16 the followed methodology was blind and holistic as opposed to open and category based. These authors describe these terms the following way: in a blind approach, students respond to the peer-assessment task in complete isolation from one another (anonymous marking), whereas in an open approach students discuss their thoughts and negotiate marks when peer assessing within a group. In a holistic marking criteria style, students are asked to evaluate their peers’ contribution and performance by looking at the ‘big-picture’. Some guidelines can be provided to the students on what is considered acceptable, but the students are not asked to explicitly respond to them in any detail. On the other hand, on a category-based marking scheme, students are expected to mark their peers’ performance against a specific set of marking criteria.
Results show that students are perfectly capable of making the correct distinctions between one another when speaking in qualitative terms. The correlation between the peer and the tutor assessment in quantitative terms is not that different as well. However, a tendency to award generous marks to weaker students is observed.
An alternative approach to analyse the peer-assessment marks is presented as well, in an attempt to better understand how peer and tutor assessment correlate in the quantitative judgements. This is based on the normalisation of the peer-assessment marks based on range and one parameter target (in this case, a value for the average was set as target). For the correlation to be comparable, the average of the peer-assessment marks was set to the same value as the average of the marks from the tutor. The range was stretched in order to consider all the possible marking range as students showed to give marks on a narrower band than the tutor.
Method
Data sample
This study was carried out with data from Instituto Superior Técnico of the Technical University of Lisbon in Portugal, and the assessments were part of the ‘Technical Drawing and Geometrical Modelling I and II’ modules. These are first-year undergraduate modules taught in semesters A and B of the Engineering degrees. The data analysed corresponds to four cohorts of approximately 25 students each (a total of approx. 100 students).
General assessment criteria
Assessment of these modules is based on a weighted combination of individual coursework (both in-class and homework) and a group design project that includes both an in-class presentation and a written report which is submitted at the end of the semester. This is illustrated in Figure 1 pie chart, in which the lower half corresponds to group work and the upper half corresponds to individual work.
Marking distribution.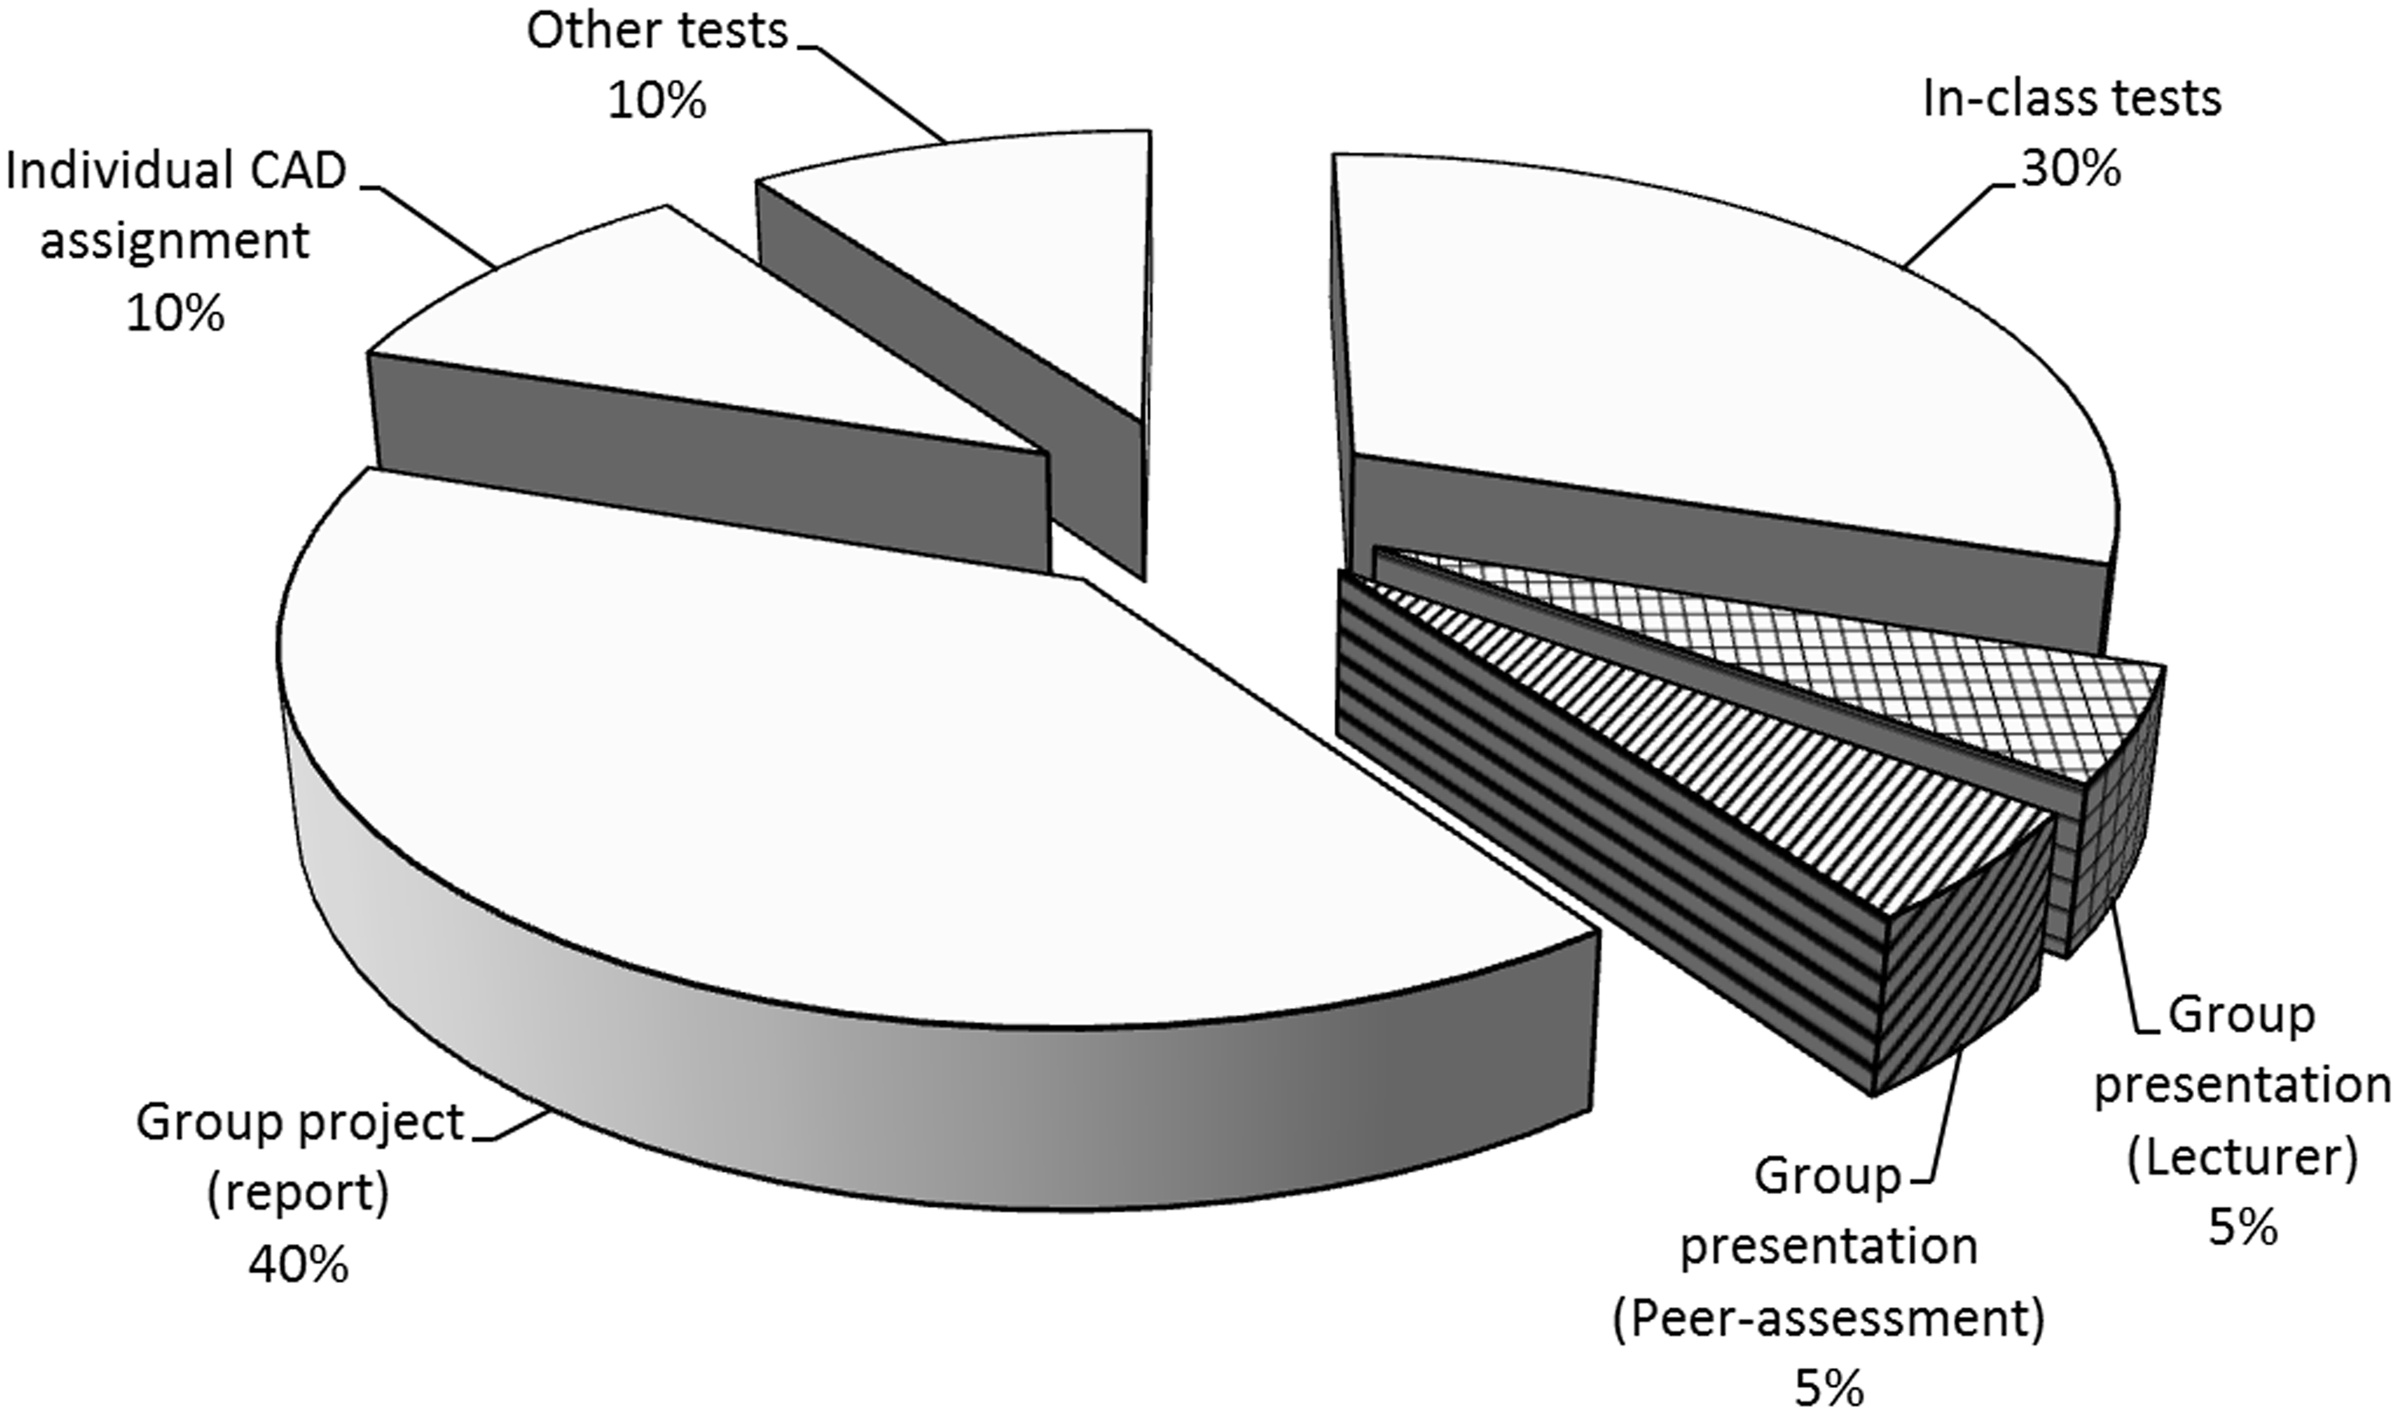
The group component of the assessment includes a report on the group project worth 40% of the final marks and a group presentation worth 10%. The group oral presentation is the average value between the marks given by the students when peer assessing (worth 5%) and the marks given by the lecturer (worth another 5%). Although this was a group presentation, students were also assessed individually according to how well they performed on the roles they played as described below (each group was composed of two to three students, depending on the complexity of their projects).
Peer-assessment marking scheme
The in-class presentations ran during the semester's last week. Each group, composed of two to three students, prepared a presentation using both the CAD software and a slideshow. Each student was given up to 5 min to make their presentation regarding their contribution to the group work.
Both the teacher and the students based their assessment on the same marking scale, ranging from 1 to 10 (Figure 2): three levels of pass and two levels of fail were considered. The zero marks were reserved for students who did not attend the presentations (any student presenting would get at least a minimum of 1 mark).
Marking range for the peer assessment.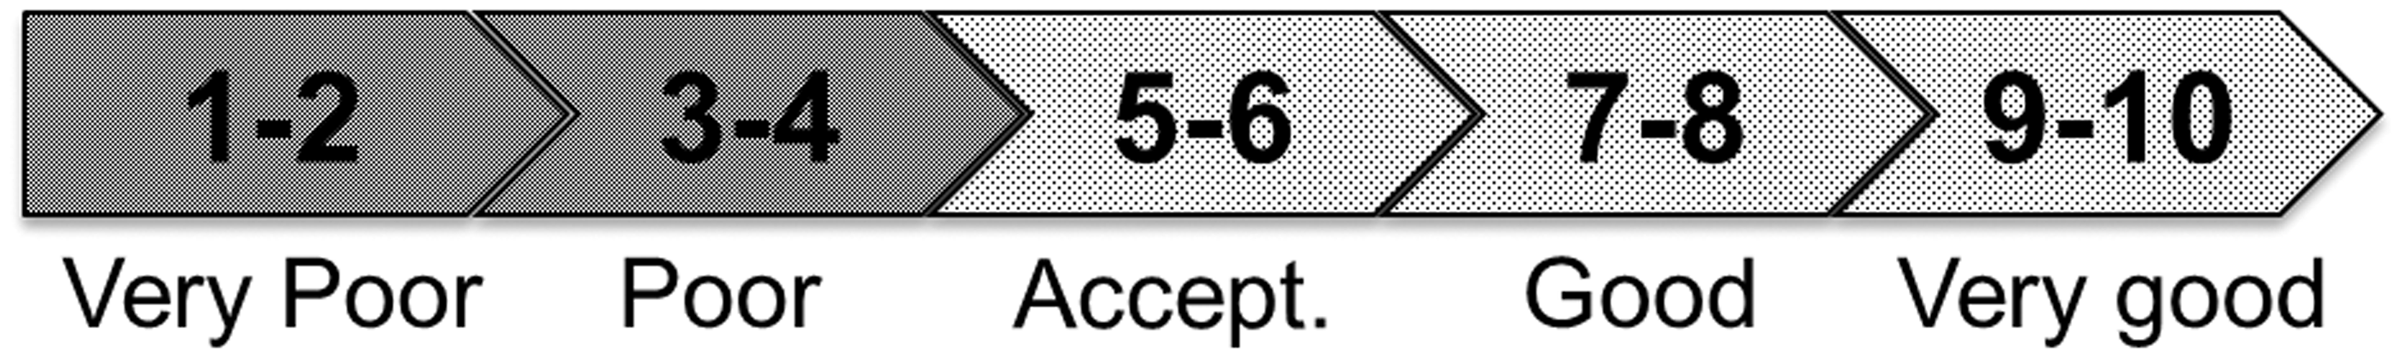
No specific marking criteria were given to the students other than to assess the specific objectives defined in the coursework briefing. To elaborate a list of criteria would make the task unfeasible considering time constraints and the number of oral presentations each student had to assess. There also are other factors that were taken into account on this decision. First, the students might feel it is the job of the lecturer (and not students) to mark work, especially if a considerable amount of time is needed, as pointed earlier by Falchikov. 17 Second, according to a study from Brown et al., 18 students tend to struggle when assessing via a discriminated marking scheme, even if they already have a general perception of the quality of the work. Thus, a holistic approach seemed more appropriate to the oral presentations, in which students look at the ‘big-picture’. Furthermore, this was a low-stakes part of the assignment aiming at giving some guidance to the students on the progress of their work from the tutor’s comments.
For the peer assessment to be as unbiased as possible, some precautions were taken:
To ensure that students take it seriously and engage with the exercise, and to avoid cases where students might show favouritism (e.g. by marking certain students with all 10 s (or 1 s)), they were told that any ‘non-differentiating’ marking sheets would be rejected. It was guaranteed that each individual marking sheet would be kept confidential and would be destroyed after the results were collected – blind methodology. To make the students feel this was their free choice and not an imposition, they were told they could refrain from assessing their peers and submit the marking sheet blank. To provide a sense of justice and fairness, the students could opt out from being assessed by their peers. In such a case, the lecturer’s assessment would be worth the whole 10% of the presentation marks.
From the almost 100 students participating in this study, none fitted the third and fourth categories listed above. However, there were a few whose marking sheets were rejected for the reasons described in point 1 above. With respect to the second point, it is not possible to tell if the students feared discrimination because those sitting next to them could possibly peek into their marking sheets.
Results and discussion
General results
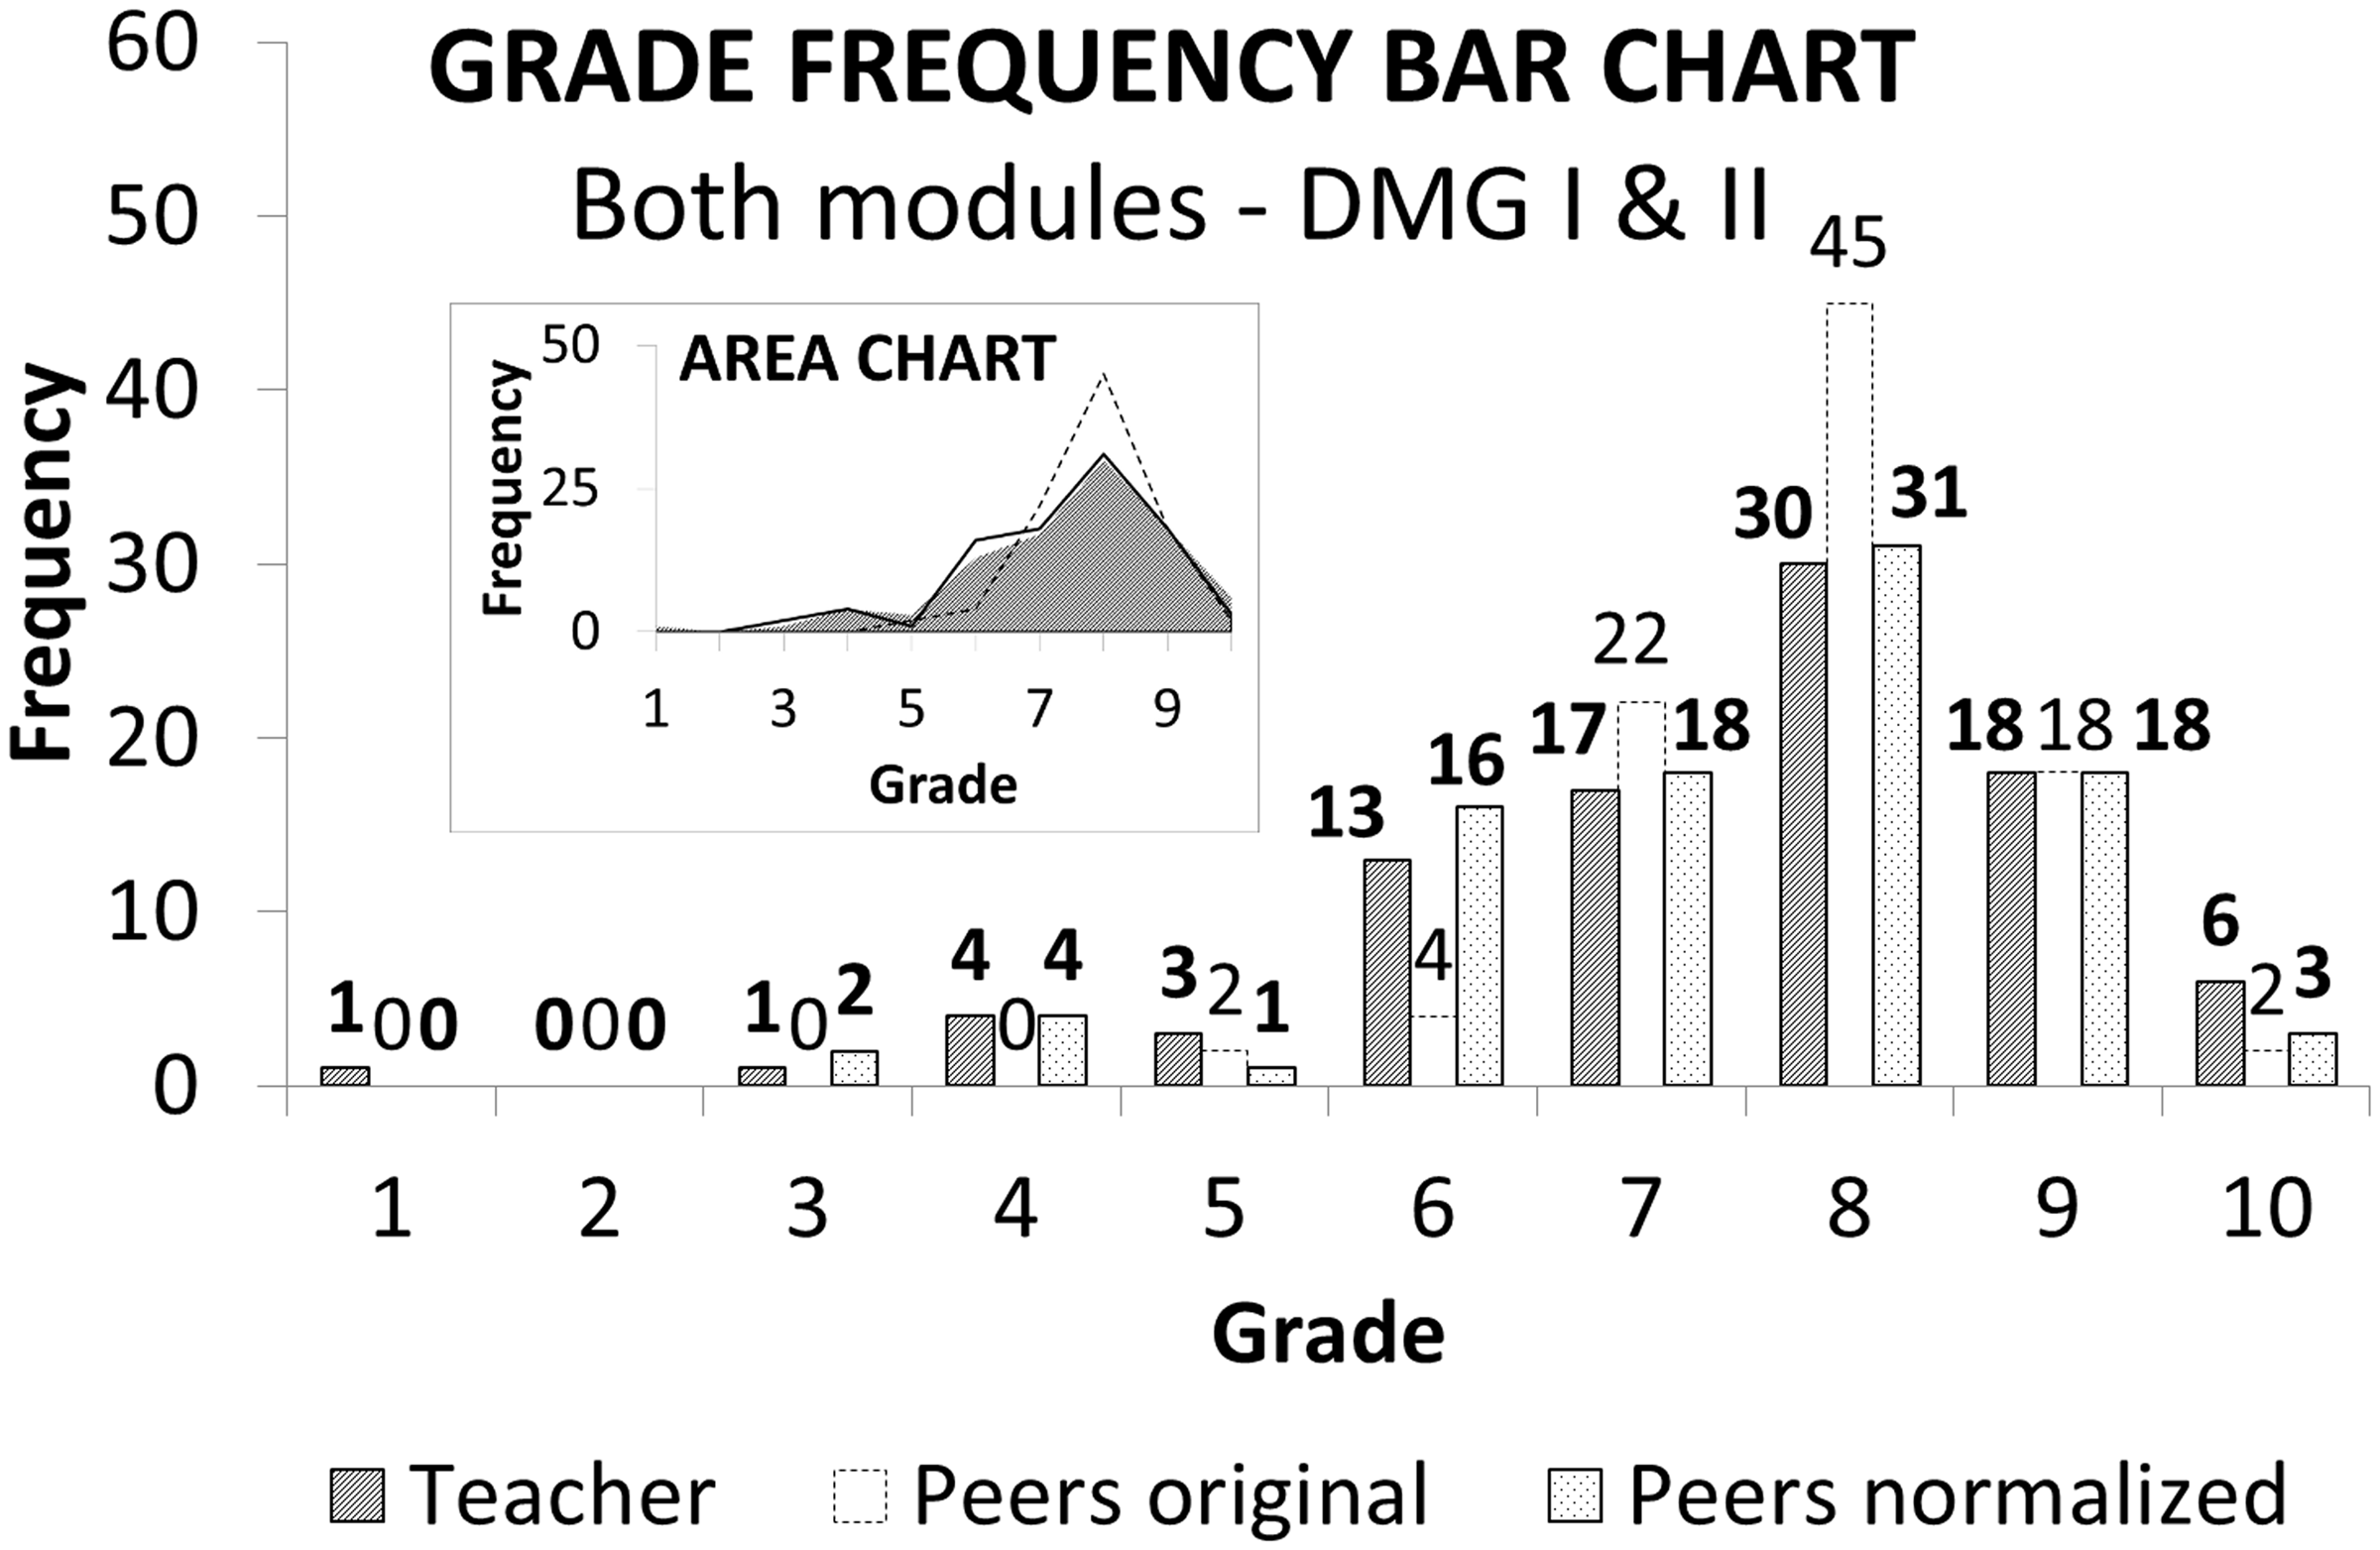
A histogram plot displaying the number of times (frequency) a grade was given by both the lecturer and the peers,
a
is presented in Figure 3. This picture includes the results for both the modules together showing a trend that follows what resembles a normal (Gaussian) distribution. The decision to join both the modules in a single plot is justified from the fact that the conclusions that might be drawn from each of the modules alone would be essentially the same. Furthermore, the statistical significance is improved, since the sample so obtained increased to a size of N = 93 elements.
Histogram showing the amount of times a grade was given.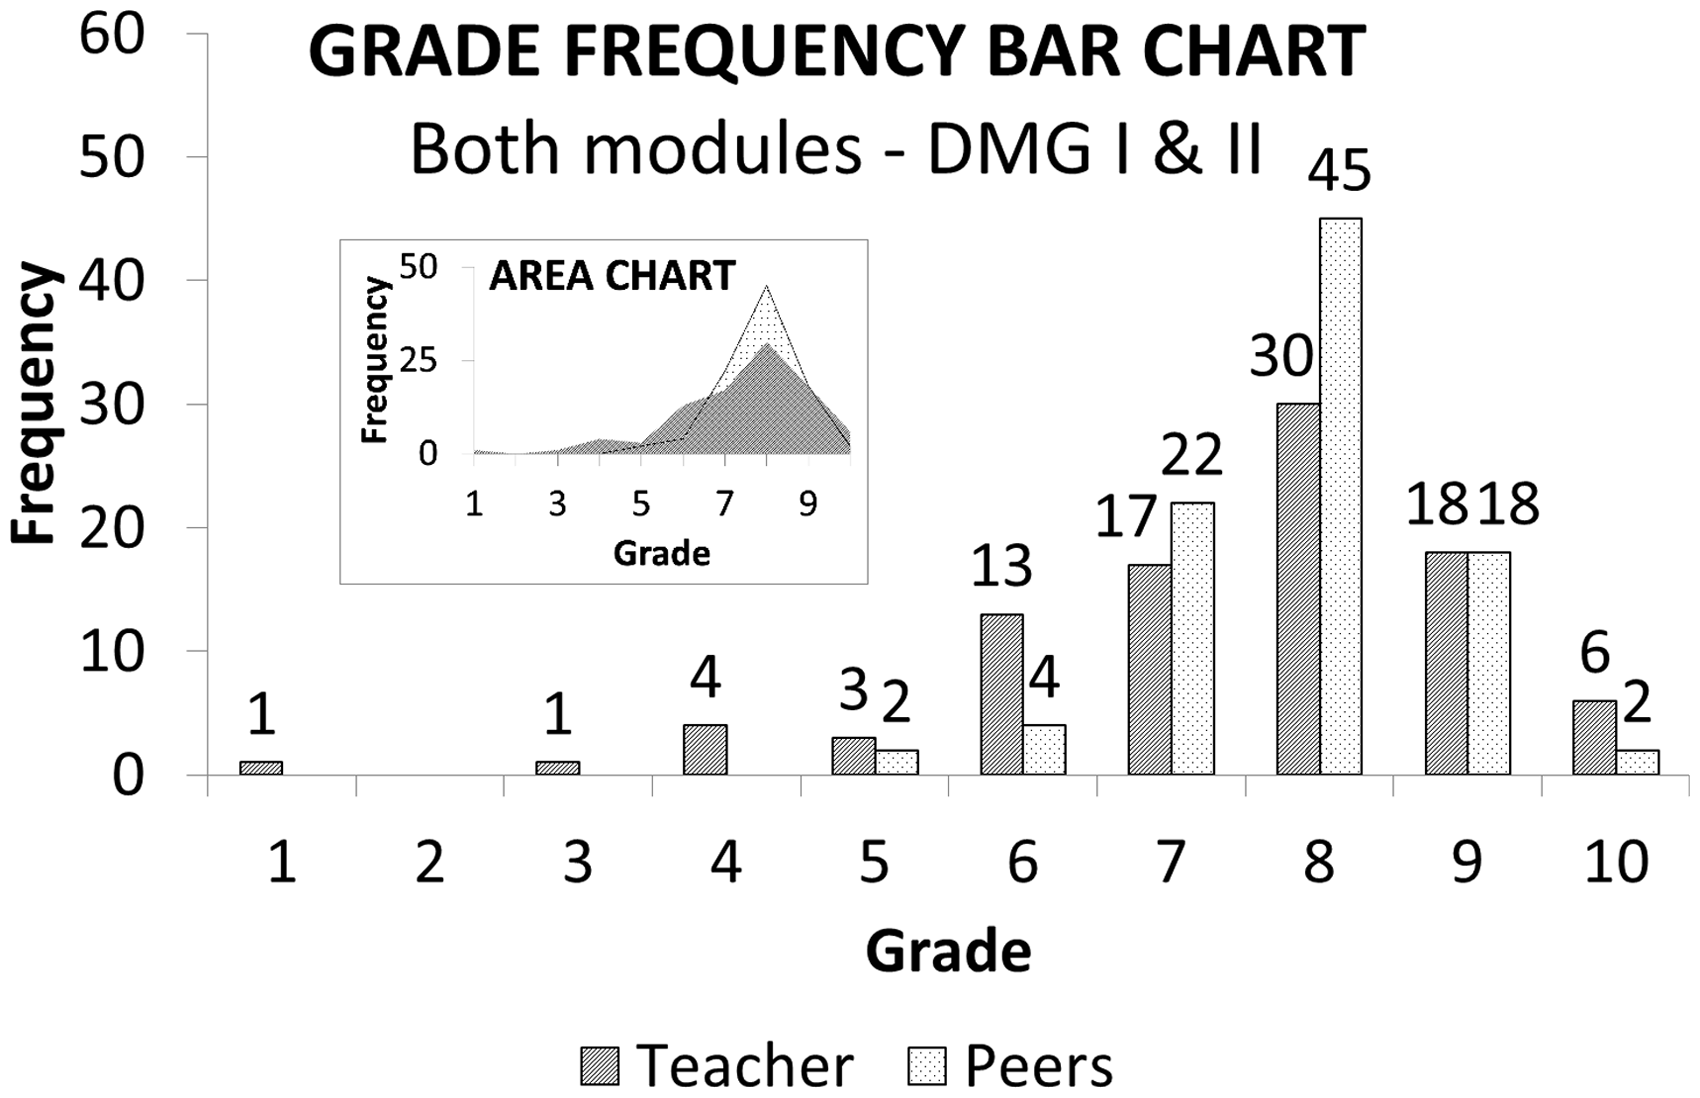
A smaller area chart is also shown in Figure 3. It contains the exact same information as the bar chart, but it puts into evidence some detail that would otherwise be less marked: for instance, that the peer assessment is narrow banded in comparison to the tutor’s assessment.
Note that the same area plot shows some agreement if we look into other aspects. For instance, the statistical mode matches at 8 for both the lecturer and the peers. Other metrics that seem to agree are the average and the ‘total marks given’ (Figure 4) (even though both are slightly larger in the peer-assessment case). The ‘total marks given’, being a summation, can be seen as a measure of the willingness to give better marks. The big difference is on the standard deviation, which is practically twice as much for the tutor. This is because the tutor marks are broad banded in comparison to the peer-assessment marks.
Generic metrics of the results: average, standard deviation and ‘energy’.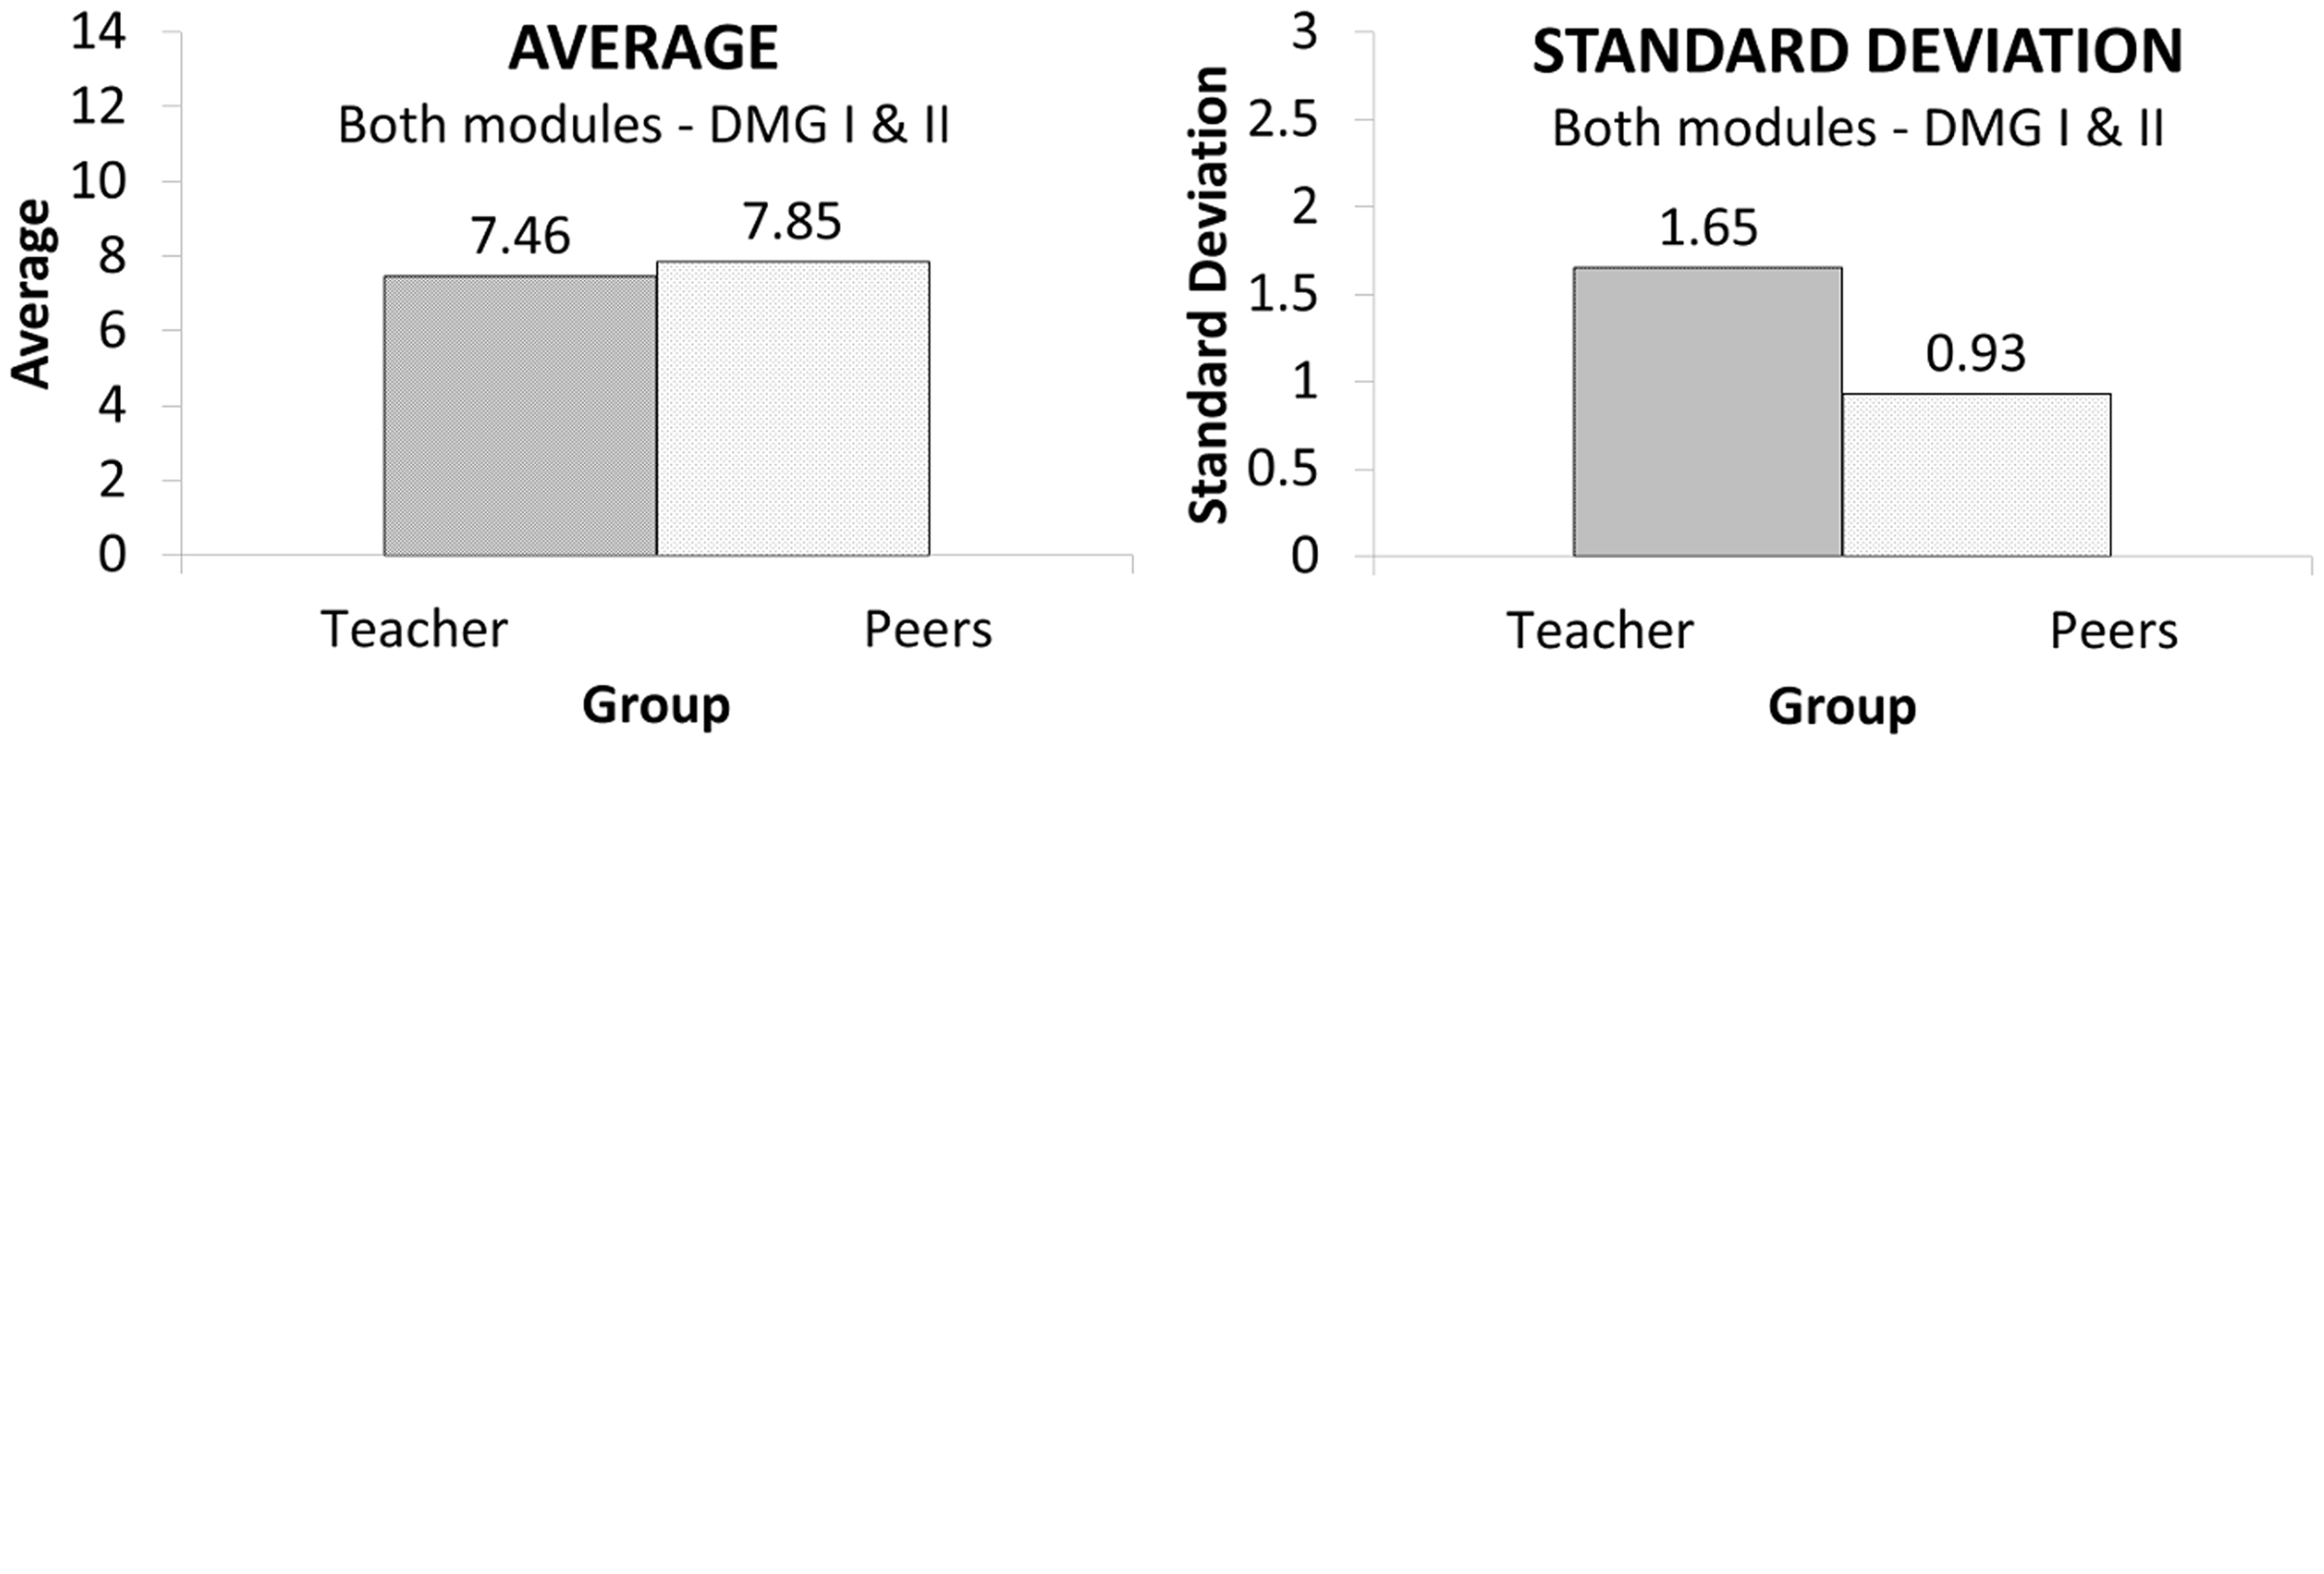
It might be expected that, under different circumstances – for example, higher stakes assessments with category-based criteria defined – the average and mode would change and shift. In that case, the teacher’s assessment would probably be smaller (shifted to the left), as observed by other authors, such as Kirby and Downs 13 when discussing a case study on self-assessment.
Qualitative analysis between the lecturer marks and the peer-assessment marks
First, it must be noted that we deliberately refrained from using a quantitative rigorous statistical analysis of the results, as found in some other studies, because we found it might conceal some of the particular causes for the peer-assessment outcomes that we are looking for. Van Zundert et al. 19 pointed out that most of the published works in the literature about peer assessment, although providing useful insights regarding best practices, are inconclusive with respect to cause–effect relations involved in the peer-assessment process.
Results in Figure 3 suggest that the data can be divided into two main groups. We decided to categorise them into ‘divergent’ and ‘convergent’, as we think these words are the most adequate to define how the perception differs from the tutor to the student. The divergent group, in this study, is proposed to be composed by the grades ranging from 1 to 6 (and possibly 10), with zero correlation between the lecturer and the peers, as opposed to the convergent group ranging from 7 to 10 (or 7 to 9) where data seem to present a certain degree of correlation. Divergence occurs in the 1–6 marks range as it sounds evident that the six students receiving a pass from their peers (5 and 6 marks) are the same six receiving a fail from the lecturer (1–4 marks).
To explain what causes divergence between the tutor and the students, selected parts of the plot represented in Figure 3 are discussed below:
Range 1–4: This is the range of marks corresponding to a fail. According to the lecturer, six students fell into this category. However, the students appear to have avoided failing their peers and did not place any into this category, even though some presentations were quite poor. These results are divergent. Range 5–6: All the six students who received a fail from the lecturer (mentioned in the category above) were put in this category by their peers, i.e. not a fail. Nevertheless, the students demonstrate the ability to rank the presentations: the two students that got 1 and 3 from the tutor were given a 5 (pass) by their peers and the four students that got 4 from the tutor were given a 6 by their peers (slightly more than a pass). These results are divergent. Range 7–8: 72% of the marks given by the students in peer assessment fall into this range while 50% of the marks given by the lecturer fall into this category. These results can be said convergent. Range 9–10: There seems to be a tendency to invert the situation for the highest marks: the students appeared less likely to give a 10 (6 given by the lecturer against only 2 in peer assessment). Considering the ‘9’ marks, an equal number of ‘9’’s was awarded by students and tutors. These results can be said convergent but with a tendency to diverge.
Concerning the first two ranges above, in which the results are divergent between the lecturer and the students, peer assessment was found to be more generous than the tutor’s. However, it should be noted that the students are able to grade the presentations according to their merit – exactly as perceived by the tutors. All concur that there are six presentations worse than the others, in which two are clearly worse than the other four, and this was not a subjective judgement: there was unanimous agreement on this.
On the other hand, the last range (9–10 marks) suggests that students seem to avoid marking their peers much higher than what they feel they are likely to get themselves.
Another relevant aspect that is generally pointed out as a source of bias is hostility. 17 However, when dealing with a large number of students and admitting hostility exists only between a few students, this will be averaged out eventually.
What is left is a bulk of marks allocated by the students in the tight and narrow 7–8 range, even though we must recognise the tutors also felt that the majority of presentations would fit in this category.
Normalisation of the peer-assessment marks
One important conclusion from the previous analysis is that the peer-assessment marks are narrow-banded when compared to the tutor marks. Peer-assessment marks range between 5 and 10 (6 marking intervals considered) whereas tutor marks range between 1 and 10 (10 marking intervals considered). In an attempt to stretch this band (i.e. to increase its range) so as to match the tutors’ marking range, the following formula is suggested
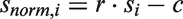
In this equation,
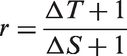
Determination of c can be done by imposing one chosen criterion, for instance the maximum mark allowed or the target average. In this case, the criterion adopted was that the average would be the same for both the students and the tutor, i.e.
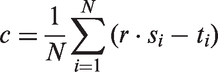
The values of si and ti are the marks received by student i from their peers and the tutor, respectively. These values are the exact averaged values and not rounded values as shown in the histogram earlier. In the present study, the values so obtained were
The correlation between two sets of marks, say the peer-assessment marks and the tutor’s marks, can then be determined from the Pearson product-moment correlation coefficient
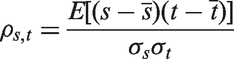
Results of the normalisation procedure are shown in Figure 5 bar chart, along with the tutors’ marks and the original peer-assessment marks. It is very interesting to notice how this adjustment process changed data. Now there is a very strong correlation between the two sets of data (tutor and peers normalised), highlighted by the area charts that are almost perfect matches. In terms of the Pearson correlation factor between the peer and tutor marks (equation (4)), it improved from 94 to 99% after normalisation. Analysis of these results will be done following the same reasoning as before, i.e. by highlighting selected ranges of the plot represented in Figure 5
Range 1–4: The same six students that were identified by both the students and the tutors as having the worst presentations are now in the ‘fail’ range (peer assessment originally placed them at the 5–6 range). However, even though the normalised range was stretched so as to include 1, the worst mark obtained was as high as a 3. It is interesting to note that, now, only one student is divergent between the tutors’ perception and the students’ perception. Range 5–8: All results are now very similar when comparing the tutors and the normalised peer-assessment marks, especially with respect to the 6th and the 8th marking ranges, in which the relative difference between the number of students included by the tutors and the peers drops from 69 to 23% in case of the 6th range and drops from 50% to only 3% in case of the 8th range. Range 9–10: There was some improvement in this range as well. This normalisation allowed that one student being graded 9 by their peers now receives a 10 and one student being graded 8 by their peers now receives a 9. Histogram showing the amount of times a grade was given, including normalisation of the peer-assessment marks.
Finally, a comment on the apparent coincidence between the lecturer’s marks and the normalised peer-assessment marks. At a first glance, it may seem that equation (1) and the subsequent reasoning serve only to adjust the numbers so as to fit the tutor’s marks. Nevertheless, this is only valid because the qualitative judgement of the students is coherent with the tutor’s judgement. What is happening is that the different presentations were naturally sorted from the worst to the best because the criteria (being holistic) tended to be based on comparison.
Conclusion
In this study, an attempt has been made to better understand how well peer and tutor assessment correlate, even if the awarded marks differ significantly initially. Engineering undergraduate students were invited to get involved in peer assessment by marking one another’s presentations about their Technical Drawing and Geometrical Modelling projects. A set of marking data with statistical significance (93 students’ sample) was analysed to assess how differently the students mark their peers when compared to the tutors.
The peer assessment was blind – the marks were kept anonymous from the students – to reduce any fears of discrimination. However, it was not possible to implement it in a double-blind peer-review fashion, as the students knew who they were marking, so it is possible that fear for discrimination and hostility was not totally reduced, although hostility is expected to be very localised and, thus, averaged out.
As might be expected, students tend not to fail their peers – neither do they tend to award the highest marks either. This means that the band where the students give their marks tends to be narrower than the one used by the lecturer. Yet, it was found that they are able to make a correct relative judgement between their peers’ performances (and thus themselves).
To mitigate this, a normalisation procedure to adjust peer-assessment marks has been presented, in an attempt to correlate peer and tutor assessment in quantitative judgements. This adjustment, that proved to significantly improve the correlation between the tutor’s and the students’ assessments, is still very dependent on the teacher’s perception (e.g. marking range and average). Thus, further study is still needed so as to conclude about its practical usefulness, especially when tutor’s marks are not available to establish reliable normalisation parameters.
Footnotes
Declaration of conflicting interests
The author(s) declared no potential conflicts of interest with respect to the research, authorship, and/or publication of this article.
Funding
The author(s) received no financial support for the research, authorship, and/or publication of this article.