
Abstract
In an effort to find a simple and efficient method for observing and predicting compressible flows in an instructional environment, we revisit the classical hydraulic analogy. The focus is made on using a water table apparatus to visualize the formation of oblique surface waves in a flow around a wedge. These waves are analogous to the oblique shock waves seen in a compressible flow. A mathematical derivation of this analogy is presented together with water table experiment data collected by graduate students. The comparison between the predicted values and measured values is made and shows a remarkable correlation between the two for simulated Mach numbers.
Introduction
Upper division and graduate level courses such as aerodynamics, aircraft design, propulsion, and flight mechanics spend a good portion of the curriculum addressing oblique shocks in compressible flows. This subject is discussed in the context of lift and drag forces generated over the supersonic airfoil, shock formation inside the air-breathing engine, the shock patterns of the rocket engine exhaust, and other applications. The derivation of fundamental equations are quite laborious especially considering the
The water table is a much cheaper device that can be used to simulate the supersonic flow by making an analogy between compressible waves in a gas to surface waves in an incompressible fluid.2,3 The mathematical formulation for the analogy has been developed by Jouget 4 and Riabouchinsky 5 and mentioned earlier by Mach. 6 Since then, the analogy was applied in studied of supersonic nozzles,7–9 channels.10,11 and diffusers. 12 More recently, Matthews used the water table to study the compressible effects on the airfoil cascade. 13 Lavicka used the method to study compressible flow outside a nozzle. 9 The hydraulic analogy was also given attention in studies of oblique shocks. Arendze 14 used the analogy to predict the oblique shock formation around stationary and accelerating wedges. Elward 15 predicted the formation of oblique shock waves in the context of studying the efficiency of a gas turbine over the lifetime of the turbine blade. Hatch presented a study of oblique shocks over airfoils. 16
The cost effectiveness of the hydraulic analogy using a water table is an attractive option for instructional use in academia.14,16–18 Linke et al. present a comprehensive description of an entire undergraduate course on airfoil and nozzle design and manufacturing utilizing a water table.19.20 Morishita provides a derivation for the hydraulic analogy for the oblique shock waves to be used in a cost-effective student demonstration 21 ; however, the comparison between the experimental data and theoretical predictions seems to be lacking. Hafez et al. 22 show pictures from flow visualization pictures over various shapes that can be used in schools to illustrate compressible flow phenomena.
This article describes an experiment that is implemented in graduate fluid mechanics courses at Manhattan College designed to promote active learning during lectures on oblique shocks. In this article, we revisit the classical derivation of the hydraulic analogy of the oblique shocks. Then, student data from an experiment are presented that shows comparison between the predictions of shock angles for various deflection angles using this theory and the measured values from the water table.
Theoretical considerations
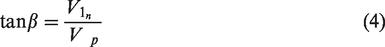
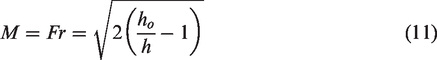
Here, we derive the expression for the oblique hydraulic jump deflection angle θ as a function of upstream Froude number
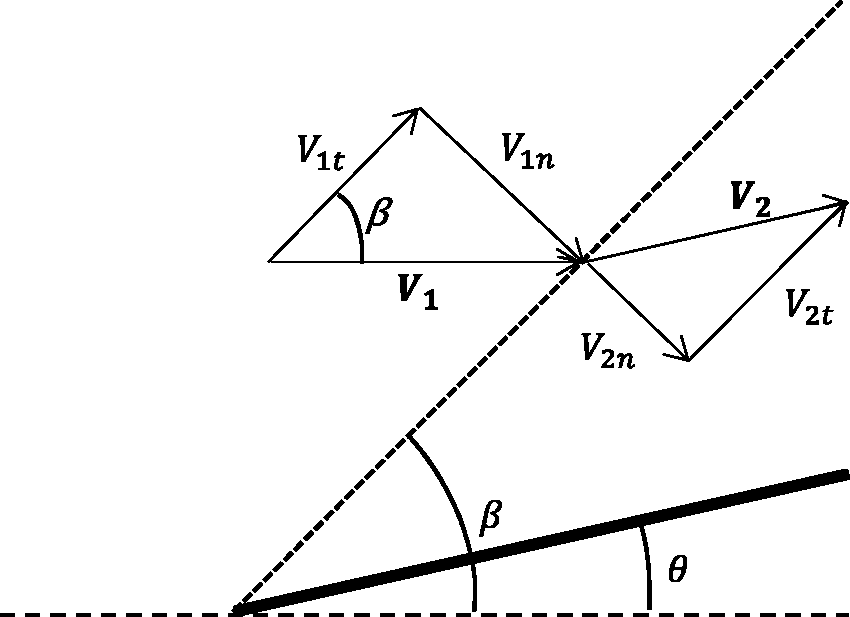
Sketch of velocity components upstream and downstream of a hydraulic jump produced by a deflection.
In this paper, we start with the normal hydraulic jump, using the well-known results for conditions before and after the jump. To simulate an oblique jump as in Figure 1, we do a “thought experiment” in which we observe the normal jump, except we are in inertial coordinates moving tangential to the jump at arbitrary speed Vp.
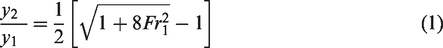
For a normal hydraulic jump it is known
23
that the depth ratio is
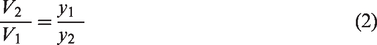
If we now change coordinates (as described above), choosing ones moving parallel to the jump at arbitrary speed
Here,
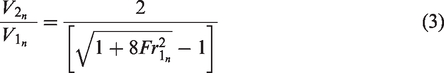
We next need to rephrase the equation in terms of
Hence, after simplifying
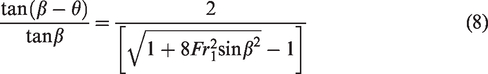
This equation relates the flow deflection angle
It can be solved directly for
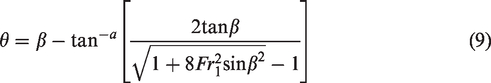
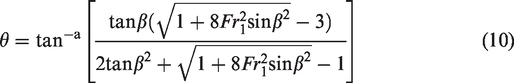
Note also that Morishita 21 recently presented the same simplified formula; however, the derivation was not presented, so the above derivation is included here for completeness, as well as pedagogical reasons. Equation 9 is implicit in jump angle β but is easy to solve on the PC (e.g., using Excel’s Solver, Goal Seek function, or iterative methods in MATLAB).
Experimental setup
The experiment described in this article was performed on a commercial Aerodynalog bench-top water channel manufactured by AMRAD INC, shown in Figure 2 and described in more detail in Part I.
18
The device is about 1.0 m × 0.5 m × 0.3 m in overall dimensions and consists of a closed loop channel, where water is driven by an electric impeller. The flowrate of the water can be adjusted from a maximum of about 1.5 L/s to 0.0 L/s by a valve that restricts the flow. After the impeller the water passed through flow-straighteners and was accumulated in a reservoir with depth
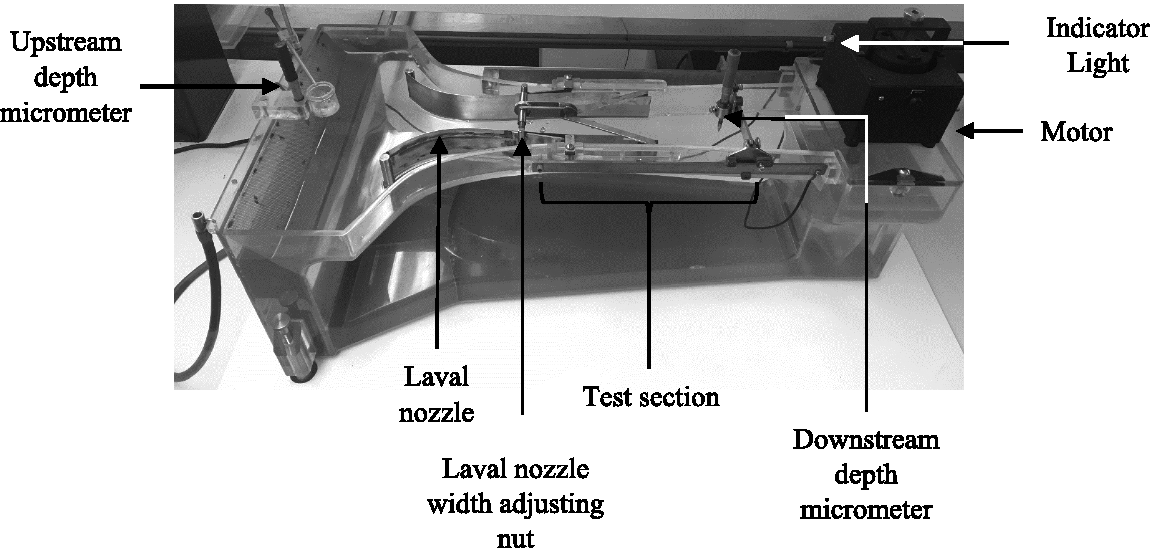
A water table manufactured by AMRAD, Inc. used in the experiment.
Two micrometer gauges were used to measure the reservoir water height
To produce an oblique shock wave, several wedges were 3 D printed from ABS material and sanded using a fine-grit sandpaper to produce a sharp edge. The angle formed between two sides of the model is twice the deflection angle, as defined in Figure 1. Eight models were used:
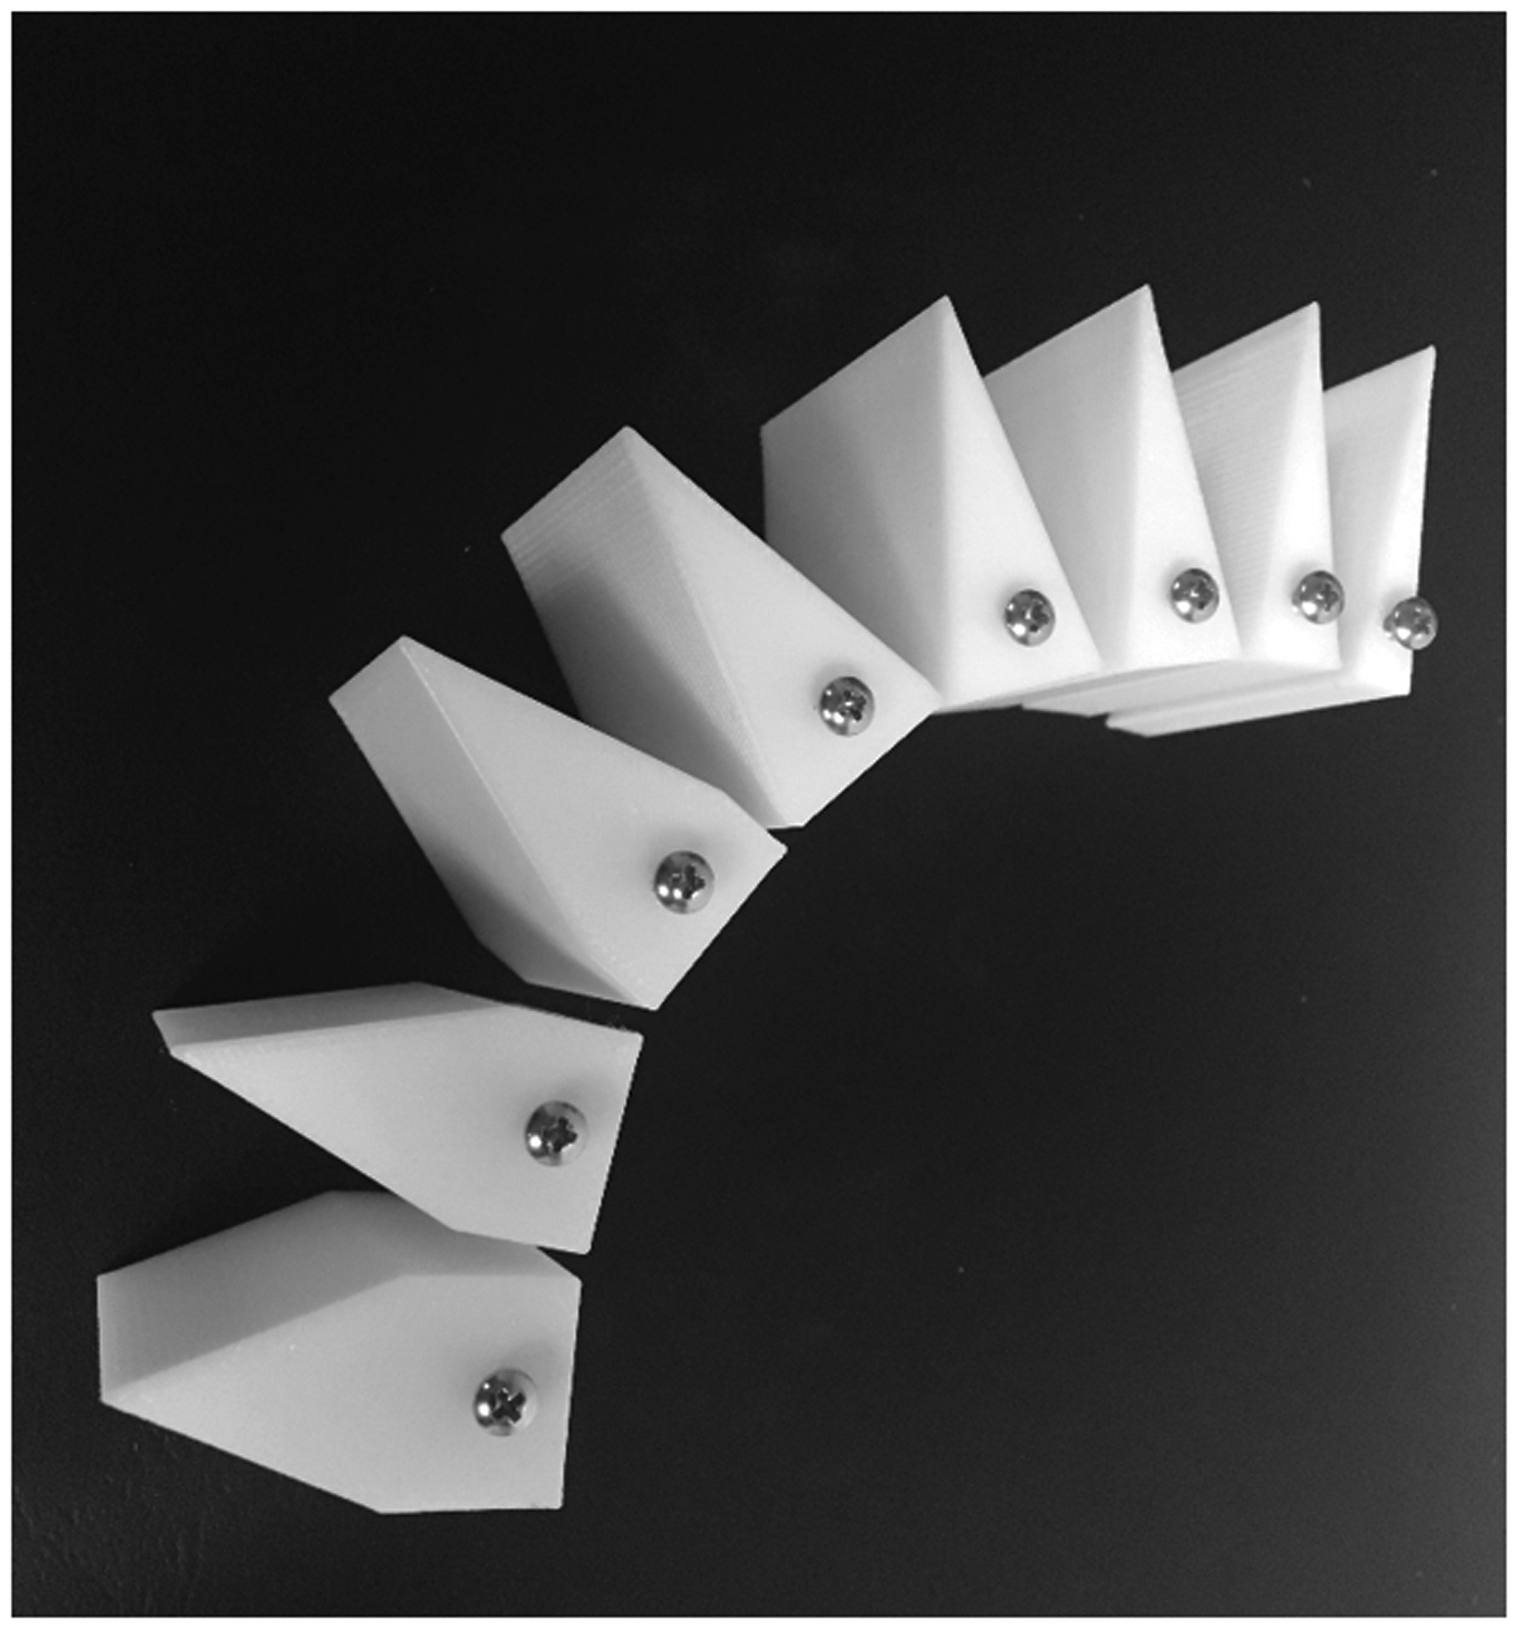
Wedge models used in the experiment.
Several patterns were printed in color and placed underneath the test section to better visualize the deformation of water surface and identify the location of water waves. Some of the patterns used are seen in Figure 4. Students used their smart phones to capture a still image of the pattern through the flowing water. The pattern seen though the water was distorted due to refraction caused by uneven water surface associated with the waves. The location of the most distorted pattern was associated with the steepest wave front on the water and therefore was identified as the location of the wave. The bullseye pattern seemed to work best for visualizing the oblique shock waves. It is evident, however, that a more quantitative approach may be implemented to better estimate the wave location. Garretson et al. present a more systematic approach to measuring the distortions due to refraction through the water wave and can be used to better estimate the location of the wave. 24
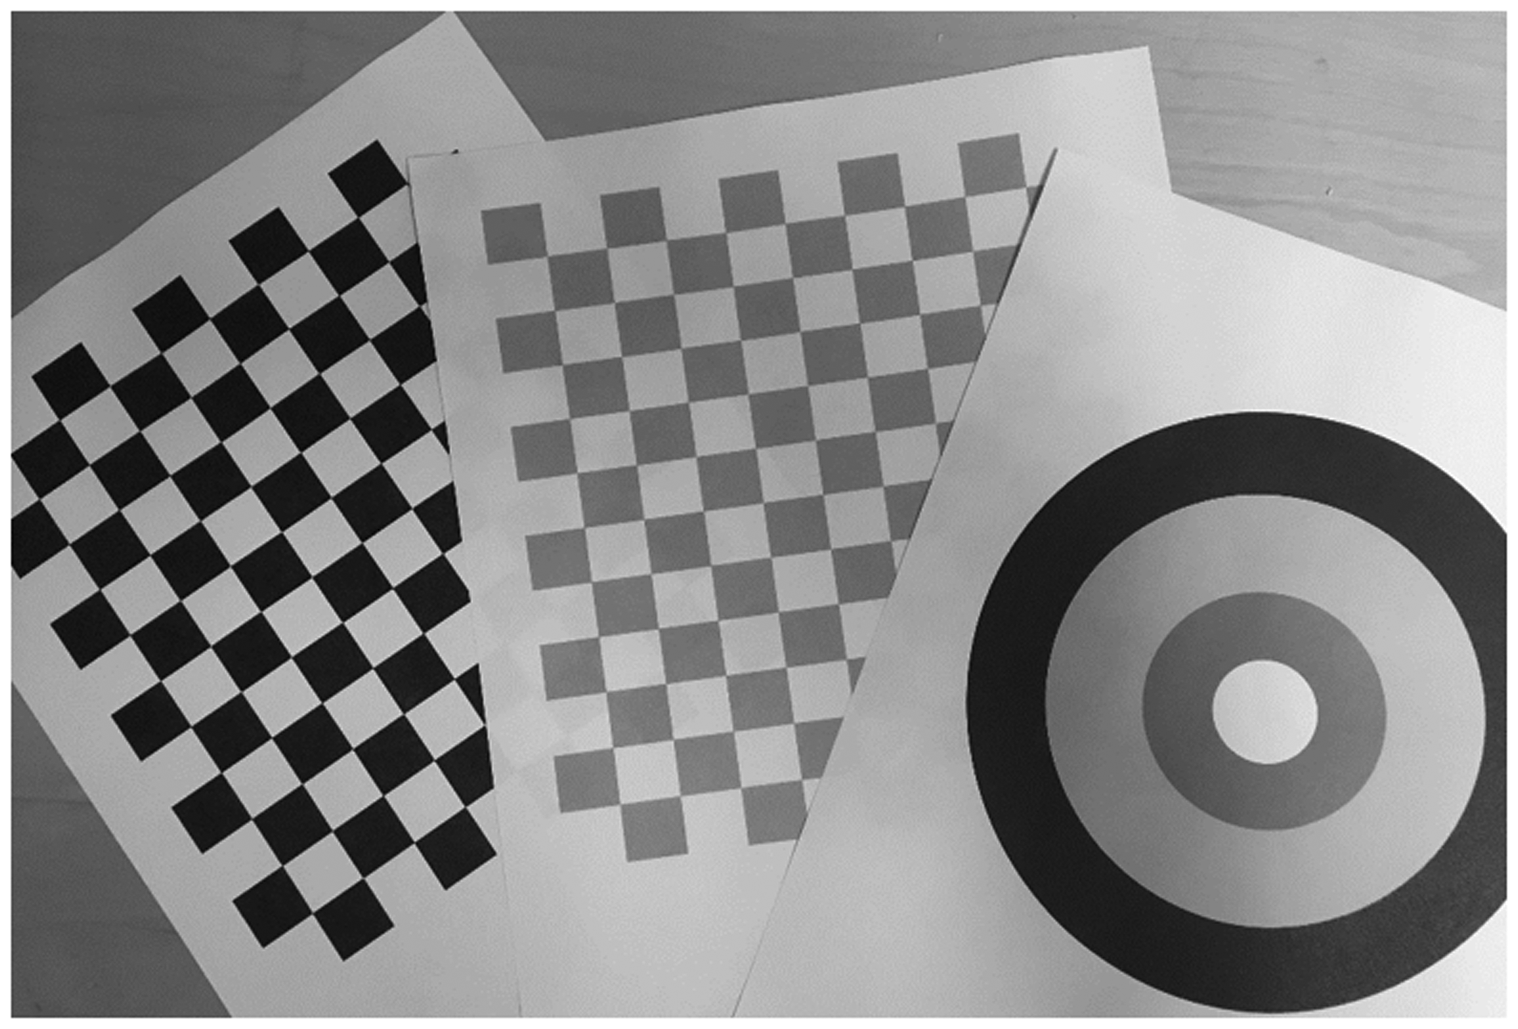
Patterned templates used to visualize surface waves.
Procedure
The width of the throat in the converging–diverging section was varied to give a range of
Students uploaded their captured images onto a laptop computer and used a MATLAB program to measure the angles of the oblique shock. This was done by visualizing an image in MATLAB and selecting points A, B, and C shown in Figure 5(a) using ginput built-in function, which returns coordinates of each point. Point C was identified as the location associated with largest distortion of the pattern. In Figure 5, the outer black circle in the pattern appears as a cascade of peaks. The largest peak represents the location of highest curvature of the water, which was a good estimate for the location of the dominant wave front. Based on coordinates of point A and B, the reference horizontal line was established. Based on coordinates A and C, the oblique shock line was established. The measured angle
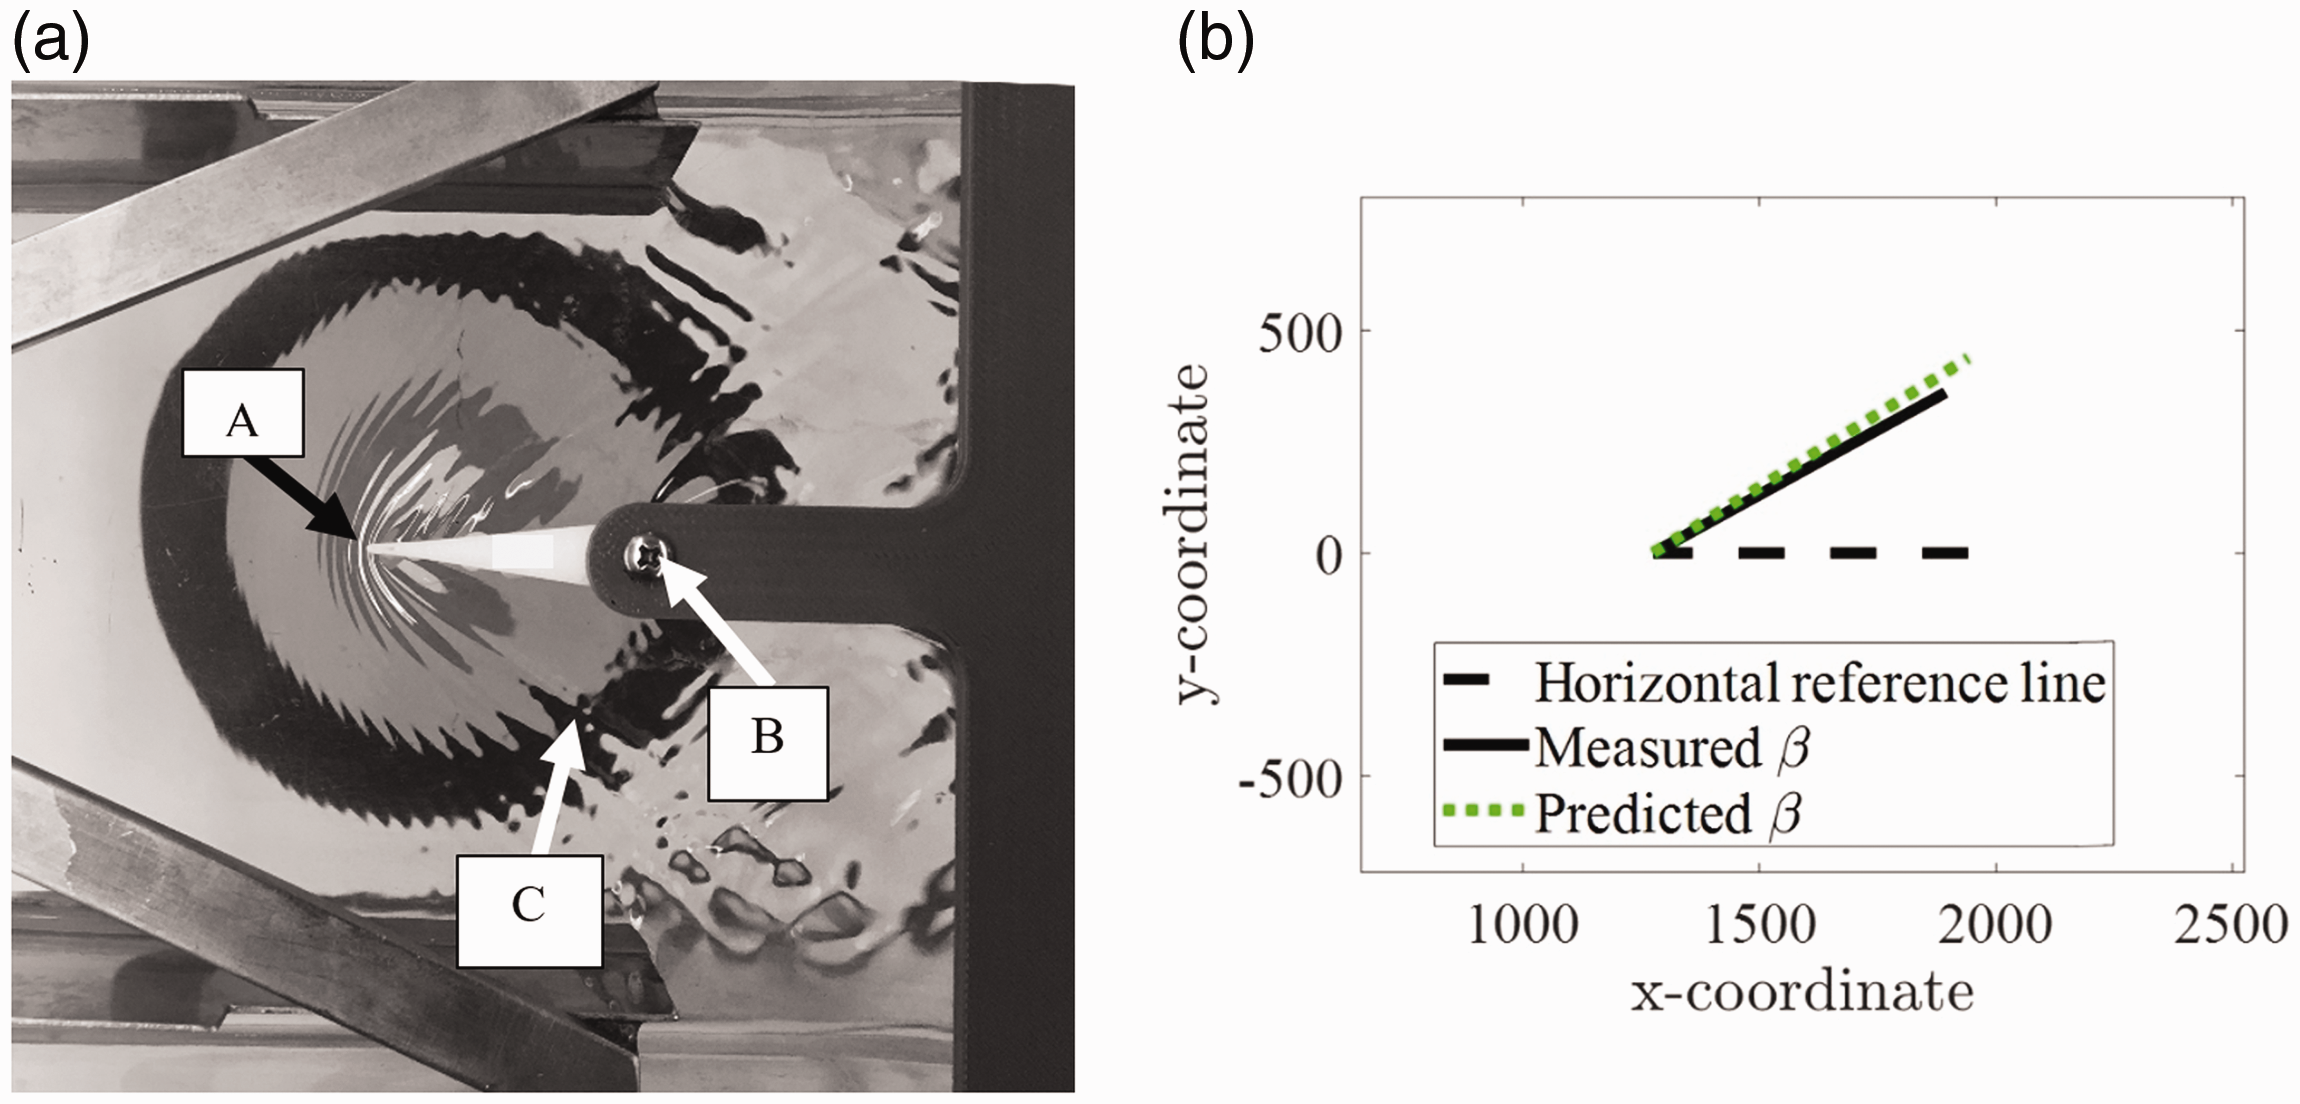
(a) Raw sample image of the oblique shock at
The experiment was designed to be performed by graduate students, who usually have a 3-h weekly class session. The first half of the session was spent deriving the hydraulic analogy and any theoretical considerations that are needed to perform the experiment. In the second half of the session, a class consisting typically of 15–20 students was divided into groups of two students. While the rest of the class started coding the theoretical prediction curves, one group was selected to collect data for one Froude number. Each group was given 10 min to adjust the apparatus to the desired Froude number and perform experiment for all wedge models. Allowing each group to set the apparatus to a unique Froude number allowed all students to familiarize themselves with other concepts such as back pressure as for each unique setting of the converging–diverging channel, the flow rate had to be adjusted to eliminate any waves in the channel, resembling concept of back pressure in the compressible flow.
18
As their homework, students were asked to compare the measured
Results
Table 1 shows a summary of results obtained by students in the experiment. For all Froude numbers, the wedge with a
Sample results of oblique shock study.
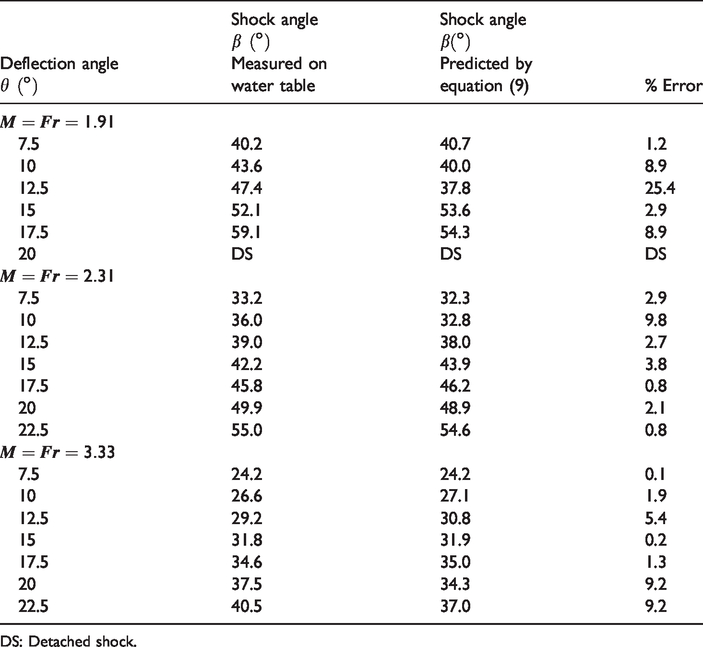
DS: Detached shock.
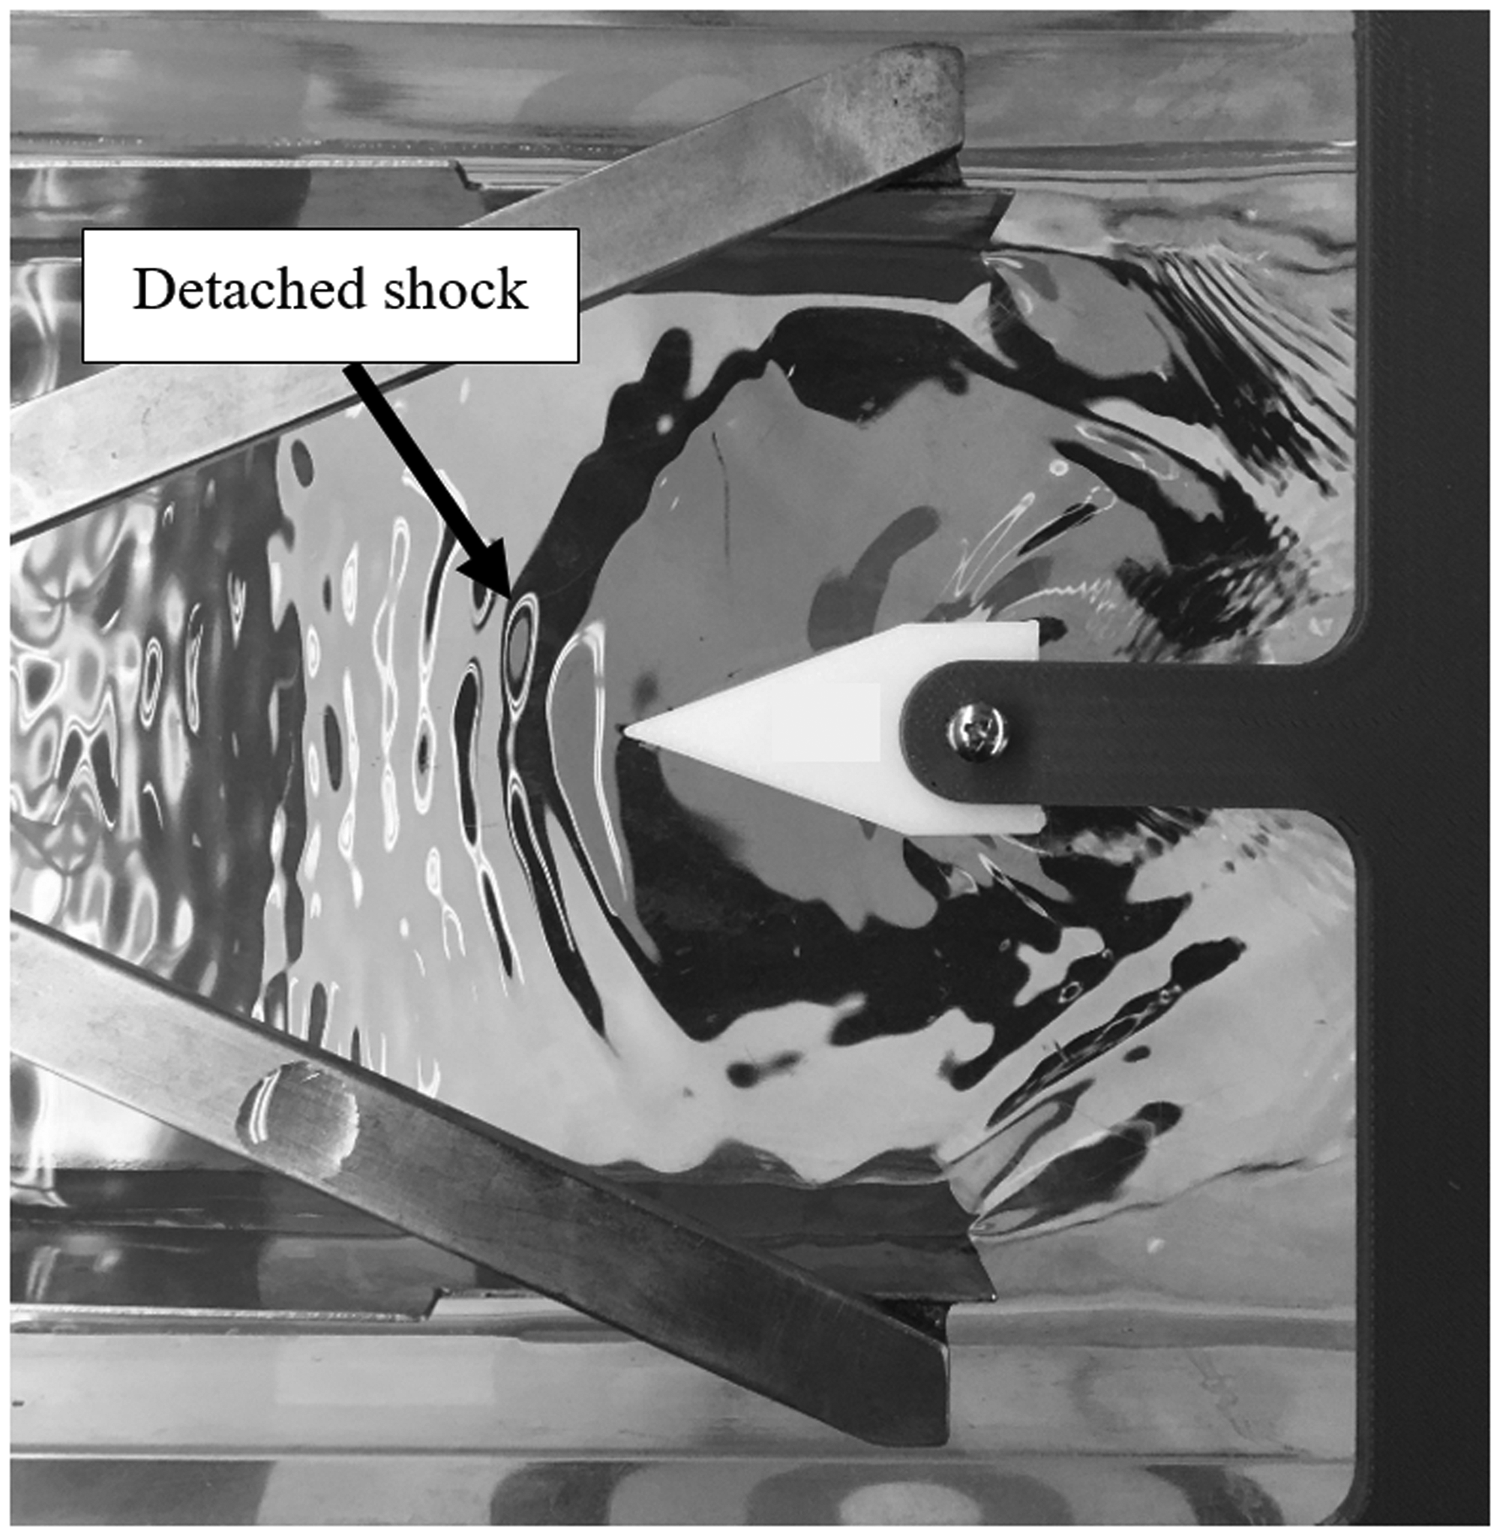
Observed detached shock at
Table 1 also shows the error associated with each trail between the predicted and measured values of the angle. Results show a remarkable agreement with predicted angles with error less than 10% in all but one trial. In the case of
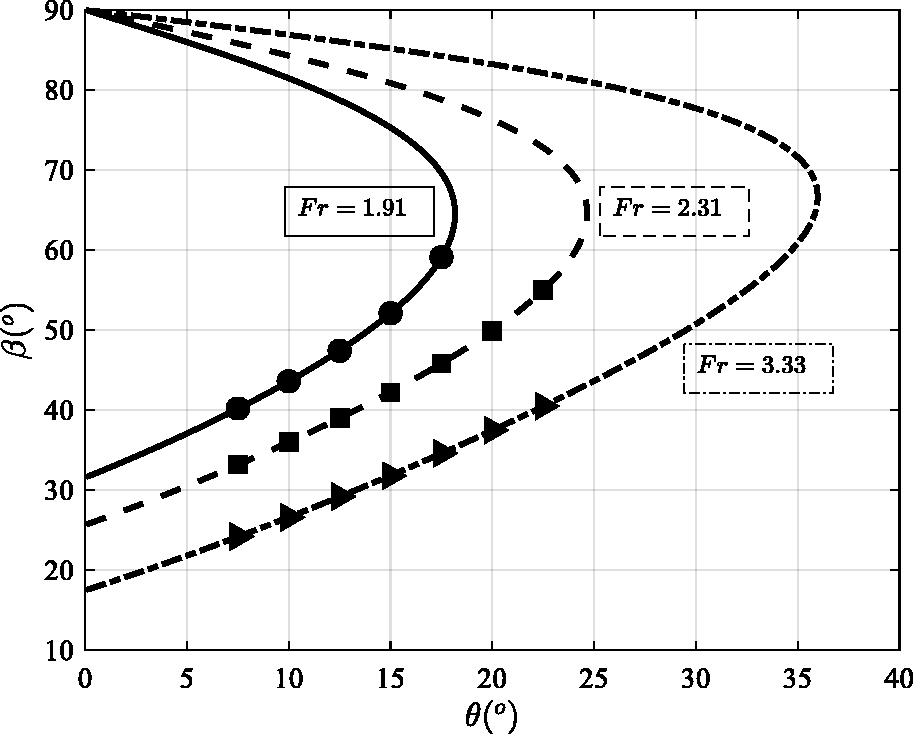
Figure 7 resents a graphical view of
Upon completion of the experiment, 18 students enrolled in the class were asked to fill out the survey evaluating this experience in the laboratory as pertaining to understanding the oblique shock theory and interest in the topic. The survey was a multiple choice questions type which evaluated if students strongly agree, agree, disagree, or strongly disagree with the effectiveness of the experiment. One hundred percent of the participants in the survey confirmed that the experiment helped them better understand the subject though visualization and that active participation in the experiment helped them gain interest in the subject. Moreover, students noted that they better understand compressible flow concepts, such as back pressure, flow Mach number, and other flow features simulated by the water table. The results from this survey were representative to results from students’ evaluations in other classes where this experiment was performed.
Conclusion
In this paper, we revisit the hydraulic analogy of the oblique shock waves. Theoretical considerations were re-derived. Data from a student experiment were presented and compared to the theoretical predictions. It was shown that for higher Froude number, the experimental results had a good agreement with theoretical predictions, with error of less than 10%. Further evaluation of the size of the model and the blockage of the test section on the overall results is recommended. For larger wedge angle models, the volume of the displaced liquid in the water table was significant and may have affected the flow speed around the model resulting is a local Froude number significantly different from the one measure using micrometers. The upper limit of size of the model for the existing test section size should be further evaluated that allows for accurate measurement of compressible waves.
Footnotes
Declaration of conflicting interests
The author(s) declared no potential conflicts of interest with respect to the research, authorship, and/or publication of this article.
Funding
The author(s) received no financial support for the research, authorship, and/or publication of this article.