
Abstract
Drawing on prior studies, green criminologists have hypothesized that climate change will both raise the mean temperature and the level of crime. We call this the “climate change-temperature-crime hypothesis” (“CC-T-C”). This hypothesis is an extension of research performed on temperature and crime at the individual level. Other research explores this relationship by testing for the relationship between seasonality and crime within a given period of time (i.e., within years). Climate change, however, produces small changes in temperature over long periods of time, and in this view, the effect of climate change on crime should be assessed across and not within years. In addition, prior CC-T-C studies sometimes employ large geographic aggregations (e.g., the entire whole United States), which masks the CC-T-C association that appears at lower levels of aggregation. Moreover, globally, crime has declined across nations since the early 1990s, during a period of rising mean global temperatures, suggesting that the CC-T-C hypothesis does not fit the general trends in temperature and crime over time. Addressing these issues, the present study assesses the CC-T-C relationship for a sample of 15 large (N = 15) US cities over a 14-year period. Given the CC-T-C hypothesis parameters, we assessed this relationship using correlations between individual crime and temperature trends for each city. Crime trends were measured by both the number and rate of eight Uniform Crime Report (UCR) Part I crimes, so that for each city, there are 16 crime-temperature correlations. Using a liberal p value (p = .10), the temperature-crime correlations were rejected as insignificant in 220 of the 234 tests (94%). We discuss the Implications of this finding and suggest that rather than focusing on the temperature-crime relationship, green criminologists interested in the deleterious effects of climate change draw attention to its larger social, economic, environmental and ecological justice implications.
The current study was designed to assess the hypothesis proposed in the criminological literature that temperature changes that accompany climate change have a positive association with crime rates (Ratton & Cohn, 2003)—or, in other words, the argument that climate change (CC), which is associated with increased temperatures (T), leads to an increase in crime (C). We call this the “climate change-temperature-crime” (or “CC-T-C”) hypothesis. This proposition has been offered as an extension of more traditional criminological research which examines the relationship between cyclical or within-year seasonal changes in temperature and crime (Rotton & Cohn, 2003), and the more specific suggestion by green criminologists that continued climate change and increasing temperatures will create conditions conducive to the growth of crime (Agnew, 2012; White, 2016). While criminologists and other researchers have examined the relationship between temperature and crime, those studies tend to consider that relationship within years or relative to seasonal temperature cycles (measured across seasons, months, weeks or days). Whether the observed season/cyclical relationship between temperature and crime also applies to longer-term, cross-year temperature changes generated by climate change requires further empirical attention. While a handful of prior studies state that they specifically measure a CC-T-C association, we suggest that there are two important limitations in the designs of those studies. First, some use large geographic areas and are conducted at too high a level of aggregation. The use of mean temperature to represent large geographic areas masks significant variability in temperature within those geographic areas (e.g., the mean temperature of the United States (US) hides more local temperature variations). Second, these studies, though sometimes done across years, continue to draw attention to assessing seasonality effects. The relationship between climate change and temperature appears across longer spans of time (i.e., years), and should be assessed across years and not seasonally.
To examine these issues, we begin with a summary of climate change research across disciplines, followed by a review of the criminological research on the association between temperature and crime. In assessing criminological studies of the temperature-crime association, we note that the majority of studies test for “seasonality”—or the variability in crime within or across years by month, weeks, and days, or seasons of the year. Whether such studies can be generalized to the longer-term effect of climate change on temperature across years—and then to the effect of temperature increases on crime—is an open question. We suggest that to answer these questions, studies must shift their focus from seasonality research to longer term examinations of the effect of temperature on crime at lower levels of aggregation (such as cities) to improve our understandings of the association between temperature and crime. We provide an example of this kind of analysis using crime and temperature data for 15 of the largest US cities over a 14-year time period. We use simple correlation analysis to ascertain whether there is a climate change-temperature-crime effect for various types of crime within cities across time.
Simple correlations are useful for such an analysis for two reasons. First, correlations suggest whether evidence of the predicted relationship exists at the most basic level, and correlational models should be employed as a precursor to efforts to construct multivariate models. In other words, correlational data can be employed to indicate whether more complex multivariate modeling of this relationship is required. Second, the nature of the CC-T-C hypothesis is predicated on the existence of an empirical relationship between temperature and crime at the univariate level, suggesting that the most basic assessment of this hypothesized relationship indicates establishing whether a long term temperature-crime association/correlation exists.
Background on Climate Change
Research related to the Earth’s atmosphere and its retention of heat was first conducted by Fourier (1824), and later expanded by Foote (1856), who connected Earth’s climate and planetary heating to retention of heat—specifically by carbon dioxide. Subsequently, Tyndall (1859) tested that relationship for different atmospheric gases. Specific scientific calculations of the effect of reducing atmospheric concentrations of carbon dioxide on Earth temperature were also undertaken by Arrhenius (1896).
In recent decades, numerous scientific studies have shown that humans are causing climate change through emission of greenhouse gases (for an overview, see, Cook et al., 2016). While an increase in heat-trapping gases produces an increase in mean global temperatures, localized or regional variations in temperature change can exceed the mean or, in fact, exhibit a reverse trend in some locations—cooling (for images of these effects over time, see NASE Earth’s Observatory map of temperature anomalies, http://earthobservatory.nasa.gov/Features/WorldOfChange/decadaltemp.php). In other words, while climate change increases mean global temperatures, there is local variability in temperatures and perhaps in local temperature trends. That possibility suggests assessments of the CC-T-C hypothesis should employ disaggregated or localized temperature and crime data so that local variations in temperature (or crime) are not masked by aggregation. As noted below, criminologists have long examined the effect of temperature on crime, and it is only more recently that they have been interested in assessing whether the increases in temperature associated with climate change might have an effect on crime and, as such, whether such linkages might be useful for predicting an increase in crime in the future.
While scientists initiated studies of atmospheric retention of heat and the effect of that process on the Earth’s temperature, criminologists raised the question of whether temperature affected the distribution and volume of crime. Criminological studies addressing this relationship have a long history, beginning with Quetelet (1831, 1842; for other early studies and commentary, see also Aschafenfenberg, 1913; Bonger, 1916; Dexter, 1904; Lombroso, 1911; Mill, 1901; Morrison, 1891; Mosby, 1913). In the aggregate, however, research addressing the temperature-crime association was sporadic until the mid-1980s (for early examples see, e.g., Brearly, 1932; Cohen, 1941; Curry, 1948; Falk, 1952; Kaplan, 1960; Koshal & Koshal, 1975; Lewis & Alford, 1975; Miller, 1968; Robbins et al., 1972). Post-1980 studies began to become more sophisticated empirically, using longer time periods, cross-cultural data, and data gathered across urban areas to assess the effect of temperature on crime (e.g., Anderson, 1987, 1989; Harries et al., 1984; Harries & Stadler, 1986; Michael & Zumpe, 1983). While a number of other studies during the late 1980s and through the 1990s could be cited (for a review of this research and other historical examples, see Baumer & Wright, 1996), what is interesting about these studies is their growth from the 1980s onward. DeFronzo (1984) provides a clue as to why this may have occurred. He states that around that time, the US Federal Bureau of Investigation (FBI) suggested that climate effected crime, and that this effect was independent of other factors that produced crime. Researchers thus began to investigate more extensively whether or not this was true.
The growth of temperature-crime studies continued, positing various explanations for the relationship between temperature and crime, and producing conflicting results that depended upon where this relationship was studied, as well as the types of crimes examined (e.g., Butke & Sheridan, 2010; Ceccato, 2005; Hipp et al., 2004; Mares & Moffett, 2016; Peng et al., 2011; Williams et al., 2015; Yan, 2004). Thus, while these studies have not addressed completely whether there is, indeed, a strong, persistent effect of temperature on crime, prior research does suggest that seasonality—that is, the season of the year or the within year temperature cycle across months—has some relationship to crime. But much about the potential temperature-crime relationship remains unaddressed, including whether the temperature-crime relationship is affected by climate change over the long run and not simply by within-year seasonality temperature cycles.
In 2003, Rotton and Cohn became the first to suggest, as far as we are can discern, that anthropogenic climate change might have an impact on crime, posing what we call the climate change-temperature-crime (CC-T-C) model. To assess this possibility, Rotton and Cohn (2003) addressed the relationship between mean US temperature and mean crime for the entire US from 1950 through 1999, and across states for 1960 through 1998. The aggregate US analysis showed an effect for temperature on assaults, but not for murder, while the state-level analysis discovered temperature effects for assault, burglary, larceny, rape and robbery, but not for homicides or motor vehicle theft. This study set in motion others that have attempted to assess the CC-T-C relationship. For example, in another study using large geographic units of analysis (57 nations), Mares and Moffet (2016) found that an increase of 1°C was associated with a 6% increase in homicides.
Ranson’s (2014) analysis of the association between temperature and crime for the entire US also used monthly data to estimate the effect of temperature on crime. Based on the results from a 30-year monthly time series for the entire US, Ranson forecast that for the 90-year time period from 2010 through 2099, climate change in the US would produce an additional 22,000 homicides, 2.3 million simple assaults, 1.2 million aggravated assaults, 2.2 million larcenies, 1.3 million burglaries, 580,000 motor vehicle thefts, and 260,000 robberies. When presented in this way, the figures suggest tremendous crime increases. Taken as annual averages, however, the increases appear less alarming. For example, for the 90 year period, Ranson’s model predicts an annual average increase in homicides of 244 due to climate change. Thus, for example, compared to 2009 with 15,399 homicides, an addition of 244 homicides in 2010 would produce an increase of 1.58% in homicides.
There is, however, reason to be cautious about Ranson’s estimates of the future impact of temperature on crime, and those forecasts can now be assessed with the passing of time. Since Ranson’s prediction of the future effect of climate change on crime begins in 2010, we can use 6 years of US homicide data (2010–2015) following that estimate to assess how that prediction has fared. In 2009, there were 15,399 homicides in the US. Based on Ranson’s model, and using his mean annual predicted change in homicides (244), by the end of 2015, there should have been an increase of 1,464 homicides, resulting in 16,863 homicides in the US. In 2015, however, there were actually 15,883 homicides, or 980 fewer homicides than predicted by Ranson’s model—though there were, indeed, more homicides in 2015 compared to 2009.
Moreover, the change in homicides—though that change may be influenced by other conditions as well— was not consistent from year to year, and was also not consistent with the temperature trend. In 2010 and 2011, homicides in the US decreased compared to 2009; while homicides increased in 2012, there were fewer homicides in 2012 than in 2009. In 2013 and 2014, homicides declined compared to 2012, and then increased by 1,719 in 2015 compared to 2014. How does this compare to the mean temperature trend during this time period? Because Ranson employed US temperatures, we refer to the mean change in US temperatures. The National Oceanic and Atmospheric Administration (NOAA) (https://www.ncdc.noaa.gov/sotc/national/201513) reports a positive temperature anomaly for the 2010 to 2015 period compare to the twentieth-century mean, a positive anomaly for each of the years examined here (ranging from 0.3° to 3.2°), and an increase in mean US temperature for each year compared to 2009. From 2009 to 2015, the mean US temperature increased from 53.1° to 54.4°, with 2012 (55.4°) being the highest mean temperature on record since 1895. 1 It is plausible, however, that over the long run or in the future, Ranson’s predictions and the actual number of homicides may converge, but during this short period beyond his 2009 estimate, the predicted number of homicides, the actual number of homicides, and the trend in homicides and temperatures do not converge in the expected manner predicted by Ranson.
Geographic Limits of Temperature Change Measurements
The limitations of the above studies concern the broad geographic areas used to test the CC-T-C model (for further discussion see, Lynch et al., 2020). While climate change produces an increase in the global mean temperature, temperature can nevertheless vary significantly geographically—across the US or even within US states, as well as across the boundaries of and within other nations. Prior criminological studies that employ large geographic areas (e.g., the US as an entire country; individual US states) as the level of analysis and that use a mean temperature for the entire US, assume that the mean change in temperature for the 3.8 million squares miles covered by the US applies equally to all specific locations within the US. Measuring mean temperatures for large geographic areas may not, however, provide the best indicator of local temperature variations because the mean temperature and trends in mean temperature for large areas may not be the best measure of changes in temperature occurring in different or specific locations within a large geographic area. Even within states, which are still large geographic areas, differences in the trend in temperature change have been found. 2 To address this issue, in our view, requires the use of “lower level” geographic models or less highly aggregated geographic data to assess the CC-T-C hypothesis more appropriately so that the mean temperature being measured better reflects local conditions.
Consistent with the latter observation, Williams et al. (2015) used data on temperature and crime for urban areas in New Zealand for the years 1996 through 2007 to test the CC-T-C hypothesis for assaults. This model is better suited to assess the CC-T-C effect because it uses a more appropriate level of aggregation and includes data over time. Williams and colleagues found evidence of a small effect of temperature change on assaults, noting that a 1° change in temperature produced a 1.5% increase in assaults. Though local temperature variations need to be considered, the global mean temperature has increased by about 1.4°F since 1880, meaning that Williams, Hill and Spicer’s findings would not indicate a large effect on crime in New Zealand. At the same time, the temperature trend in New Zealand has been greater than the global mean, so that if climate change does have an effect on crime through temperature, the impact would be greater in New Zealand. In addition to the above, two separate studies using monthly crime and temperature data from St. Louis, Missouri, over 20 years by Mares (2013a, 2013b) find support for the CC-T-C model. Mares (2013a) also noted that the effect was greater for neighborhoods that experience social disadvantages.
While the three studies cited above (Mares, 2013a, 2013b; Williams et al., 2015) were conducted at a more appropriate level of geographic aggregation for assessing a CC-T-C relationship, those studies continued to rely upon the assessment of cyclical or seasonal changes in relation to crime. In our view, studying the effect of temperature on crime across months (or weeks or days) or using seasonal variation and assessment measures to estimate the effect of temperature on crime does not address the scale of temperature change associated with climate change that occurs over years and decades. Such temperature changes, because they are rather small, are noticed across longer time spans, and thus studies of CC-T-C should use annual temperature rather than monthly temperature variations, and cover at least a decade of time.
The Current Study
Given the review above and our assessment of those studies, we suggest that the CC-T-C hypothesis ought to be tested using annual temperature and crime measures over relevant geographic areas (the level of analysis) that are not so large as to mask temperature variability. On this point, we believe Williams et al. (2015) and Mares (2013a, 2013b) made appropriate decisions about the correct level of analysis by using urban areas and cities, respectively. Those studies, however, continued to assess for seasonality. To overcome limitations in prior research, in the present study, we selected cities as the appropriate unit of analysis, and used data on mean temperature for cities and city crime counts and rates to measure the level of crime and temperature annually. Our sample consists of 15 of the 16 largest US cities using population size as the measure of “largest.” Among the largest cities, we omitted Houston, Texas, because of limitations in locating accurate measures of some crime indicators in that city.
Historical data for annual mean temperatures for cities in the sample were collected from the NOAA’s National Centers for Environmental Information. To do so, we used NOAA’s “data tools” to locate temperature measurement stations within each city (https://www.ncdc.noaa.gov/cdo-web/datatools). Many cities have multiple temperature measurement stations, and where possible, we selected the station closest to the geographic center of the city. 3 This was not always possible because some of the newer measurement stations, which were closer to the geographic center of the city, do not have long term data available. In such a case, we picked the next closest temperature measurement station using the data tool (https://www.ncdc.noaa.gov/cdo-web/datatools/findstation). We also attempted to construct a mean temperature for each city employing all stations in each city. We found, however, that the time periods covered at all stations did not include temperature measures for the entire time period in which we were interested.
Crime data for cities were collected from various sources because not all cities have public access files that contain crime data for the desired period. These data were, therefore, collected from multiple sources, including city and state crime data sources, national Uniform Crime Reports housed by the FBI, and, in some cases, where there was missing data, from real estate websites which report crime data from city sources. In using data from real estate websites, we also assessed whether the missing data seemed reliable/reasonable by assessing whether the other years of data on the real estate site matched the data from official data sources. The real estate data on crime was useful because it contained data missing from city reports that were no longer available via the internet. In some instances where we discovered discrepancies between real estate and official crime data, the difference was typically related to reporting the rates of crime in a city. This variation in crime measurements, we determined, was based on divergent population estimates used for calculating crime rates in different data sources. In these cases, we referred to US Census city population estimates to recalculate crime rates.
Our data included crime counts and rates for the eight crimes contained in the FBI Uniform Crime Report—the four violent crimes (murder, rape, robbery, and aggravated assault) and the four property crimes (burglary, larceny, motor vehicle theft and arson). Arson data was the only measure that was missing for some cities (for three cities there was a total of four missing arson measures). We did not measure the “less serious” Part II crimes, which are well known to exceed Part I crime counts. These crimes may have different trends than Part I crimes and, if included, might affect our results. Prior research and theory, however, provide no rationale for assessing the effect of climate change or temperature on less serious crimes.
We collected temperature and crime data for the period 2002 through 2015. In comparing crime source data, we noted significant variations in the reporting of 2015 crime data, and where such differences occurred and could not be explained by variations in the population measures employed to produce crime rates, we averaged the crime counts and generated new rate indicators. We selected 2002 as the starting point for two reasons. First, we believed that a CC-T-C analysis, to reflect increasing temperature associated with climate change, should be based on, at the minimum, a decade of data. Second, we found it difficult to locate reliable, longer term temperature measures prior to 2002 for some cities in the sample.
The cities in the sample included, in rank order of population: New York; Los Angeles; Chicago; Philadelphia; Phoenix, San Antonio; San Diego; Dallas; San Jose; Austin; Jacksonville; Indianapolis; San Francisco; Columbus, Ohio; and Fort Worth, Texas. The combined population of these cities was about 28.1 million—or about 9% of the total US population in 2014. Thus, while the sample represents only a handful of cities, it reflects a significant proportion of the US population exposed to temperature fluctuations. It should be noted that Houston is in the top 15 US cities by population. As noted above, we eliminated Houston from the sample due to unreliable crime data, and added the next largest city, Fort Worth. Even though we selected cities based on population, these cities were diverse geographically, but also somewhat clustered (i.e., four in California, four in Texas).
Analysis and Findings
For the analysis, we selected the use of Pearson’s R correlations between temperature and crime within each city over time. Our reason for selecting the use of Pearson’s R is that the hypothesis being tested asserts a simple bivariate relationship— that temperature and crime are related. Thus, the most parsimonious test of that hypothesis is a simple correlation. If the hypothesis is to be considered minimally appropriate or cannot be rejected, then the Pearson R between temperature and crime within each city from 2002 through 2015 should be positive and statistically significant. For significance, we selected p < .10. This choice, we believe, is a rather liberal criteria. Selecting p < .10 would lead to a reduced chance of rejecting the hypothesis, and thus there would be fewer instances where we reject the hypothesis than if we had chosen a stricter p value (e.g., p = .05, or .025, or .01). We tested the hypothesis in each city on both the crime count and the crime rate across time. The use of this technique allowed us to test the initial conditions of the assumption of CC-T-C hypothesis in 234 separate correlations (that is, for 15 cities, and eight measures of crime as both a count and as a rate). There are 234 rather than 240 cases due to missing count and rate data for arson in three cities.
The results of the correlation analysis are presented in Table 1. In Table 1, highlighted (dark) figures represent cases where the hypothesis was
Pearson’s R Correlations, Temperature and Crime (Number [N] and Rate [R]), 2002 to 2015 (N Years = 14).
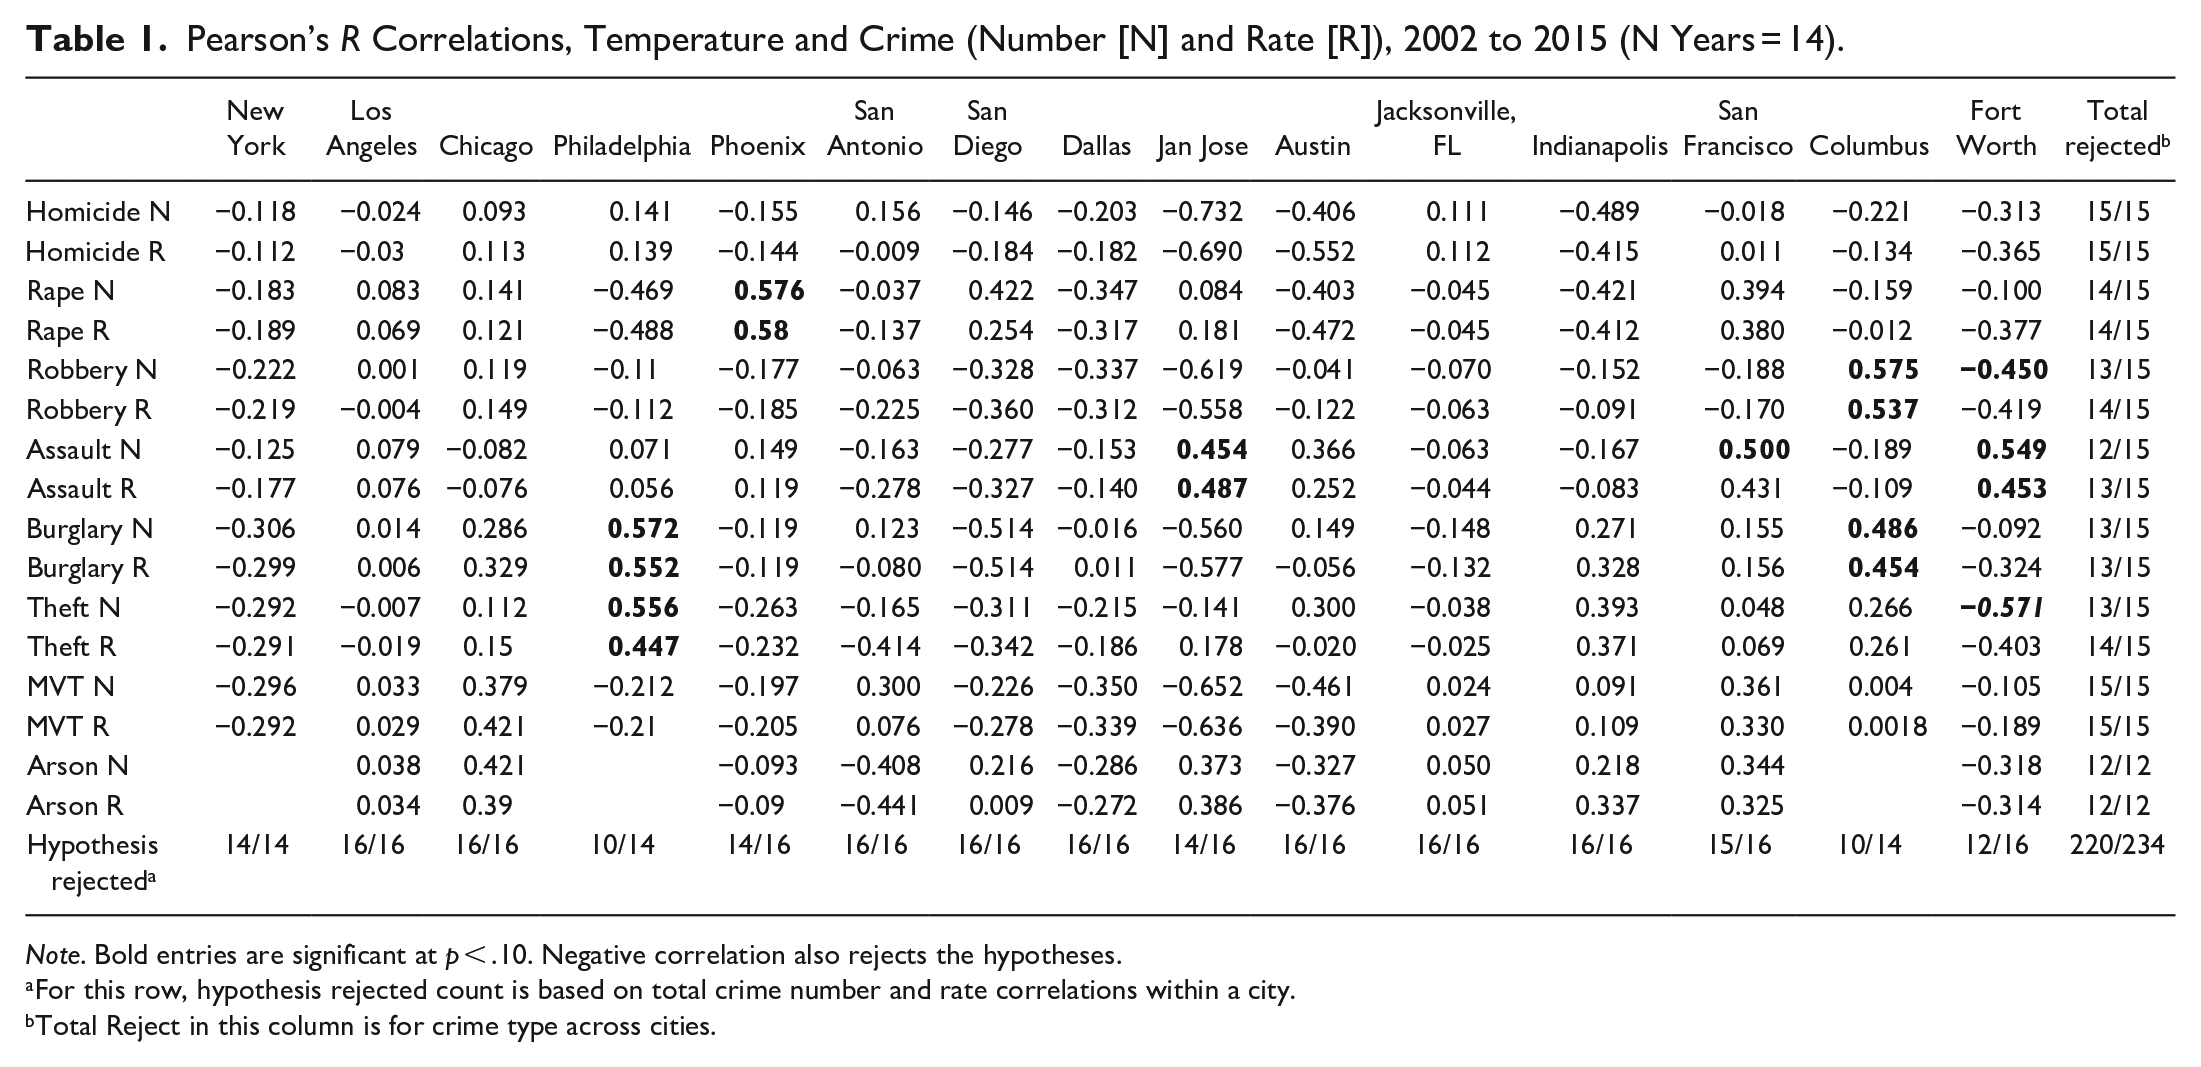
Note. Bold entries are significant at p < .10. Negative correlation also rejects the hypotheses.
For this row, hypothesis rejected count is based on total crime number and rate correlations within a city.
Total Reject in this column is for crime type across cities.
Across the 234 tests including both the crime count and rate correlations, conditions for
Within the 15 cities, the expected temperature-crime association was rejected 100% of the time in 9 (60%) of the 15 cities examined: Austin; Chicago; Dallas; Indianapolis; Jacksonville, Los Angeles; New York; San Antonio; and San Diego. In one city (San Francisco), the hypothesis was rejected 15 out of 16 times. In three cities (Phoenix, and San Jose), the hypothesis was rejected 14 out of 16 times in each location. In two cities (Columbus and Philadelphia), the hypothesis was rejected 10 out of 14 times in each location. In Fort Worth the hypothesis was reject 12 out of 16 times. There is no clear geographic pattern in cases where the hypothesis was not rejected.
For individual crime types, there is no indication of a pattern of a significant temperature-crime relationship. For homicide, motor vehicle thefts and arson, all temperature-crime relationships (both for the number and rate) across all cities were rejected. For rape, theft, burglary, and robbery, the hypothesized relationship was either 13 or 14 out of 15 times for crime count and rate correlations. For assault, the correlation was rejected 12 and 13 times respectively for the count and rate measures. In sum, across the aggregated data, across cities, and within crime types, there is no evidence of a significant relationship between temperature and crime in these data for 15 cities over the period 2002 to 2015.
As noted above, two cities (Columbus and Philadelphia) were “an exception” to the much more widespread hypothesis rejection pattern. Still, in these two cities, across the eight crime count and rate measures, the hypothesis was rejected 20 out of 28 times—or 71.43% of the time. For these cities, one might be tempted to explain why there is “more” evidence of a temperature-crime association—even though that
Moreover, as we noted above, we used a liberal p value in determining whether the temperature-crime correlations we examined were statistically significant. If, for example, we had employed a more stringent test where p = .05, the hypothesis would have been rejected in six additional cases; and if we employed a very stringent test where p = .01, the hypothesis would have been rejected in
Discussion
The relationship between temperature and crime has long been of interest to those studying the distribution and explanation of crime. Following increased scientific research addressing climate change, and after amassing numerous studies about the extent and deleterious effects of climate change, criminologists proposed that perhaps the temperature-crime relationship could also be employed to understand how climate change, which increases the global mean temperature, might impact crime. Based on studies of seasonality in the temperature-crime relationship, criminologists suggested that as climate change continued to cause temperatures to rise, crime would also rise. That hypothesis was advanced in the face of contradictory facts about the actual trend in crime—namely, that globally, crime has been largely in decline since the early to mid-1990s, while, at the same time, global mean temperatures have increased.
To test the CC-T-C hypothesis, we examined correlations between temperature and crime for eight crime types using both count and rate data across 15 American cities for the time period 2002 through 2015. We used simple correlations to ascertain whether there was even basic evidence of a relationship between temperature and crime among these cities. We estimated 234 temperature-crime correlations, which rejected the temperature-crime hypothesis in nearly 93% of cases (p < .10). We also assessed within city effects, as well as crime-temperature relationships for individual crime rates and counts, and found that all of those relationships were also overwhelmingly rejected.
Recall that we suggested that appropriate tests of the CC-T-C hypothesis should: (1) be evaluated with low-level aggregated data; (2) that the tests should span at least a decade to capture long term changing temperatures produced by climate change; and (3) that the analysis should not be based on assessing the temperature-crime relationships in relation to within-year changes—or for what we called “seasonality.” Meeting those criteria produced results inconsistent with CC-T-C hypothesis. Our results suggest, then, that within year seasonality (temperature-crime effects) do not generalize across years, and are insufficient to support a CC-T-C hypothesis.
The implications of this study suggest that temperature and crime trends in the most populated US cities do not conform to the expectations of the CC-T-C hypothesis. Indeed, those results were so persistent that they would seem to recommend that this hypothesis be placed to rest (one might say, at least, for the time being). Yet, it could be argued that what remains unknown is whether the CC-T-C hypothesis works, perhaps, under other conditions, such as for cities in nations other than the US, and for smaller cities or other geographic units (e.g., rural areas) that were not examined here. These other questions remain open for future quantitative examinations. If, however, findings from other collections of cities of different sizes, or cities in other nations, or rural areas, or over longer periods of time contradict our results, one would still be left with explaining these divergent results and making sense of those contradictory findings.
Also left unanswered is the question concerning whether the temperature-crime relationship seen in these data might change in the future. Nothing in our results precludes that possibility, and it is possible that as climate change progresses, it may create temperature-related conditions that could potentially impact crime. But, we would suggest, more important than the temperature-crime relationship is the association between climate change and collective violence found in a number of prior studies (for review of this research, see Levy & Sidel, 2014). Thus, while climate change may or may not affect crime, research has already established that it impacts collective violence and disorder. Criminologists have undertaken little research to address the problem of collective violence (Short & Wolfgang, 1972), and it may be that the more important impact of climate change on behavior is not its effect on crime, but its ability to cause collective mobilization and violence related to, for example, mass climate change migrations (Barnett & Adger, 2007; Reuveny, 2007). How criminologists address this issue remains an open question.
More important than the question of whether climate change causes crime to increase through a change is temperature is the observation that climate change generates social and economic injustice. Addressing these forms of injustice also appear relevant to the discipline of criminology and its concern with theories and philosophies of justice. Research suggests that, for example, among other outcomes, there is a relationship between carbon emissions and economic inequality (Jorgenson et al., 2016); that the effects of climate change will be unequally distributed across nations, with the poorest nations bearing the greatest burden (Mendelsohn et al., 2006); that climate change is driven by a minority of the global population’s wealthy consumers (Lynch et al., 2019; Michael & Vakulabharanam, 2016); and that deleterious forms of injustice caused by climate change are already being experienced by economically marginalized groups and nations (Füssel, 2010), including Indigenous populations (Lynch & Stretesky, 2012; Lynch et al., 2018; Maldonado et al., 2013; Smith & Rhiney, 2016). We suggest that criminologists can also contribute to studying and addressing the forms of injustice that climate change produces.
For those criminologists who reject the above assertion, believing that instead of broad justice questions related to economic, environmental, public health and social justice, criminologists should restrict themselves to analysis more directly related to criminal justice institutions, we offer the following consideration. Pease and Farrell (2011) suggest that crime and its control have numerous carbon costs. The carbon costs of the criminal justice system are large in some sense, especially in nations such as the US, and operating a vast criminal justice process produces carbon dioxide which contributes to other forms of injustice (Lynch, 2007). Thus, in order to reduce the forms of injustice related to climate change associated with operating the criminal justice system, criminologists can—and we believe should—draw attention to ways to reduce the carbon footprint of criminal justice processes to assist in reducing anthropogenic climate change. Some criminal justice activities have relatively large carbon footprints. For example, in the US, urban and highway police patrols involve the use of inefficient vehicles for these purposes; there are also carbon costs associated with the extensive use of imprisonment and other forms of incarceration in the US, such as jails, which are larger in the US than elsewhere given the disproportionate size of the US correctional system (Lynch, 2007). Overall, the total carbon footprint of the US criminal justice system may constitute only about 1% of the total US carbon footprint; yet, any reduction that can be made in criminal justice carbon emissions contributes to the goal of both reducing climate change gases in the Earth’s atmosphere and lessening the forms of injustice carbon pollution generates. We must also note that while the 1% estimate above seems small, those emissions surpass the total CO2 emissions of approximately 150 nations.
In addition, another dimension of the climate change-criminology intersection concerns its implications for studying the crimes of the powerful, which is an under-researched area within criminology. A handful of prior studies have addressed the intersection of climate change, criminology and the crimes of the powerful (e.g., Kramer, 2013; Kramer & Michalowski, 2012; Lynch et al., 2010; Lynch & Stretesky, 2010). But here, again, much work remains to be done. Importantly, what these studies also imply is that global warming itself can be treated as a crime (Lynch et al., 2013) that is facilitated by the behavior of powerful economic and political actors and structures. This is, we suggest, more important that the traditional criminological emphasis on street crime, and addresses continued concerns with the forms of class bias criminology promotes and which permeates criminological research (Lynch, 2015). Climate change is, we would argue, a treadmill of production related crime that occurs through the generation of ecological disorganization stemming from the expansion of capitalism (Lynch et al., 2013; Stretesky et al., 2013). Related arguments have been explored widely in environmental sociology, and include important theoretical arguments and empirical research related to inter alia: the absolute law of environmental degradation under capitalism (Foster, 1992) and the ecological contradictions of capitalism (O’Connor, 1988); metabolic rift (Clausen & Clark, 2005; Foster, 1999); and ecologically unequal exchange (Givens et al., 2019; Jorgenson, 2006).
Of interest is also the impact of climate change on nonhuman animals’ health, diversity and extinction—a concern that has also been explored from the perspective of ecological unequal exchange theory and World-Systems theory (McKinney et al., 2009, 2010; Shandra et al., 2009). Several studies in the scientific literature also address these concerns. For example, using data covering 20% of the globe, Thomas et al. (2004) estimated species extinction rates between 15% and 37% by 2050 under “mid-range” climate change predictions (see also Araújo et al., 2005; Keith et al., 2008). Similar results have been found for plant species using data from Europe (Thuiller et al., 2005). In addition to extinction, climate change generates species diversity problems for species with limited mobility (on lizards see, e.g., Sinervo et al., 2010; on amphibians and reptiles, see, e.g., Araújo et al., 2010; Hof et al., 2011; on freshwater fish, see, e.g., see Xenopoulos et al., 2005; on coral reefs, see, e.g., see Descombes et al., 2015).
As a criticism of our study, some might suggest that the present analysis is insufficient because it did not include multivariate models, and that some suppressor effect might be discovered which would “recover” the effect of temperature on crime. In our view, such a result would make little sense given that the zero-order relationship between temperature and crime does not appear to influence crime. To be sure, it is possible that temperature changes may, as others have found (Mares, 2013a, 2013b), interact with some other social or economic phenomena to produce some effect on crime. If, however, as our data indicate, there is a lack of a zero-order relationship between two variables, it would still be possible to create a significant temperature interaction term that appears to affect crime by selecting variables that are more highly correlated with crime as part of the interaction term. In other words, it would be possible to create a significant temperature-crime relationship that was a statistical artifact by multiplying the no-effect for the temperature variable by a large effect for another variable that better explains the distribution and trend in crime. Such an approach, in our view, manipulates the observed temperature-crime association through the relationship between crime and another variable, and, in our view, should be avoided.
Further empirical studies similar to the one presented here are necessary because our study may contain limitations that affect the results. For example, as noted earlier, the city level crime data employed here were drawn from multiple sources, and some of the data were inconsistent across those sources. While we made efforts to address those inconsistencies, it is certainly possible that if the crime data contained persistent errors, these could bias the results. It is unlikely, but still plausible, that even at the city level, temperature trends derived from different measurement stations within a city may be moving in opposite directions. It may be necessary to replicate the current study using data from different temperature measurement stations as individual data series, or by taking the means across temperature stations to assess whether doing so changes the results. Moreover, because our study examined the largest US cities, our results may not extend to cities in other locations. Nine of the world’s most populated cities exist in locations outside the US, and both the size of those cities and their locations may affect the results. In addition, average temperatures vary across cities. Some cities have much higher or lower average temperatures than the cities in our sample. It is possible that the range of temperatures experienced within cities in any given location could affect the results.
One could argue that it would be useful to examine temperature changes associated with climate changes in different cities in different hemispheres. The Northern hemisphere contains more land mass and less ocean area relative to the Southern hemisphere, and land mass and ocean mass affect temperature changes associated with climate change (Friedman et al., 2013). Temperature can also be affected by the existence of forested areas, tropical rainforests, and deforestation (Werth & Avissar, 2005). These observations suggest that it might be necessary to compare crime and temperature trends in locations differentially impacted by climate change to observe whether there is consistency in these results. For instance, mean temperature changes in some Asian nations have been below the temperature anomalies found in north eastern Europe and western Russia. Studies also suggest that the effect of temperature on crime is attenuated as the average temperature reaches 80°, and that the association declines thereafter (Gamble & Hess, 2012).
Establishing or challenging whether our results hold in these various conditions requires additional empirical research. Exploring the relationship between climate change, temperature and crime has recently become of greater interest to green criminologists. At the same time, green criminologists have a tendency to neglect quantitative research (Lynch et al., 2017). As a result, one could argue that the kinds of quantitative studies necessary to understand more fully the relationship, if any, between climate change, temperature and crime will either: (1) be neglected if left to green criminologists; or (2) undertaken by traditional criminologists. The latter outcome may continue to reflect misinterpretations of the methods most useful for assessing the CC-T-C hypothesis.
In closing, our research suggests that the CC-T-C hypothesis is questionable based on an analysis of the temperature-crime relationship across 15 of the largest cities in the US from 2002 to 2015. This does not mean, however, that there is no seasonal or cyclical relationship between temperature and crime, but specifically that this effect does not appear to generalize to larger trends between temperature and crime across years, at least, for large cities in the US in recent years. To be sure, this relationship may change in the future as the climate warms even further, and researchers are free to hypothesize what that future may bring in terms of its effect on crime. The hypothesized relationships, however, also require the use of quantitative data so that they can be assessed. But, as we also suggested, criminologists interested in climate change would be wise to address how it connects to economic and political power structures and climate change crimes of the powerful, climate change’s effects on collective mobilization and violence, and the economic, environmental, public health and social forms of injustice impacted by climate change.
Footnotes
Declaration of Conflicting Interests
The author(s) declared no potential conflicts of interest with respect to the research, authorship, and/or publication of this article.
Funding
The author(s) received no financial support for the research, authorship, and/or publication of this article.