
Abstract
Introduction
Dementia causes the progressive loss of cognitive capacities and thus impairs social and daily living skills. Dementia, to varying degrees, influences driver performance and safety. Eventually drivers affected by dementia must stop driving so they do not harm themselves or others. However, having to stop driving can result in loss of mobility and social connections. Therefore, assessing drivers with dementia is important. Driving assessment is susceptible to possible biases, including unreliable driving performance measures or driving routes that are inconsistent in the levels of difficulty of the driving tasks and manoeuvres. The aim of the study was to determine what measures of driving performance could optimally be applied to occupational therapy on-road driving assessments.
Method
All drivers with dementia underwent a 60 minute, set route on-road driving assessment that consisted of 110 pre-programmed observation points.
Results
The study identified 80 sufficiently challenging driving tasks and described the relationship of driving error to that task, for example, critical errors at unguided intersections.
Conclusion
The results of the task-demand by error type analysis identified a list of task items that can be applied to assessment route design to increase consistency of on-road assessment for people with dementia.
Introduction
Driving supports mobility, which in turn enhances community participation, wellbeing, and quality of life (Metz, 2000). Driving performance requires attention, cognitive executive functions, and operational control demonstrated in response to a dynamic environment (Classen et al., 2008; Dubinsky et al., 2000). Dementia causes progressive cognitive decline, loss of functional skills including driving and social capacity (World Health Organization, 1992). Driving performance is impaired when the task demand of the driving environment exceeds the capacity of the driver (Adler et al., 2005; Lloyd et al., 2001).
At some point in the progression of dementia, the person must cease driving for their own and the public's safety (Dubinsky et al., 2000). Each person's experience of dementia differs and some will decline in their driving capacity more rapidly than others, so there is, as yet, no fixed point for cessation. Practice parameters suggest people with mild dementia may be at risk (for example, Iverson et al., 2010) but application of guidelines in practice is inconsistent, relying on detection and assessment of clinical indicators, such as impairment of visuospatial perception, insight, judgment, attention, reaction time, or memory, likely impact on driving ability (Austroads, 2012). The recommendation or decision to cease driving is a significant milestone in the lived experience of dementia. Due to the potential associated negative effects of cessation of reduced community mobility, family burden, challenges to individual's identity and self-esteem, possible depression, and social isolation (Martin et al., 2009), the decision to cease driving is not made lightly or with insufficient information.
One method to determine if a person with dementia is safe to drive is an on-road assessment of performance capacity (Shechtman et al., 2010). On-road assessments are conducted in real world environments, designed to capture the most salient aspects of day-to-day driving demand. On-road assessment routes have been criticised for being too easy or too hard and for inconsistency in task inclusion and route design. No single, consistently applicable or widely agreed upon driving assessment exists (Shechtman et al., 2010).
This study aimed to identify a salient range of on-road tasks and manoeuvres that sufficiently challenge the performance capacity of drivers with dementia in order to identify safe or unsafe drivers.
Literature review
There is mixed evidence that drivers with early dementia, regardless of age, have an increased crash rate (Martin et al., 2009) compared with age-matched controls (Adler et al., 2005; Carr et al., 2000). Some studies exploring the risks for drivers with dementia verify a higher rate of accident exposure than unaffected populations, with risk appearing to increase with dementia severity (Dubinsky et al., 2000; Iverson et al., 2010). Dementia is positively associated with ageing and although not all older drivers have dementia, older drivers are more likely to be involved in at-fault, multiple vehicle crashes in daylight hours and in good weather, and are over-represented in low speed crashes at intersections or right-of-way situations involving unseen objects (Holland, 2001). Typical crashes tend to involve improper turns, merging, changing lanes, or slowing adequately at railway crossings (Holland, 2001). The contributing factors to crashes at complex right turns at traffic lights or multiple lane roadways are observation, attention, and perception errors (Hakamies-Blomqvist, 1998); slowed motor performance and functional decline (Lloyd et al., 2001); all factors implicated in the cognitive decline associated with dementia.
Performance in complex environments requires more cognitive resources than usual (Rinalducci et al., 1993), therefore failure to attend fully, or to comprehend the cues in the environment, can lead to driver mistakes. Due to impaired visual perception or memory, many drivers with early dementia demonstrate impaired traffic sign recognition including signs as vital as “Stop” or “School Zone” (Brashear et al., 1998). There may be multiple cues to attend to, further complicated by road “clutter” such as advertising (Holland, 2001), demanding high levels of perceptual/cognitive skills (Di Stefano and Macdonald, 2012). Impairments of visuospatial and visuomotor abilities early in dementia are linked to observation of severe errors during testing (Dawson et al., 2009; Wadley et al., 2009).
Routes designed to test drivers with dementia require the appropriate construct and content validity to represent the behaviors of the driver most relevant and the key components of the activity (Di Stefano and Macdonald, 2012). On-road driving assessments of people with dementia and of older drivers vary. A comparison of five early on-road studies of dementia and driving concluded that routes did not include demanding or non-routine driving situations, and driving items and manoeuvres varied widely (Adler et al., 2005). Early protocols included six or seven categories of route task (for example, turns, merges, response to signs and signals, change lanes, drive straight, perform complex manoeuvres) (for example, Hunt et al., 1993), with individual task items repeated up to 68 times (for example, Odenheimer et al., 1994). Authors of latter studies included complex tasks such as unguided intersections, pedestrian and shared shopping zones (Baldock et al., 2006; Justiss et al., 2006), and parallel parks (Dawson et al., 2009). As a result, the time spent driving as part of the assessment also varies, from 90 minutes (Wild and Cottrell, 2003) to 20 minutes (Kay et al., 2008). This level of variability and lack of consensus in driving assessment make it difficult to identify a best practice protocol.
It is believed that reliability of the assessment is enhanced if exposure to each general driving item or manoeuvre is repeated at least three times in a variety of traffic conditions (Fox et al., 1997; Justiss et al., 2006). However, there is a lack of consensus in guidelines regarding which specific driving tasks should be repeated with a resultant need for more research to trial test route design criteria that specify minimum numbers of particular route features (Di Stefano and Macdonald, 2012). Various authors advocate the principle of grading complexity from lower demand tasks and manoeuvres to higher (Baldock et al., 2006; Justiss et al., 2006), particularly to mitigate the potential risk to the assessors from being on the road with drivers with cognitive or behavioral limitations (Di Stefano and Macdonald, 2012), but grading of complexity of route design is not universally evident.
The number and type of items and manoeuvres included in the assessment will have direct impact on the scope of potential error performance. For example, if there are few intersections, there will be fewer right-of-way errors when compared with a study with a higher proportion of complex turns in the assessment protocol. Similarly, if there are few lane maintenance items or lane changes included in the assessment, there will be fewer lane deviations or merge errors recorded, and so on and vice versa (Di Stefano and Macdonald, 2006). If an on-road assessment is too difficult, more errors may result, thus suggesting the performance of a risk group is worse than if the route had a better balance of challenges. Even drivers with intact cognition may perform poorly on a driving test that includes very difficult manoeuvres or has items that the average driver rarely performs, for example, reverse parallel parking.
Assessment tasks are categorised as general items, such as intersections, stop signs, left or right turns, railway crossings, and speed zones, or as manoeuvres, such as U-turns, parks, or lane changes. In Australia, when designing a test route, driver assessors can refer to professional guidelines (Di Stefano and Macdonald, 2012) that were produced in collaboration between occupational therapists and the Victorian licensing authority (Schneider, 1998). The guidelines categorise route design criteria as either compulsory inclusions (for example, drive on a multi-lane road or negotiate an intersection with a roundabout) or desirable inclusions (for example, merge at slip lane or perform a U-turn) (Di Stefano and Macdonald, 2012; Schneider, 1998). Di Stefano and Macdonald (2012) have found the self-reported compliance of occupational therapy driver assessors with compulsory items to be very high in both urban and rural areas of Victoria; however the inclusion of desirable features is more variable, particularly in rural areas.
Poor route planning by the driving assessor may decrease the construct validity and reliability of the assessment (Di Stefano and Macdonald, 2012). If the on-road assessment is either too easy or too hard, then the driving assessment outcome may not appropriately reflect driving capacity. The best design of driving routes needs to include the appropriate balance of driving demand as presented by the environment and tasks included in the assessment.
Method
Participants
A total of 117 people with dementia were recruited via the Memory Disorders Study Unit (MDSU) of the Repatriation General Hospital in Adelaide, South Australia. Participants met the Australian visual guidelines for fitness to drive, had no significant depression or physical co-morbidities, held a current unrestricted driver's license, had at least 10 years driving experience, and lived in a metropolitan area of Adelaide. Driver's licence status was confirmed with the Department of Motor Vehicles prior to the on-road assessment.
Instrument
Each participant was assessed by a geriatrician. The tests included the mini mental state exam (MMSE) (Folstein et al., 1975) and clinical dementia rating scale (CDR) (Burke et al., 1988) and type of dementia was diagnosed. Participants' driving performance was measured using a set route on-road assessment protocol developed at the School of Occupational Therapy, University of South Australia (UniSA) (Lister, 1998). The UniSA on-road assessment route is located in inner southern suburbs of the city of Adelaide, with 110 programmed performance observations, is 24 km, starts with a familiarisation phase, progresses to low demand tasks, and increases the driving tasks' complexity over 60 minutes. In Australia, vehicles travel on the left side of the road.
The on-road assessment protocol driving tasks are: set up vehicle; 12 manoeuvres including two parking exercises; 32 left or right turns without signs, with two at roundabouts and four complex unguided right turns; 31 sign or road contour recognition tasks, including three left turn at Give Way or Stop signs, and one right turn at Stop sign (across traffic); 12 traffic signal turn and lane planning response tasks; 14 rear mirror check points; 6 control speed when travel straight tasks; 23 observation and positioning tasks while traveling near bike lanes. The use of the indicator signal was required for each turn, lane change, exit park, or other manoeuvre, as was the need to check the rear mirror, hence these two tasks were the most commonly demonstrated. The observation protocol addresses three constructs: frequency of error (that is, counts of observed behaviors or lapses), severity of error via observations and driving instructor intervention, and road rule lapses.
Procedure
Ethics approval was granted by the Repatriation General Hospital Human Research Ethics Committee (HREC) and the University of South Australia Human Research Ethics Committee. Geriatrician assessment preceded referral into the study, whereby informed consent and capacity was determined. In South Australia, the Motor Vehicles Act (1959), Section 148 mandates health professionals act on potential driving risk for people with medical conditions. The outcome of the assessment was verbally reported to the participant and family after the assessment and followed with a written summary. Each participant, regardless of a pass or fail outcome, was referred to a counselling support service specific to dementia.
The occupational therapist and driving instructor observers were blind to the severity and type of dementia of each driver. Each on-road assessment occurred on a Thursday morning at 10:00 am conducted in driving-instructor owned, medium-sized sedans, with power steering, electronically opening windows, dual control brakes, and an engine cut-off switch. The transmission of the car was matched to the type of car usually driven by the participant, either automatic or manual. There were two observers in the assessment vehicle, a driving instructor in the front passenger seat provided standardised geographical directions and intervened when necessary for safety, and an occupational therapist who scored the assessment, seated in the left rear passenger seat. Observations of performance were scored systematically with three phases observed for each programmed task. On approach to the task, the therapist noted speed, use of the indicator, scanning and use of the mirror. On exit from each specific task, the therapist noted the gap between the assessment car and other cars, lateral positioning, the quality of the turn, response to traffic signals on move off from a green light/signal, speed control at the relevant road sections, and performance at speed humps, at dips, and at stop signs. The therapist recorded field notes particularly concerning driving instructor interventions and rated the performance of each task as safe or unsafe/correct or incorrect/observed yes or no. All rating criteria were determined by the on-road assessment protocol (Lister, 1998). The driving instructor commented on road craft and rules observance, and recommended outcomes from experience of testing unimpaired drivers. The consensus agreement of the occupational therapist and driving instructor produced a global rating scale (GRS) of performance labeled pass, marginal, or fail, consistent with best practice method (Kay et al., 2008). The GRS was determined via comparison of number and severity of errors noted in each error domain (for example, habit based versus critical), observations of driver response to error (for example, self-correction or lack of awareness). Pass drivers were those with lower frequency and few severity errors and with observed self-correction. Marginal drivers were those with inconsistent pattern of error. No driver with three or more critical errors passed the assessment. Occasionally a difference of opinion between the driving instructor and the occupational therapist occurred when discussing the implications of rules-based or system of car-control errors (for example, mirror checks). In these instances the occupational therapist held primary responsibility for decision making and, if the remainder of the driver's performance was low or absent in severity errors, would recommend a pass or marginal outcome. In instances where severe errors required driving instructor intervention, consensus was equal with no discussion necessary.
The 14 operational definitions of errors measured in the driving assessments were drawn from the key literature, including Dobbs et al. (1998), Hunt et al. (1997), and Lloyd et al. (2001). The 14 error definitions were: poor vehicle control, critical indicated by driving instructor intervention including extremely unsafe positioning, self-corrected risky manoeuvres not requiring intervention, over cautiousness (that is, too slow or waiting too long), speed (that is, too high for speed zone), signal lapse, mirror lapse, no blind spot (shoulder) check, absent scanning, wide turn positioning, rules-based minor positioning, stop positioning at intersections, and rolled at a Stop sign. The complexity of the road environment was defined as low, moderate, and high demand.
Data analysis
On-road assessment data was coded as tallies of the number of each error per driver per on-road assessment task. The pass group and fail group data was combined. The critical driving instructor interventions were coded by three types: physical intervention to the dual brake or the steering wheel, verbal guidance to decision-making, or verbal caution/warning.
The sample was divided into pass and fail groups and total error tally and difference in error types were tested using a t-test or Mann–Whitney U test depending on normality of distribution. The difference between the pass and fail driver groups' error performance at each of the 110 tasks or manoeuvres in the on-road protocol was assessed by 2 × 2 contingency tables and Fisher's exact tests (two tailed, 95% confidence interval (CI)). Yates continuity corrections were applied to manage cells containing a zero. Odds ratios for pass and fail groups and error type by location were determined. Combining the pass/fail group errors led to higher numbers of each error type at each task enabling statistical comparison, however, each individual pass driver did not commit errors in frequency or severity requisite of a fail outcome.
Results
Participants
The group consisted of 87 males and 30 females, mean age 75.71 (SD = 6.7, range 48–88 years). Fifty participants passed the assessment (43%) and 39 of the drivers in the pass group were male (78%). Sixty-seven people failed (57%) and 48 of the drivers in the fail group were male (72%). Forty-four of the 67 fail group drivers (66%) completed the assessment, while 23 (34%) fail drivers had their drives terminated within 15 minutes in the low density section of the drive due to safety risks. The majority of participants were diagnosed with Alzheimer-type dementia (AD) (n = 72). The diagnosis of the other 45 drivers was mixed AD and vascular dementia (n = 12), fronto-temporal dementia or primary progressive aphasia (n = 12), Lewy body dementia (n = 5), unspecified or mild cognitive impairment (n = 5), alcohol-related dementia (n = 2), vascular dementia (n = 2), and unknown (n = 7). The range of severity of dementia indicated by the MMSE was 10–30 (mean 23) and included four drivers with negligible dementia (3.4%, MMSE 30, CDR 0); 26 with very early (very mild) dementia (22.2%, MMSE 26–29, CDR 0.5); 71 with early (mild) dementia (60.6%, MMSE 20–25, CDR 1); 15 with mid (moderate) dementia (12.8%, MMSE 11–19, CDR 2); and one driver with late stage (severe) dementia (1%, MMSE score of 10, CDR 3). The mean MMSE of the pass group was 25.06 (SD 2.622) compared with a mean of 21.52 (SD 3.702) for the fail group (p < .001).
Driving errors
There were 4968 individual driving errors demonstrated by the 117 participants in the on-road assessments. The error tally ranged from one to 99 errors per individual driver with a mean of 42 (SD 21.296, 95% CI = 38.56–46.36). Drivers in the pass group recorded fewer errors than the fail group (range 1–53 versus 14–99 errors, Z = −6.83, p < .001). The errors were distributed between numbers of high frequency but low severity errors and low frequency but high severity errors, in the manner defined by Uc et al. (2004). Of the total errors 41% were habit-based, that is, lack of mirror checks (27%) and failing to indicate (14%). The high frequency of these two errors occurred in relationship to the high number of related tasks in the assessment. That is, as turns, lane changes, and manoeuvres appeared more often in the assessment, the more often the driver needed to check the rear environment and apply the indicator.
Hazardous errors (8%), such as failing to respond to a traffic signal, categorised as a cognitive impairment ‘criterion’ lapse (Dobbs et al., 1998), plus extreme positioning errors (3%), that is entering a new road on the incorrect side or crossing the midline into oncoming traffic and needing driving instructor intervention, represent the critical error category (11%). Over cautiousness (7%), wide turn positioning (6%), speed errors (5%), and risky manoeuvres (that is, potentially unsafe but with no driving instructor intervention) (4%) were also categorised as cognitive impairment ‘criterion’ lapses. In this study, if over cautiousness impeded traffic flow significantly enough for the driving instructor to verbally caution the driver, it was counted as a critical error. Over cautiousness errors in this data set, therefore, should be interpreted as those that did not directly impede other drivers.
Driving error in relation to task demand
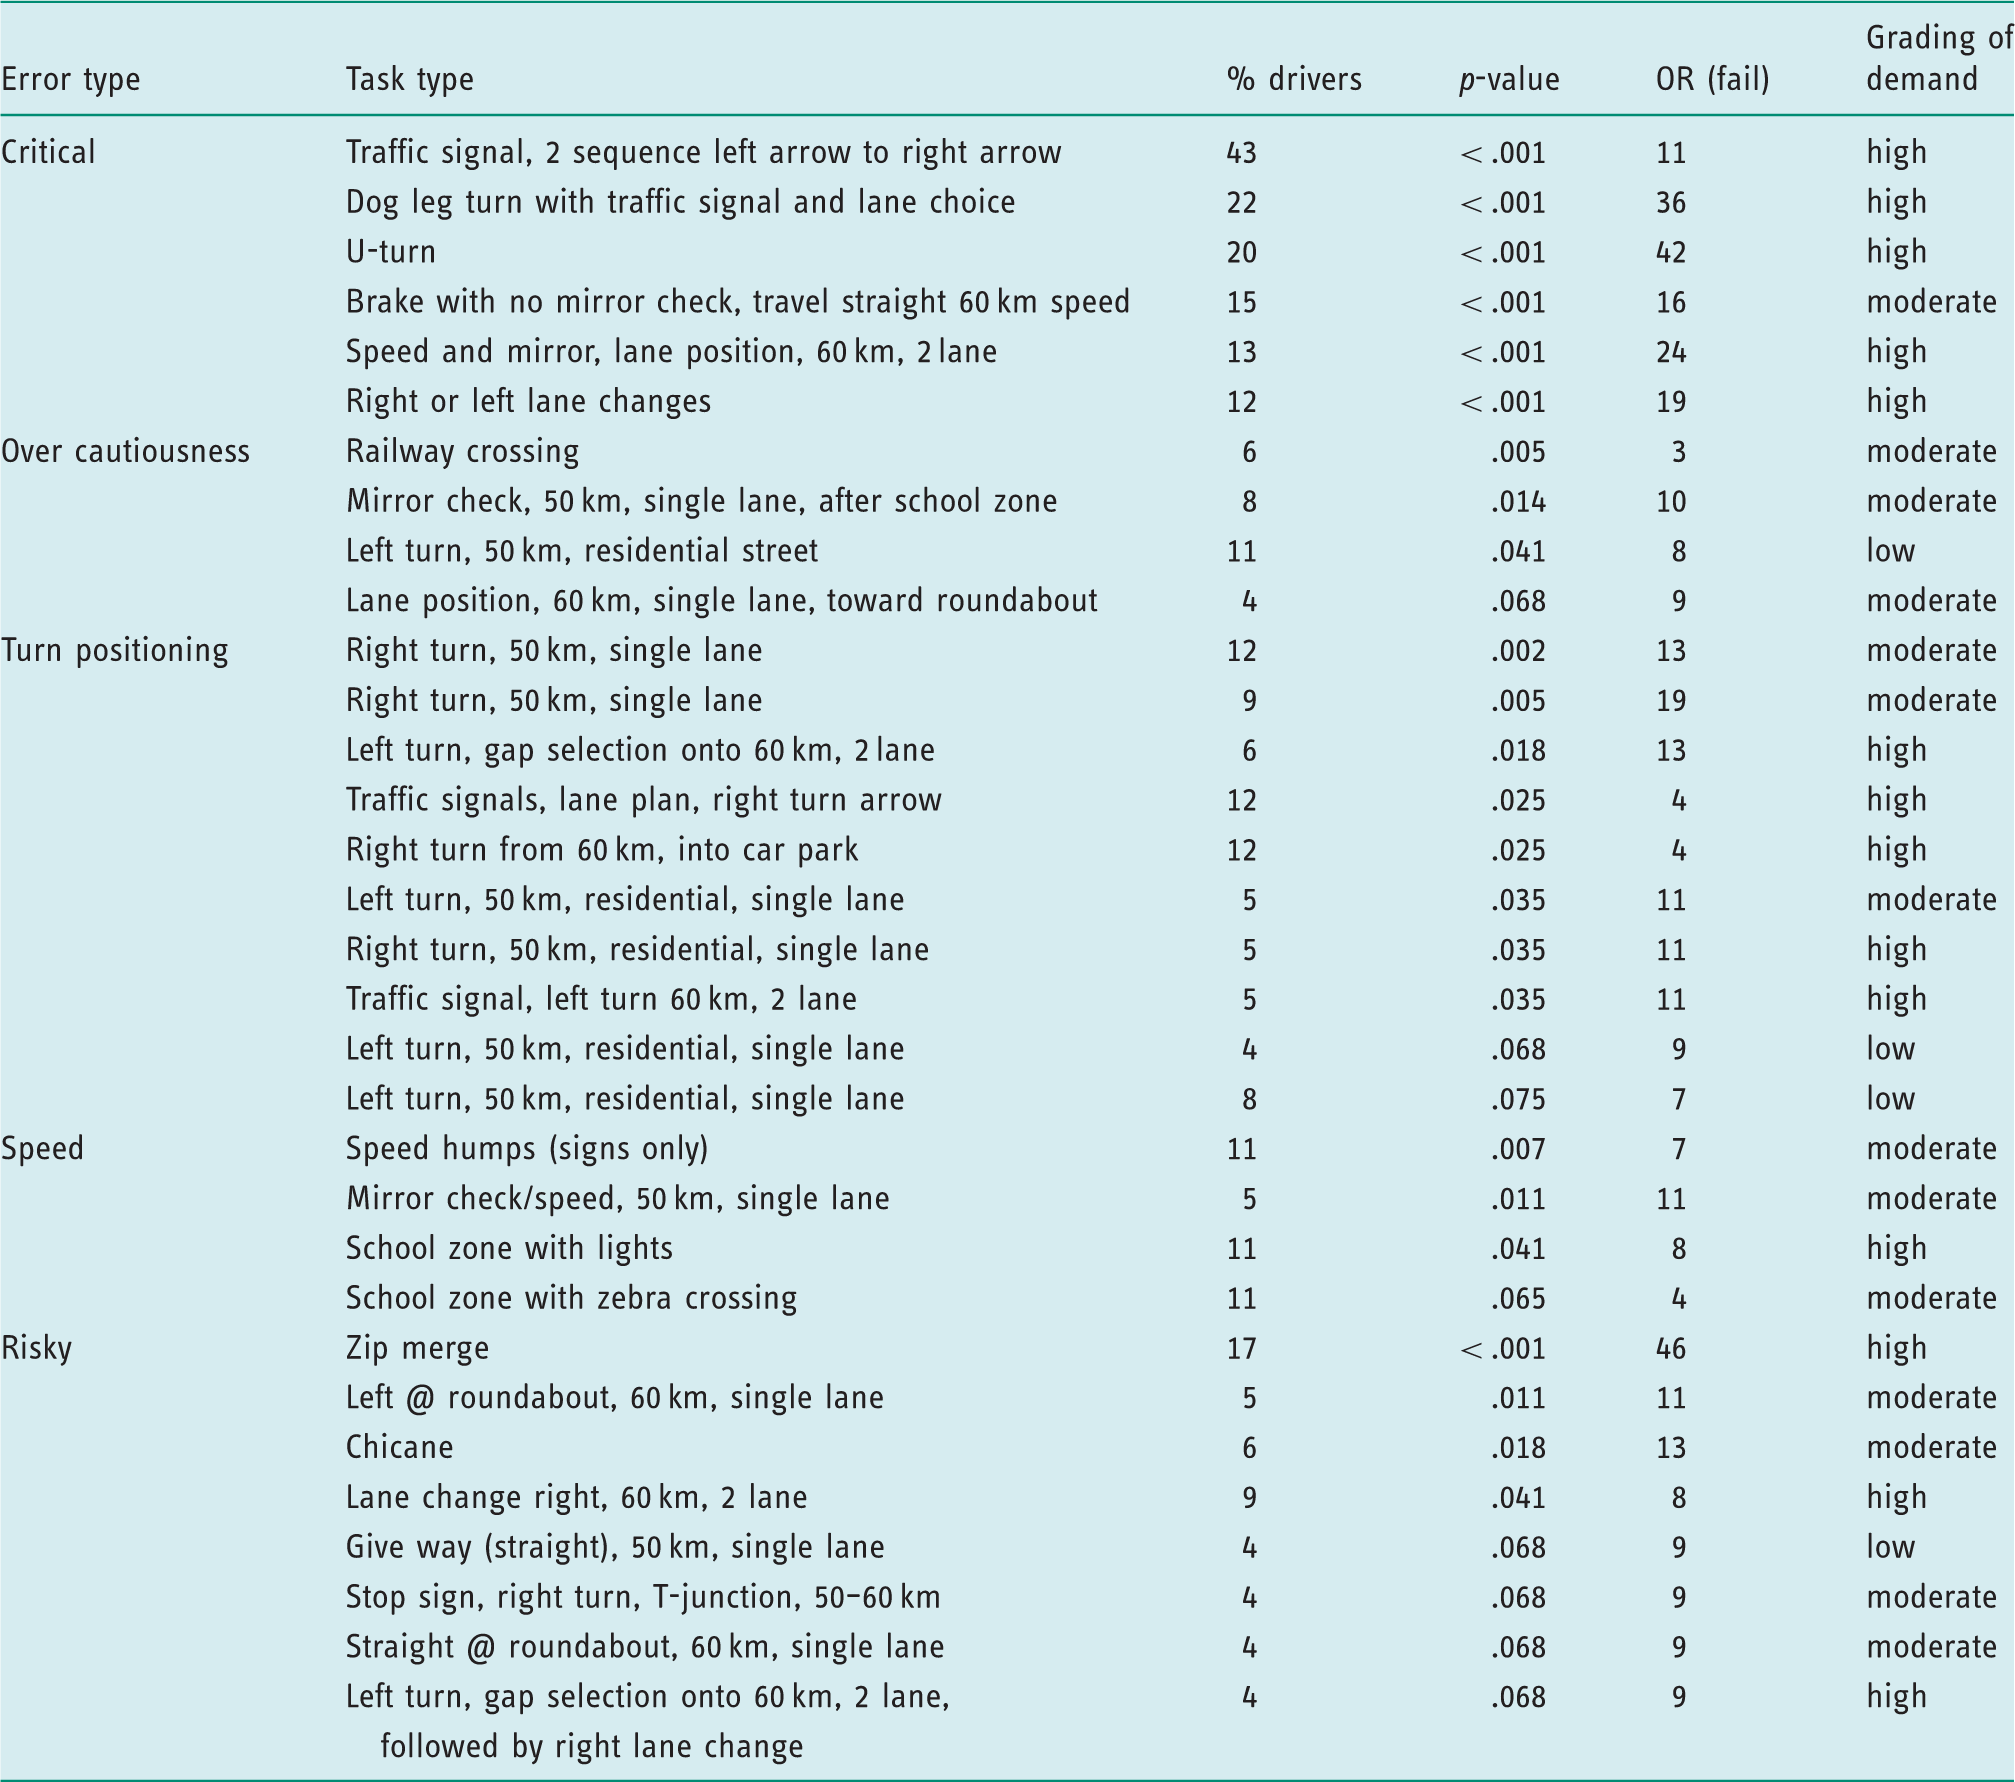
Driving tasks or manoeuvres that elicited a difference in performance between pass and fail drivers for critical, over cautious, turn position, speed, and risky driving errors.
Over cautiousness errors occurred at 70 tasks. A total of 15% of drivers were overly cautious next to the first bike lane (fail to pass ratio 11–6, 15%, p = .598). The highest distribution of error (fail n = 24, pass n = 11, 37% of drivers, p = .104) occurred on a long residential street that included a left meander followed by a right meander, so that there appeared to be an upcoming turn, whereas in fact there was a variation rather than a change in direction. Drivers were observed to slow to 30 kilometres per hour or less on this stretch of road, where the posted speed limit was 50 kilometres per hour.
Turn positioning errors, such as wide or incorrect entry to new road and unrelated to unsafe speed of approach, occurred at 40 tasks with 10 locations differing between pass and fail drivers, shown in Table 1. The odds of the fail group performing turn positioning errors at these locations ranged from between 19 and 4 times more likely than the pass group. Speed errors occurred at 65 tasks and included driving above the speed limit and high speed of approach to turns. The significant differences, shown in Table 1, all appear in speed control and do not include overly cautious driving.
Risky errors (for example, rushing a gap in traffic before self-correcting) occurred at 58 task locations, with nine task locations differing between pass and fail groups (Table 1). The highest percentage of drivers made a risky or aggressive error at the Zip merge (17%), which requires drivers to look, give way, and then proceed, in order to form one lane from two by allowing a vehicle from the left then the right merging lane to enter the new road in turn (like the teeth of a zip).
The comparative analysis shows that 80 on-road tasks or manoeuvres present sufficient challenge to drivers in an on-road assessment, shown in Table 2. A total of 79% of the 80 assessment items match the compulsory criteria determined by Australian occupational therapy driver assessment competency guidelines, with the remaining 21% matching the desirable criteria (Schneider, 1998). Each task or manoeuvre is associated with more than one error type, suggesting the match between number of environmental task inclusions in on-road assessment route design and the number of observed performance variables is complex. The analysis of the error types by the on-road assessment task locations produced three main outcomes of relevance to assessment route design. These were as follows.
Locations where task-demand and error performance discriminate between drivers who pass and drivers who fail an occupational therapy driver assessment, due to a statistical difference in performance (Table 2). Locations where task-demand and error performance do not statistically discriminate between drivers who pass and drivers who fail an occupational therapy driver assessment because both groups tend to commit those errors in lower frequency (Table 2). Twenty-three locations where task-demand and error performance do not discriminate between drivers who pass and drivers who fail an occupational therapy assessment, because neither group commits errors (less than 4/117) at that location. These tasks were all related to traveling in a straight path and responding to environmental cues with clear markings, such as pedestrian crossing, no standing zone, and speed humps with high contrast paint. There were only two low demand turns at which very low error performance was observed. Error-promoting driving tasks and manoeuvres in sequence of assessment drive. Compliance with Australian Competency Standards for Occupational Therapy Driver Assessment and Rehabilitation compulsory or desirable route inclusions (Schneider, 1998). This is grouped data where p value differed significantly between fail and pass drivers at each task. This is grouped data, drivers in the pass group demonstrated errors at these tasks in lower numbers than the fail drivers but the difference was not statistically significant; no pass individual driver demonstrated errors in frequency or severity requisite of a fail outcome.

Discussion and implications
The error type by task analysis conducted in this study identified a specific item bank of manoeuvres and tasks of suitable challenge, that when applied may ensure the just right balance of demand for dementia specific on-road assessment. Analysis of driver performance in this study shows how particular driver error occurs in direct response to the assessment route, as found by other researchers (for example, Di Stefano and Macdonald, 2006). Thus, challenging tasks exceed individual capacity thresholds and provoke critical and other types of criterion error, often in combination.
Easier tasks were manageable for most drivers. This result does deviate however from studies that suggest drivers with dementia have impaired sign recognition, including school zones (Brashear et al., 1998). Test inclusion of simple tasks enables the driver to experience some success during the on-road assessment, thus providing the assessors with some task performance from which to provide positive feedback, particularly important if other performance elements are poor and feedback is consequently negative. However, a test that included only achievable tasks would be too easy, and thus not able to state that the assessment challenges dementia specific decline in driving.
Error types, that when grouped in this study and showed no statistical difference between the pass and fail drivers, may be seen as red flags for future decline of individual drivers. For example, if a driver who passes the assessment overall, due to low severity and lower frequency of error, does perform one risky but not critical error at an intersection, it would be wise to repeat the intersection task within that assessment and again at subsequent reviews.
This study found, by comparing performance on multiple occasions of each type of task, in differing task-demand levels (that is, low, moderate, and high), that repetition of task for comparative purposes is core to route design principles, in agreement with Justiss et al. (2006). A recommended limit of 50 pre-programmed observations per assessment may be appropriate due to the complexity of the observation and recording activity (Hjalmdahl and Varhelyi, 2004) although that limit would reduce the number of repetitions per task. Due to the nature of the on-road environment, turns are likely to be high in number. Inclusion of other salient manoeuvres is required. The number of task repetitions per assessment (for example, two or three repetitions per task type) compared with the consistency of outcomes derived from the assessment route designed in this manner warrant further research.
Analysis shows that more than one error type acted in combination at some driving tasks. For example, the results suggest the Zip merge is likely to elicit scan, mirror, and indicator errors on approach followed by a critical merge error, or over cautiousness or riskiness, depending on the driver's capacity and response to the challenge. However, the safe driver is not likely to find the task-demand of the Zip merge overly challenging. The Zip merge is a good example of a “just right” item that captures a wide range of possible error types, more likely to be challenging for those whose general cognitive capacity is diminished but not too hard for the less cognitively impaired. The Zip merge is therefore an “all-rounder” task that tests multiple possible error outcomes or safe driving performance.
Conversely, by selecting from a range of tasks that demonstrate the highest relationship with a particular error, testing of specific error profiles is also possible. For example, most drivers did not demonstrate error at the speed slowing chicane. A chicane is a section of road where two lanes are reduced to one curved section of approximately 50 m in length. Vehicles traveling toward each other are forced to slow and then give way or proceed in a manner determined by the drivers in each instance. Over cautious drivers were not disadvantaged, as the chicane should prompt slow and cautious driving. However, the drivers whose combined error pattern identified them as risky found it very difficult to slow sufficiently at the chicane, and so in the context of riskiness the chicane is distinguishing of speed behaviors. Therefore, the inclusion of a chicane or similar slowing device should not disadvantage safe drivers, but will potentially identify risky drivers, and thus be pertinent to route design specific to drivers who may have clinical red flags for riskiness, for example, drivers with fronto-temporal dementia.
The task locations that prompted the highest level of error expression agree with previous older driver research. Crash research indicates that poor intersection management, poor yielding behaviors and lane changes, improper turns, difficulty merging, slowing inadequately at railway crossings, and failure to heed traffic signals or Stop signs are most commonly difficult for older drivers (Holland, 2001).
The most challenging driving tasks in this study proved to be lane changes on multiple lane roadways, merges (especially Zip merge), complex manoeuvres (particularly a self-selected position to execute a U-turn), railway crossings, and traveling straight while maintaining speed and scanning in 60 kilometre per hour traffic flow. Consequently, appropriately challenging task-demands for drivers with dementia can be drawn from the task items that discriminated between the pass and fail drivers in this study.
Three peaks of high critical error incidence occurred in response to the most challenging sequences of tasks. Typically assessment routes are designed item by item, for example a left turn followed by a lane change, with items checked against the guidelines for compulsory or desirable inclusion (Schneider, 1998). However, in light of this study's results, it would appear more attention is required to the sequential nature of each task item and the combined loading of complexity in regard to high levels of critical error outcome.
Conclusion
The on-road assessment used by occupational therapists when assessing drivers with dementia may be designed to include 80 or less pre-programmed tasks that include multiple repeats and sequences of tasks. Each task or sequence can be used to observe multiple performance variables (driving errors), thus enhancing construct and content validity. Any service that is designed to assess the driving safety of people with dementia, and includes an on-road assessment as part of that process, could use the error-task list to ensure their on-road routes are sufficiently challenging. The applied use of the error-task list to evaluate the efficacy and properties of on-road assessment routes designed by occupational therapists and driving instructors in practice settings warrants further research in the future.
Limitations
Due to the sample size, number of errors, and task locations, many of the confidence intervals in the error by location analysis were wide, due to a small number of errors at each task, particularly from the pass drivers. Therefore, the errors by task location data are less well powered than the analysis of total error data. The set route and other standardised processes did limit the assessment of self-paced or self-guided driving, which Lovell and Russell (2005) suggest should be included in on-road assessments for drivers with dementia. Future research to test the efficacy of using the error-task list in flexible, local area route planning would enable the inclusion of self-navigated driving in the method of the study.
Key findings
Each on-road assessment task inclusion has the potential to elicit one or more error types and the discriminatory task items are congruent with previous research suggesting high construct validity.
What the study has added
This study describes a range of suitably challenging items and sequences of driving tasks that can be used to design on-road assessment routes for the assessment of drivers with dementia.
Footnotes
Ethics
Ethics approval was granted by the Repatriation General Hospital Human Research Ethics Committee (HREC) and the University of South Australia Human Research Ethics Committee.
Declaration of conflicting interests
None declared.
Funding
The on-road assessment data collection phase of this research was supported by Austroads (Federal Office of Road Safety) grant T99/0574.