
Abstract
The Beery Visual-Motor Integration (VMI) battery of tests are some of the most commonly used assessments in pediatric occupational therapy, often used to measure change over time. However, the minimal clinically important difference (MCID) has not been estimated for interpreting change scores. We estimated the MCID for the Beery VMI battery of tests in children with autism spectrum disorder (ASD). Four occupational therapists collected data in a public elementary school on 64 children with ASD. The Beery VMI battery was administered to children with ASD twice, approximately 11 months apart. To estimate MCID values, Beery VMI battery scores were anchored to 15-point Likert questions measuring occupational therapists’ ratings of functional change over three domains: fine motor skills, handwriting, and activities of daily living (ADLs). Using this anchor-based method, we were unable to estimate MCID values for the Beery VMI battery. Children’s Beery VMI battery scores did not change significantly over the course of the school year, and there was only one weak correlation between VMI battery change scores and therapists’ ratings of change. The inability to estimate Beery VMI battery MCID values for children with ASD adds further support for research cautioning the use of the Beery VMI as an outcome measure.
Keywords
Introduction
Over the past 30 years, the Beery-Buktenica Developmental Test of Visual-Motor Integration (Beery VMI; Beery and Beery, 2010) has been one of the most commonly identified assessments in the armamentaria of pediatric occupational therapists (Bagatell et al., 2013; Brown et al., 2005; Burtner et al., 2002; Crowe, 1989; Dunford et al., 2013; Feder et al., 2000; Rodger et al., 2005; Watling et al., 1999). The Beery VMI is a standardized norm-referenced assessment that requires the examinee to initially imitate and then copy a series of progressively more complex forms. The Beery VMI battery consists of two additional supplemental tests: Developmental Test of Visual Perception (VP) and Developmental Test of Motor Coordination (MC). When all three tests are administered together, the examiner can make comparisons between the examinee’s visual and motor abilities and subsequently target one or more of these performance skills during intervention. Notably, using a dichotomous classification of assessments as either top-down or bottom-up, where bottom-up assessments are defined as examining small components of a child’s skills and top-down assessments focus on activities and participation (Brown and Chien, 2010), the Beery VMI is categorized as a bottom-up assessment.
Through early screening, the Beery VMI is used to identify children with difficulties in VMI and to help these children obtain needed services (Beery and Beery, 2010). Within the field of occupational therapy, the Beery VMI is also used as an outcome measure to detect changes in visual-motor skills after a period of intervention (e.g., Bazyk et al., 2009; Dankert et al., 2003; Ohl et al., 2013). While the Beery VMI is often used as an outcome measure, there is a growing body of literature finding no significant change in Beery VMI scores in response to interventions focusing on handwriting (Howe et al., 2013; Hunter and Potvin, 2020; McGarrigle and Nelson, 2006; Pfeiffer et al., 2015) and visual-motor skills (Coutinho et al., 2017; Howe et al., 2013), while statistically significant gains are reported in concurrent outcome measures that employ a top-down approach and focus on activity performance.
While bottom-up and top-down assessments both have merit within the occupational therapy process (Weinstock-Zlotnick and Hinojosa, 2004), the compatibility of bottom-up assessments with occupational therapy philosophy has been questioned in the literature (Hocking, 2001). An over-reliance on bottom-up assessments has been hypothesized to run the risk of focusing intervention around small components of skill, thus failing to address critical occupational issues (Hocking, 2001). Furthermore, a bottom-up approach to assessment operates under the inherent assumption that the acquisition of motor, cognitive, or psychological skills will result in successful performance in activities of daily living (ADLs) (Weinstock-Zlotnick and Hinojosa, 2004). The notion that improvements in performance components will automatically trickle up to improvements in performance is not supported in a growing body of literature (Hocking, 2001; Novak and Honan, 2019).
Beery VMI as an outcome measure
Of the literature using the Beery VMI as an outcome measure for handwriting interventions, McGarrigle and Nelson (2006) provide an early critique of the instrument. After piloting a 6-week occupational therapy program aimed at improving handwriting, scissor use, classroom behavior, and visual-MC skills in a small sample of first grade students (N = 13), the authors observed no significant improvements in Beery VMI scores in either the intervention or control groups, while improvements were noted in non-standardized measures of handwriting legibility. Given these results, the authors hypothesized that the VMI might lack sensitivity in detecting changes in visual-MC over a short period of intervention.
Utilizing a 12-week intervention period, Howe and colleagues (2013) compared two approaches to improve handwriting: intensive handwriting practice and visual-perceptual–motor activities. The participants (n = 34) in the intensive handwriting group improved on the Minnesota Handwriting Assessment (MHA), while their Beery VMI scores remained relatively static. Interestingly, the visual-perceptual–motor activities group (n = 38) also did not demonstrate any significant change in Beery VMI scores post-intervention. Given these results, Howe and colleagues (2013) suggested that the Beery VMI might have limitations in measuring the effectiveness of intervention.
Subsequent studies examining handwriting interventions notably questioned the utility of the Beery VMI in measuring changes post-intervention. In their study of a 40-session handwriting intervention (Size Matters Handwriting Program; SMHP) for kindergarten, first, and second grade students (N = 207), Pfieffer and colleagues (2015) found no significant changes in Beery VMI scores, while improvements were found on the (MHA and Test of Handwriting Skills-Revised (THS-R). Before concluding that the Beery VMI may not be an effective outcome measure for handwriting interventions, the authors judiciously pointed out that the Beery VMI was not validated as a handwriting assessment. Using the same handwriting curriculum (i.e., SMHP), Hunter and Potvin (2020) also found no significant improvements in Beery VMI scores post-intervention, while significant improvements were found on the Evaluation Tool of Children’s Handwriting-Manuscript (ETCH-M). Beery VMI scores were also found to have deteriorated significantly in the control group while their handwriting legibility scores improved. It is unclear whether the Beery VMI decline was related to testing error or represented a true decline in ability.
Beery VMI scores in children with autism spectrum disorder
The prevalence of autism spectrum disorder (ASD) has increased from one in 150 children in 2000 to one in 54 children in 2016 (Centers for Disease Control and Prevention [CDC], 2020). In national surveys conducted in the United States, approximately 37.5%–56.2% of children with ASD receive occupational therapy services (Monz et al., 2019; McDonald et al., 2019; Payackachat et al., 2018; Zuckerman et al., 2017). Little is known about the VMI skills of these children, including how those skills change over time. Furthermore, to the best of our knowledge, no studies have examined the clinical relevance of the Beery VMI with children with ASD, specifically if changes in Beery VMI scores relate to noticeable changes in everyday function.
Of the studies examining VMI in children and adolescents with ASD compared to typically developing (TD) children, the findings are mixed. Green and colleagues (2016) found their ASD participants (aged 3–23 years) performed lower on the Beery VMI compared to TD participants of similar age. After controlling for IQ, no significant difference emerged between the two groups. Similarly, Minshew and colleagues (1997) did not observe Beery VMI deficits in their sample of children with ASD and IQ scores greater than 80. However, more recent studies report the underperformance of children with ASD on the Beery VMI compared to their TD peers (Green et al., 2019; Rosenblum et al., 2019; Zhang et al., 2020), even after controlling for IQ (Zhang et al., 2020). Studies comparing the VP and MC supplemental test scores between ASD and TD peers observed no significant difference in performance on the VP test, while MC scores were significantly lower in children ASD (Rosenblum et al., 2019; Zhang et al., 2020).
Approximating clinical relevance
For any assessment, score differences between two time points may simply be due to measurement error. Thus, to estimate the amount of change associated with actual improvement or decline, clinicians can rely on distribution-based or anchor-based methods for approximating clinical relevance (Ohl and Schelly, 2017).
Distribution-based methods rely on the distributions of the assessments to incorporate a sense of typical variation for a given case. The ideal distribution-based method, if possible, is to determine the SEm, which is an estimate of the reliability of a particular score. SEm is calculated by multiplying the standard deviation of a measure by the square root of 1 minus the test–retest reliability coefficient of the assessment. For any given measurement, then, 2 SEm can be likened to a 95% confidence interval. The Beery VMI manual (Beery and Beery, 2010: 106) reports SEms by age, with a range of 4–6 for the Beery VMI, and six for all ages on the VP and MC tests. Thus, if a child scored 80 on the VP at baseline (2 SEm CI [68, 92]) and then a 94 at post-test (2 SEm CI [82, 106]), the 2 SEm method would suggest that the given change could be due to measurement error. However, authors often use 1 SEm for these intervals (Beery and Beery, 2010; Copay et al., 2007), in which case a change from 80 (1 SEm CI [74, 86]) to 94 (1 SEm CI [88, 100]) would be considered to exceed typical measurement error. Simpler distribution-based methods exist as well, but they all lack a direct connection to clinical relevance.
Anchor-based methods offer a more trustworthy connection to clinical relevance by comparing changes between assessment scores with some form of clinically relevant “anchor,” which would ideally entail an objective and independent measure of improvement. The aim is to determine meaningful cut-off points for measures with unknown parameters. For example, among patients with breakthrough pain, Farrar et al. (2000) anchored subjective pain scales to the point at which patients turned down additional doses of medication. Rarely do we have such an objective anchor, so the standard alternative is to rely on patients’ perceptions of change as the anchor. Jaeschke et al. (1989), for example, asked patients whether they were worse, about the same, or better since they were last seen. If they were better, the authors asked the patients to indicate whether they were Hardly any better at all (+1), A little better (+2), Somewhat better (+3), Moderately better (+4), A good deal better (+5), A great deal better (+6), or A very great deal better (+7). Including those who were worse (−7 to −1) or about the same (0), this 15-point Likert scale (−7 to + 7) can provide an anchor for two measures during the same time period, where the minimal clinically important difference (MCID) is the “smallest difference in score in the domain of interest which patients perceive as beneficial and which would mandate, in the absence of troublesome side effects and excessive cost, a change in the patient’s management” (Jaeschke et al., 1989: 408). Many authors (e.g., Wells et al., 2001) have calculated the MCID improvement as the average change for all patients who answered A little better (+2) or Somewhat better (+3), with scores above 3 indicating substantial change. When an MCID value is developed for an assessment, clinicians can use it as a trustworthy measure of real change.
Purpose
Adding to this literature from a psychometrics standpoint, we aimed to determine the average change score on the Beery VMI that would correspond to a clinically important change in functional skills, known as the MCID, in children with ASD. While increasing scores that surpass the standard error of measurement (SEm) are evidence of improvements on the Beery VMI, it is unknown what these improvements translate to in everyday function. For example, it is unclear what a 10- or 15-point improvement in Beery VMI battery scores relates to in a child’s daily life, as opposed to smaller improvements. To estimate the MCID, we anchored Beery VMI, VP, and MC scores to a series of 15-point Likert scales measuring occupational therapists’ ratings of functional change for each child’s fine motor skills, handwriting, and ADLs. This common approach to estimating MCID (Wells et al., 2001) relies on and values the clinical expertise of occupational therapists.
Research questions
The primary aim of this study was to answer the following research question: Will Beery VMI change scores correlate with occupational therapists’ perceived magnitude of functional change on the anchor questions for fine motor skills, handwriting, and ADLs?
Method
An anchor-based method was utilized to estimate the MCID of the Beery VMI battery of tests.
Participants
Data were obtained from a sample of 95 children attending a public school in the Northeastern United States. Data analysis for this research utilized a subset of the total sample with an ASD IEP classification (n = 64). The majority of the ASD participants were enrolled in an Applied Behavioral Analysis classroom with a 6:1:1 student-teacher-aide ratio (n = 61, 95.3%). The remainder were enrolled in general education (n = 2, 3.1%) and a 12:1:1 classroom (n = 1, 1.6%). All of the participants received occupational therapy services (100%), 96.9% also received speech and language therapy, and 29.7% received physical therapy. Participants had occupational therapy goals addressing fine motor (87.5%) and visual-motor skills (93.8%), handwriting (73.4%), and ADLs (47.6%).
Procedure
The study protocol was approved by the [name removed] university institutional review board. Due to the nature of the study (i.e., the collection of deidentified chart data), informed consent and assent were not required by the IRB. Data were collected by four occupational therapists over a 2-year period from 2017 to 2019. Participating occupational therapists were provided with in-services about the study in 2017 and 2018, detailed written instructions explaining how to record data, and individualized spreadsheets based on their typical assessment usage. The occupational therapists were asked to record deidentified information about the students on their caseloads, which involved a combination of chart review to establish a baseline of assessment performance and prospective data collection. Data included demographic information (i.e., classification, sex, age, grade, IEP classification, classroom type, IEP, and goal type) and annual test scores on the assessments they typically administered. Testing was conducted by most therapists at least annually, and most often in the spring.
At least 2 weeks after recording demographic and post-test score data, the occupational therapists were asked to answer a series of 15-point Likert scale questions to assess each child’s functional change over the course of the school year. To minimize bias, the occupational therapists were instructed to avoid looking back at each child’s assessment scores. A small monetary incentive was provided for participation in the study.
Instrument
Beery VMI
The Beery VMI is a standardized norm-referenced assessment that requires the examinee to imitate and copy a series of progressively more complex forms. The VP supplemental test requires the examinee to identify matching forms when presented with similarly shaped forms, and the MC supplemental test requires the examinee to connect dots and stay within lines of the forms. The interrater reliability, content validity, and concurrent validity of the Beery VMI battery have all been well established (Beery and Beery, 2010) and continue to be the subject of psychometric research using ethnically and geographically diverse populations (Bahk et al., 2016; Coallier et al., 2014; Harvey et al., 2017).
Data Analysis
Descriptive and inferential analyses were conducted in Stata (Version 15.1; Stata Corp, 2017).
Anchor questions
A 15-point Likert scale ranging from −7 (A very great deal worse) to + 7 (A very great deal better) was used to assess the perceived magnitude of each child’s change in fine motor skills, handwriting, and ADLs. At the end of the school year, occupational therapists were asked three questions: “Compared to the beginning of the school year, has there been any functional change in the child’s ability to perform (fine motor/handwriting/ADL) tasks?” If the occupational therapist perceived no change, then the child received a Likert score of “0.” Children receiving scores of + 1 to − 1 were considered as having no change, and children with scores of + 2 and + 3 (A little better to Somewhat better) were classified as the MCID group and were considered to have potentially experienced a minimal important change since baseline. Children with scores of − 4 or less, and scores of + 4 or more, were considered to have potentially experienced a substantial change.
Minimal clinically important difference values should not be determined solely based on the average change for Likert scores of + 2 and + 3, but should also include an analysis of the relationship between the outcome measure (Beery VMI battery) and the anchor questions (Wells et al., 2001). In addition to positive average change scores for + 2 and + 3, there should be a trend showing greater VMI battery improvement associated with higher values on the anchor questions. 1 Thus, we began by reporting possible MCID values; then, we calculated Kendall’s Tau correlation coefficients between the anchor questions and the VMI change scores. We used boxplots to show the distribution of change scores for each anchor question.
Results
Four therapists provided data for this study. Post-test data for the Beery VMI were missing for four children, reducing the total sample of children with ASD to 60, with MC and VP data missing for 12 children. The mean age was 8.9 years (SD = 2.7), and 51 children (85%) were male. The mean interval between baseline and post-test assessment was 11.4 months (SD = 1.5).
Beery VMI, VP, and MC scores
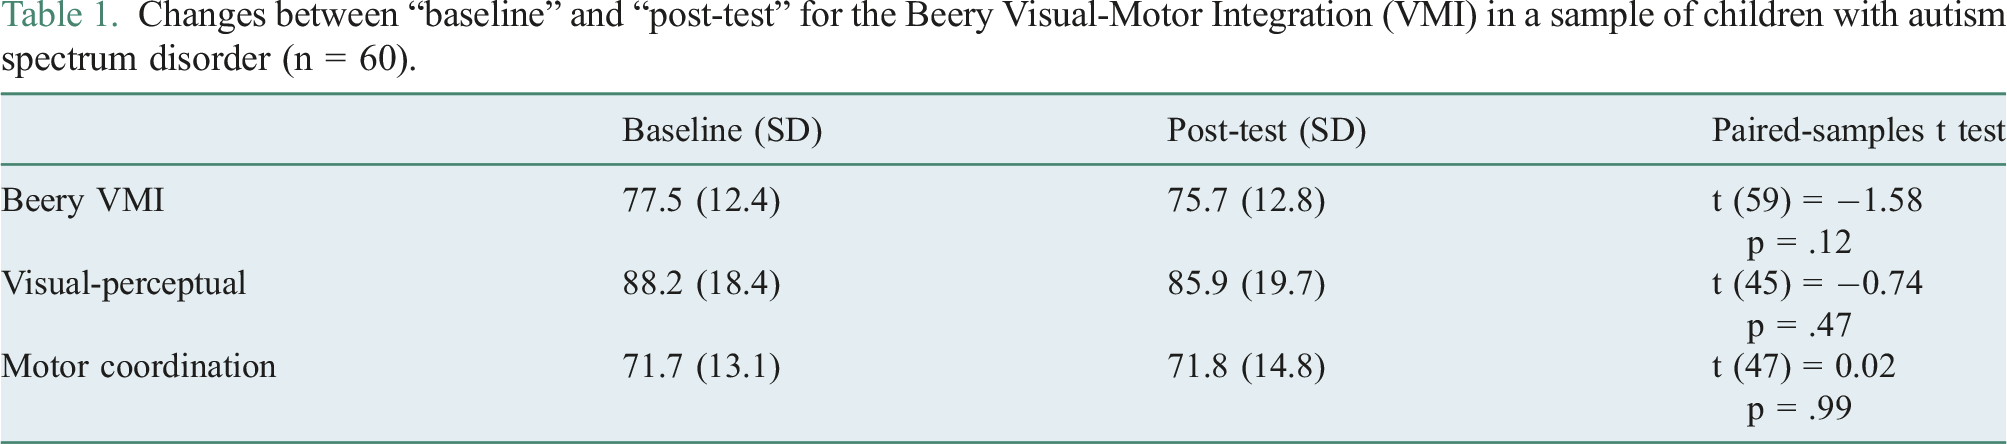
Changes between “baseline” and “post-test” for the Beery Visual-Motor Integration (VMI) in a sample of children with autism spectrum disorder (n = 60).
Perceived magnitude of functional change and possible MCID estimates
Figure 1 shows the distributions of the three anchor questions. The fine motor anchor (n = 59) ranged from 1 to 6, with 11 children categorized as no change, 17 as MCID, and 32 as substantial change (Figure 1); the handwriting anchor (n = 60) ranged from 1 to 7, with 10 children categorized as no change, 21 as MCID, and 29 as substantial change; finally, the ADL anchor (n = 53) ranged from 0 to 7, with 13 children categorized as no change, 18 as MCID, and 29 as substantial change. Univariate distributions of three anchor questions indicating therapists’ perceptions of change between two Beery Visual-Motor Integration (VMI) assessments for a sample of children with ASD, where higher scores indicate more improvement.
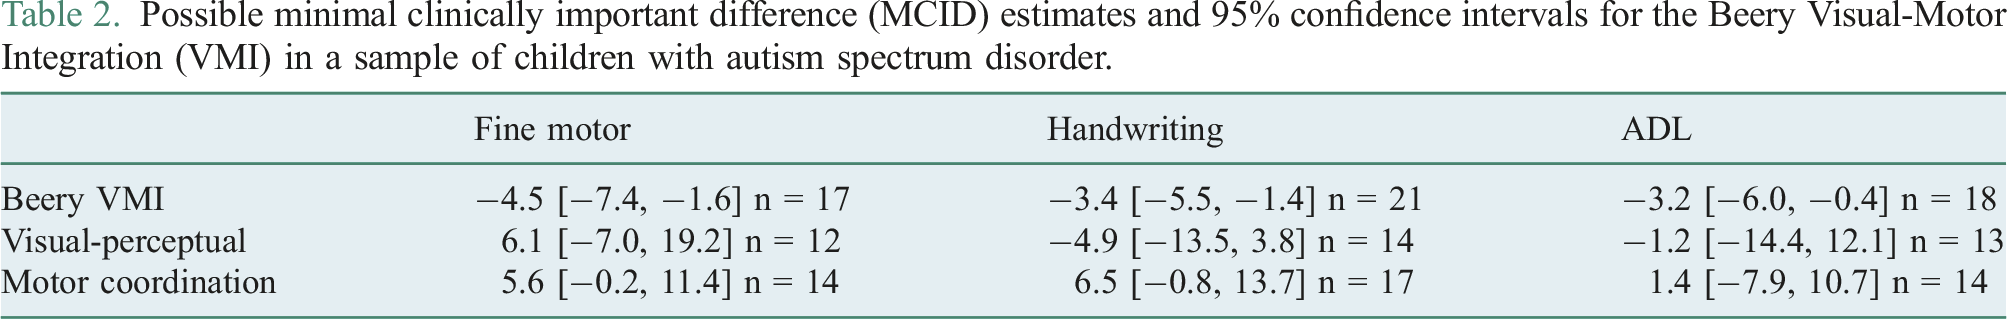
Possible minimal clinically important difference (MCID) estimates and 95% confidence intervals for the Beery Visual-Motor Integration (VMI) in a sample of children with autism spectrum disorder.
Kendall’s Tau correlation coefficients between occupational therapists’ perceived magnitude of functional change in fine motor, handwriting, and ADL domains and change scores on the Beery VMI, visual-perceptual (VP), and motor coordination (MC) in a sample of children with autism spectrum disorder.
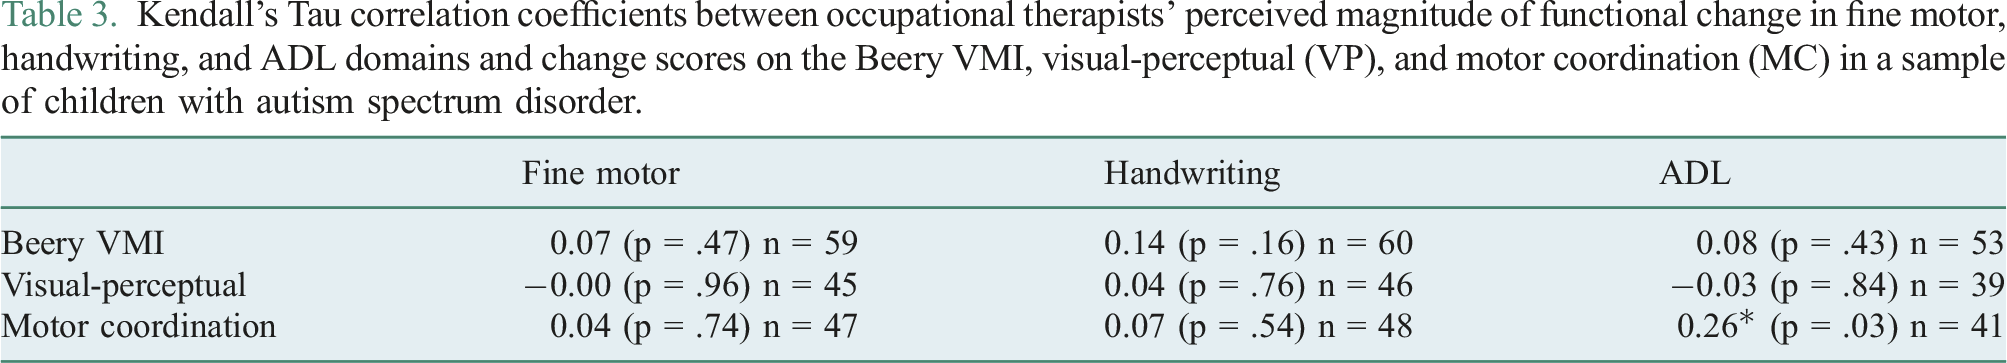
Figure 2 shows boxplots of the Beery VMI change scores by values of the anchor questions for the possible MCID values in Table 2, which include the four values with positive average change scores. These include VP change for the fine motor anchor, MC change for the fine motor anchor, MC change for the handwriting anchor, and MC change for the ADL anchor. The MC ADL anchor displays somewhat of a positive trend in the change score, which would be indicative of a meaningful relationship between therapists’ perceptions of change and change scores on the MC. For the other boxplots, there is no positive trend in change scores. In particular, anchor scores of + 4 and + 5 include many cases with negative VMI change, and median change scores of approximately or below 0. Box plots of Beery Visual-Motor Integration (VMI) change scores by values of the anchor questions for four possible minimal clinically important difference (MCID) values for a sample of children with ASD.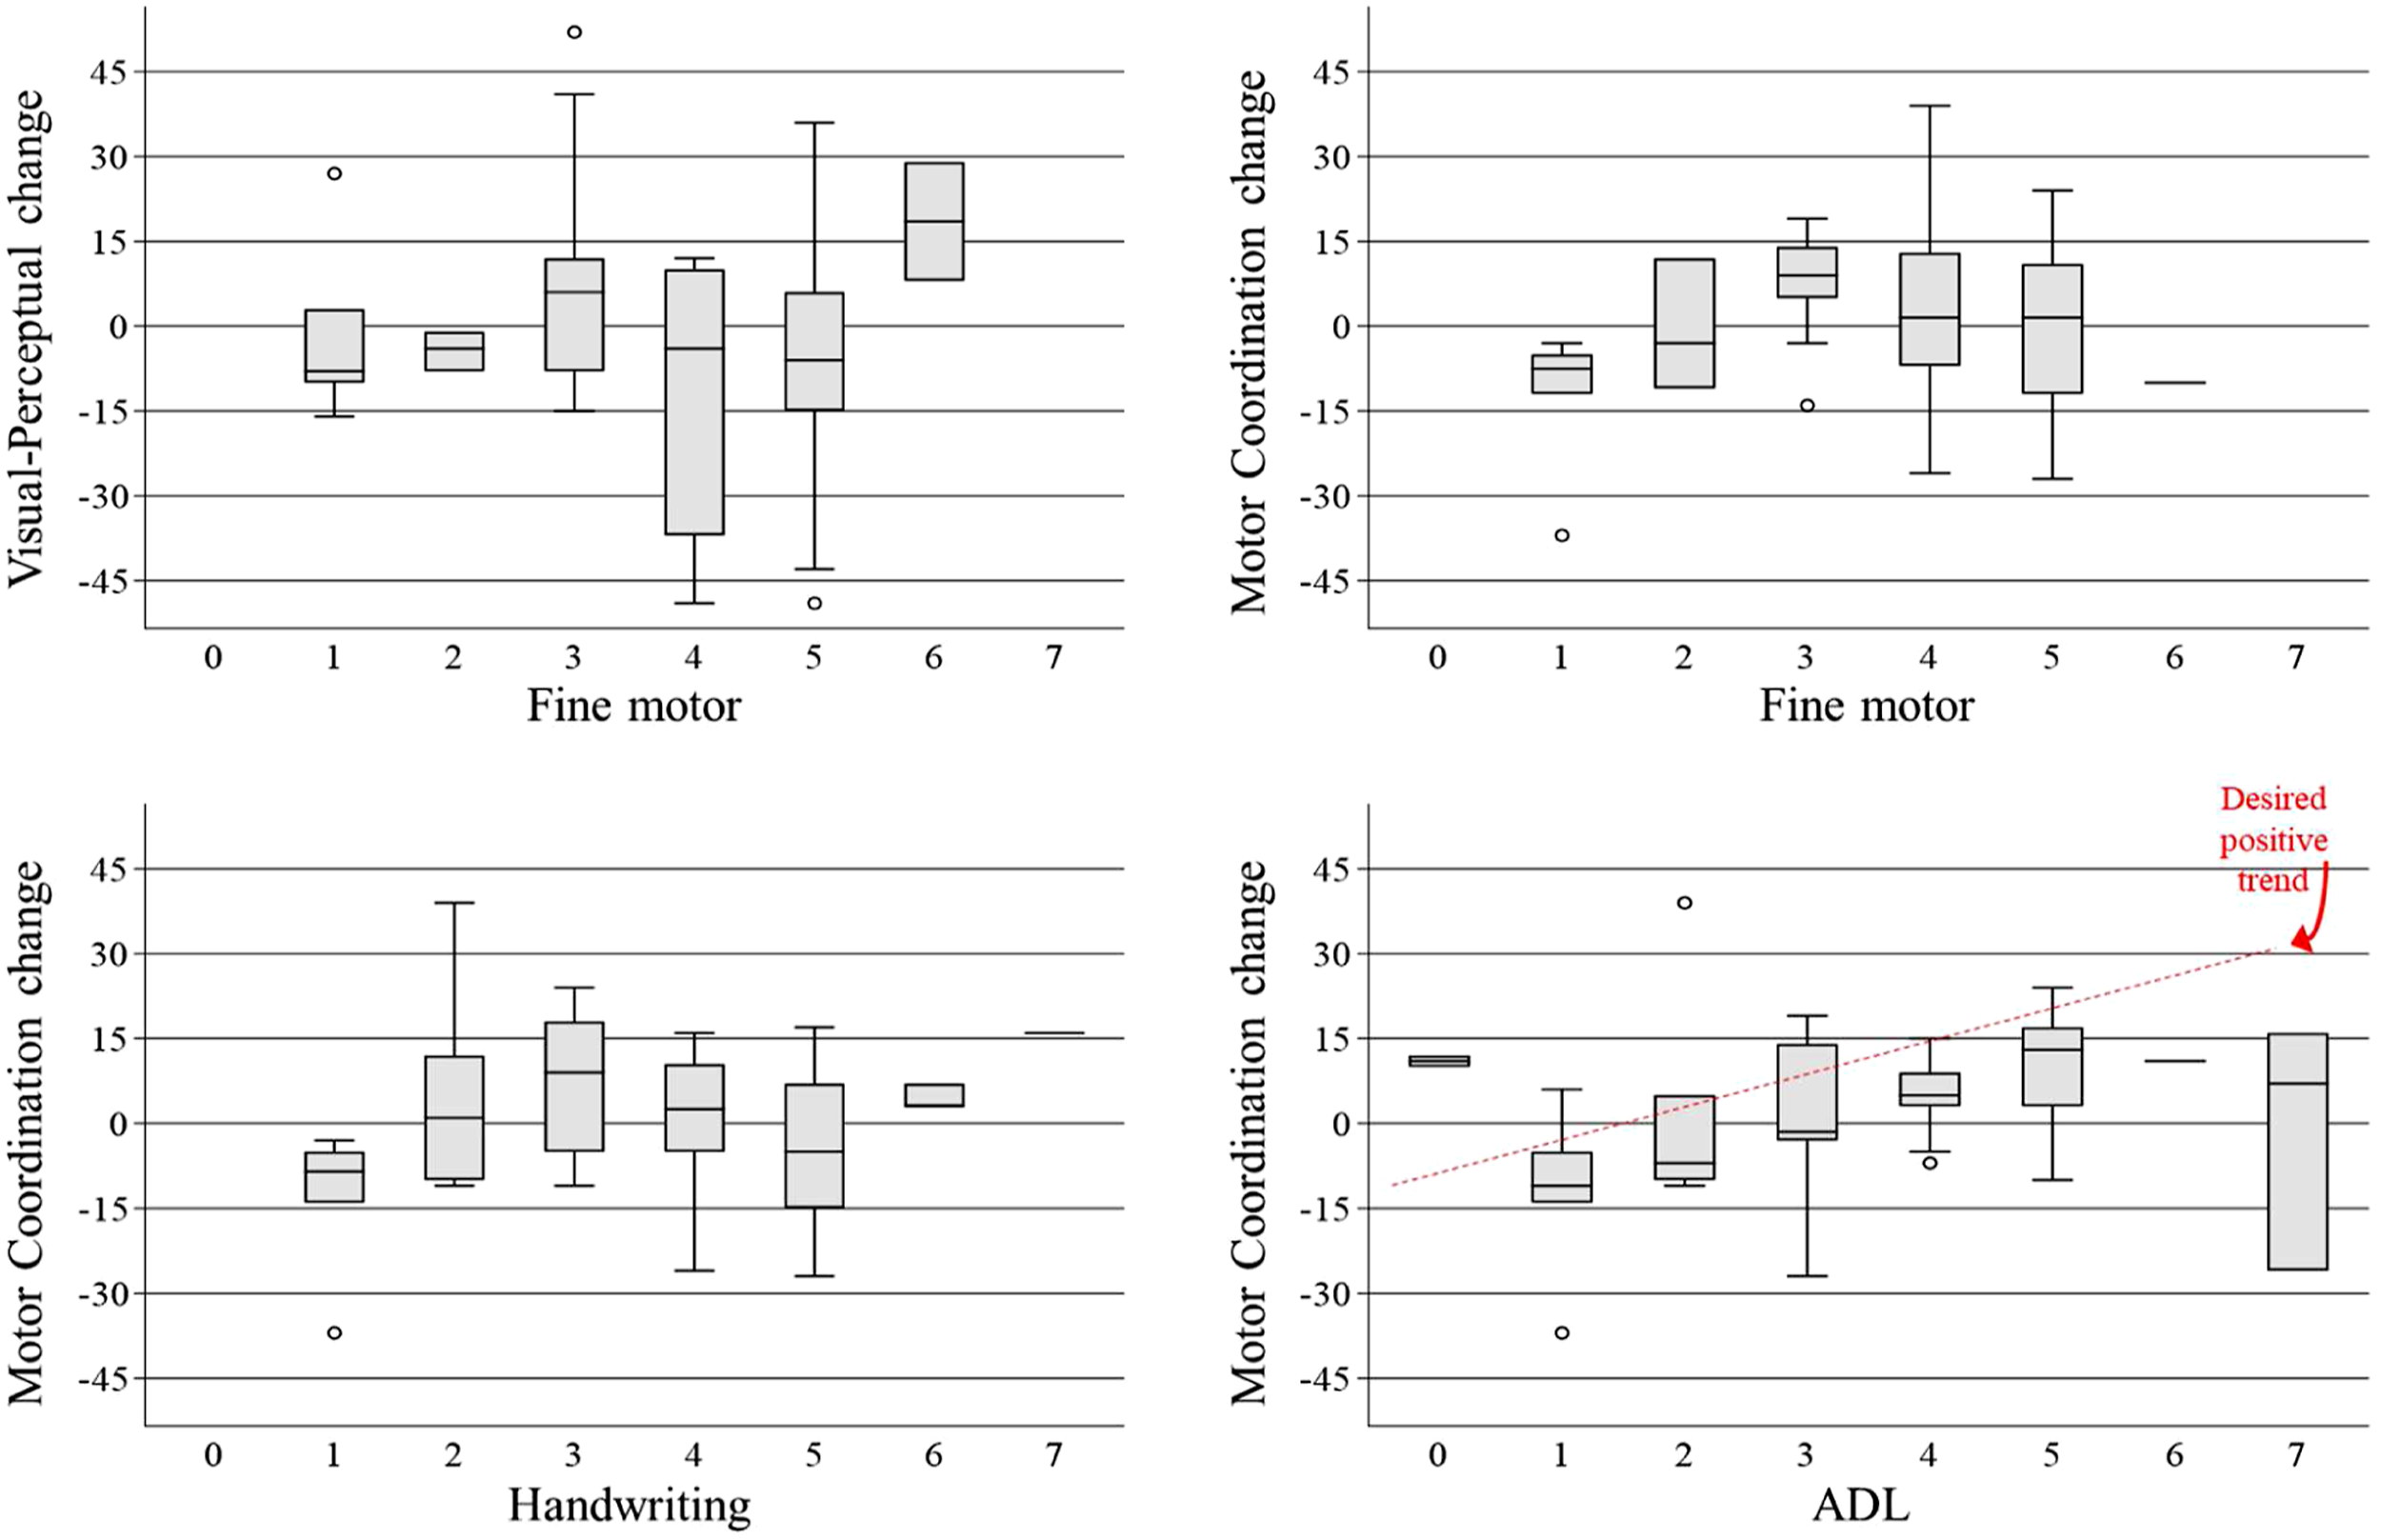
Discussion
This study aimed to estimate the MCID for the Beery VMI battery of tests with children with ASD. Results indicate that the Beery VMI, VP, and MC scores of children with ASD in our sample did not significantly change over the course of the school year, while occupational therapists reported improvements across the fine motor, handwriting, and ADL domains for the majority of the children on their caseloads. These findings are consistent with intervention research finding no significant change in VMI scores while concurrent top-down measures detected statistically significant improvements (Coutinho et al., 2017; Howe et al., 2013; Hunter and Potvin, 2020; McGarrigle and Nelson, 2006; Pfeiffer et al., 2015). However, direct comparisons between the current study and previous intervention research should be made with caution. Unlike prior research that employed manualized interventions, the current study utilized traditional individualized occupational therapy services as a backdrop for psychometric purposes, including a substantially longer duration of time between the two measures compared to short-term intervention studies.
There is no evidence that would allow us to estimate MCID values for clinically meaningful functional change in fine motor, handwriting, or ADL domains. For MCID values to be meaningful, we would expect to see positive relationships between the Beery VMI change scores and the anchor scores. For the present sample of children with ASD, only MC change and the ADL anchor show a positive significant relationship, albeit weak. Since the possible MCID value for the MC test (1.4) is lower than the SEm for the test (SEm = 6) and the CI contains zero, it cannot be used.
Assuming the occupational therapists’ estimates of functional change were unbiased and accurate, the disparity between Beery VMI battery scores and the anchor ratings can be accounted for with two plausible explanations. First, the Beery VMI battery was not validated to measure fine motor, handwriting, or ADL skills. According to the Standards for Educational and Psychological Testing, “if a test score is interpreted for a given use in a way that has not been validated, it is incumbent upon the user to justify the new interpretation for that use” (American Educational Research Association, American Psychological Association & National Council on Measurement in Education, 2014: 24). To our knowledge, there has been no additional psychometric evidence supporting a new interpretation of the Beery VMI battery of tests. Second, a cornerstone of pediatric occupational therapy is teaching children to overcome barriers in performance by using compensatory techniques, modifying tasks, and adapting environments. While the children in this study experienced functional changes in handwriting, fine motor, and ADL skills, given the nature of standardization procedures, these improvements would likely not be detected on a test that does not allow an eraser, let alone modifications.
Limitations
Our study had several limitations. First, it is possible that MCID values do exist for the Beery VMI when administered to children with ASD, but this study simply failed to fine them. With this in mind, the present sample size was small, but note that successful MCID studies have relied on far fewer cases (e.g., Hsieh et al., 2007; Li and Lin, 2020), and while we are unaware of recommendations for minimum sample sizes for MCID studies, erring on smaller sample sizes (e.g., 25–75) ensures that we only detect medium to large effects, which we should require before creating MCID cut-offs that are ultimately used to infer about individual cases. Second, only four clinicians provided assessments of functional change, and it is possible that their assessments were biased upwards. There is at least minor cause for concern because there were no negative scores for any children, although there is little reason to think children with ASD receiving occupational therapy should display functional decline during the school year; furthermore, given the assumption that therapists generally have high awareness of functional abilities and change in the children on their caseloads, the likely result of this positive bias would be a shifting of the MCID values from + 2 and + 3 to higher values, such as + 4 and + 5. If we used values of + 4 and + 5, the MC/ADL anchor would be a possibility, although the desired trend in Figure 2 is still not present. Third, it is possible that children with ASD are unique in terms of the Beery VMI. For example, baseline scores are lower for children with ASD compared to TD children, and children with ASD appear to display relatively higher VP scores (Rosenblum et al., 2019; Zhang et al., 2020), but we know of no evidence that change scores among children with ASD are less reliable than for TD children. With that said, the ASD group in our sample included many children who improved by at least 1 SEm, and there were similar proportions of improvers in the ASD group compared to the TD group for VP and MC. There was a slightly lower proportion of improvers in the ASD group for the Beery VMI, but there was still a sufficient number of children improving “meaningfully” in terms of distributional characteristics of the VMI (n = 10); if an MCID value exists, these children should move the therapist anchor scores up, which did not happen.
Conclusion
The philosophical base of occupational therapy promotes outcomes in which individuals engage in meaningful occupations that support their participation in life (American Occupational Therapy Association [AOTA], 2011). While both top-down and bottom-up assessments can be used to inform intervention decisions that lead to the overarching goal of meaningful participation, bottom-up assessments alone may not provide a clear pathway to interventions that address occupational issues (Hocking, 2001). Our findings lend further support to cautioning a sole reliance on bottom-up assessments, particularly when working with children who have functional goals.
The Beery VMI is but one example of a bottom-up assessment that gained wide traction as an outcome measure, despite many studies cautioning against such use. More research is needed to examine clinically meaningful change for bottom-up assessments. One practical approach, as in the present study, is to estimate MCID values with the use of external “anchors,” where the anchors are tied to functional change. While our study asked therapists about functional change, there are no doubt other objective and trustworthy anchors that could be used in children.
For the Beery VMI in particular, the inability to estimate MCID values for children with ASD may be the best evidence to date that the assessment is not correlated with function. Future studies should attempt to estimate MCID values for TD children. It would be interesting if the Beery VMI is sensitive to change in TD but not ASD children. In the meantime, there is good evidence that the Beery VMI is not a reliable outcome measure for children with ASD.
Footnotes
Declaration of conflicting interests
The author(s) declared no potential conflicts of interest with respect to the research, authorship, and/or publication of this article.
Funding
The author(s) received no financial support for the research, authorship, and/or publication of this article.