
Abstract
This paper analyses the role of pork-barrel politics in the allocation of public investment expenditures in Greece. It proposes a model which explicitly relates the allocation of public investment to electoral results using a unique dataset covering the period from the restoration of democracy in 1974 until 2009, just before the Great Recession that radically transformed the political panorama of the country. The analysis includes 10 legislative periods marked by governments of the two parties that dominated the political arena in Greece: the Liberal and the Socialist Party. The results show that Socialist and re-elected governments applied more expansionary fiscal policies relative to Liberals. The two main parties also used different tactics when it came to pork-barrelling: while the Socialists when in government rewarded/groomed their electoral fiefs, the Liberals invested in areas controlled by the opposition to win over new votes or seats.
Introduction
The analysis of the territorial allocation of public expenditure is an area of research with a long tradition. At the crossroads between public economics, political science, and political geography, the literature on the implications of pork-barrel politics has increasingly become more theoretically and empirically sophisticated (Golden and Min, 2013). Different empirical studies offer a variety of outcomes and interpretations, depending on the discipline of origin, the approach adopted, or the individual countries or groups of countries covered.
One of the drivers of this type of research is the realisation that government decisions about the geographical allocation of public spending are not always driven only by ‘objective’ socio-economic criteria, such as efficiency and/or equity, as the normative theory of public finance would claim (Buchanan, 1950), but also by political considerations (Bennett, 1980; Oates, 1972). And in few countries has the link between pork-barrel politics and economic outcomes been more under the spotlight than in Greece, making it a particularly interesting – and, until now, neglected – case study to analyse for a number of reasons.
First, pork-barrelling in public investment is always prominent in countries with strong clientelistic and/or nepotistic networks. In Greece, the provision of collective goods, such as bridges and highways or schools and hospitals, has often been regarded as a perk to pay back voters for their electoral support. Second, Greece being a highly centralised country, the decisions about how to allocate public projects – regardless of whether the actual expenditure takes place at the national or at the local level – can often be traced back to national elections. Third, the high level of Greek fiscal centralisation and the lack of a specific formula for the regional allocation of public investment leaves plenty of room for political bargaining – and, hence, for pork-barrelling – about the territorial allocation of public expenditure. Fourth, regional development was one of the avowed policy priorities of successive Greek national governments throughout the period of analysis. Infrastructure investment was used as the main mechanism for upgrading the competitiveness and cohesion of regional economies and was the target of a high proportion of the projects co-funded through EU structural assistance. Fifth, Greece organised the 2004 Olympic Games. The preparation of the Games meant that considerable financial resources were channelled towards infrastructure investment of dubious sustainability. In addition, the need to meet strict deadlines in the preparation for the Games and the implementation of parallel programmes to the Olympic Games, such as the so-called Greece 2004 – financing athletic and other types of infrastructures in every single municipality across the country –is considered to have allowed plenty of opportunities for pork-barrel politics.
The specific institutional conditions of Greece and the combination of factors outlined above hint that pork-barrel politics may have contributed to distorting regional development policy priorities and undermining the programmatic targeting towards the less well-off regions of the country. In addition, it might have contributed to a macroeconomic situation characterised by high public spending, growing deficits, and galloping debt.
This paper examines the extent to which political factors (votes, seats in parliament, and the party in office) have shaped expenditure on local public goods across the 51 Greek NUTS III regions (nomoi) between the return to democracy in 1974 and the outbreak of the crisis in 2009. The analysis considers the total volume of public investment expenditures by political period. Public investment expenditures constitute part of national budget and include national funds along with the structural assistance from the EU to finance public infrastructures in the country. Data have been disaggregated at NUTS III regional level, where administrative divisions coincide with – with the exceptions of Athens and Thessaloniki – political constituencies.
The paper is structured as follows. Following this introduction, Pork-Barrel Politics and Public Investment section discusses scholarly approaches to pork-barrelling and highlights the key features of the Greek political setting. Data, Variables, and Empirical Specification: The Greek Context section presents the data, the variables, and the econometric model. Next, regression results are discussed, while the last section concludes.
Pork-barrel politics and public investment
Politics and public investment
Theories of distributive politics frequently pay particular attention to the processes behind pork-barrel politics. Electoral considerations often play a key role in the allocation of public expenditure by incumbent governments. Rather than expenditure following ‘objective’ socio-economic criteria, in contexts where pork-barrelling is pervasive, electoral considerations and the expectations for and results of electoral contests may become fundamental drivers behind the territorial allocation of public expenditure. Incumbent governments, considered as profit maximisers, may allocate public resources with the aim of extracting the highest electoral benefit, rather than pursuing equity and/or efficiency.
Scholarly research provides ample evidence of the presence of pork-barrel politics. There are numerous examples in Europe. Limosani and Navarra (2001) find that in pre-election yeas local policy-makers in Italy have had a tendency to increase investment outlays beyond their standard growth rate. Dahlberg and Johansson (2002) demonstrate that in Sweden incumbent governments have used grant programmes to win votes. Celbis et al. (2014) suggest that political bias has been present in the allocation decisions of regional transportation and communication public investments in Turkey.
Pork-barrelling is also widespread as a political practice in the Americas. In the US, Primo and Snyder Jr (2010), for example, show that those areas of the US where a party clearly dominates, attract less attention in terms of distributive spending, because of a decreased incentive for individual legislators to secure a ‘personal vote’ via local projects. More examples of pork-barrelling have been described by Chen (2010) in the case of New York, who proves that the electoral geography of legislative districts affects pork-barrelling under bicameralism. He indicates that greater electoral fragmentation has a negative effect on pork-barrelling. Stokes (2005) depicts how in Argentina political machines (or clientelistic parties) mobilise electoral support by trading particularistic benefits to voters in exchange for their votes. Similarly, Costa-i-Font et al. (2003) find a positive relationship between the regional allocation of public investment and past support for the central ruling party in Mexico.
Not all research, however, indicates that pork-barrelling is pervasive. De La Calle and Orriols (2010), for example, using as a case study the expansion of the underground network in Madrid, show that, although governments are often tempted to follow vote-seeking strategies, they cannot deviate too much from an efficiency-based allocation of public resources. Luca and Rodríguez-Pose (2015) establish that, although politics in Turkey plays a non-negligible role in influencing public investment allocations, the magnitude of pork-barrelling is relatively low in comparison to the role played by socio-economic factors when determining how to allocate public investment across Turkish regions.
In pork-barrel environments, the specific allocation of public funding frequently depends on the electoral prospects of the ruling party in specific constituencies. Political constituencies can be divided accordingly into three types (Johnston, 1977): (a) ‘hopeless’ areas, where the ruling party has a very low level of electoral support and little hope of ever winning more support; (b) ‘safe’ areas, where the ruling party has a high level of popular support and its victory in various electoral contests is virtually guaranteed; and (c) ‘marginal’ areas, where the ruling party either has a slight majority or its opponents have a slight lead over it. In such a categorisation, governments will prioritise, depending on their main objectives, either rewarding existing electoral support or gaining new support.
Two contesting models have been put forward in the scientific literature: the ‘loyal voter’ and the ‘swing voter’ model. The ‘loyal voter’ model assumes that governments allocate public funds to reward constituencies where their core supporters live (Cox and McCubbins, 1986; Golden and Picci, 2008). The ‘swing voter’ model assumes, by contrast, that governments prefer to splash public investment in those regions where the biggest electoral gains can be achieved (Dixit and Londregan, 1996; Golden and Picci, 2008; Lindbeck and Weibull, 1987; Weghorst and Lindberg, 2013). Whereas in the former model incumbent governments reward the past electoral support of their voters, in the latter, they aim to buy-off votes by prioritising expenditures to swing regions. Ansolabehere and Snyder (2006: 549), in an attempt to bridge this dichotomy, argue that it may also be possible that parties chose to target both loyal and swing areas simultaneously.
Greece, public investment, and pork-barrel politics
There is a widespread popular perception that politics plays an important role in the regional distribution of public spending, in general, and public investment, in particular, in Greece. It is not infrequent to read in the local press news about politicians boasting about their capacity to influence and ‘deliver’ investments in, say, roads or schools for their constituencies. Political arguments make the public investment budget – an important section of the national budget – one of the most politicised instruments of government policy in the country (Psycharis, 1990). While more ‘objective’ socio-economic criteria determine the bulk of public expenditure, this part of the national budget – which was introduced in 1952, has been the mechanism channelling EU structural funds to Greece since 1982, and is today under the authority of the Ministry of Development – remains, however, extremely vulnerable to political wrangling and pork-barrelling. Ministers, mayors, members of Parliament, and other politicians vie to carve a share of the public investment budget for their constituencies (Psycharis, 2008).
However, the popular view of a polity riddled by pork-barrelling has not really been confirmed by the scholarly literature. The number of studies on distributive politics in Greece remains limited. The few that exist generally validate the presence of pork-barrel politics in the regional allocation of public funds, but the results are extremely sensitive to the different approaches adopted. Lambrinidis et al. (2005), for example, show that the percentage of votes in a prefecture in favour of the governing party has not been a fundamental driving force in the regional allocation of public investment in infrastructure across prefectures. Rodríguez-Pose et al. (2012), by contrast, demonstrate that differences in votes between the governing and the main opposition party in each prefecture determine the territorial allocation of public investment, which, in turn, influences growth rates across Greek prefectures. Psycharis (2008) finds evidence that politicians in key positions in government have funnelled public spending to their constituencies and/or regions of origin. As a result, the ways through which distributive politics influence the allocation of public investment are still open to investigation.
This paper aims to supersede previous studies by proposing a model using the total volume of public investment – rather than public investment per capita (as in Rodríguez-Pose et al., 2015) – by political period as dependent variable, in order to examine how politics affects the regional allocation of public investments. The analysis controls for a series of variables that, under normal circumstances, would have affected the territorial distribution of public investment. We specifically focus on how public investment is allocated in order to provide different types of public goods and collective services to people in different areas of the country.
Data, variables, and empirical specification: The Greek context
The main aim of the paper is to assess the impact of political factors on the distribution of total public investment expenditures across 51 Greek regions (NUTS III level) over 10 political periods, paying particular attention to the behaviour of different political parties with regards to pork-barrelling when in office. The choice of spatial level and political periods of analysis is not casual.
The spatial level of analysis is NUTS III regions. NUTS III regions largely coincide with the Greek political constituencies. In a Greek Parliament of 300 seats, 288 members of Parliament (MPs) are elected directly in open lists on the basis of constituency votes. The remaining 12 MPs (i.e. the so called national deputies or ‘Epikrateias’) are elected from closed lists proposed by political parties. The allocation of these MPs to different political parties is proportional to the political power of each party after the elections (Rodríguez-Pose et al., 2015). The 288 directly elected MPs were elected in 56 constituencies: 49 of these constituencies coincide with NUTS III regions. The only exceptions concern the regions of Attiki and Thessaloniki. Attiki is divided into five electoral constituencies (Athens A, Athens B, Piraeus A, Piraeus B, and Rest of Attiki). Thessaloniki, in turn, is divided into two electoral regions (Thessaloniki A and Thessaloniki B). The coincidence between NUTS III regions and electoral constituencies makes these regions the best unit of analysis for the link between politics and the territorial distribution of public investment.
Political periods.
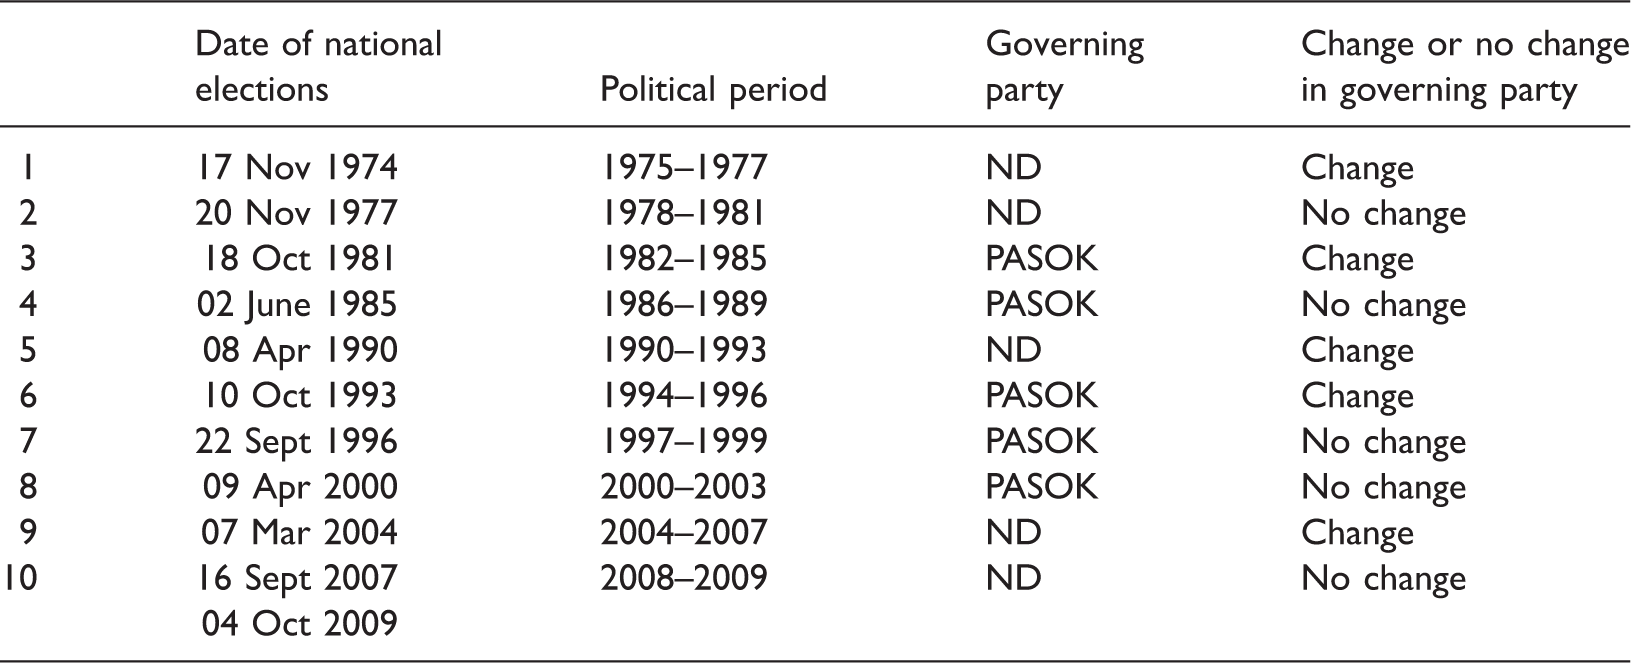
Data on public investment have been provided by the Ministry of Development which is responsible for the Public Investment Programme of the country. Public investment expenditures include investment expenditures in agriculture, forestry, and fishing; manufacturing; energy, mining, and handicraft; transport infrastructures; tourism and modern culture; education and research; housing and environment; health and public welfare; water supply and sewage facilities; devolved public expenditures to regions and prefectures; special infrastructure works; miscellaneous and administrative expenditures; and Olympic Games infrastructure projects. EU structural assistance to Greece, the national contribution to EU co-financed projects, and projects of purely national interest and funding are all included in these data (Rodríguez-Pose et al., 2015). For each political period, we calculated the total volume of public investment expenditures. Although the avowed aim of Greek public expenditure has always been – regardless of the political orientation of the party in office – that of achieving greater equity and/or efficiency, our hypothesis is that the territorial distribution of funds may have been affected by political factors, as public investment in Greece has always been open to political discretion. These expenditures may therefore capture pork-barrelling. Figure 1 shows the average regional distribution of the total volume of public investment expenditures between 1975 and 2009.
The regional distribution of public investment expenditures.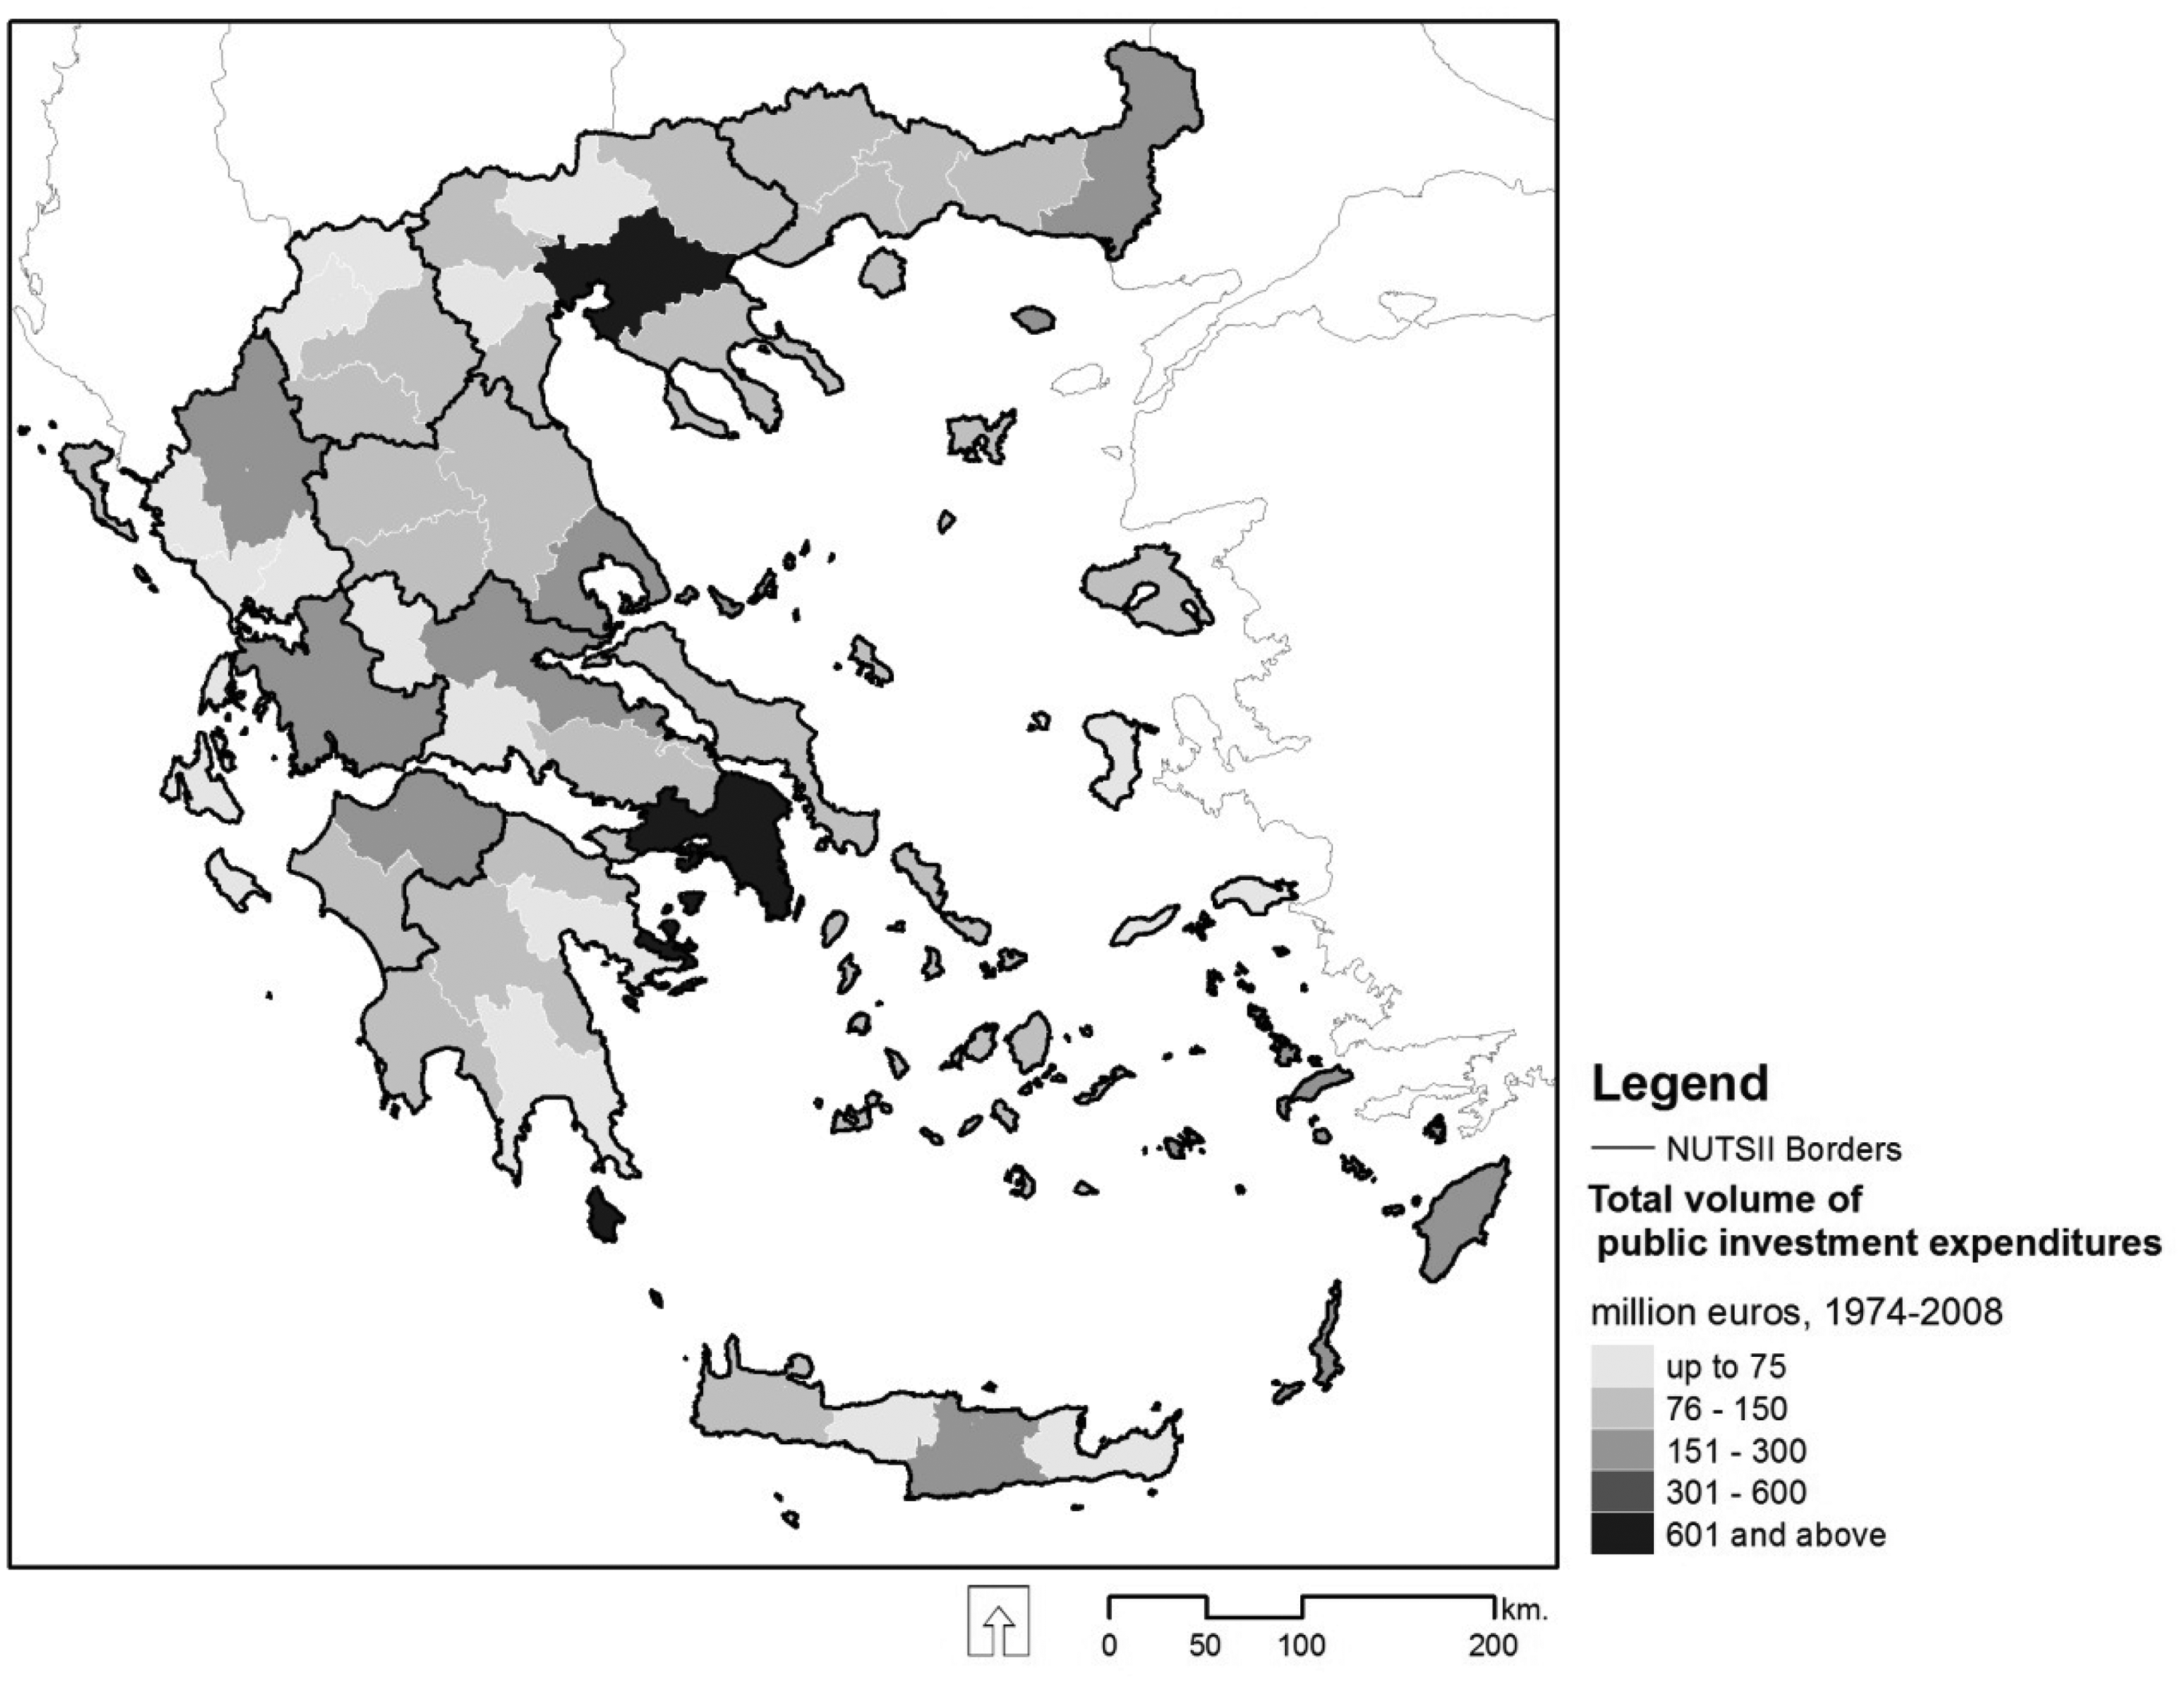
In particular, we formulate and empirically test three hypotheses regarding potential political influences in the allocation of public investment across Greek regions. First, we analyse the extent to which differences between parties in political power in a given region determine public investment expenditures in the region. Second, we assess whether the re-election of a party leads to greater pork-barrelling than a first-time election. Third, we examine whether public investment expenditures differ depending on the orientation of the party in office (i.e. between the Liberal and the Socialist Party). We use the following simple model

We expect differences in regional political power – following the ‘loyal’ vs. ‘swing’ voter model – to affect the allocation of public investment (Hypothesis 1). We do not anticipate differences in pork-barrelling behaviour between the Liberals and the Socialists (Hypothesis 2), as perceptions of political corruption affect all governments in the country (European Commission, 2014). Finally, we consider that re-elected governments, that are already familiar with the levers of power, will resort to pork-barrelling in greater measure than first-time elected governments (Hypothesis 3)

and

Equation (1) tests Hypothesis 1, equation (2) tests Hypothesis 2, and equation (3) tests Hypothesis 3.
The regional political power variables are depicted by the percentage votes and seats (MPs) for each party in each region. More specifically, the regional political power variables include the regional political power of the Liberal Party, the Socialist Party, and of minority parties, measured as:
the percentage votes (seats) in the region in favour of ND (%ND – Votes (Seats)), the percentage votes (seats) in the region in favour of PASOK (%PASOK – Votes (Seats)), and the percentage votes (seats) in the region in favour of minority parties (e.g. the Greek Communist(s) Parties) (%Rest – Votes (Seats)).
The regional political power variables also include the (‘absolute’) regional political power of the governing party and the regional political power of the governing party relative to the main opposition party. This latter variable is known as the ‘relative’ political power of the governing party (Rodríguez-Pose et al., 2012). The variables, respectively, are measured as:
The value of the relative political power variable for a particular region can be negative in those cases where the percentage share of votes or seats in favour of the governing party (ND or PASOK) is lower than the percentage share of votes or seats in favour of the main opposition party (PASOK or ND, respectively) (Rodríguez-Pose et al., 2012).
Finally, the regional political power variables include the political power of single-seat constituencies. This variable is measured by a dummy variable (Single-seat constituency) coding whether a region returns only one MP to Athens (i.e. single-member) or more (i.e. multi-member) (base category). In single-member settings, the incentives facing individual legislators are similar to those facing their political parties.
Descriptive statistics.
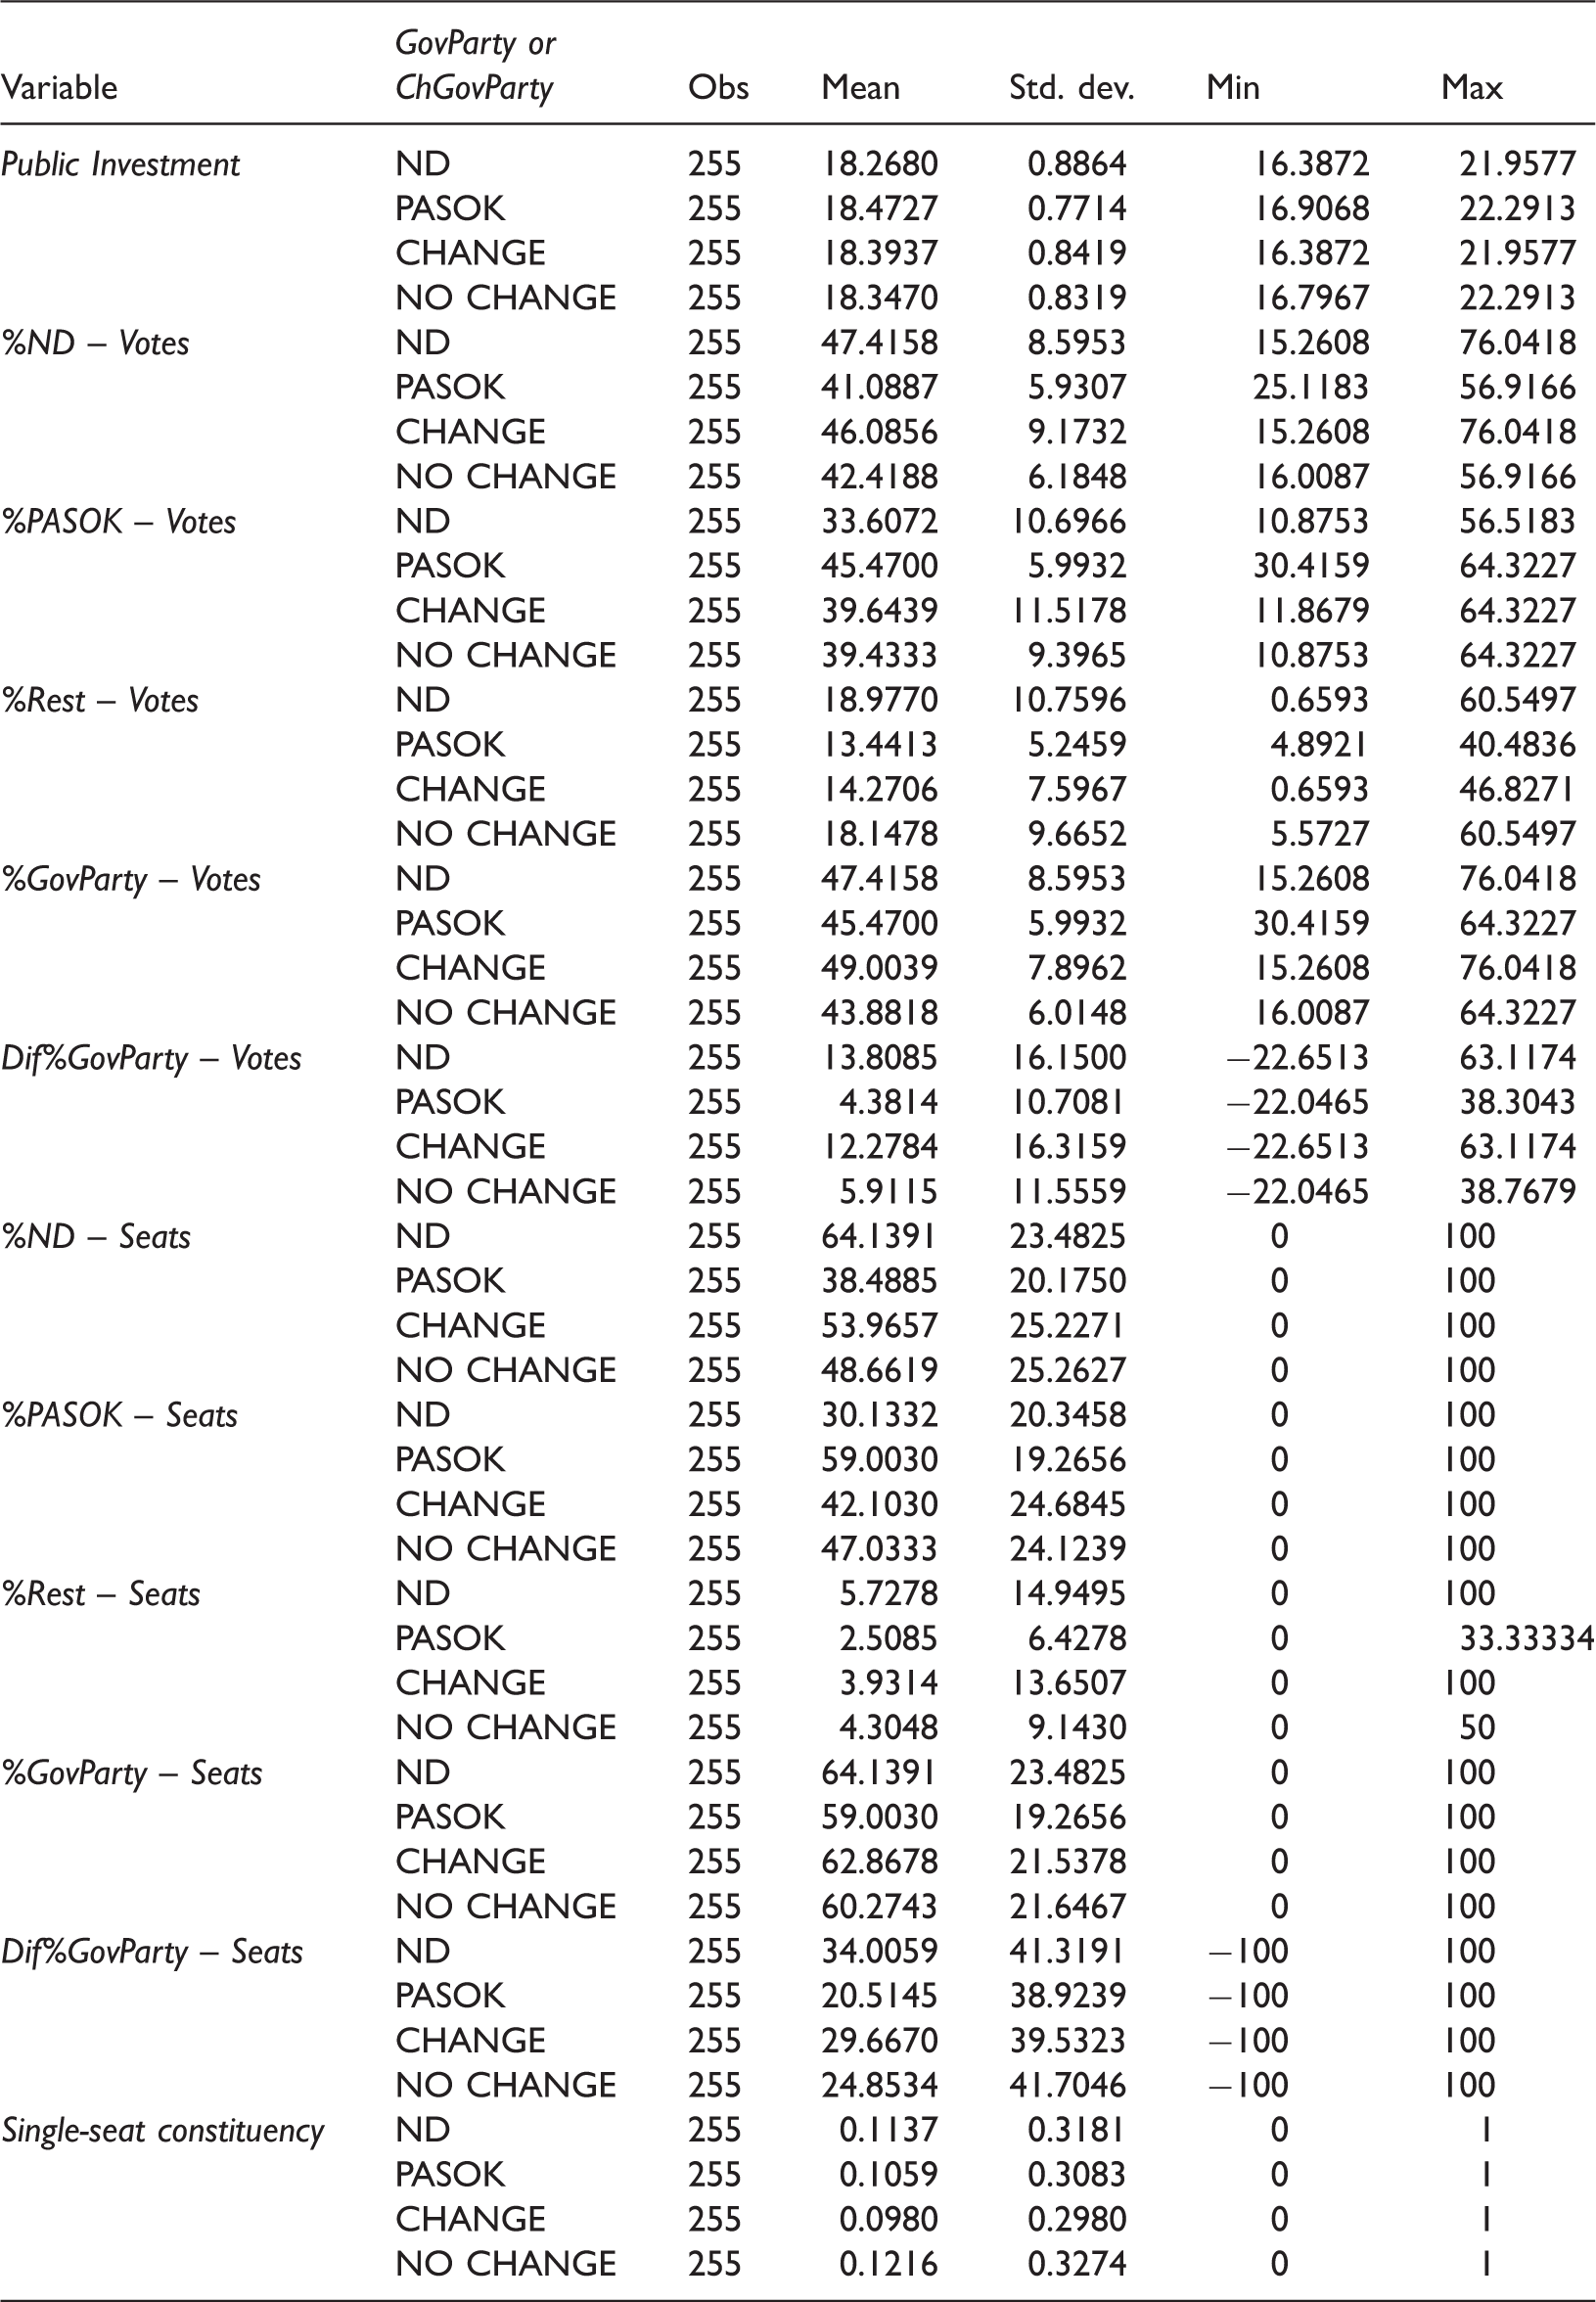
The control variables (Control) include region-specific characteristics that either change over time or are time-invariant. The reason for the choice of control variables was related to their presence in the literature and previous empirical studies about pork-barrelling and corruption, as well as to data availability issues. The time-variant region-specific characteristics are GDP per capita (divided by 10,000), as a measure of regional economic development; Density which uses regional population density (population/km2) in order to capture regional agglomeration; and Earthquakes, which is a dummy variable coding earthquakes with victims or casualties. 5 Size (in km2 divided by 10,000) is an indicator of the size (area) of the region and is a time-invariant, region-specific characteristic. 6 The empirical specification also includes political period dummies to control for all political-period-specific region-invariant variables (Rodríguez-Pose et al., 2012). All these controls capture some regional features and are likely to deal with some sources of heterogeneity reducing the omitted variable bias.
The correlations between the GovParty, ChGovParty, and Control variables are low, but the correlations between the regional political power variables (PolitPower) are high. 7 This prevents the examination of the impact of all political power variables on public investment expenditures simultaneously.
This paper also considers possible differences in the magnitude of the regional political influence across different values. In other words, it examines the non-linear effects of politics on public investment.
Based on data on the percentage of votes, possible differences between low, medium, and high regional political power of the Liberal Party, the Socialist Party, the minority parties, and the governing party, respectively, are examined.
8
The high political power regions capture ‘safe’ regions; the medium political power regions capture ‘marginal’ (or ‘swing’) regions; while the so-called low political power regions capture ‘hopeless’ regions for the political parties. More specifically: if %ND – Votes < 30, %PASOK – Votes < 30, %Rest – Votes < 10, and %GovParty – Votes < 30, the regional political power of the Liberal Party, the Socialist Party, or minority parties, and of the governing party, respectively, is low; if 30 ≤ %ND – Votes ≤ 50, 30 ≤ %PASOK – Votes ≤ 50, 10 ≤ %Rest – Votes ≤ 30, and 30 ≤ %GovParty – Votes ≤ 50, the regional political power of the Liberal Party, the Socialist Party, minority parties, and the governing party, respectively, is medium (base category), and; if %ND – Votes > 50, %PASOK – Votes > 50, %Rest – Votes > 30, and %GovParty – Votes > 50, the regional political power of the Liberal Party, the Socialist Party, minority parties, and the governing party, respectively, is high.
Possible differences between a low, medium, and high relative regional political power of the governing party are also taken into account. Thus,
if Dif%GovParty – Votes < −5, the relative regional political power of the governing party is low and represents the opposition groups (i.e. ‘hopeless’ regions for the governing party); if −5 ≤ Dif%GovParty – Votes ≤ 5, the relative regional political power of the governing party is medium (base category) and represents the marginal constituencies (i.e. ‘marginal’ (or ‘swing’) regions); and if Dif%GovParty – Votes > 5, the relative regional political power of the governing party is high and represents the ruling party’s core constituencies (i.e. ‘safe’ regions for the governing party). Based on data on the percentage of seats, possible differences between monopolistic, high, medium, low, and no political power of the Liberal Party, the Socialist Party, and the governing party are considered. Hence, if %ND – Seats = 100, %PASOK – Seats = 100, %GovParty – Seats = 100, and Dif%GovParty – Seats = 100, the regional political power of the Liberal Party, the Socialist Party, and the governing party (absolute or relative), respectively, is monopolistic; if 50 < %ND – Seats < 100, 50 < %PASOK – Seats < 100, 50 < %GovParty – Seats < 100, and 0 < Dif%GovParty – Seats < 100, the regional political power of the Liberal Party is higher than that of the Socialist Party, the regional political power of the Socialist Party is higher than that of the Liberal Party, and the regional political power of the governing party (absolute or relative) is higher than that of the opposition party, respectively; if %ND – Seats = 50, %PASOK – Seats = 50, %GovParty – Seats = 50, and Dif%GovParty – Seats = 0, the regional political power of the Liberal Party matches that of the Socialist Party (i.e. 50%) (base category); if 0 < %ND – Seats < 50, 0 < %PASOK – Seats < 50, 0 < %GovParty – Seats < 50, and −100 < Dif%GovParty – Seats < 0, the regional political power of the Liberal Party is lower than that of the Socialist Party, the regional political power of the Socialist Party is lower than that of the Liberal Party, and the regional political power of the governing party (absolute or relative) is lower than that of the opposition party, respectively; and if %ND – Seats = 0, %PASOK – Seats = 0, %GovParty – Seats = 0, and Dif%GovParty – Seats = −100, there is no political power for the Liberal Party, the Socialist Party, and the governing party (absolute or relative), respectively.
As for the minority parties, the paper analyses possible differences in political influence between a low percentage seats in the region in favour of the minority parties (%Rest – Seats < 5) (base category) and a high percentage of seats (5 ≤ %Rest – Seats ≤ 100).
Regression results
The regional political power of the Liberal Party (%ND – Votes) and the Socialist Party (%PASOK – Votes).
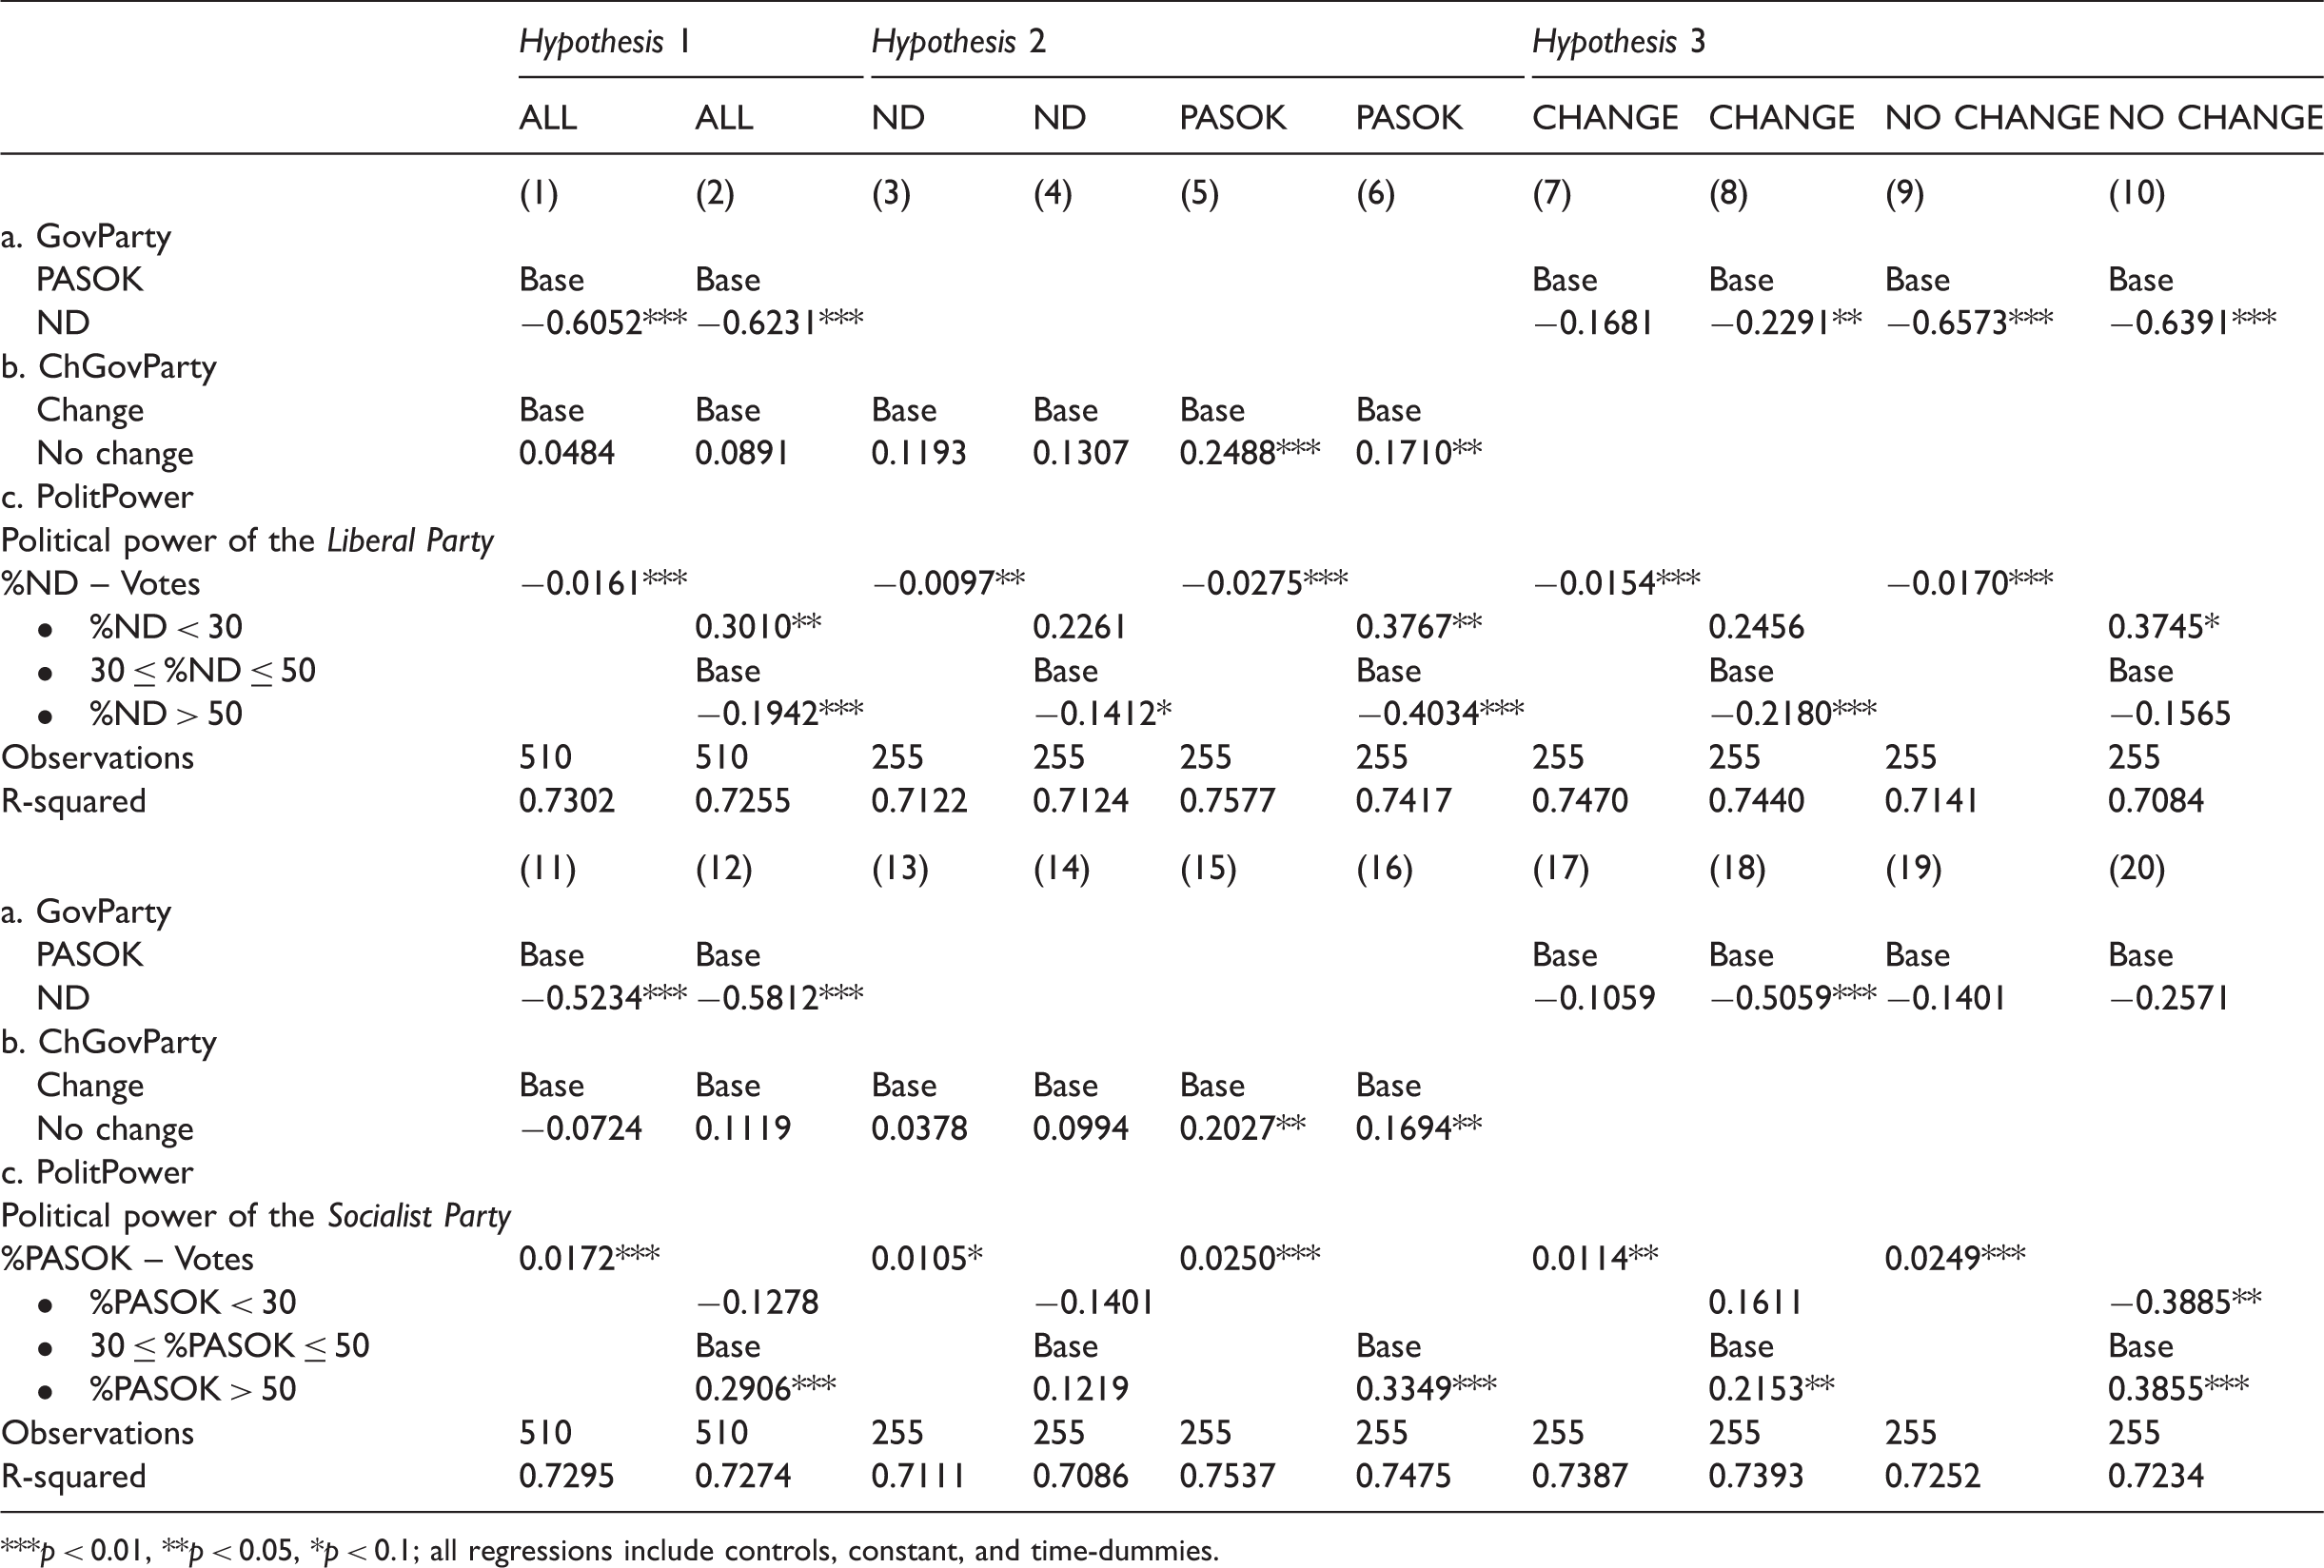
p < 0.01, **p < 0.05, *p < 0.1; all regressions include controls, constant, and time-dummies.
The absolute and relative regional political power of the governing party (%GovParty – Votes and Dif%GovParty – Votes, respectively).
All estimations have a good fit, as they explain more than two-thirds of the variation in regional public investment expenditures. 9 Because of space constraints, we do not report the coefficients on the Control variables (i.e. GDP per capita, Size, Density, and Earthquakes). 10 The results on the controls show that public investment was higher in large, high-density regions and, as expected, in regions which had been affected by earthquakes causing victims or casualties. There is, however, no evidence of an association between regional economic development and regional public investment expenditures.
The results also indicate that the total volume of public investment expenditures was higher when the Socialists were in office – during the periods 1982–1985, 1986–1989, 1994–1996, 1997–1999, and 2000–2003 – than when Greece was governed by the Liberals (see the coefficients on the GovParty variable). They also demonstrate that, after being re-elected (during the periods 1986–1989, 1997–1999, and 2000–2003), the tendency of the Socialist Party to make use of public investment for political purposes was significantly greater than when elected for the first time (see the coefficients on the ChGovParty variable).
The regional political power of the Liberal and the Socialist Party
Table 3 shows a negative association between the regional political power of the Liberal Party (%ND – Votes) and public investment in regions where the Liberals were hegemonic (%ND > 50) (Regressions 2, 4, 6, and 8). By contrast, there is a positive association between both factors in those regions where the Liberals had poor electoral results (%ND < 30) (Regressions 2, 6, and 10), and especially in periods when the Socialist Party was in office (Regression 4 vs 6). This indicates that the Liberal Party had a preference to use pork-barrel politics in order to possibly either attract opposition voters – mainly Socialist – in swing districts or with the intention of mobilising their own supporters there. The Socialists, in contrast, seem to have adopted a different approach. The results show a positive linear association between the regional political power of the Socialist Party (%PASOK – Votes) and public investment (Regressions 11, 13, 15, 17, and 19). Investment was particularly targeted at regions with a high percentage of Socialist vote (%PASOK > 50) (Regressions 12, 16, 18, and 20). As can be expected, the association was stronger when the Socialist Party was in office (Regression 14 vs 16) and, especially, after being re-elected (Regression 18 vs 20). Hence, the Socialist Party adopted a different stance with respect to pork-barrelling than the Liberals. Rather than courting opposition voters in swing constituencies, they groomed their electoral bases in safe districts.
As they were never in office during the period of analysis, it comes as no surprise that there is no evidence that the regional political power of minority parties (%Rest – Votes) was translated into any changes in public investment (see Appendix 1 (Table 5)). The regional political power of the Socialist Party was reflected in a more favourable treatment of its safe-seat constituencies in terms of public investment. There is less evidence of such behaviour in the case of the Liberal Party (see Appendix 2 (Table 6)).
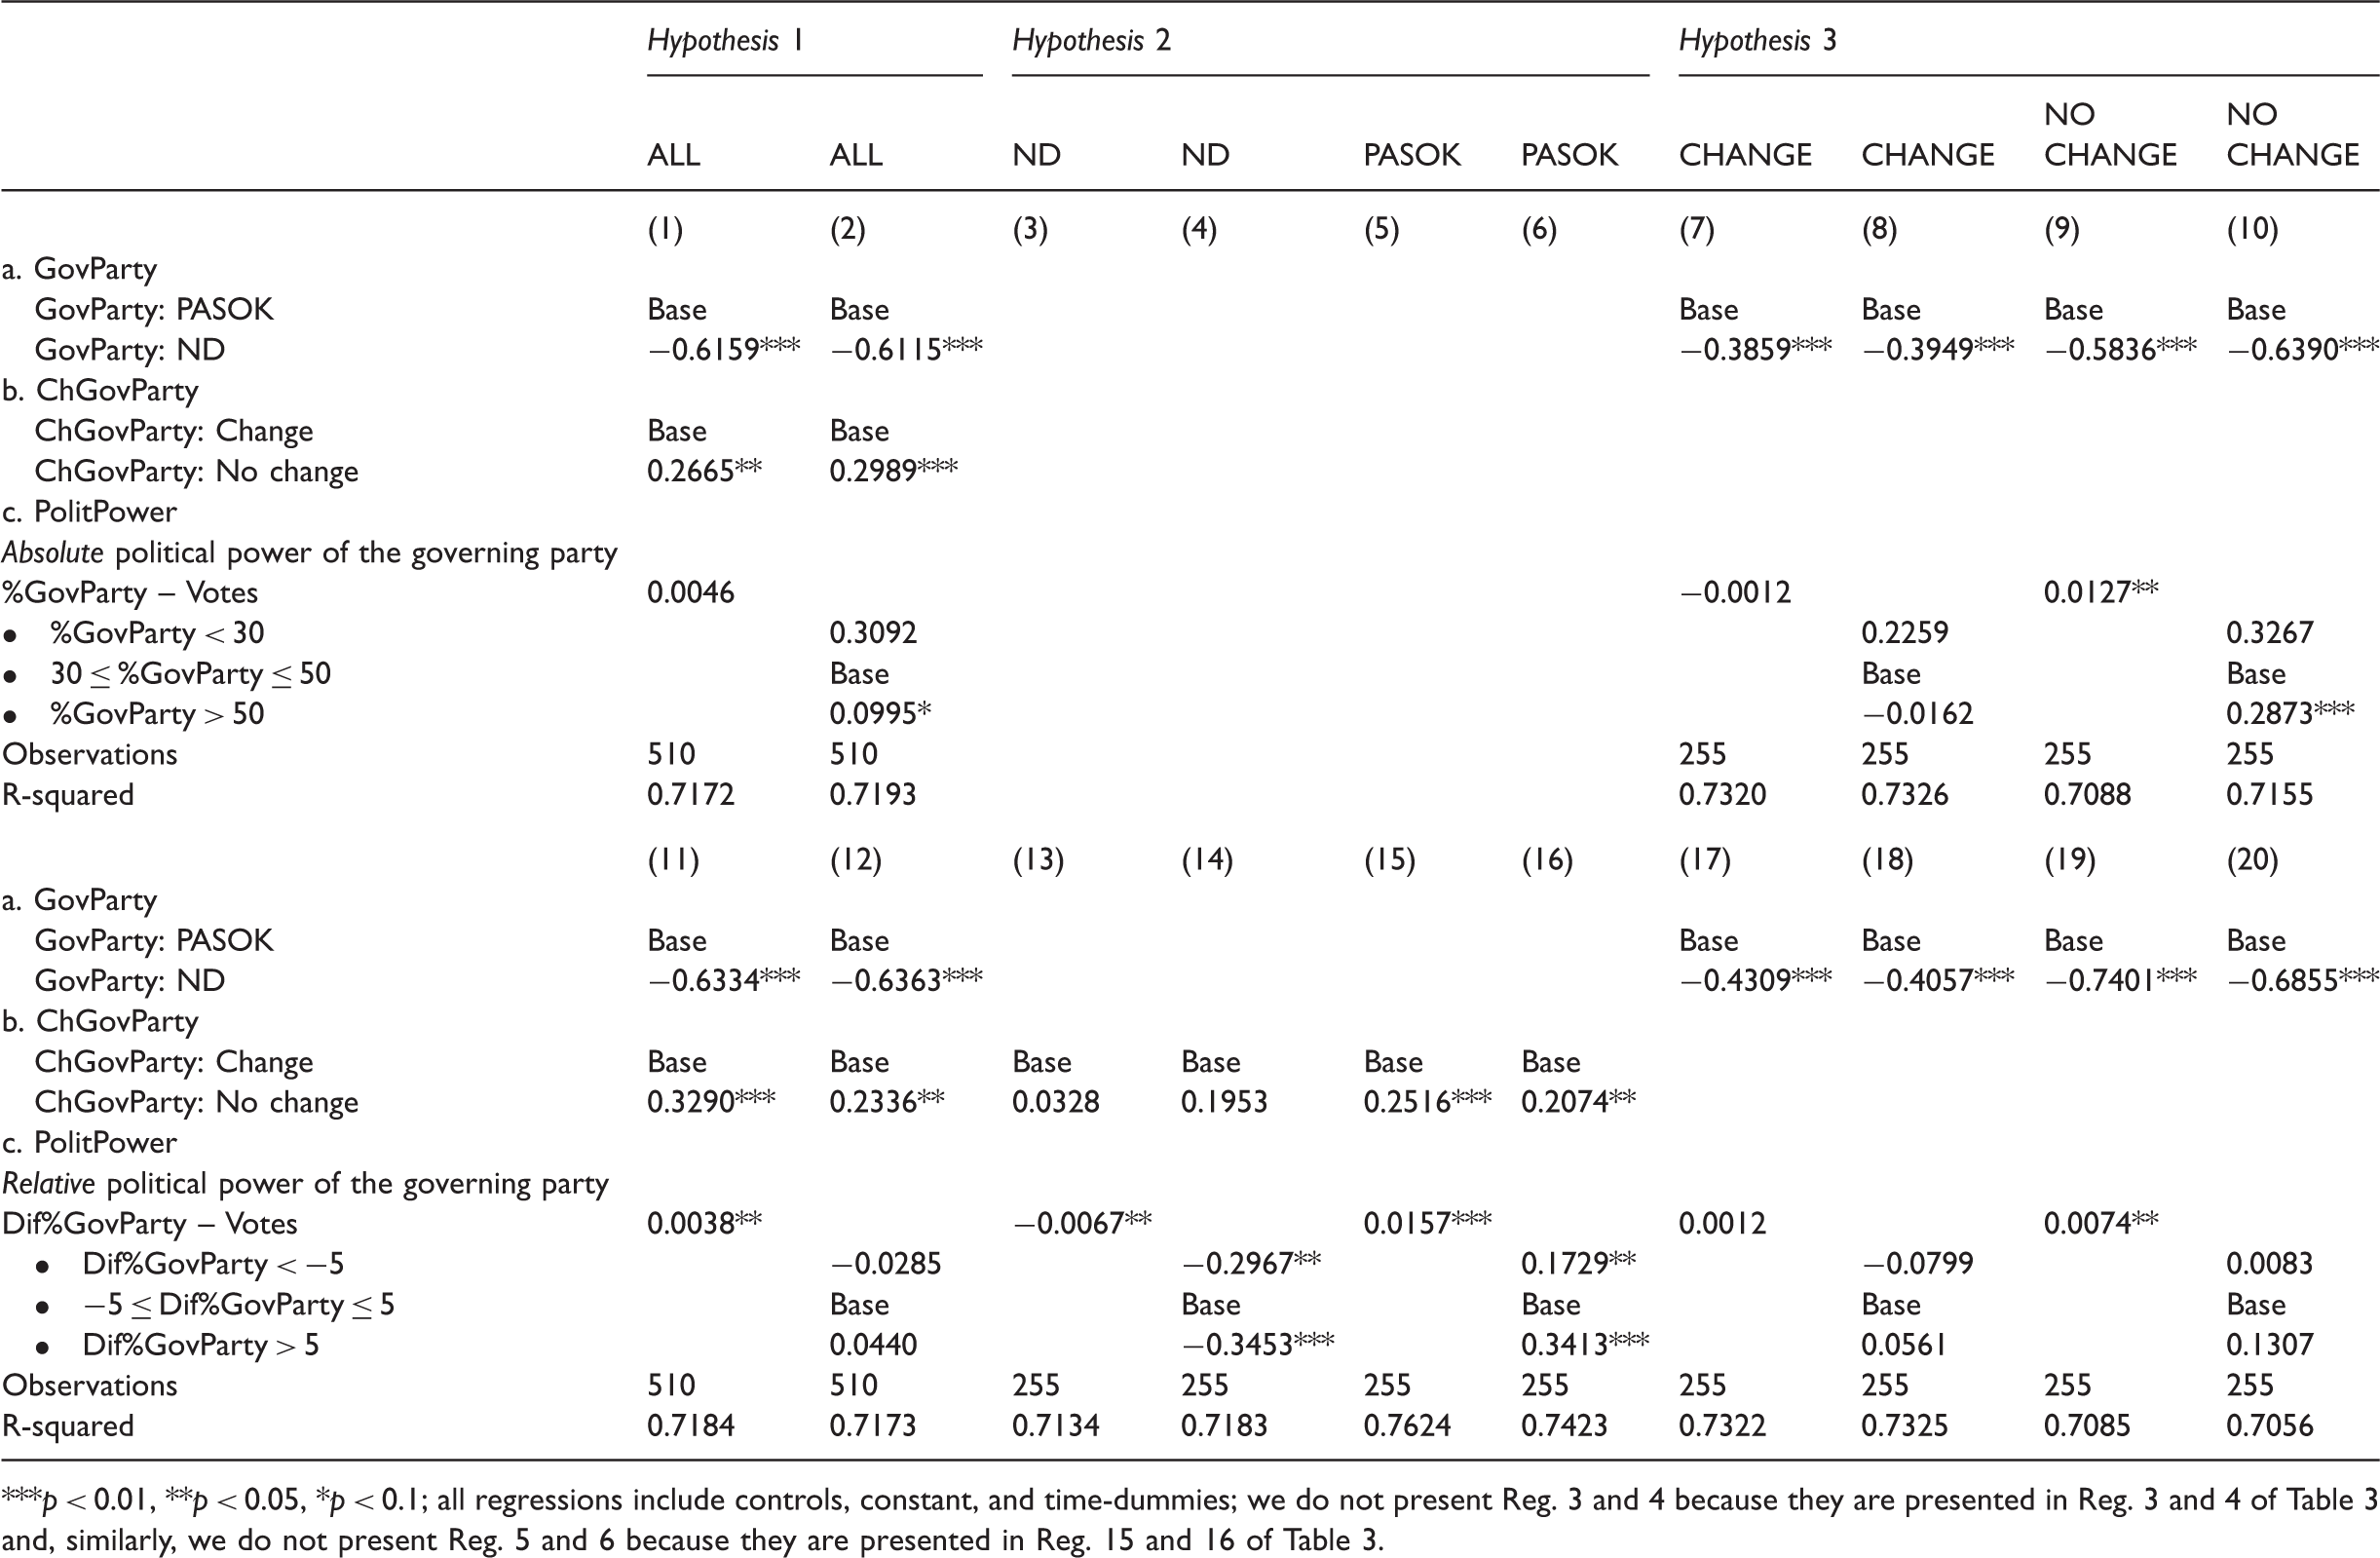
The absolute and relative regional political power of the governing party
Table 4 shows that there is no evidence of a linear statistically significant association between the absolute regional political power of the governing party and regional expenditures (Regression 1). This is possibly the result of a negative linear relationship when the Liberal Party is considered (Regressions 1, 3, 5, 7, and 9 of Table 3) and a positive one in the case of the Socialist Party (Regressions 11, 13, 15, 17, and 19 of Table 3). However, both parties seem to have behaved in a similar way after re-elections (ND in 1978–1981, PASOK in 1986–1989, PASOK in 1997–1999 and 2000–2003, and ND in 2008–2009). Re-elections of an incumbent party are connected to a greater tendency to resort to pork-barrelling, mostly favouring regions that have strongly supported the party in government (%GovParty > 50) (Regressions 9 and 10). Therefore, we find that the re-elected governing parties repeatedly resorted to skewing the distribution of investments in favour of their core constituencies (i.e. ‘safe’ regions). Regions that traditionally gave a higher percentage of the vote to the re-elected governing party generally received larger shares of public investment than their neighbours that voted for the opposition party.
Table 4 also depicts a positive linear relationship between the political power of the governing party relative to that of the main opposition party (Dif%GovParty – Votes) and overall public investment between 1975 and 2009 (Regression 11). Running the same regression by governing party (ND vs PASOK), there is a negative association between the relative regional political power of the Liberal Party when in office and public investment (Regression 13). Public investment tends to be higher in Liberal Party ‘safe’ regions (Dif%GovParty > 5) (Regression 14). However, an increase in the difference in votes between the Liberal Party (as governing party) and the Socialist Party is connected to declines in public investment, particularly in the safest constituencies. This implies, once again, that the Liberal Party had less of a tendency to reward those areas of the country that provided them with their strongest electoral support. PASOK behaved in a different way, strongly channelling public funds to its core constituencies (Dif%GovParty > 5) (Regression 15). The safer the region, the greater the investment (Regression 16). Thus, an increase in the difference in the political power of the Socialist Party (as governing party) relative to the Liberal Party was translated into greater public investment expenditure. The overall outcome is positive (Regression 11), reflecting that the coefficient on the relative political power is higher for PASOK than for ND (i.e. 0.0157 > 0.0067), meaning that the Socialists made greater use of pork-barrelling. Finally, the results show that, as expected, after re-elections public investments were skewed towards areas voting for the governing party (Regression 19).
Overall, the regression results depict a widespread political culture of pork-barrelling in Greece during the period of analysis. The results fail to reject Hypothesis 1 and 3. PolitPower variables show that pork-barrelling matters for the distribution of public investment expenditures (Hypothesis 1), while the coefficients on the ChGovParty variables indicate that there are differences in public investment expenditures between first-time and re-elected governments (Hypothesis 3). The only hypothesis that is rejected is Hypothesis 2, as the Socialist Party made a more extensive use of pork-barrelling than the Liberals when in office.
Conclusions
This paper has delved into the largely overlooked question of the presence and relevance of pork-barrel politics in the four decades after the restoration of democracy in Greece. The results of the analysis have confirmed the presence of widespread pork-barrel practices in the geographical distribution of public investment. Pork-barrel politics during the 35-year time-period between 1974 and 2009 have distorted regional development policy priorities, as the distribution of public investment responded, to a large extent, to the governments’ self-interests.
However, while pork-barrelling was practiced by the two parties that alternated in power in the period between the restoration of democracy and the outbreak of the Great Recession, the analysis has revealed that each party followed a different strategy. The Liberal Party mainly allocated public investment with the aim of gaining additional support and new seats in Parliament by courting the electorate in ‘swing’ constituencies. The Socialist, by contrast, preferred rewarding electoral trust, overspending in ‘safe’ electoral districts. Re-election exacerbated these practices. Re-elected governments splashed more on pork-barrelling once the confidence of the electorate was renewed and decision-makers felt more at ease with governing Greece. The Socialist Party, according to the results of the analysis, made greater public investment spending than the Liberals, as the public investment link to votes and MPs was highest during the periods between 1986–1989, 1997–1999, and 2000–2003, coinciding with the re-election of PASOK. These results are robust to measuring political power by votes as well as by MPs.
Political influences in the allocation of public investment can be considered as an important source of distortion for regional development policy priorities and a serious institutional flaw in the functioning of the Greek democracy. They may have also been a reason behind the excessive spending which led to the generation of substantial annual deficits and debts. In this respect, this article sets a marker about the role played by political parties in undermining the efficiency of the regional development effort for real or perceived party-political gains. However, this article has mostly only scratched the surface, establishing connections, but not exploring the mechanisms through which this pork-barrel was generated, allowed, managed, and tolerated. More research is needed, first, in order to assess whether Greece represents a particular case in terms of pork-barrel politics or whether this type of behaviour is – as implied by some of the literature highlighted in the literature review – more widespread, especially across other southern European countries. In addition, more qualitative and in-depth research will have to be conducted in order to assess the exact ways in which decision-makers influenced and shaped the allocation of public investment for the benefit of their parties, often at the expense of sound and efficient policies and of the Greek people as a whole.
Footnotes
Acknowledgements
We are indebted to the editor in charge, Jessie Poon, for her meticulous handling of the different versions of the manuscript. We have also benefitted from the constructive comments of three reviewers. We thank Panagiotis Pantazis, MSc in Planning and Thematic Cartography, for putting together the map.
Declaration of conflicting interests
The author(s) declared no potential conflicts of interest with respect to the research, authorship, and/or publication of this article.
Funding
The author(s) disclosed receipt of the following financial support for the research, authorship, and/or publication of this article: The research leading to this article has been made possible by the generous funding of the European Research Council under the European Union’s Seventh Framework Programme (FP7/2007–2013)/ERC [grant agreement number 269868]. Additional support was provided by the European Union (European Social Fund) and Greek national funds through the Operational Programme ‘Education and Lifelong Learning’ – Research Funding Program: THALES’ [grant number MIS 380421].