
Abstract
Systematic observations of Himalayan glaciers over the last few decades provide reliable indications of continuous shrinkage of most of the glaciers. Changes in mass, volume, area and length of glaciers are reported, but an up-to-date regional assessment of glacier changes is lacking. In the present study, satellite data, maps and ground-based measurements have been used to obtain the snout retreat and surface changes of the Tipra Glacier in the Alaknanda river basin of the Garhwal Himalaya for the period 1962–2008. The study reveals that a large part of the glacier has been detached from the main trunk and separated into the Tipra (7.5 km2) and Rataban (7.4 km2) Glaciers as it had one outlet (snout) in 1987. Between 1962 and 2002 estimated surface area reduced by ~18% and snout retreat was ~535 m with an average rate of 13.4 m a−1. Measurement of snout positions of the Tipra and Rataban Glaciers from 2002 to 2008 indicates an enhanced annual retreat of 21.3 and 21.2 m a−1, respectively. Total frontal area vacated during this period was calculated to be 0.084 km2 for Tipra Glacier and 0.028 km2 for Rataban Glacier. The estimated Equilibrium Line Altitude (ELA) rise was 76 m for the Tipra Glacier and 57 m for the Rataban Glacier. Accumulation Area Ratio (AAR) was calculated as 0.47 for the Tipra Glacier and 0.49 for the Rataban Glacier, during the study period. The observations compared with the other studies carried out in the region show a significant reduction in glacier areas. The increased retreat rate of glacier snouts is probably a direct consequence of global warming. The present snouts of the Tipra and Rataban Glaciers are located at altitudes of 3865 and 4120 m, respectively.
I Introduction
The Himalaya contains thousands of glaciers varying in shape and size. They are formed in single or compound cirque basins ranging in area from ~0.5 to 143 km2 (Raina and Srivastava, 2008). These glaciers are freshwater reservoirs and sources to three major river systems (Indus, Ganga and Brahmaputra) in the Indian Himalaya. They are also key markers of climate change and their monitoring is important for estimating overall changes (deduced through measurements of mass, volume, area and length) in space and time. However, because of the great spatial extent, remote location, regional climatic variability, and the lack of adequate observations, the relationship between snow/ice glaciers and climatic changes is still not well understood: some glaciers are melting fast whereas some are advancing. Enhanced recession rates of glaciers reported during the recent years have initiated widespread discussion within the scientific community to understand the role of climate change in glacier retreat. In this context, Working Group II of the Intergovernmental Panel on Climate Change (IPCC) speculated in its fourth assessment report that Himalayan glaciers are receding faster than in any other part of the world and that, if the present rate continues, most of the glaciers in the region will disappear by 2035 (IPCC, 2007). However, this neither compares Himalayan glaciers with other rates of recession nor estimates a date for disappearance of Himalayan glaciers (Cogley et al., 2010; Raina, 2009). A study group report on the Himalayan glaciers suggested that there is no evidence of abnormal retreat of glaciers during the last few decades as has been suggested by the IPCC (Raina, 2009). The study also emphasized that the rate of retreat is not uniform for all glaciers. There are many glaciers which have slower retreat rates (5–10 m/yr) and a few are reported to be advancing (mainly in Karakoram Region; Hewitt, 2005). Cogley et al. (2010) reviewed recent reports on the retreat of Himalayan glaciers and suggested that the claim of the IPCC that Himalayan glaciers may disappear by 2035 is wrong because it would require 25 times greater retreat rate than estimated present rates of retreat.
During the last four decades, the long-term monitoring of snout positions and mass balance measurements have been carried out on several glaciers in different parts of the Indian Himalayas (Bhambri and Bolch, 2009). The studies suggest that glacier snouts are retreating between 5 and 20 m a−1 with mass balance in most of the glaciers negative (Dobhal et al., 2004, 2008; Gautam and Mukherjee, 1989; Kulkarni et al., 2004, 2007; Kumar and Dobhal, 1994; Kumar et al., 2007; Wagnon et al., 2007). Besides the key parameters (i.e. length, area and mass/volume), the fragmentation of tributary glaciers from the main trunk may also be a consequence of rapid recession. Like other large mountain glaciers, many Himalayan glaciers are formed by the convergence of two or more tributary glaciers and are classified as compound valley type glaciers (Mullar et al., 1977; Raina and Srivastava, 2008; WGMS, 1989). The larger glaciers (compound valley type) in lower elevation are in the process of fragmentation. There are a number of tributary glaciers which have been detached from the trunk glaciers resulting in an increase in their numbers, but reduced aerial extent (Kulkarni et al., 2007). In order to make an accurate assessment of the impact of climate change on glacier retreat, the lack of time series data on weather parameters such as temperature, precipitation, relative humidity, wind speed and sunshine duration is a significant constraint. It is necessary to monitor the changes in the areal extent, ice mass and snout positions over long periods at annual, decadal and century scales. With such considerations in mind, and realizing the potential significance of the glaciers and their recession process, a preliminary observation of snout positions was carried out to quantify the total changes in the Tipra Glacier in the Garhwal Himalaya during the period 1962 to 2008.
II Study site and climate conditions
The Garhwal Himalaya (N 29°15’–31°30’; E 77°45’–81°) is located on the central realm of the Himalayan range and contains a total of 968 glaciers covering an area of ~2857 km2 (Raina and Srivastava, 2008). The glaciers are situated above 3800 m a.s.l. and the permanent snowline fluctuates between 4500 and 5200 m a.s.l. (GSI, 1999; Raina and Srivastava, 2008; Sharma and Owen, 1996). The winter snowline extends down to 2700 m during the peak snowfall. The meltwater received from glaciers and snow on these mountain slopes is a prime source for drinking water, irrigation and hydropower.
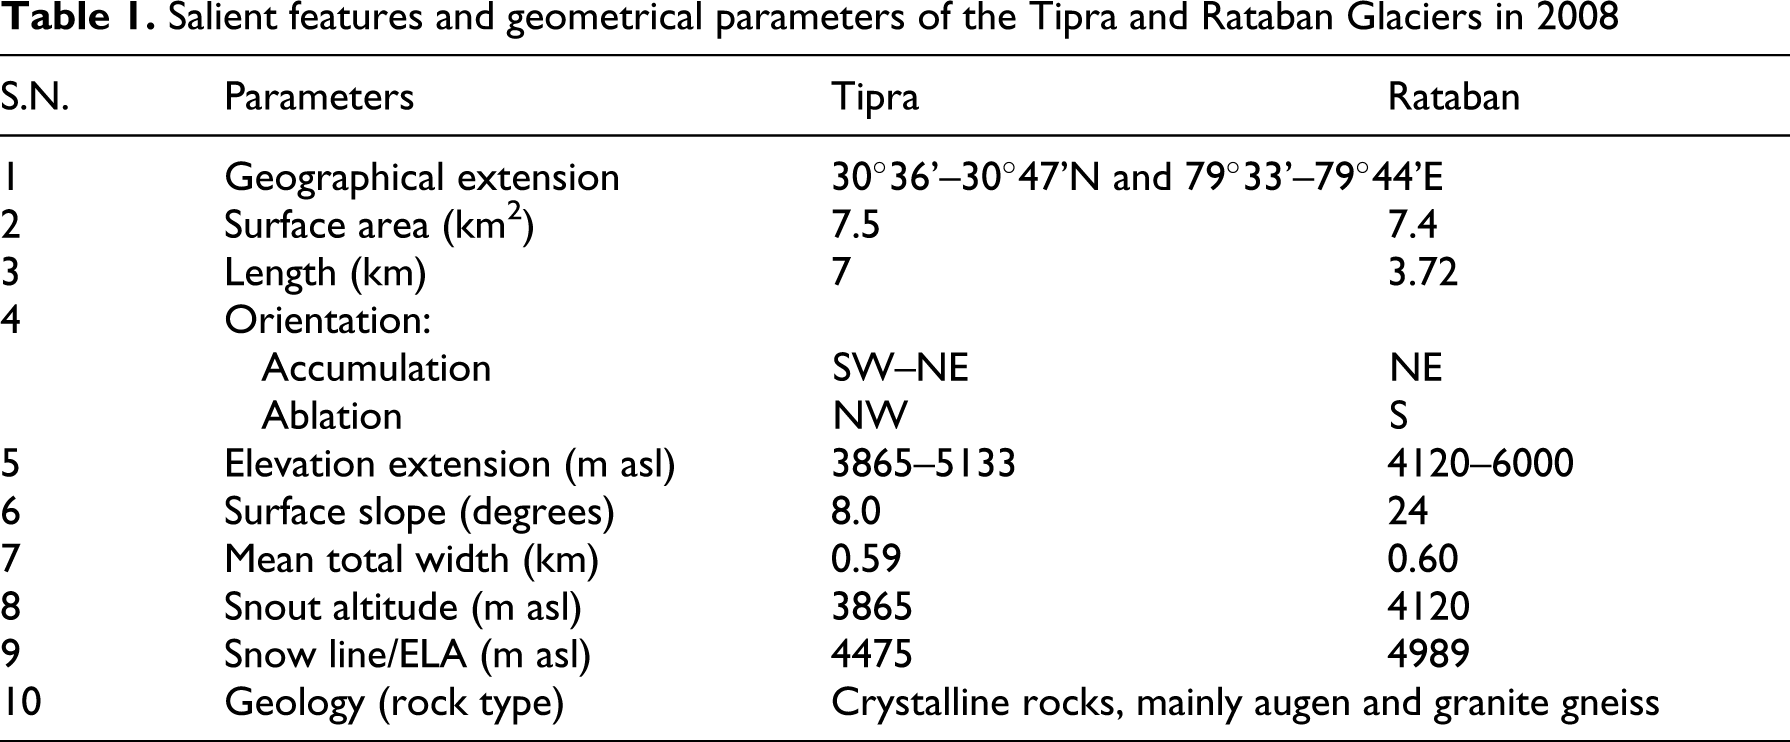
The Tipra Glacier (N 30°36’–30°47’; E 79°33’ –79°44’) is one of the largest of 16 glaciers in the Laxman Ganga catchment (Figure 1 ). The total glacierized area comprises about 19% of the total 195 km2 catchment area (Mehta, 2006). The glacier is a compound valley type formed by more than two cirques, originating on the southern slopes of Rataban peak (6128 m asl), Nilgiri Parvat (6479 m asl) and the northern slopes of Gauri Parvat (6601 m asl). At some stage in the past, the Rataban and Tipra Glaciers were joined at an altitude of 4000 m but now lie separated from each other (Figure 2 ). The total area of glacier catchment is 41 km2. The Rataban Glacier flows due south for 3.7 km to its terminus at an altitude of 4120 m. The Tipra Glacier flows northward for about 4.0 km and then swerves towards NW for 3 km before terminating at an altitude of 3865 m (Figure 1). The ablation area of the glacier is narrow, covered by thick debris with steep slopes. The accumulation zone is wider with steep to moderate slopes. The glacier is bounded by a well-preserved series of lateral moraines, indicating past extension of the glacier. In general, the glacier is situated in a well-defined valley and the ratio between the glacierized area and non-glacierized area is 0.37:1. Some of the salient features of the glacier are given in Table 1 .
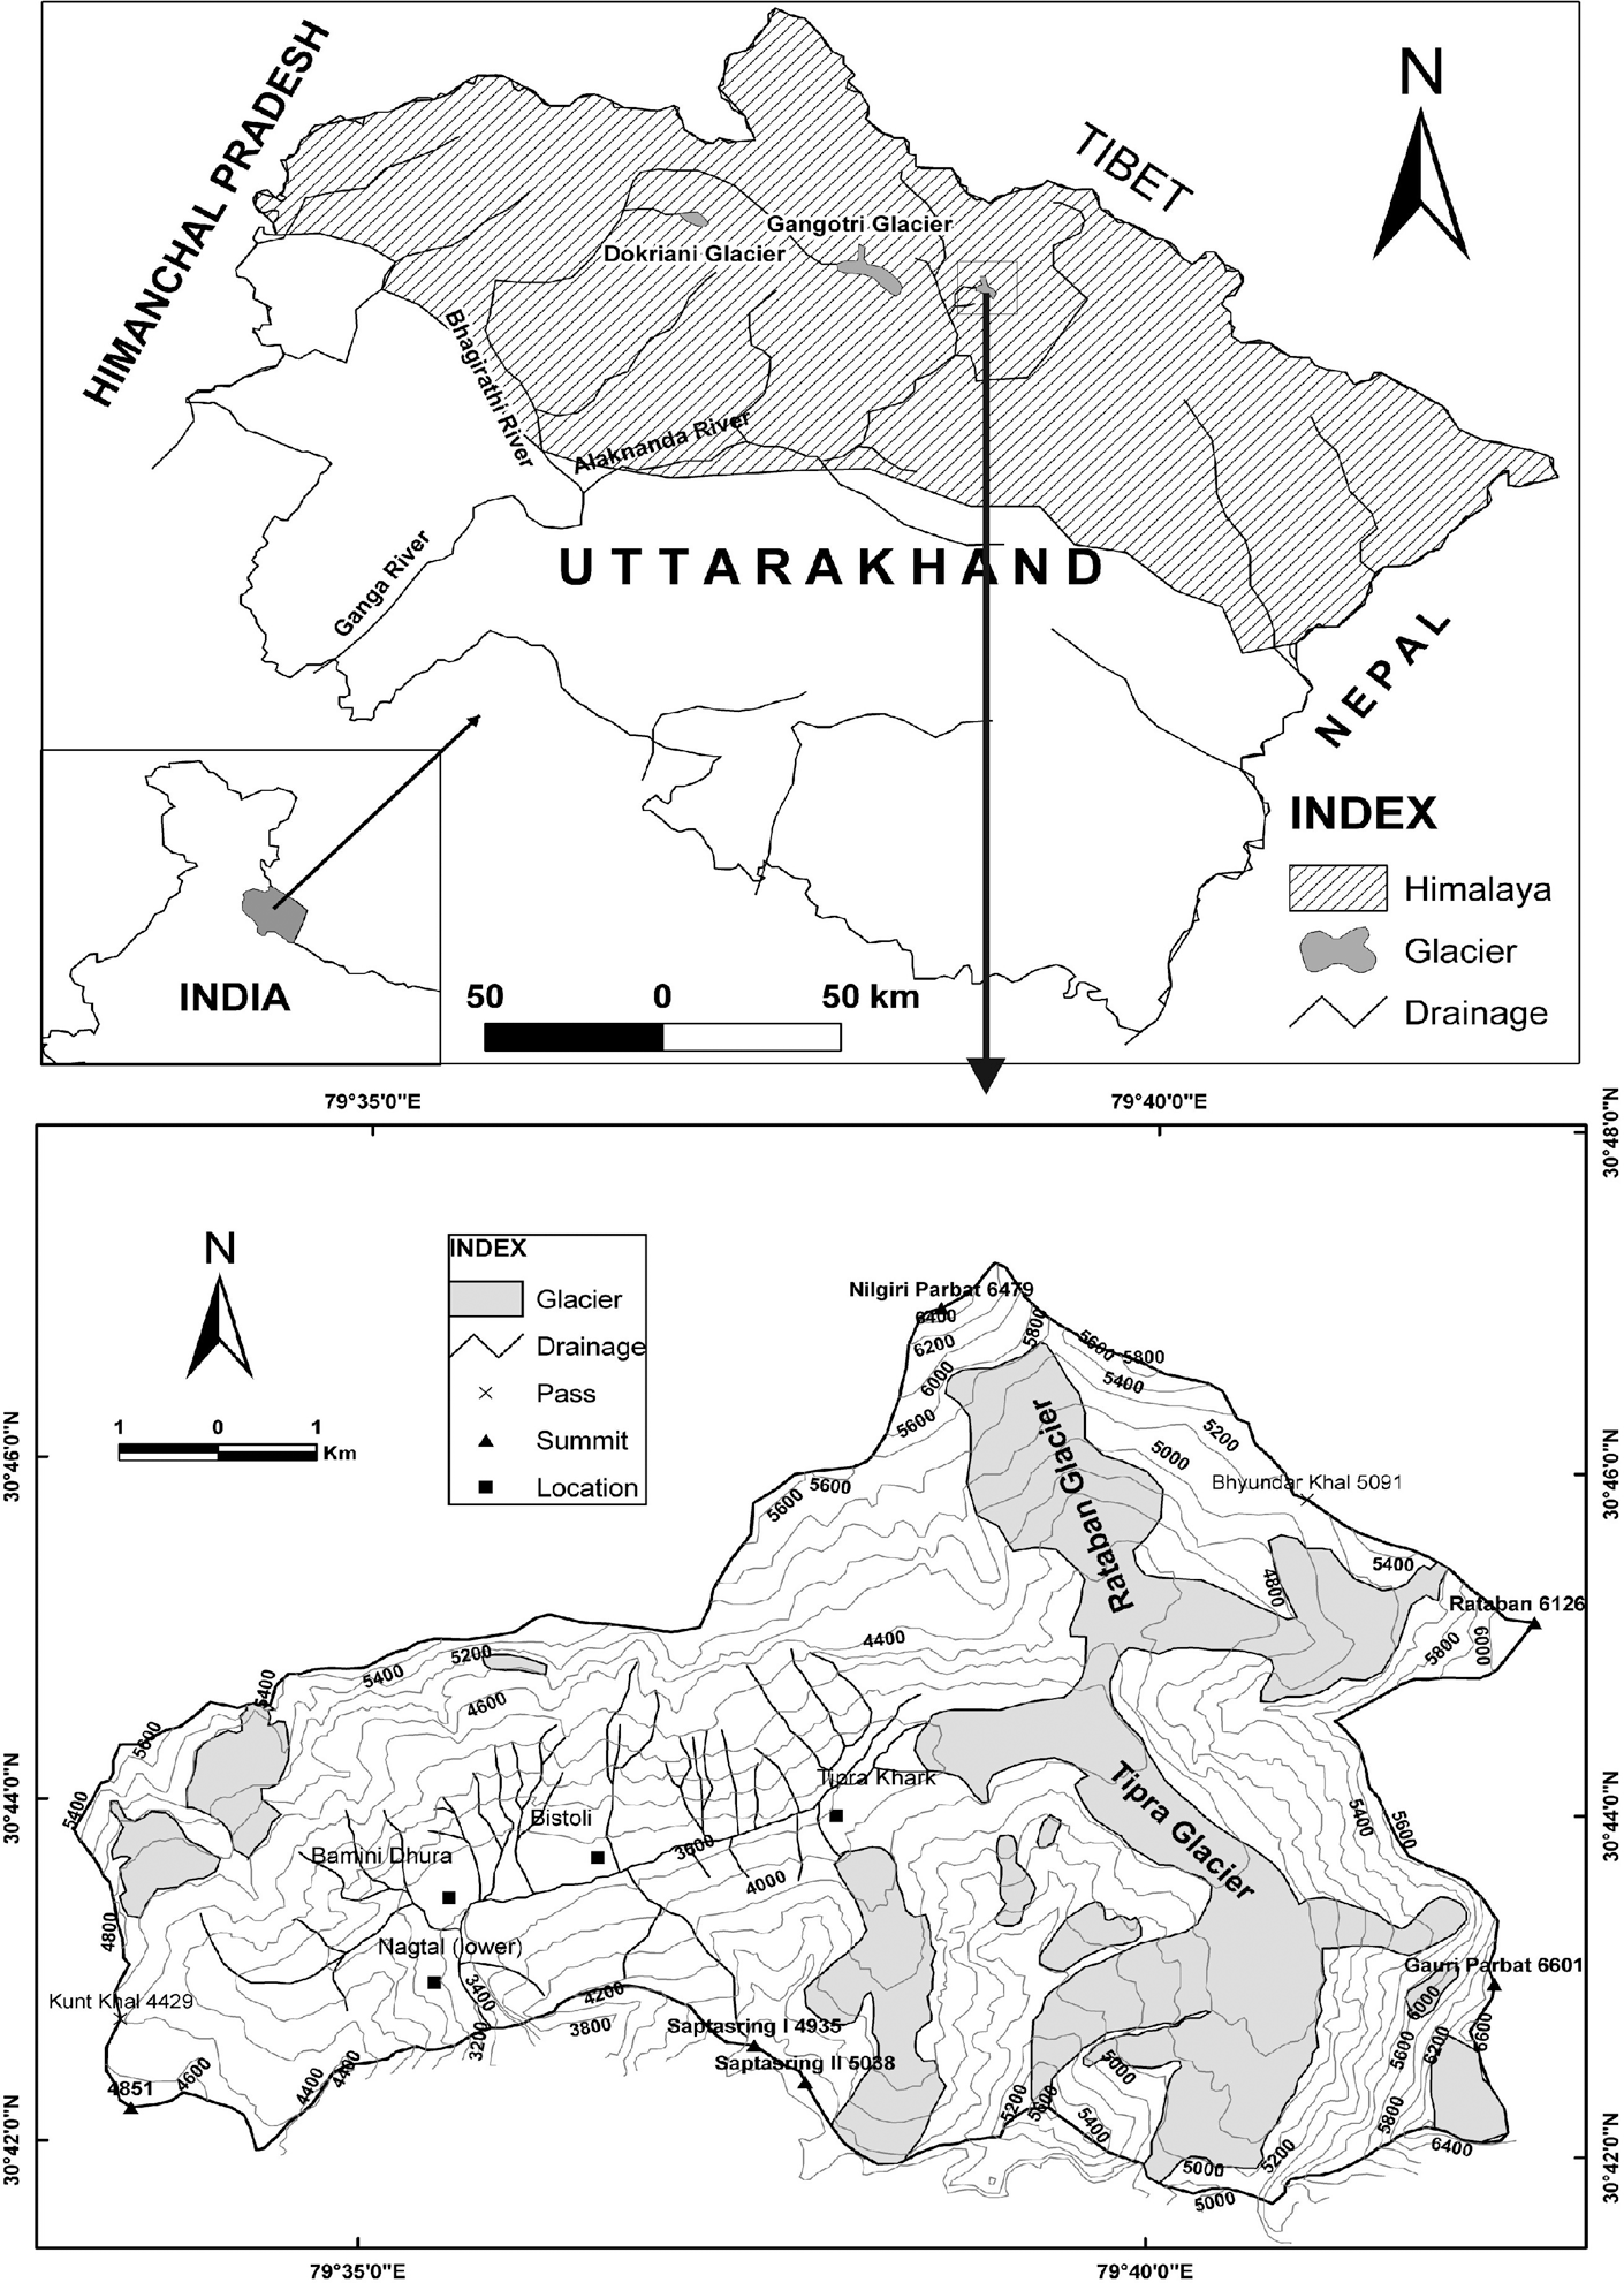
Location map of the study area; the shaded area indicates the boundary of the Tipra-Rataban and other small glaciers in the catchment area Source: Based on Survey of India Toposheet 1962
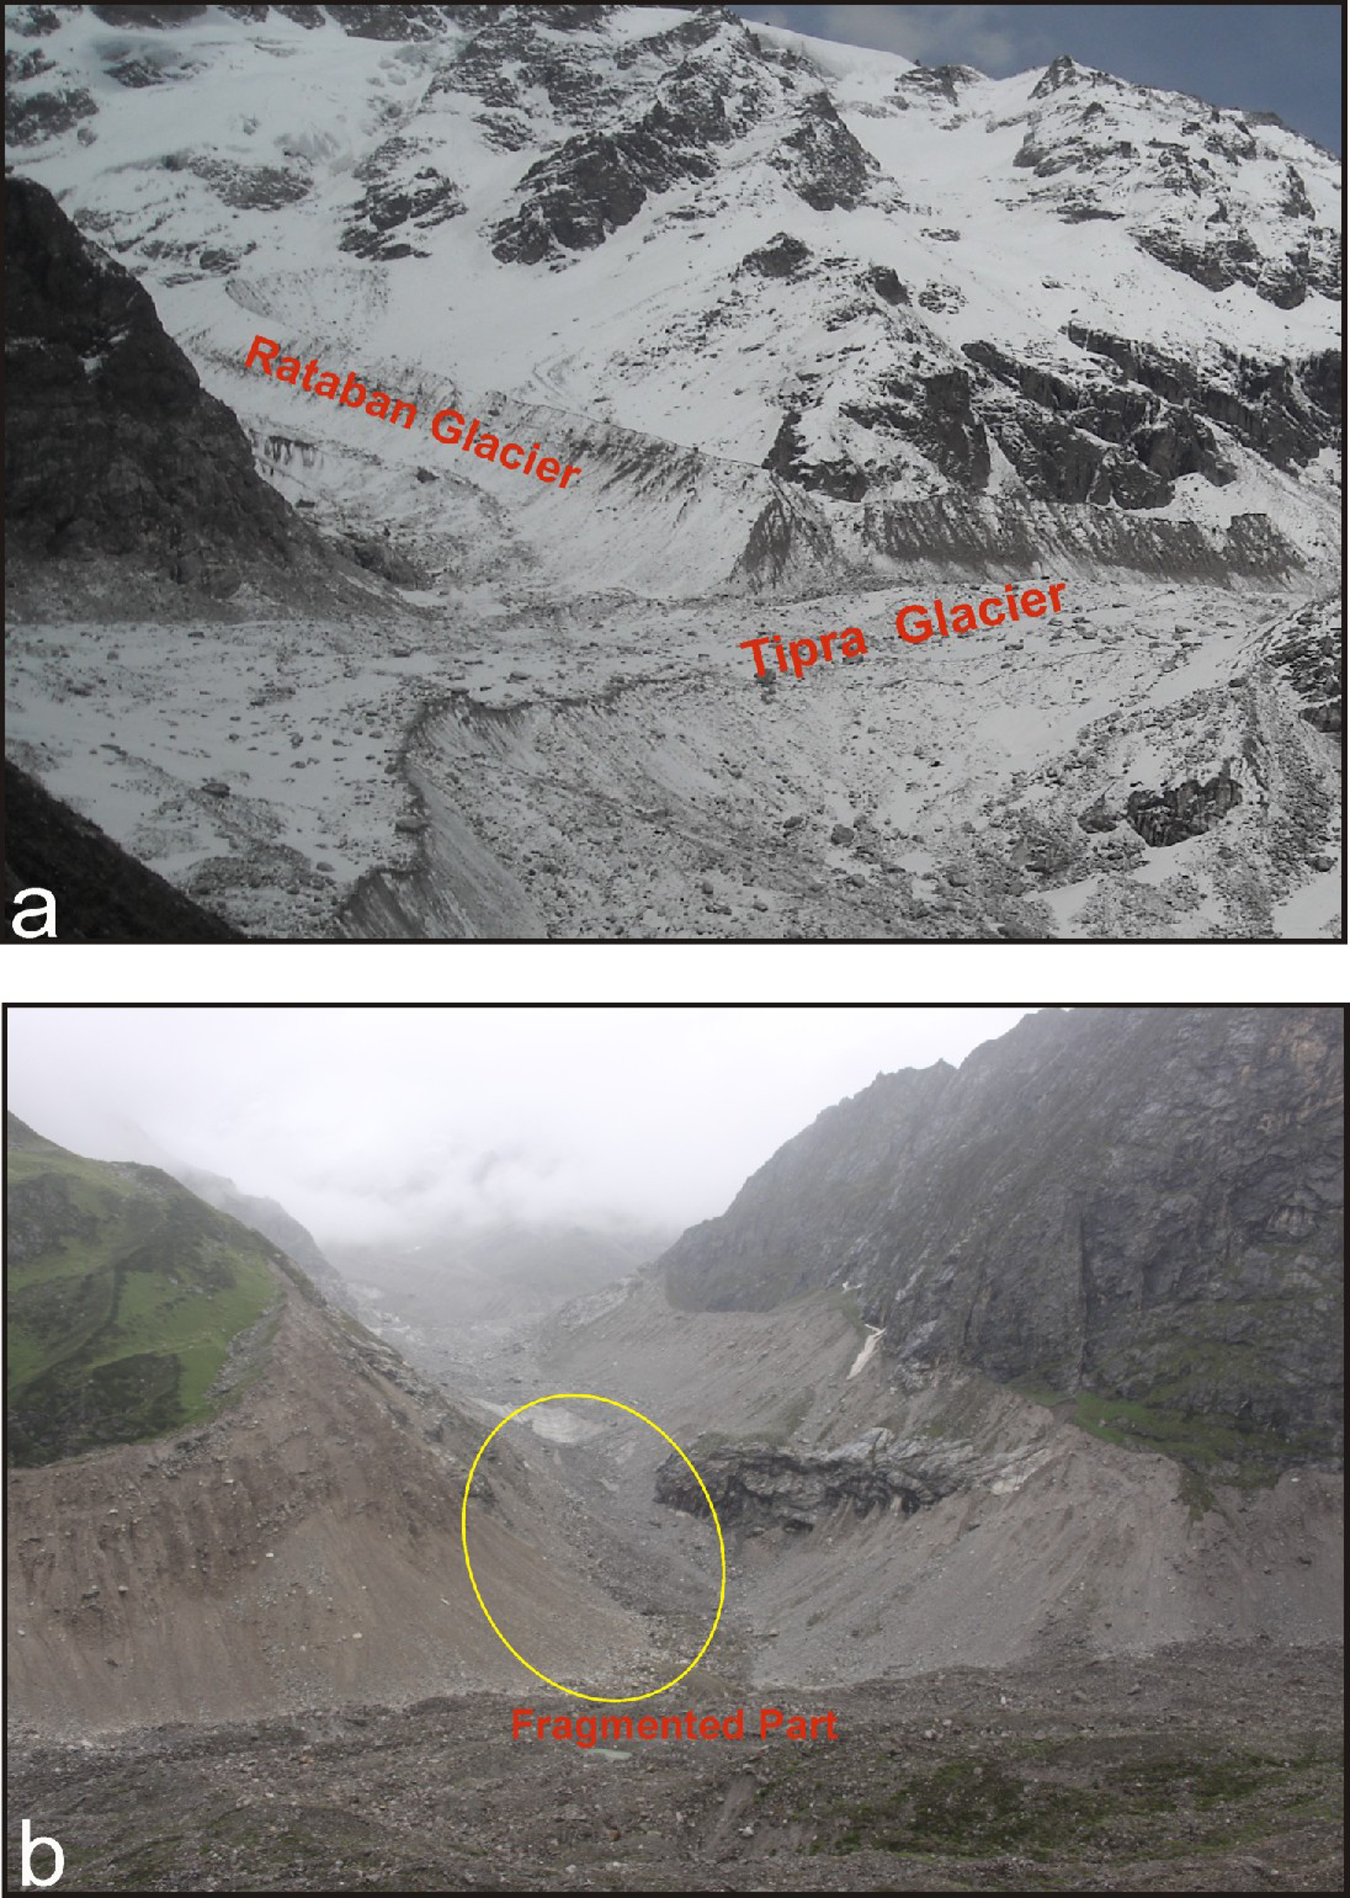
Field photograph showing (a) a view of the Tipra Glacier and (b) a close frontal view of the Rataban Glacier
Salient features and geometrical parameters of the Tipra and Rataban Glaciers in 2008
The area is dominated by monsoon precipitation in summer and winter precipitation from western disturbances (Dobhal et al., 1995; Owen et al., 1996). Vohra (1981) suggested that the Ganga basin experiences equal amounts of summer monsoon precipitation and winter westerly precipitation. Therefore, these glaciers are also called summer as well as winter accumulation type glaciers (Ageta and Higuchi, 1984; Vohra, 1981). Higuchi and Ohata (1996) suggest that, due to a continuous rise in air temperature in line with the global trend, it is possible that summer precipitation at higher altitudes will change from snow to rain and may influence the summer accumulation pattern. Such a change in precipitation pattern will have a pronounced effect on the mass balance of these glaciers and accelerate the shrinkage of glaciers even in the high altitudes.
The general climate of the study area is humid-temperate in summer and dry-humid cold in winter. There is little instrumental data available for weather parameters. During 1994–2000, a study carried on the Dokriani Glacier (3860 m asl), located in the vicinity of the present study area, showed that summer precipitation is highly influenced by the monsoon with an average annual precipitation of 1000–1300 mm (Thayyen et al., 2005b). Winter precipitation generally occurs between December and March when the western disturbances are dominant in the area as they move eastward over northern India. Maximum snowfall occurs during this period. There is no instrumental data on winter snowfall. However, a 75–150 cm thick snow pack was measured in snow pits and by probing snow pack at higher altitudes (4000–5000 m) in the early spring. In the lower altitudes (3800–4000 m), 25–50 cm snow depth was measured in the months April and May, which melts before the commencement of monsoon in mid-June (Dobhal et al., 2008). The ambient summer temperature fluctuated between 17 and –1°C (June–October) during the study period. Maximum monthly mean air temperature was recorded at 11.4°C in July 1998 and minimum 2.3°C in November 1999 (Thayyen et al., 2005a). It is quite likely that weather conditions in the nearby Tipra Glacier will be analogous to the Dokriani Glacier.
III Methodology
1 Glacier length and area change
Data sets used for investigation were: (1) Survey of India Toposheet of the year 1962 at the scale of 1:50,000 with a contour interval of 40 m; (2), snout position map for 1987 (Gautam and Mukherjee, 1989); (3) satellite data from LISS III, 2002; and (4) field surveys in the years 2002–2008. Preliminary information on glacier boundaries, snout position and other features was drawn from these maps and a base map along with glacier geometry was constructed. The glacier was remapped using LISS III image data from 2002 along with field verification (Figure 3 ). The techniques and interpretation methodology follow those of Kulkarni et al. (2007) and Paul et al. (2001). The glacier boundary was delineated from a topographic map digitized using Arc GIS 9.1 software and a Digital Elevation Model (DEM) at 40 m resolution was constructed. With the help of these maps (1962, 1987 and 2002) the snout positions and surface area changes were determined. Since 2002, the snout position and frontal area vacation has been monitored by field survey. Three permanent reference stations were fixed near the frontal area of the glacier snout on stable ground. The geographical position of each reference station was determined by GPS (Magellan, Pro Mark-X, with accuracy 1–3 m in altitude and 0.01’ in position) and values obtained were transferred to the map. With the help of these fixed stable stations the snouts of the Tipra and Rataban Glaciers were mapped by GPS (fixed date measurement). To maximize the accuracy and consistency of the changes in snout position, it is important to map the whole of the glacier snout every year because the retreat of the snout is not uniform. Accordingly, several point measurements were taken all around the terminus area as well as the central and both the side axes of the glacier.
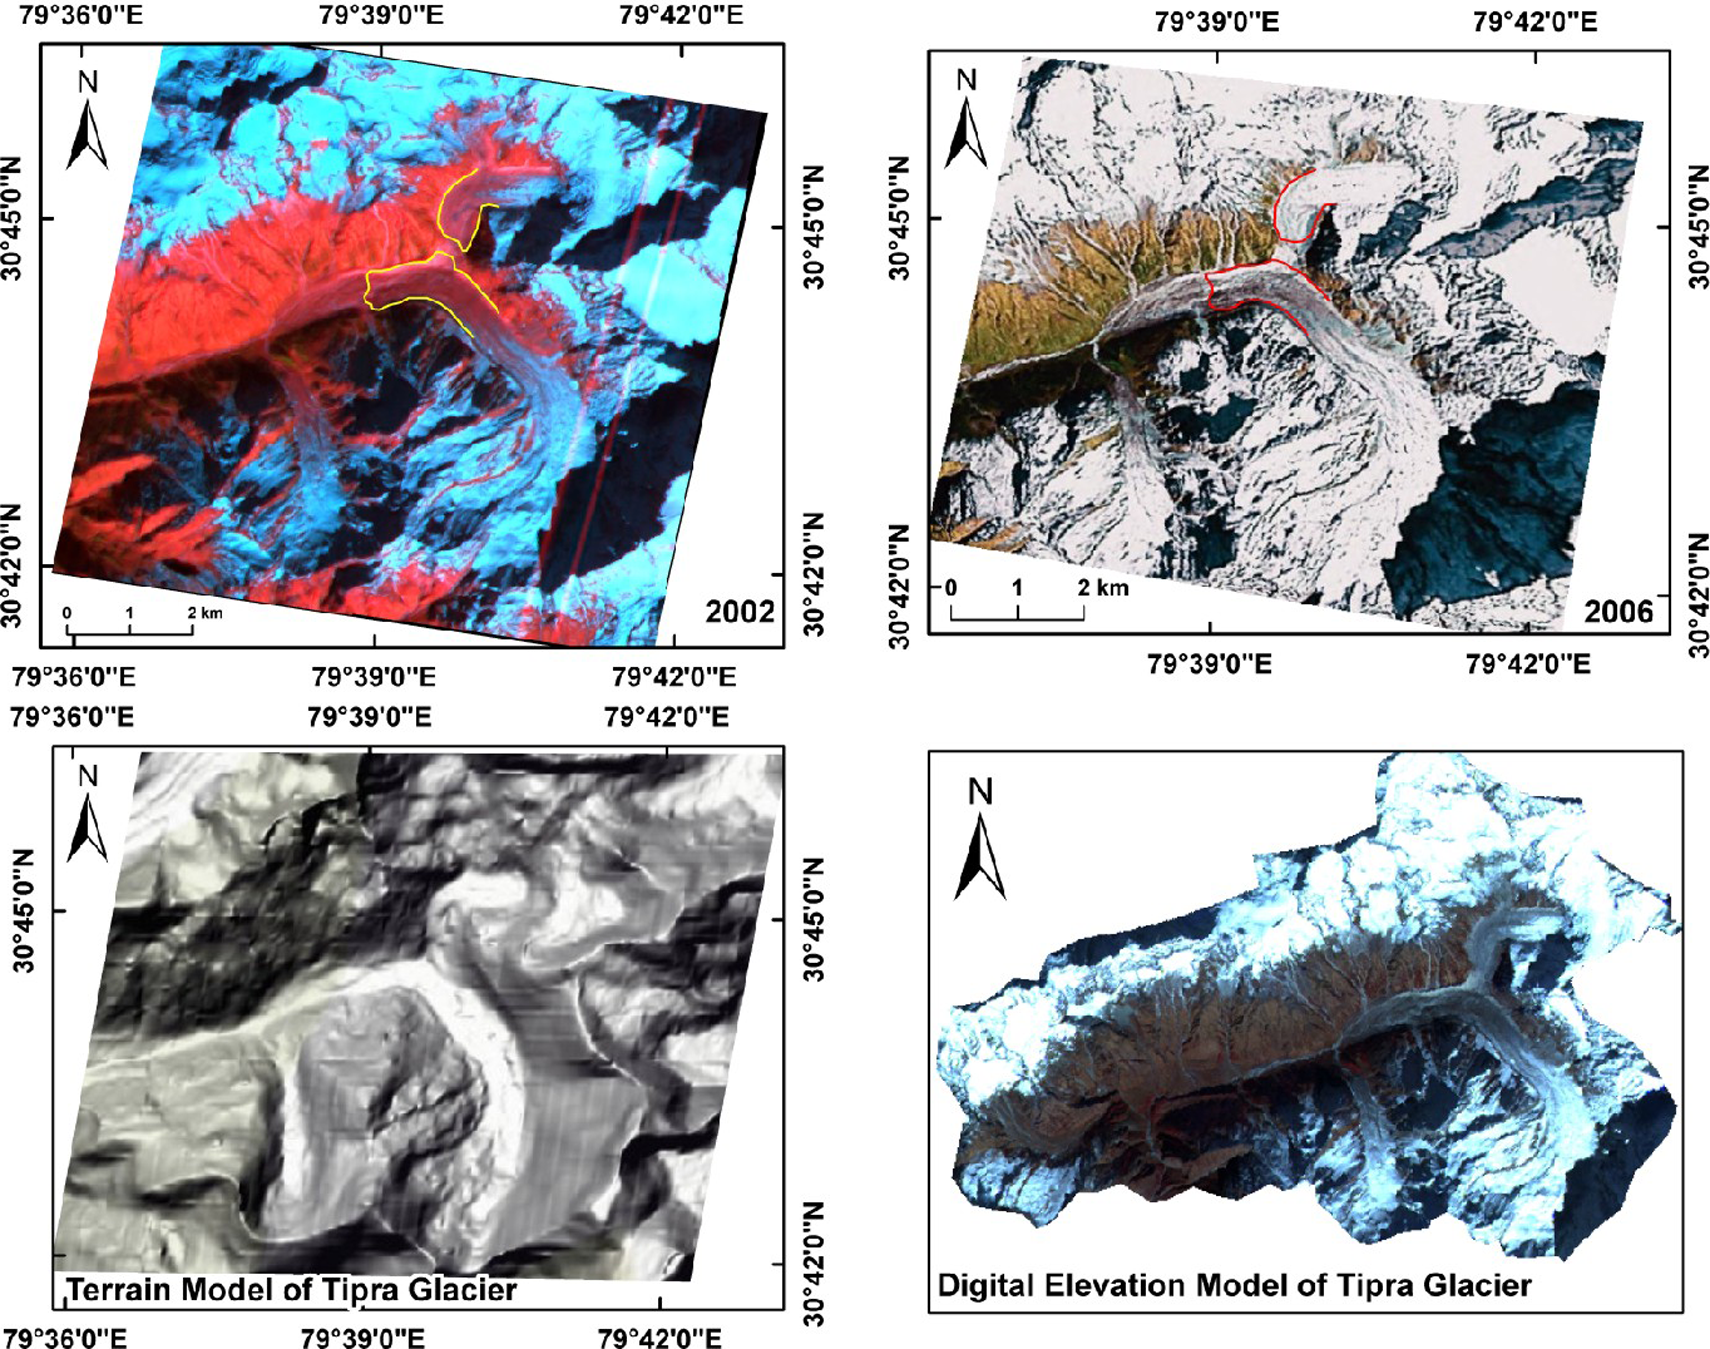
Satellite imagery from the LISS III sensor, showing the glacier boundary of the Tipra Glacier in 2002 and 2006 (above), and the Terrain Model and DEM (below) of the Tipra Glacier catchment. The image shows the detachment of the Rataban Glacier from the main trunk (Tipra Glacier).
2 Equilibrium Line Altitude (ELA) estimation
The mass balance of glaciers in the Garhwal Himalaya is controlled by aspect, terrain characteristics, geographical position and the climatic conditions. The areal extent of the glacier and the ELA was established using Survey of India Toposheet (1:50,000) and satellite imagery. The ELA is the dividing line between accumulation and ablation area, where the annual accumulation equals the annual ablation (bn = 0). ELA is very sensitive to climate and provides a useful link between glacier health and climate. The difference in altitude between present and past ELAs (ΔELA) has been widely used to estimate climate change (Benn and Lehmkuhl, 2000, Benn et al., 2005; Bryan and Geoffrey, 2005; Kaser and Osmaston, 2002; Porter, 2001; Sharma and Owen, 1996). The methods commonly used to reconstruct the past ELA are: (1) Area Accumulation Ratio (AAR); (2) Toe to Headwall Altitude Ratio (THAR); (3) Maximum Elevation of Lateral Moraine (MELM); and (4) Area Weighted Method (AWM). Such techniques were used to estimate ELA fluctuations for the Tipra and Rataban Glaciers during the period 1962–2008. These methods are sensitive to debris cover and, as a result, a wide range of ratios are used (Benn and Lehmkuhl, 2000; Benn et al., 2005; Clark et al., 1994). In general, the glaciers with thick debris cover have lower AAR compared to clean ice glaciers for which an AAR of 0.65 is usually applied (Benn and Lehmkuhl, 2000; Scherler et al., 2010). Recent glaciological studies on the Indian Himalayan glaciers suggest zero net mass balance AAR of about 0.73 for less debris-covered glaciers, and ELA fluctuations between 4800 m and 5000 m asl (Dobhal et al., 2008; Wagnon et al., 2007). Zero net mass balance of debris-covered glaciers in the Himalayan region had AAR of about 0.45 and ELA of about 5100 m to 5150 m (Kulkarni, 1992). The mass balance of the debris-covered Chorabari Glacier shows negative values and the present AAR of the glacier is 0.45. Hence, AARs of 0.45 and 0.55 were used here for estimating the paleo ELA for the Tipra and Rataban Glaciers.
The THAR method has been used previously by Meierding (1982), Porter (2001) and Torsnes et al. (1993). It employs the difference in elevation between the terminus of glacier and head wall so as to approximate the location of ELA. Charlesworth (1957) and Manley (1959) used the median elevation of glacier (MEG) which places the ELA midway between the glacier toe and the base of the head wall. This is equivalent to a toe to head wall altitude ratio (THAR) of 0.5. Subsequently, many workers have used alternative THAR value (Andrews, 1975; Meierding, 1982; Pewe and Reger, 1972) with ratios <0.5, which gives ELA below the median elevation. THARs = 0.35–0.4 have been used by Meierding (1982) for glaciers in Colorado, whereas a value of 0.4–0.5 has been used for clean ice glacier by Porter et al. (1983). Clark et al. (1994) found that debris-covered glaciers in California have rather high THAR (0.6–0.8) due to the effects of debris cover. In this study, THARs of 0.5–0.7 were used to estimate the ELA. This method is very generalized as it takes no account of glacier hypsometry or mass balance. In addition, defining the effective upper limit of the glacier can be problematic or impossible in some cases. Other methods used to determine the ELA of glacier are Area Weighted Mean (x = AiHi/Ai, where Ai is area in km2, Hi is midpoint contour interval) and Maximum Elevation of Lateral Moraine (MELM) adopted by Porter (2001), Sharma and Owen (1996) and Sissons (1974).
IV Results
1 Snout retreat
The snout retreat of the Tipra Glacier was measured and computed during the period of investigation (Figure 4 ). The total recession of the Tipra Glacier between 1962 and 2002 was estimated at ~535 m with an average rate of 13.4 m a−1. Field measurements carried out in 2006 and 2008 show that the glacier had retreated 83 m and 45 m during the period 2002–2006 and 2006–2008, respectively. Based on the recession data, the annual retreat trends can be grouped into two time intervals: (1) from 1962 to 2002 the rate is estimated to be 13.4 m a−1; and (2) from 2002 to 2008 the retreat rate is estimated to be 21.3 m a−1. This can be considered as the present rate of retreat (Figures 4 and 5 ). The 663 m cumulative reduction of glacier length reveals that the Tipra Glacier has lost ~10% of total length during the last 46 years.
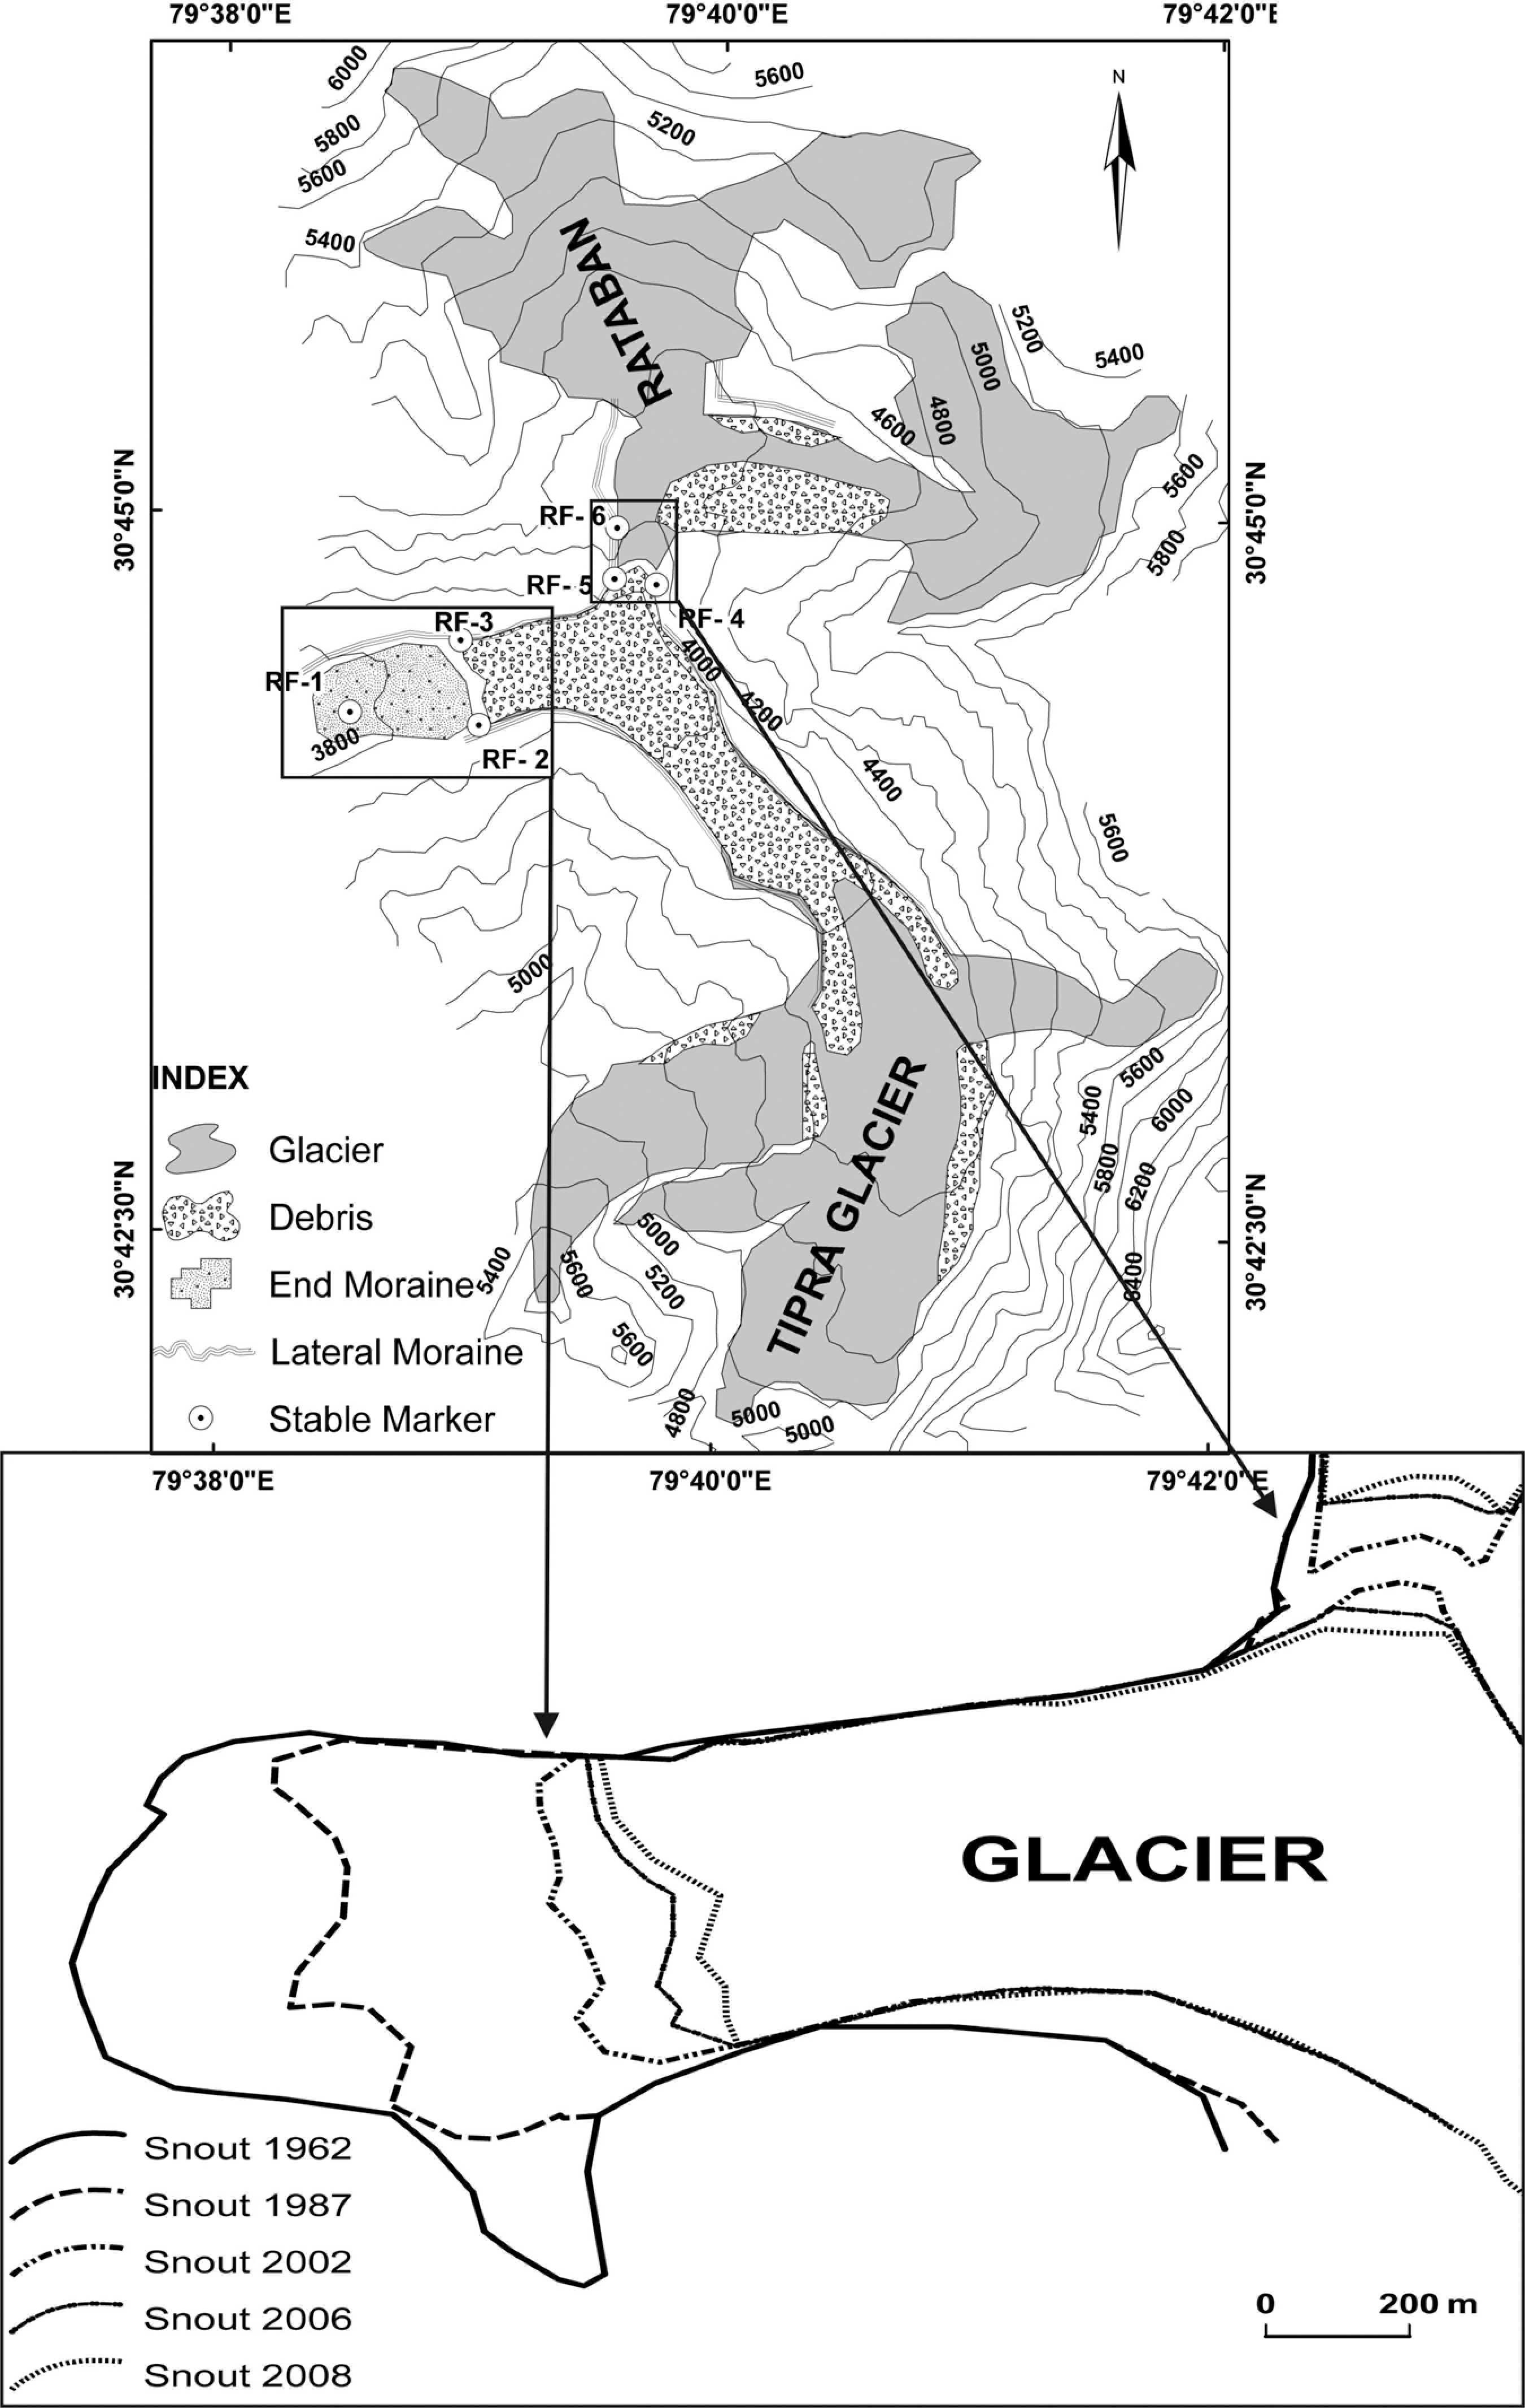
Surface morphological map of the Tipra and Rataban Glaciers, along with stable survey marker, showing snout positions during the period 1962–2008
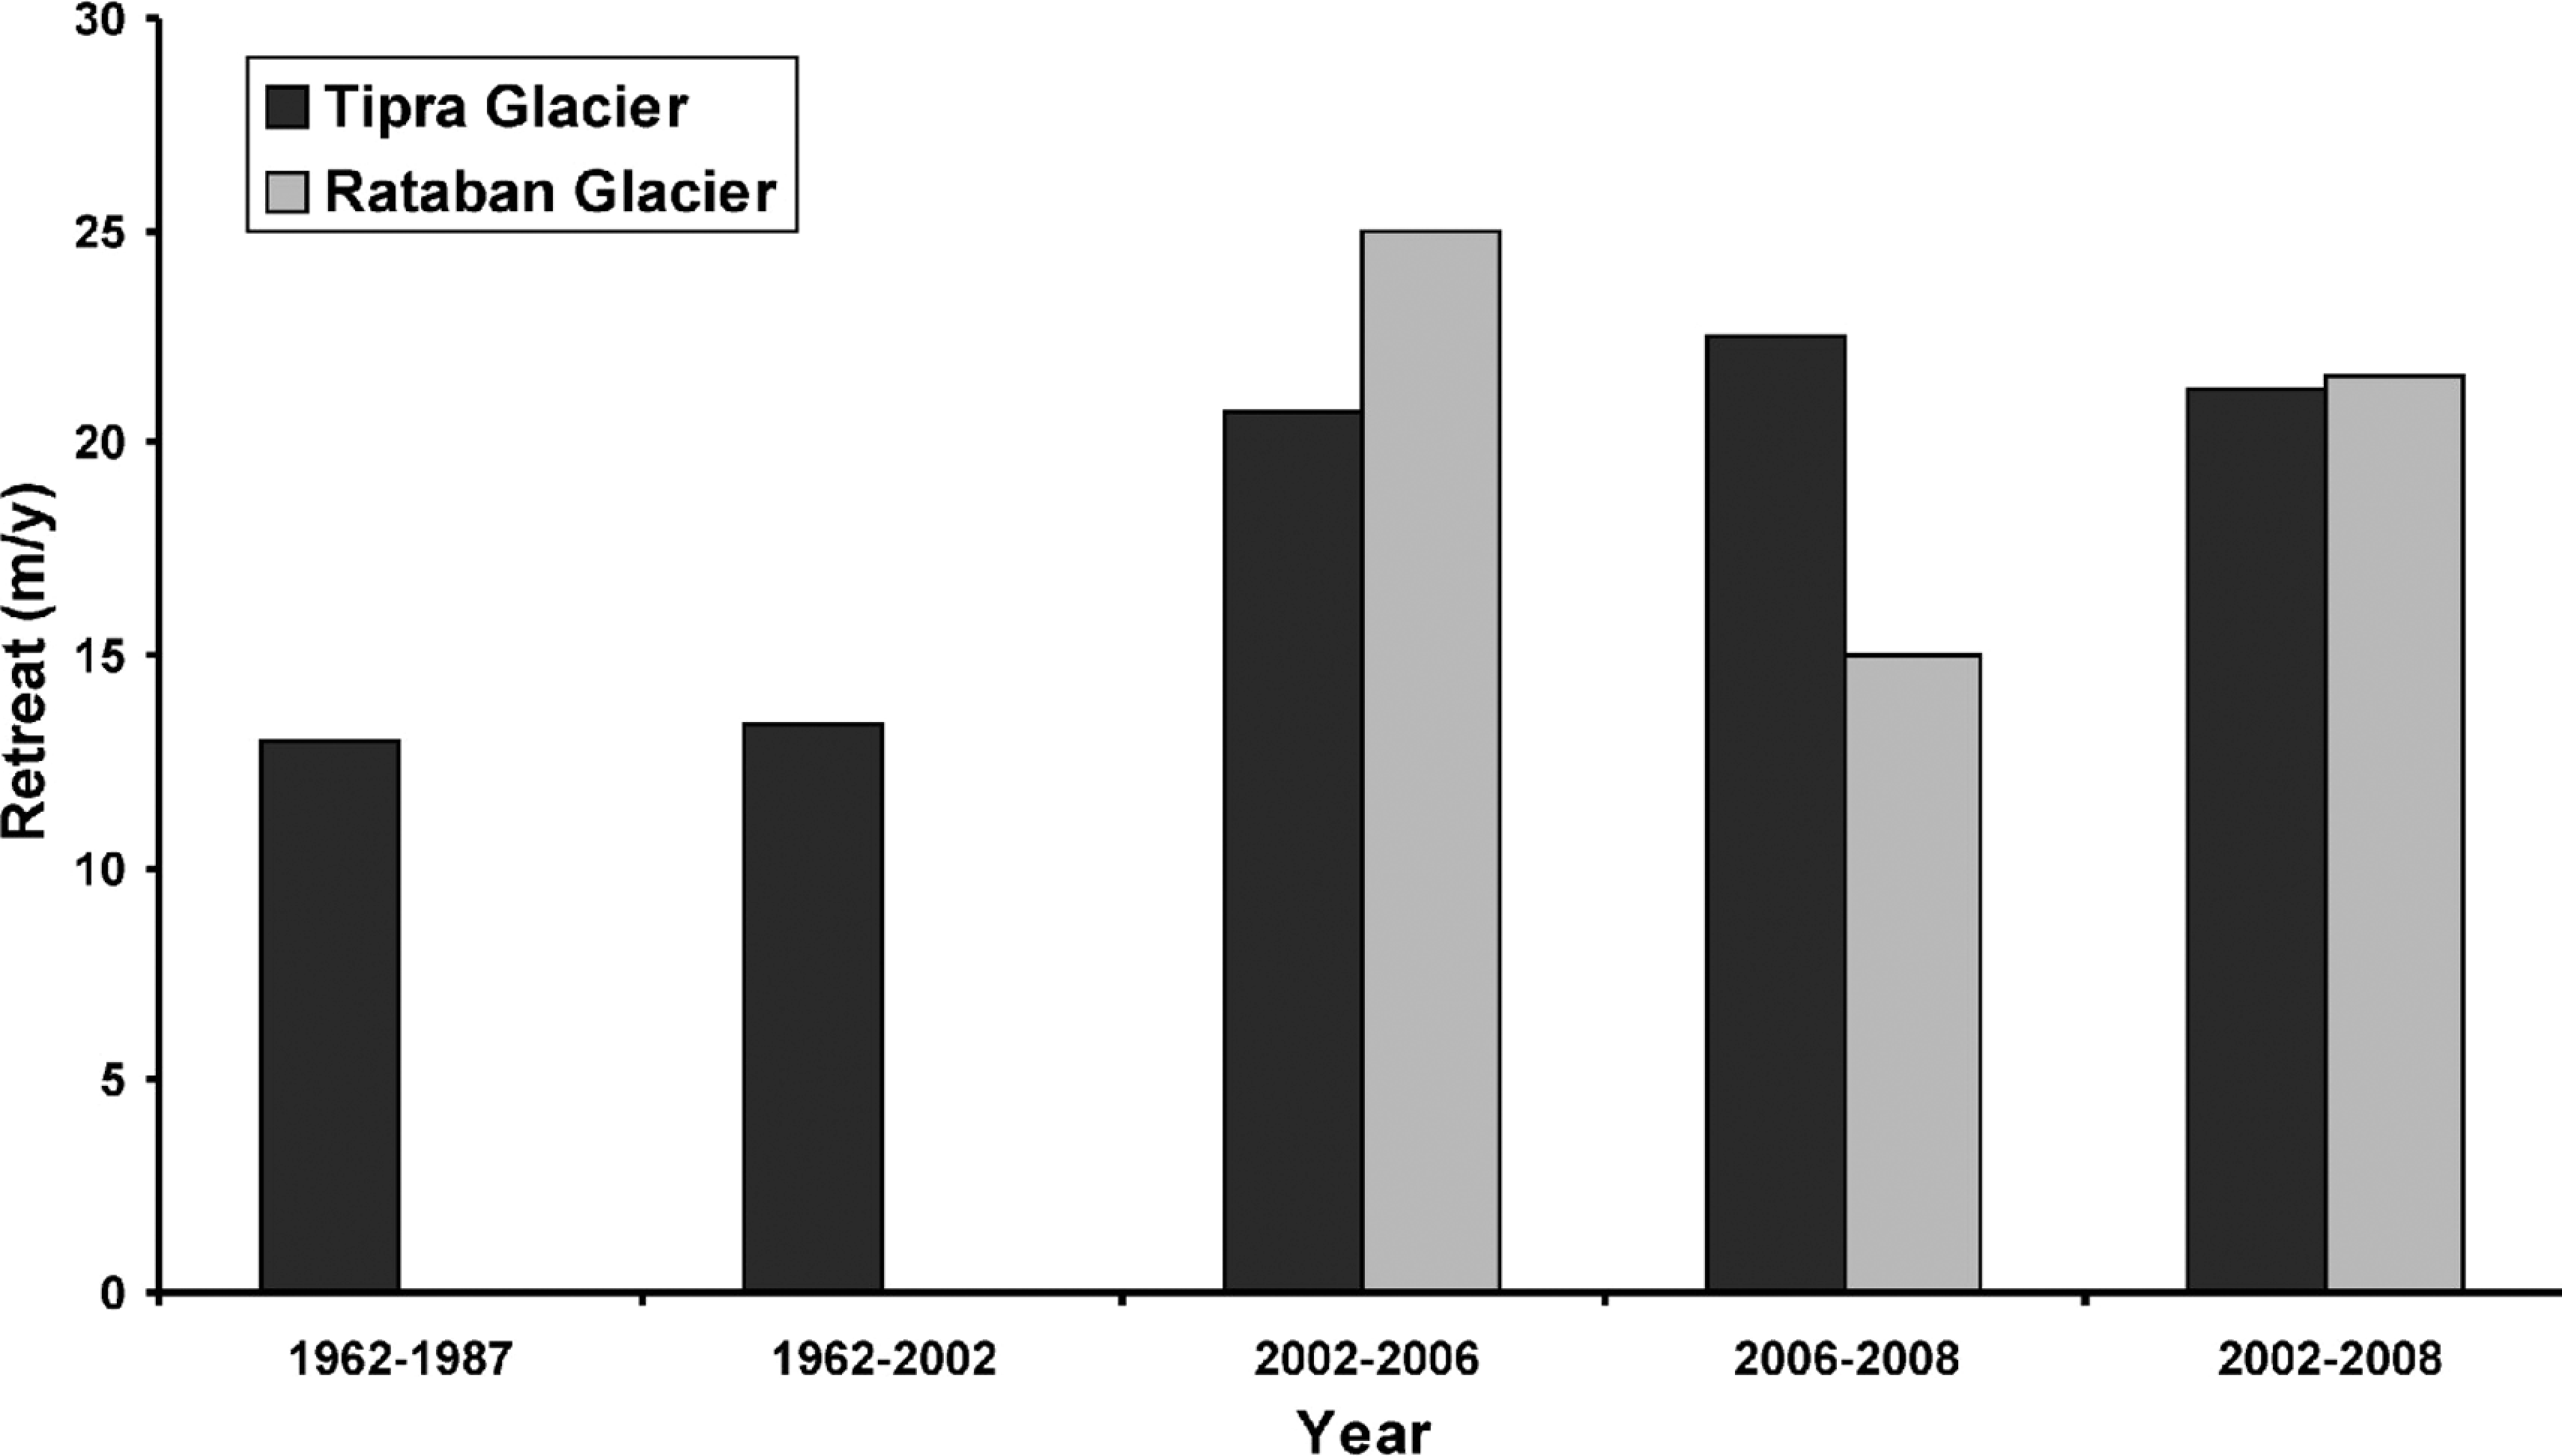
Bar diagram representing the retreat rate of the glacier snout during different time intervals (1962–2008)
In 2002, a field visit revealed that the Rataban, a tributary of the Tipra Glacier, was detached from its trunk, whereas studies carried out for the period 1962–1987 showed that the Rataban Glacier was a part of Tipra Glacier (Gautam and Mukherjee, 1989). It is estimated that until 2002 the Rataban had receded 150 m after being detached from the main trunk. Between 2002 and 2008, it receded 130 m with an average rate of 21.2 m a−1 (Figure 4) and reduced in length by about 8%.
Glacier length changes were also assessed with respect to the elevation of the glacier snout. Although the snout positions of the Tipra and Rataban Glaciers are located at altitudes of 3865 m and 4120 m, respectively, there is no significant difference in their recession rates. This suggests that the bed rock, slope and debris cover also play an important role on the glacier retreat process. The Rataban Glacier has less debris and greater surface slope than that of the Tipra Glacier (Table 1). During the course of our observations, no advance has been recorded: the glaciers show a continuous recession trend for the observation period (1962–2008). The gradual recession of the glacier snouts may be a consequence of global warming.
2 Area vacated
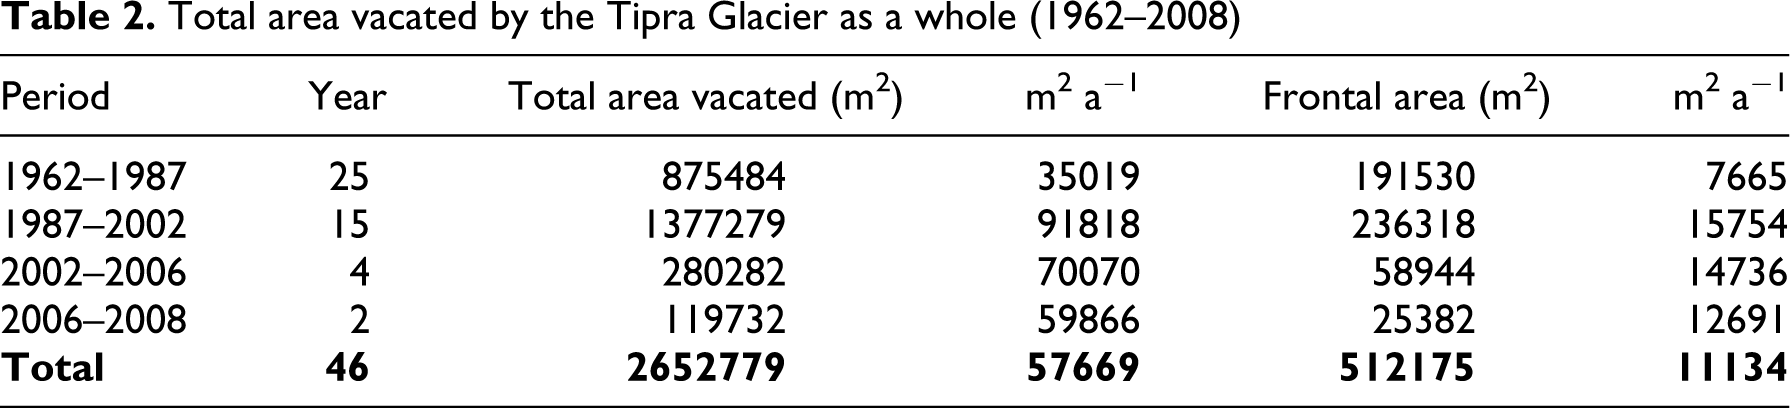
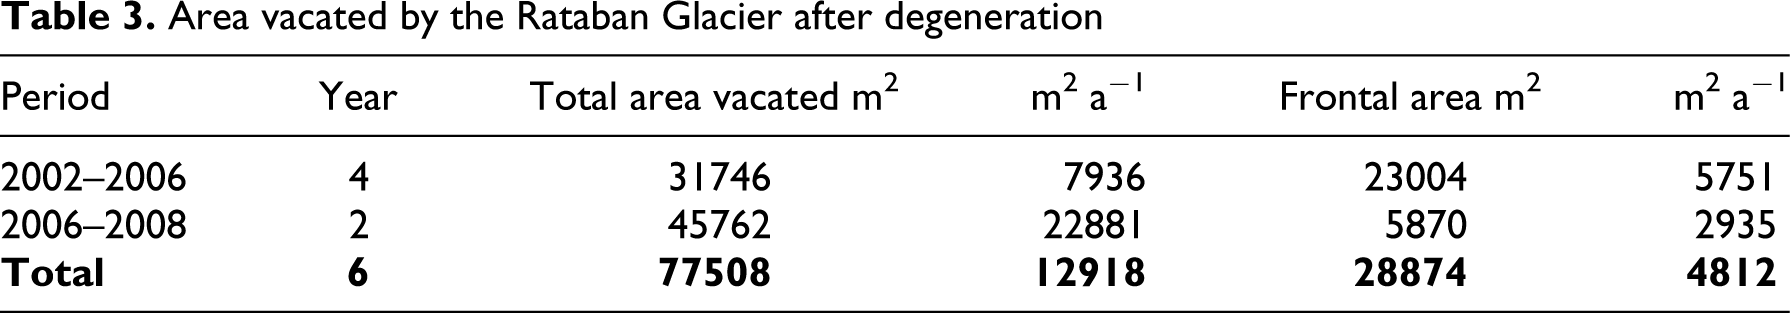
The area vacated by the glacier due to recession is computed by superimposing the earlier map (1962) on the recent map (2008) using geo data based on Arc GIS 9.1 (Tables 2 and 3 ; Figure 6 ). The total area vacated by the glacier over the period was 2.73 km2, of which 0.54 km2 was due to frontal recession, and the remaining 2.16 km2 vacated by adjoining areas of the glaciated region. The average rate of total area vacated was 0.059 km2 a−1. A similar study (Gautam and Mukherjee, 1989) of frontal area recession from 1962 to 1987 showed that the glacier had vacated an area of 0.19 km2 at an average rate of 0.007 km2 a−1. During 2002–2008, the frontal areas of the Tipra and Rataban Glaciers vacated 0.084 km2 (0.014 km2 a−1) and 0.028 km2 (0.006 km2 a−1), respectively, which obviously reflects a higher rate of recession for the period. The area vacated by the glacier in its proglacial region during each measurement period is given in Tables 2 and 3.
Total area vacated by the Tipra Glacier as a whole (1962–2008)
Area vacated by the Rataban Glacier after degeneration
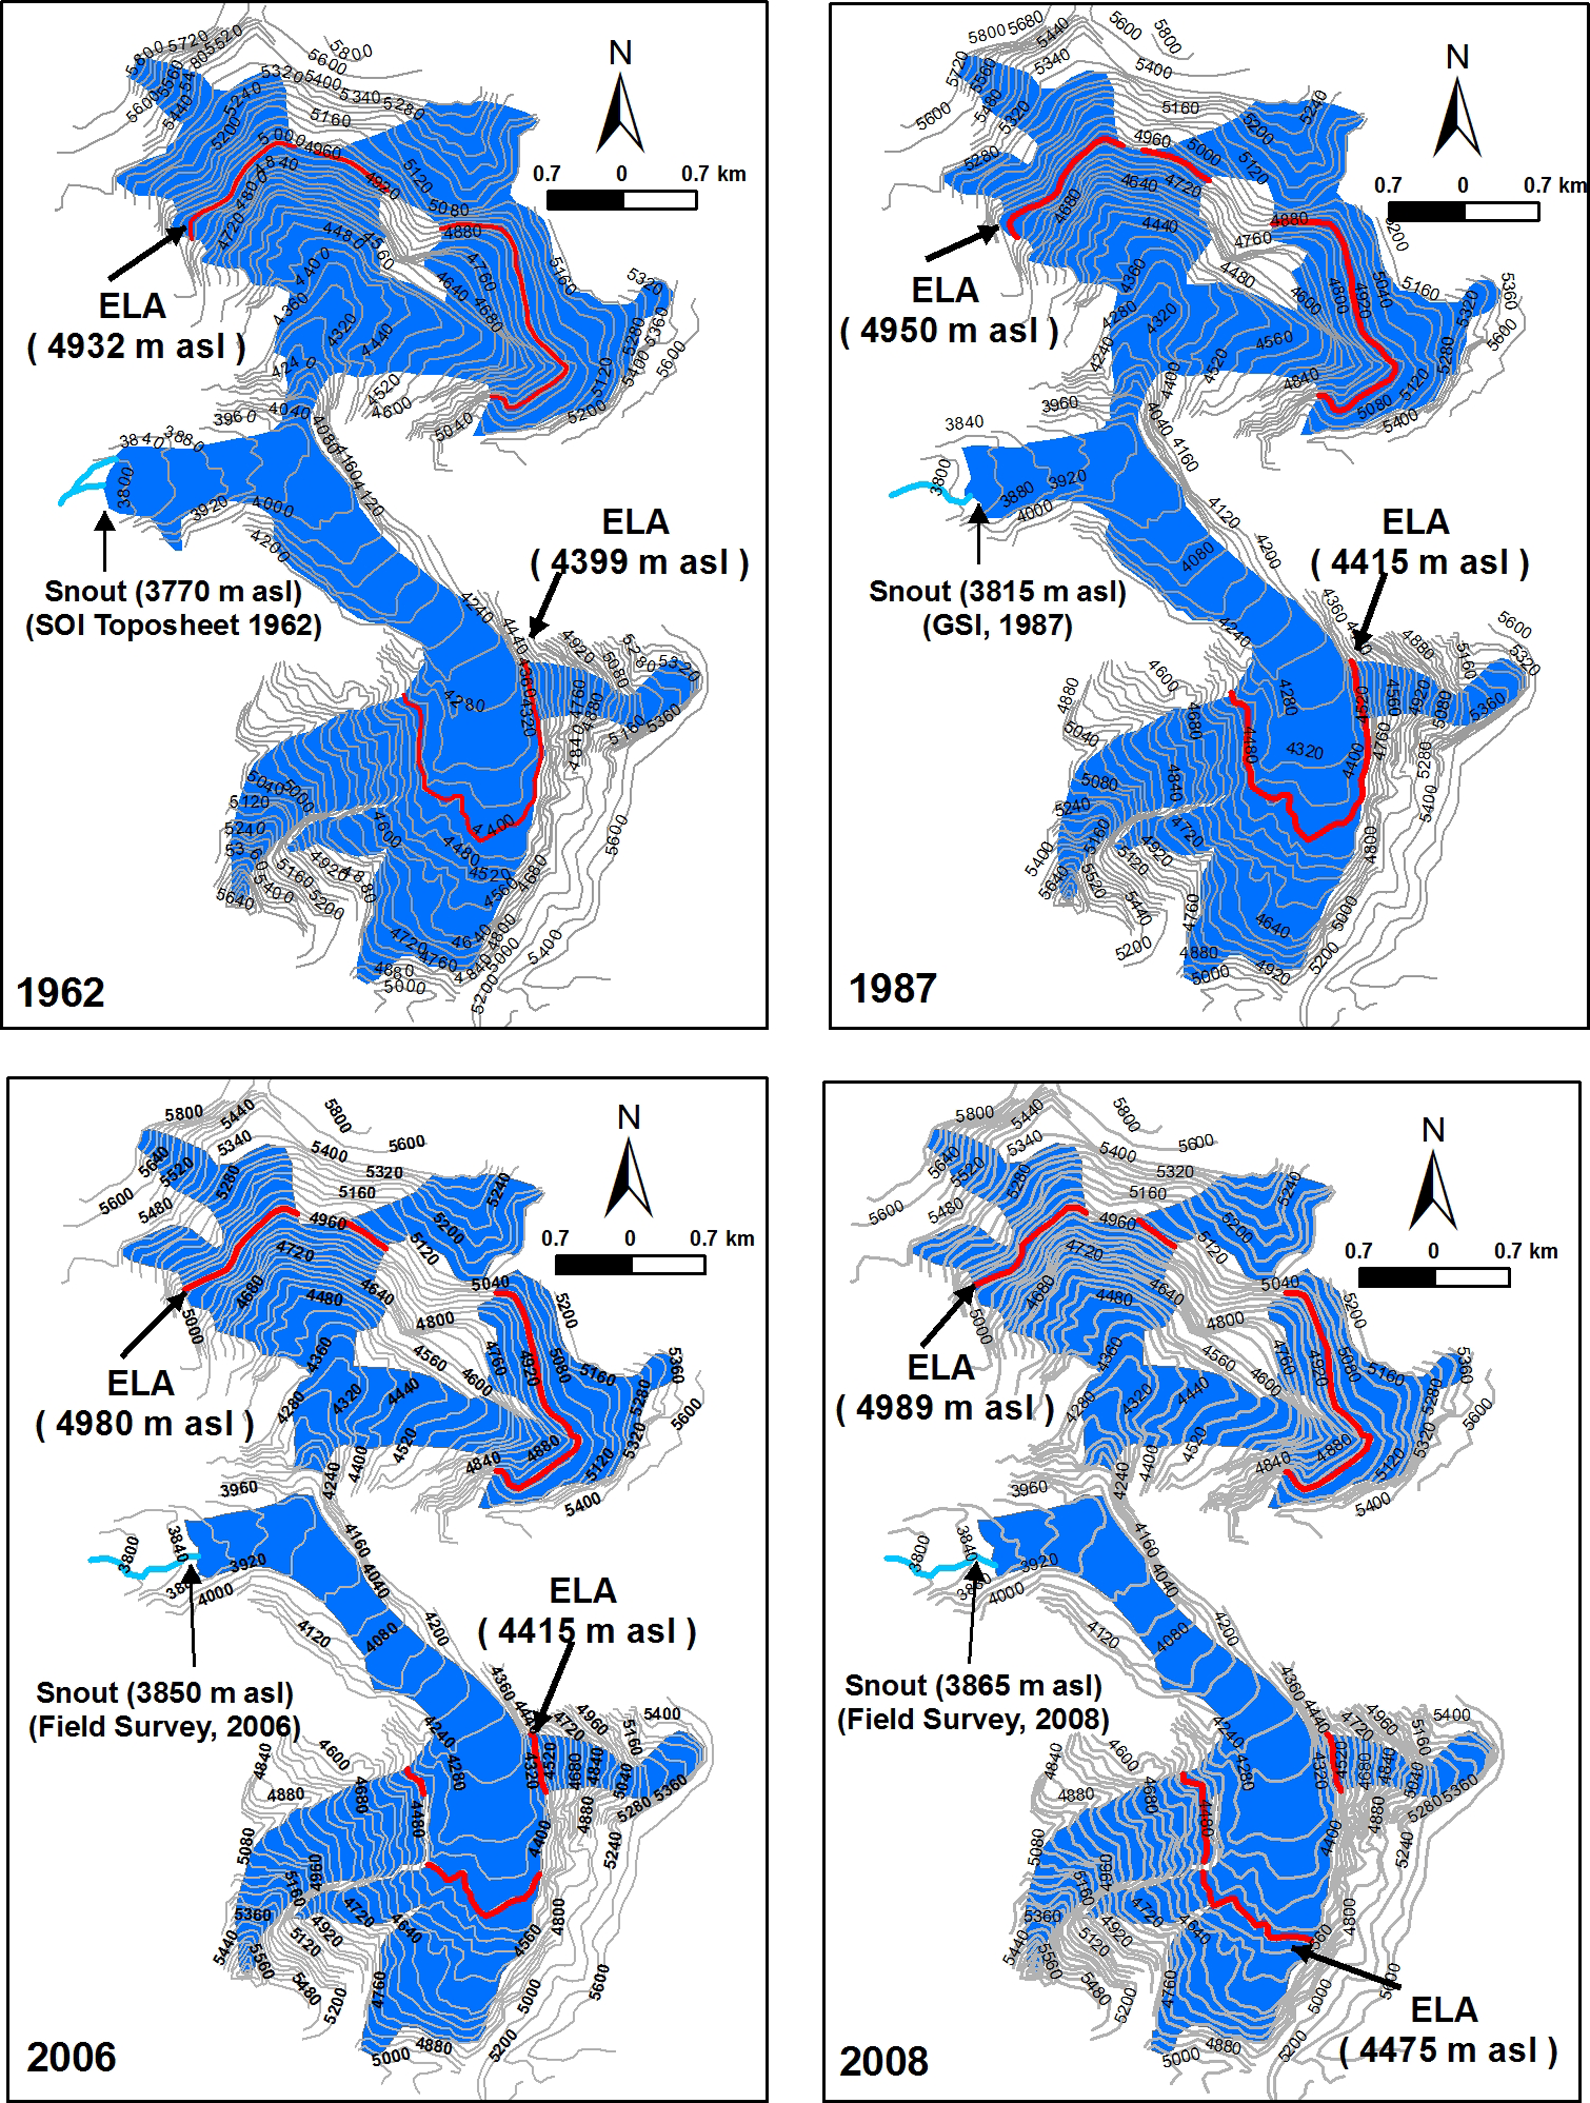
Maps of total areal extension with frontal boundaries in 1962, 1987, 2006 and 2008 of the Tipra Glacier. It is to be noted that the Rataban Glacier on the north side of the valley became detached from the main trunk glacier sometime between 1987 and 2006.
3 Equilibrium Line Altitude (ELA) and Accumulation Area Ratio (AAR) changes
The ELA is very sensitive to climate and provides a useful link between glacier health and climate. The difference in altitude between modern and former ELAs (ΔELA) has been widely used to estimate climate change (Benn and Lehmkuhl, 2000; Bryan and Geoffrey, 2005; Sharma and Owen, 1996). The ELA for the Himalaya glaciers varies with topographic and climatic conditions. It fluctuates between 4000 and 4600 m asl in the northwest Himalaya and 5200–5800 m in the Everest region. In the northwestern Garhwal Himalaya at present, it ranges between 4500 and 5400 m asl (Sharma and Owen, 1996).
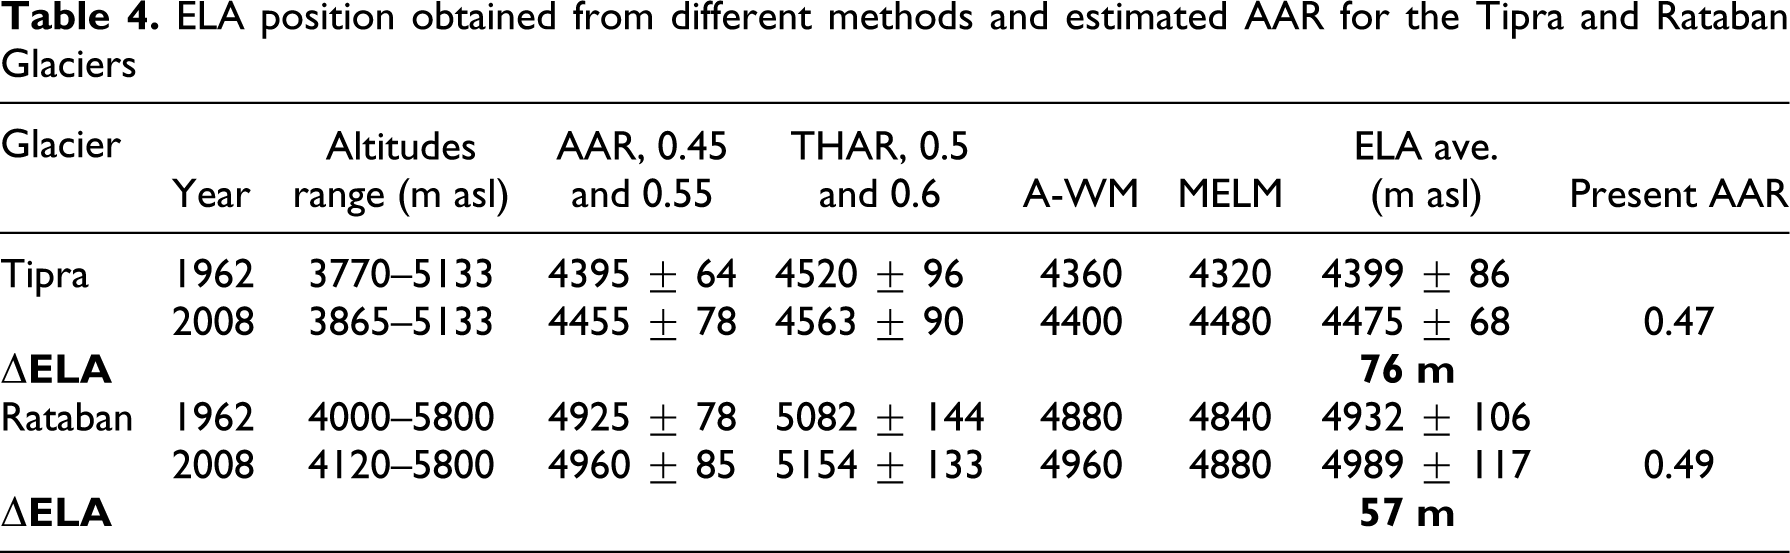
We used four methods to calculate the contemporary ELA of the Tipra and Rataban Glaciers. Using AAR (0.45 and 0.55), the ELA of the Tipra and Rataban Glaciers are 4455 and 4960 m asl, respectively. The ELAs are 4563 m asl for the Tipra Glacier and 5154 m asl for the Rataban Glacier using the THAR (0.5 and 0.6) method and the AWM method giving the ELAs of 4400 m asl for the Tipra Glacier and 4980 m asl for the Rataban Glacier. We used the average of AAR (0.45 and 0.55), THAR (0.5 and 0.6), AWM and MELM method for estimating modern ELAs and used 1σ for error. This yields an ELAs estimate of 4475±68 and 4989±117 m asl for the Tipra and Rataban Glaciers, respectively (Table 4 and Figure 7 ). There were distinct differences between ELAs on the Tipra and Rataban Glaciers. The ELA of the Tipra Glacier has been lower than the Rataban Glacier; such differences are explained by either climate or topographic effects.
ELA position obtained from different methods and estimated AAR for the Tipra and Rataban Glaciers
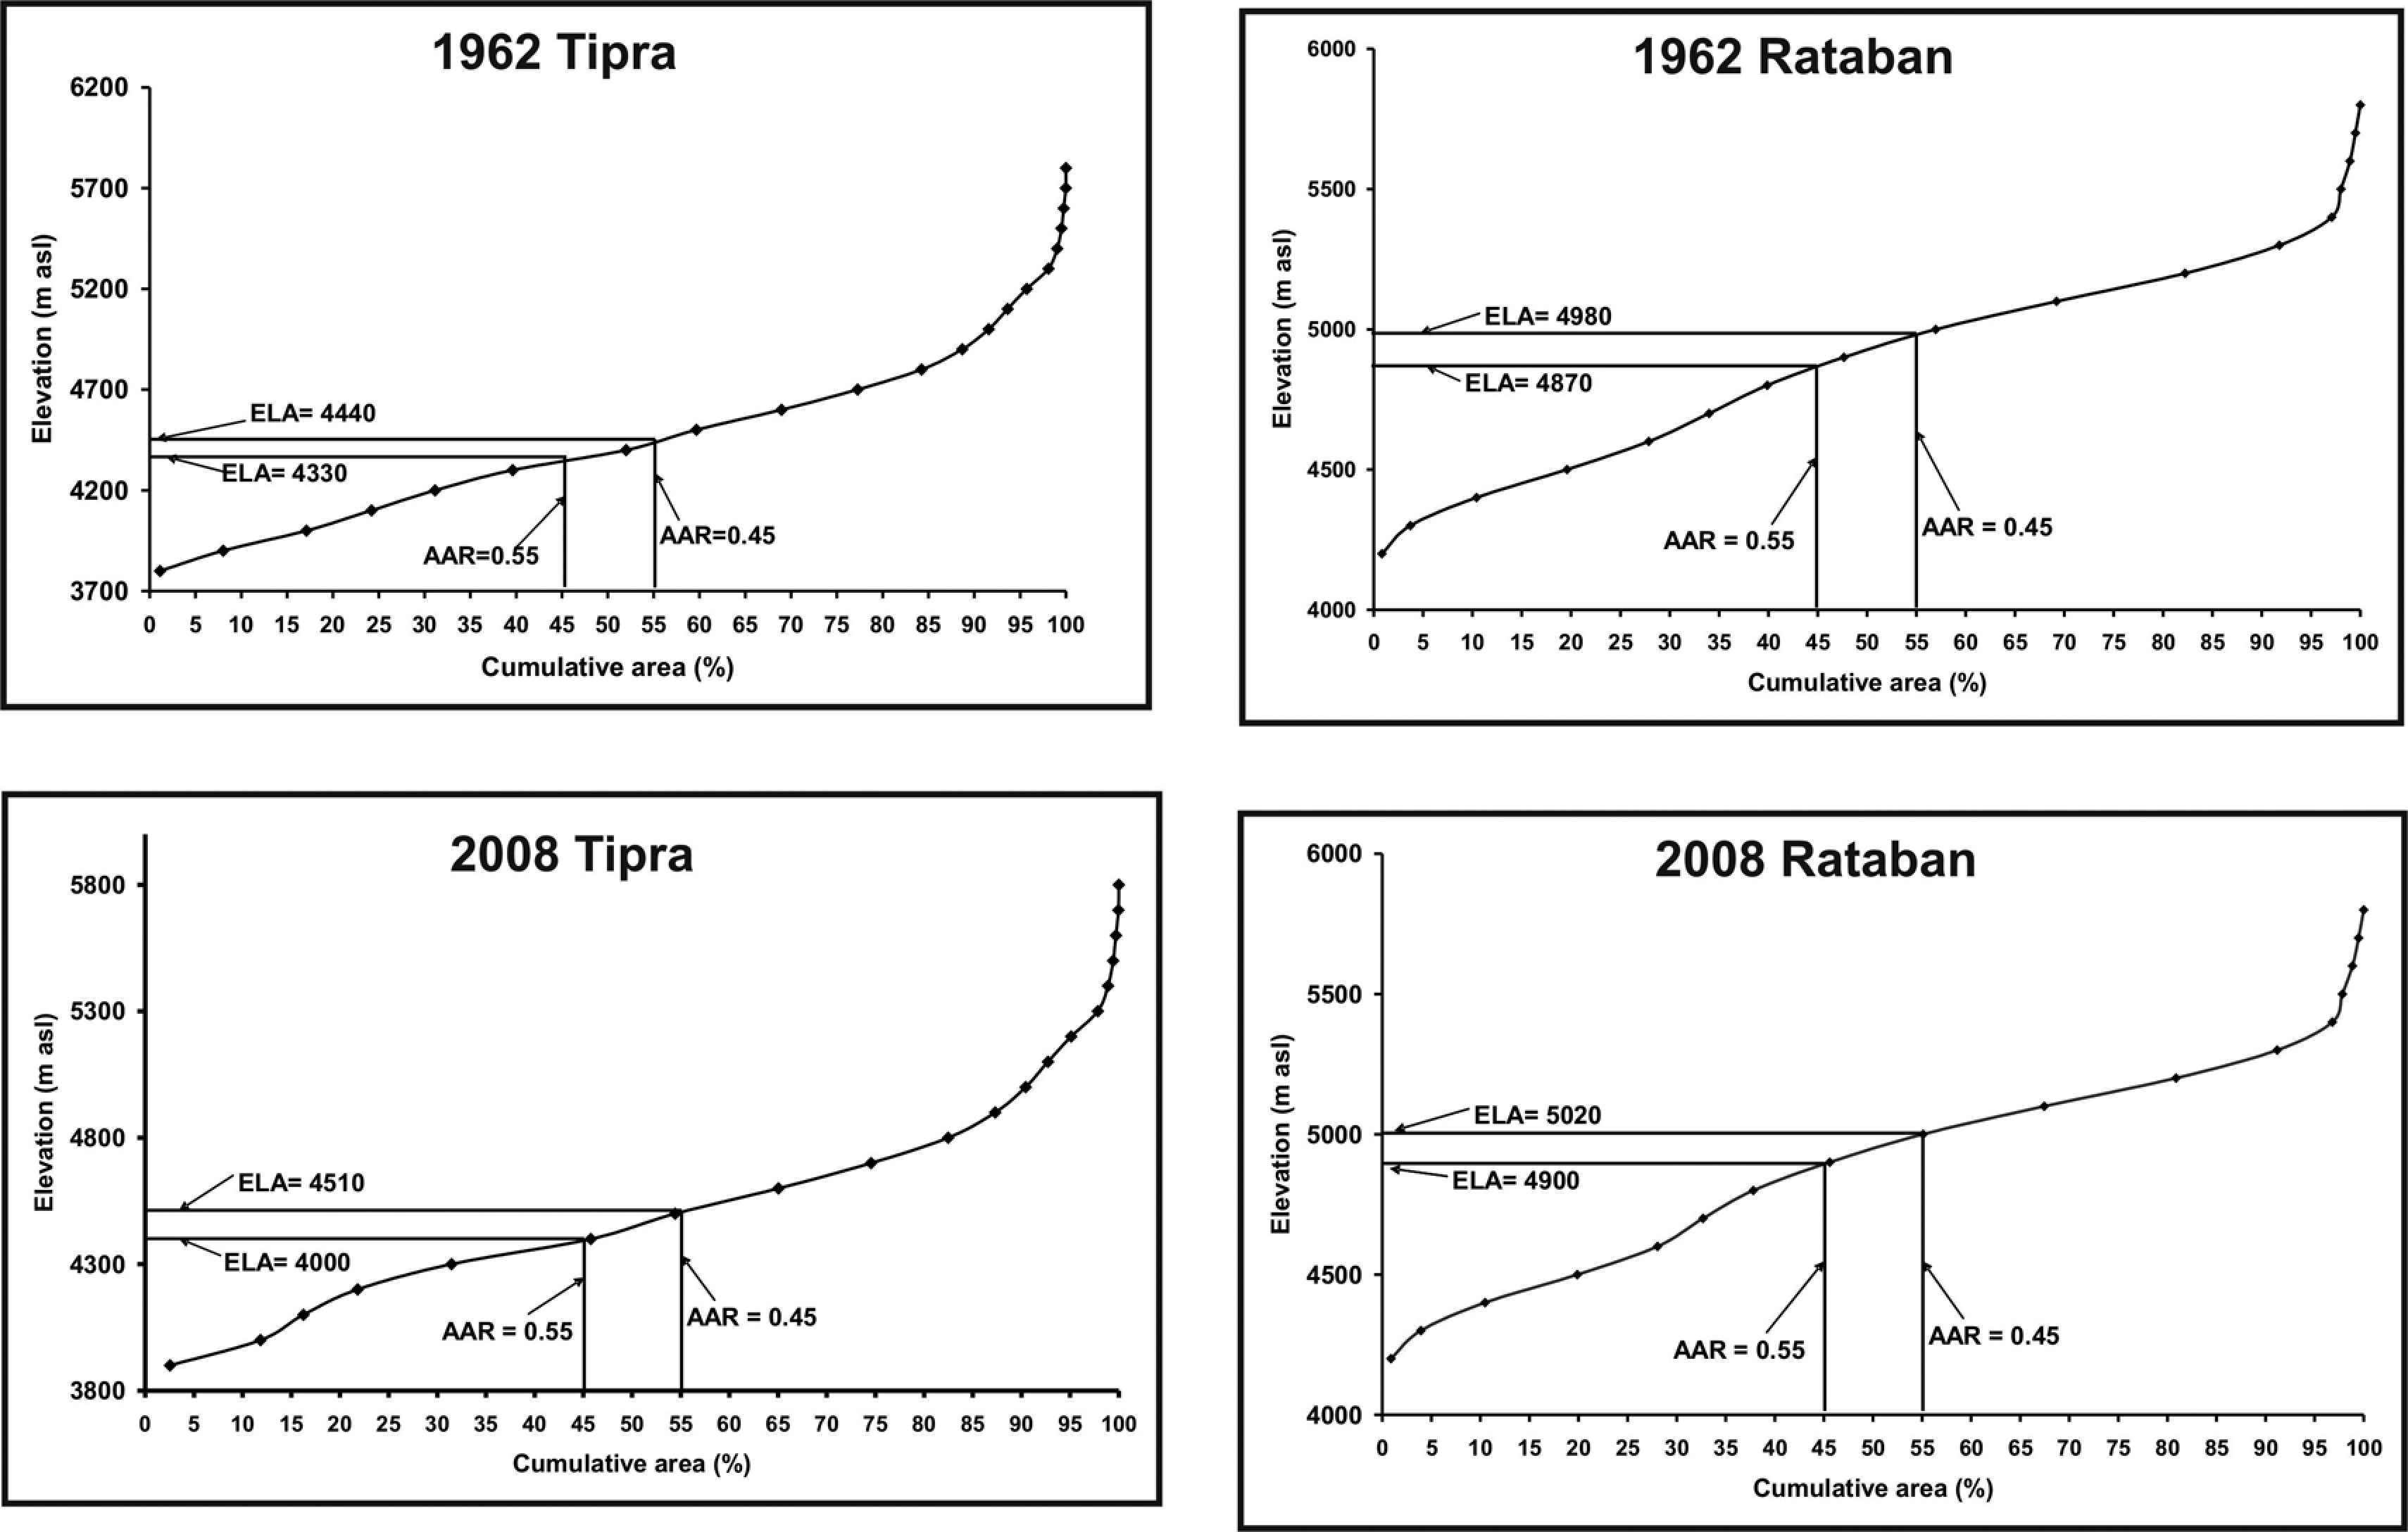
Area altitude distribution of the Tipra and Rataban Glaciers used for ELA calculation by the AAR method. Differences exist in vertical scale.
Comparisons between former and present-day ELAs have yielded valuable information on the magnitude and extent of climate change in the mountains (Lowe and Walker, 1984; Porter, 1997; Sharma and Owen, 1996). In 2008, the two glaciers' termini were located at 3865 m asl and 4120 m asl with associated ELA at ~4475±68 m asl and 4989±117 m asl, and AAR estimated at 0.47 and 0.49, respectively, for the Tipra and Rataban Glaciers. The result of ELA depression from the present to 1962 glacier positions are ~76 m and ~57 m, when the terminus of the Tipra Glacier was at an altitude of 3770 m and the Rataban Glacier was part of the Tipra Glacier. The two were joined at 4000 m asl (Figure 6).
V Discussion and conclusion
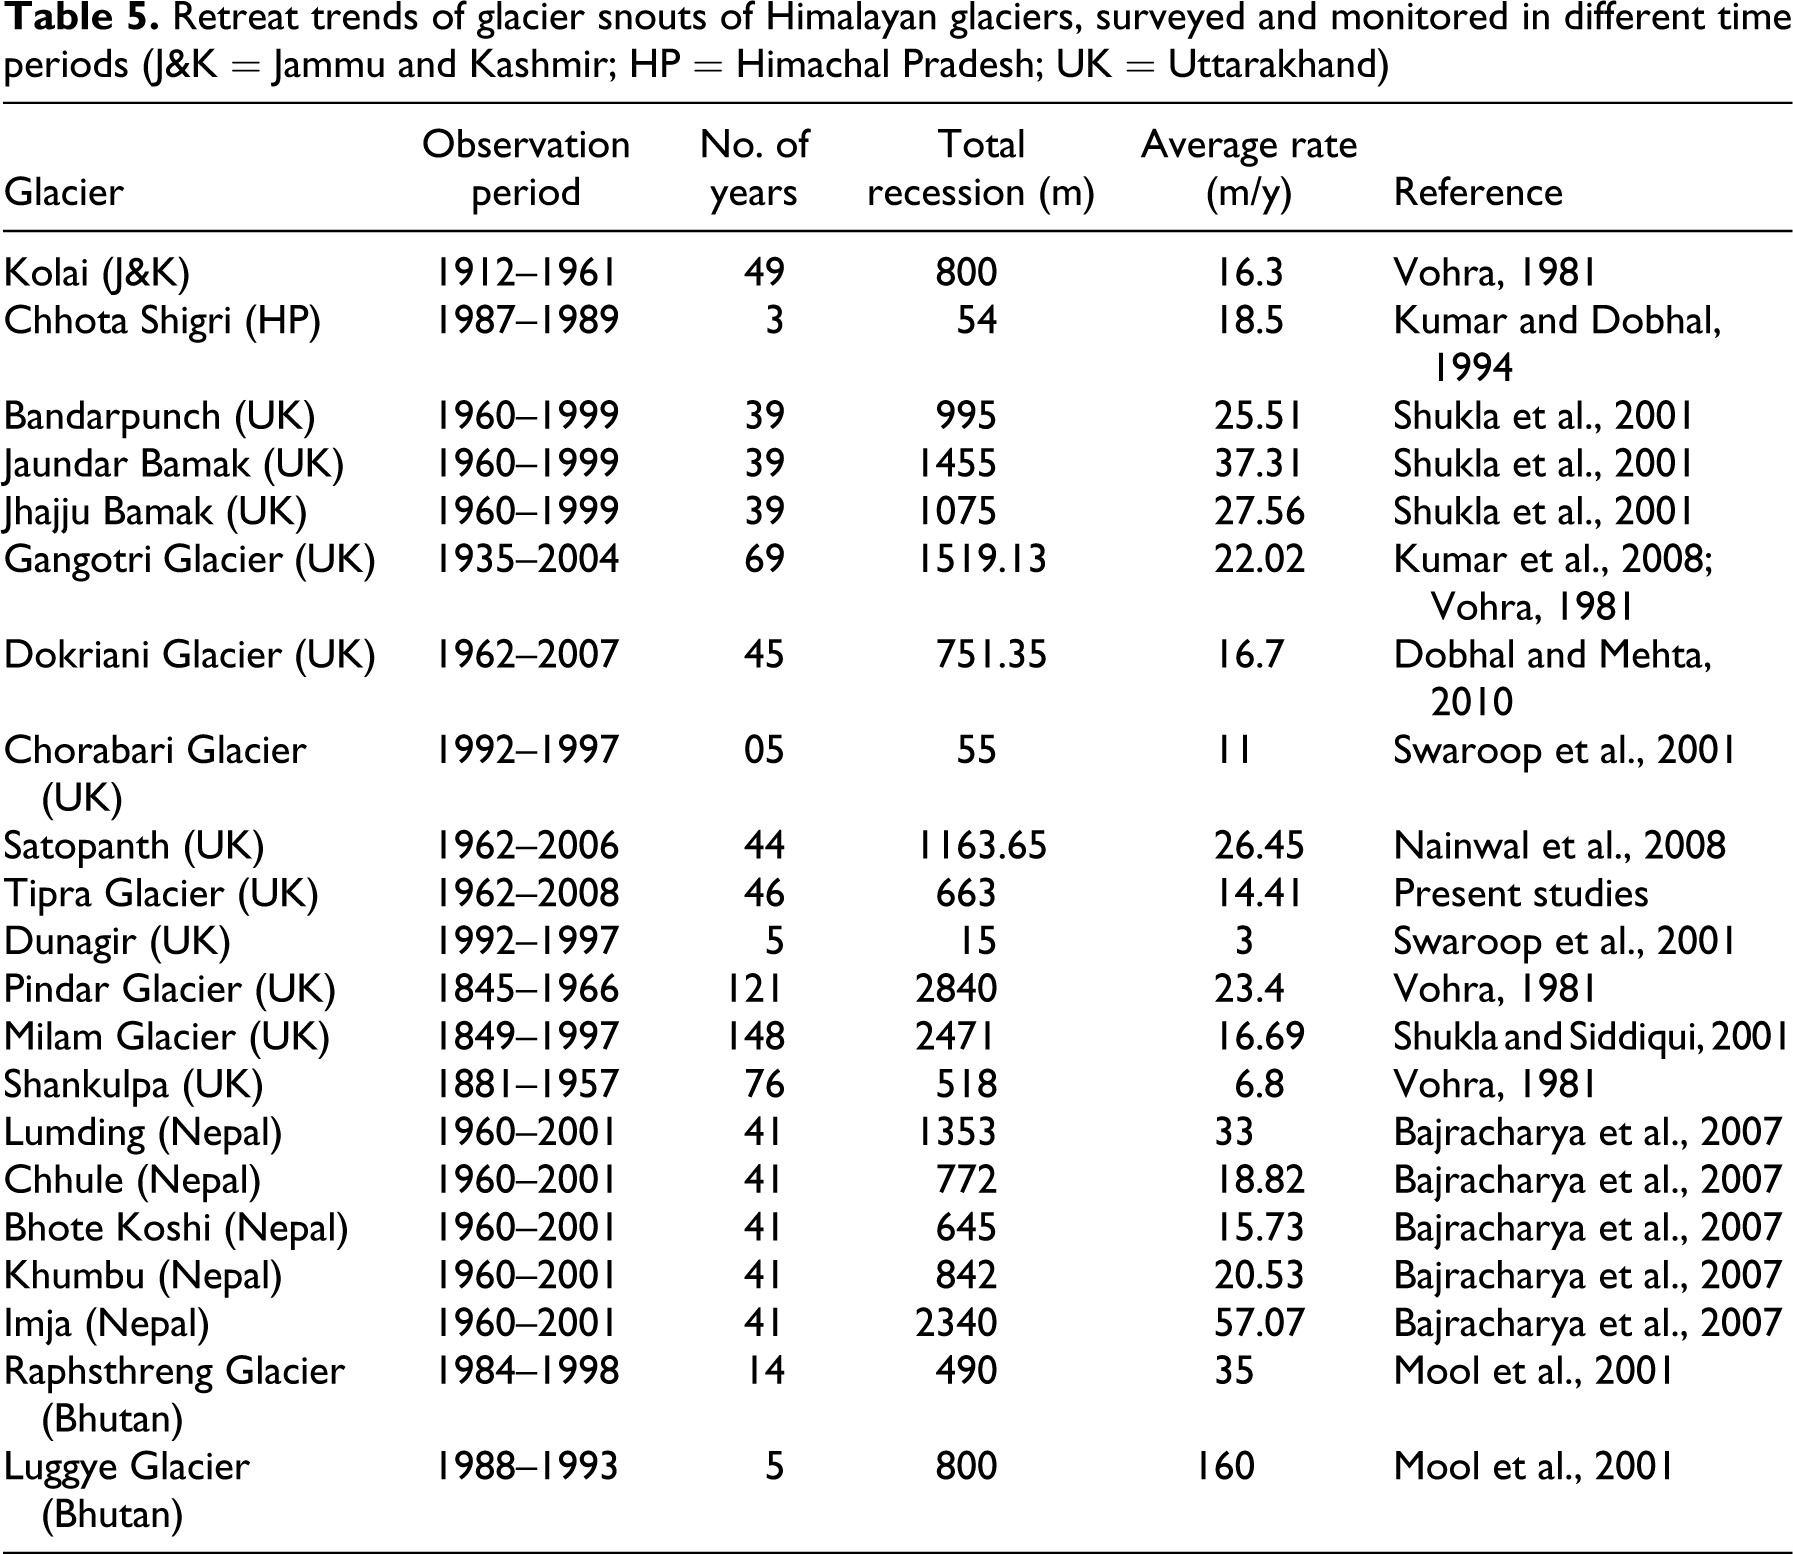
The studies carried out during the last century provide a link between climate change and glacier retreat (Haeberli et al., 2005; Kaser, 2006). Enhanced retreating rates have been observed in the Himalaya during recent years. However, the magnitude varies, as does rate and timing (Table 5 ). The variation can be attributed to the local climatic variability that is prevalent in the Himalayan region. An increase in temperature by about 2°C and reduction in winter precipitation between 1974 and 2006 has been demonstrated in a recent study carried out in the northwestern Himalayan region (Dimri et al., 2007). This trend is in reasonable agreement with that of the studies carried out in other parts of the Himalaya (Bhutiyani et al., 2007; Borgaonkar et al., 1996; Seko and Takahashi, 1991; Shrestha et al., 1999). A distinct warming trend was observed in the Himalaya during the last three decades, particularly the winter temperature (December, January, February), which showed an appreciable increase. This increase in temperature (shift from solid to liquid precipitation) has been identified as one of the major factors responsible for decrease in snowfall over the Indian Himalayan region (Dimri et al., 2007; Thayyen et al., 2005a).
Retreat trends of glacier snouts of Himalayan glaciers, surveyed and monitored in different time periods (J&K = Jammu and Kashmir; HP = Himachal Pradesh; UK = Uttarakhand)
It is the effect of warming that has upwardly shifted the snowline, resulting in the increase in the ablation area of the glaciers (Berthier et al., 2007; Dobhal et al., 2008; Kulkarni et al., 2005; Kumar et al., 2007; Wagnon et al., 2007). A study of 466 glaciers in the Western Himalaya using remote sensing data and archival records for the period 1962–2001 indicates that there has been a 21% reduction in the glacierized area (Kulkarni et al., 2005). The study also indicates around 38% reduction was associated with small glaciers (<1 km2), whereas it was around 12% for larger glaciers. Similar observations were made in the Dokriani Glacier (7 km2) in the Garhwal Himalaya during the period 1960–1995 indicating volume and area loss of 20% and 10%, respectively (Dobhal et al., 2004). It was further observed that during this period the snout retreated by 550 m with an average rate of 16.7 m a−1. Regular monitoring of the snout position of the Dokriani Glacier was carried out annually on fixed datum (month of October) for the period 1991–2007 which indicated a fluctuating snout position ranging from 17.8 m a−1 during 1991–2000 to 16.6 m a−1 during 2001–2007 (Dobhal and Mehta, 2010). It is worth mentioning that the 1990s was the warmest decade of the century and 1998 was the warmest year of the decade (IPCC, 2001a, 2001b). The warmest year of the decade (1998) was represented by a high negative mass balance (0.34 m w.e.) and snout retreat (20 m) compared to other observation years (Dobhal et al., 2008). Based on the above discussion, it can be suggested that local weather conditions in the Himalaya also play a significant role in spatial and temporal changes in snout positions.
The above observations compare well with the study carried out in the Tipra Glacier where 535 m recession (13.4 m a−1) during the period 1960–2002 and 128.4 m (21 m a−1) in 2002–2008 were observed. Overall frontal area vacated by the glacier is 15% of the total glacier area. Further, annual mass balance for the period from 1982/83 to 1987/88 (six years) shows a negative mass balance with an average 1.63 × 10⁶ m3 w.e. a−1 (Gautam and Mukherjee, 1989). The resulting 9.46 × 10⁶ m3 w.e. cumulative volume loss represents a thickness reduction of 1.3 m during the study period. This is significant, considering the medium size of the Tipra Glacier (7.4 km2). This is also reflected in the upward migration of the Equilibrium Line Altitude (ELA) during this period. The combination of continuous retreat in length, reduction in volume and upward rise of ELA can be attributed to the rising temperature and changes in precipitation trend in the Himalaya.
The degeneration of tributary glaciers in the Himalaya is of great concern as they are converted from large to small ice bodies (glaciers). An analysis of several measurements indicates that small glaciers are more likely to face more melting than larger ones due to changes in climate (Armstrong et al., 2009; Kulkarni et al., 2007). In the present study, it is observed that the snouts of the Tipra and Rataban Glaciers are retreating almost at the same rate (~21.3 m a−1), but the altitude of the snout position of the Tipra (3865 m asl) is lower than that of the Rataban (4120 m asl). Using the available maps, satellite data and field observation, it is demonstrated that the glaciers in the Himalaya are receding continuously, due not only to warming but also to accelerated melting due to the degeneration of tributary glaciers.
A more definitive connection between glacier recession and recent climate change requires a regional-scale study. Nevertheless, as far as the Tipra Glacier is concerned, if the present climate trend continues, it is likely that the glacier will continue to decrease in ice volume.
Footnotes
Acknowledgements
We are grateful to the Director, Wadia Institute of Himalayan Geology (WIHG), Dehradun, India for providing facilities to carry out this work. The first author acknowledges the Ministry of Environment and Forests, Government of India, for financial support. We thank Shri Deepak Srivastava (Rtd. D.G. GSI) and Dr Mazari (Rtd. Scientist, WIHG), consultants, Centre for Glaciology, WIHG, Dehradun, for their valuable suggestions in editing the manuscript. We also thank Mr Bharat Singh Chauhan, Village Bhyundar, for his help during the fieldwork.