
Abstract
Current models aiming to simulate contemporary sediment yield (SY) implicitly assume that tectonic effects are either irrelevant or are reflected by catchment topography. In this study we analyse the relation between SY and seismic activity, a component of tectonic processes. Results show a spatial correlation between SY and seismic activity expressed as the estimated peak ground acceleration (PGA) with a 10% exceedance probability in 50 years. PGA has a significant impact on the spatial variation of SY, even after correcting for cross-correlations with topography, lithology or other factors that may influence SY. Based on three distinct data sets, we demonstrate that this effect is significant both for small catchments in Europe (0.3–3940 km2) and for large river systems worldwide (1580–6.15×10⁶ km2) and that seismic activity may be even more important for explaining regional variation in SY than land use or many other commonly considered factors (e.g. catchment area, climate). We show that explicitly considering seismic activity may lead to SY-estimates that easily deviate a factor 2 or more compared to estimates that do not consider seismic activity. This is not only the case for highly seismically active regions: also in regions with a weak to moderate seismic regime seismic activity helps explaining regional patterns in SY. We argue that these findings have important implications for a better understanding of SY and its sensitivity to human impacts, as well as for our comprehension of sediment fluxes at longer timescales.
I Introduction
Understanding the factors and processes controlling contemporary catchment sediment yield (SY [t km-2 y-1]; i.e. the mass of sediment annually leaving a catchment per unit of catchment area) is crucial for numerous environmental and economical issues (e.g. Owens et al., 2005; Vanmaercke et al., 2011a) as well as to comprehend biogeochemical cycles, fluvial sedimentary archives and human impacts on sediment fluxes at various spatial and temporal scales (e.g. Meybeck, 2003; Syvitski and Milliman, 2007; Walling, 2006). At present, predictions of contemporary SY are largely based on empirical models that combine the impact of external drivers (i.e. climate and human activity) with the current state of a catchment (i.e. topography and lithology) while tectonic forcings are not explicitly accounted for (e.g. de Vente and Poesen, 2005; Merrit et al., 2003; Milliman and Syvitski, 1992; Syvitski and Milliman, 2007). It has been argued that this is not necessary as tectonic uplift will result in a steeper topography, leading to an increase in sediment production (e.g. Milliman and Syvitski, 1992; Montgomery and Brandon, 2002; Syvitski and Milliman, 2007).
We argue that catchment topography does not fully incorporate the effects of tectonic forcings on SY. First, variations in uplift rates are only partly reflected in catchment topography: studies show that topography in mountain areas is constrained by a limiting steepness threshold (Montgomery and Brandon, 2002; Larsen and Montgomery, 2012). For catchments where topography approaches this threshold, a further increase in tectonic uplift will result in an increase in erosion rates, while overall catchment steepness remains unchanged. In areas with topography below this limiting steepness threshold, tectonic uplift can initiate river incision, leading to an increase in SY which is not entirely reflected by the overall catchment topography (e.g. Whittaker et al., 2010). Second, impacts of tectonic forcings on SY may not be limited to uplift alone. Earthquakes can trigger mass movements, leading to additional mobilization of sediments and increased sediment yields (Dadson et al., 2004; Hovius et al., 2011). The effects of mass movements due to large earthquakes on landscape evolution and sediment fluxes can persist over thousands of years (Antinao and Gosse, 2009; Parker et al., 2011). However, earthquakes with a relatively low magnitude (M > 4.3) can also induce landslides (Malamud et al., 2004) which may potentially contribute to catchment SY. In addition, seismic activity and its associated rock fracturing can result in a direct increase in weathering rates and sensitivity to erosion (Cox et al., 2010; Dühnforth et al., 2010; Koons et al., 2012; Molnar et al., 2007; Portenga and Bierman, 2011).
The effects of seismicity on SY have only been quantified for a limited number of highly tectonically active mountain regions (e.g. Dadson et al., 2004; Hovius et al., 2011; Howarth et al., 2012). These studies indicate that earthquake-triggered landslides may cause significant pulses in SY, but the overall importance of earthquakes for SY remains poorly understood (e.g. Huang and Montgomery, 2012). Furthermore, the potential importance of seismicity on SY in regions with a more moderate topography and/or tectonic regime has not yet been explored.
The major objectives of this paper are therefore (1) to explore the hypothesis that seismicity has a significant and overall impact on contemporary SY which is not reflected by the catchment state (topography and lithology) and (2) to present a first model to simulate regional variations in SY that incorporates seismicity.
This paper is structured as follows. Section II presents the analyses of the relationship between seismic activity and SY for a data set of undisturbed European catchments. Section III explores to what extent differences in land use may override a potential seismic control on SY, while section IV investigates if a potential seismic control on SY is also apparent in very large river systems worldwide. Building on these results, Section V aims to provide a first quantification of the importance of explicitly considering seismic activity when simulating SY at a regional scale. Section VI discusses the implications of our findings and provides a scope for further research.
Throughout our study, we used the Global Seismic Hazard Assessment Program (GSHAP) spatial database (Shedlock et al., 2000) to assess the degree of seismic activity. This data set is based on large inventories of historical and measured earthquakes. For each catchment that we studied, we extracted the area-weighted average peak ground acceleration (PGA [m s-2]) that has a 10% exceedance probability in 50 years. Figure 1 shows an extract of this data set for Europe, the main focus area of this study. Since PGA heavily depends on the magnitude of earthquakes (Shedlock et al., 2000) and the frequency and intensity of smaller earthquakes is generally strongly correlated with the magnitude of the largest earthquake events (e.g. Bak et al., 2002; Turcotte and Malamud, 2004), it can be expected that PGA provides a good measure of the overall seismic activity in a region. One should note that seismic activity does not perfectly capture all effects that tectonic forcing may have on SY. For instance, while strong tectonic uplift is usually characterized by significant seismic activity (e.g. Parker et al., 2011), earthquakes do not necessarily generate relative rock uplift. Thus, by using PGA, we use a measure that is only an indicator of the intensity of tectonic processes.
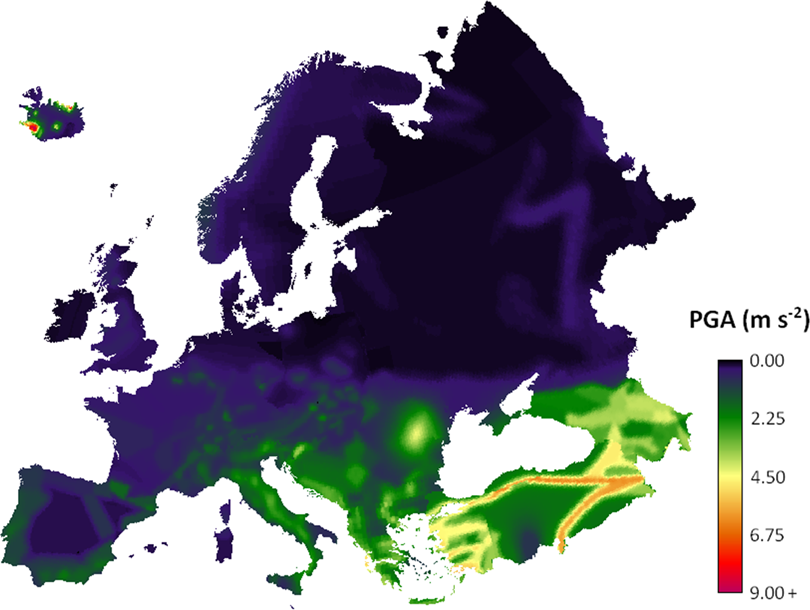
Estimated peak ground acceleration (PGA) with an exceedance probability of 10% in 50 years for Europe, as derived from the GSHAP data set (Shedlock et al., 2000).
II Sediment yield under baseline conditions
1 Data selection and analysis
We selected 146 small (0.33–3940 km2) undisturbed catchments based on an extensive literature review in combination with GIS-analyses (Figure 2). We did this to avoid confounding a possible seismic signal by other factors known to affect SY (i.e. human impacts, glaciers, lakes; e.g. Syvitsksi and Milliman, 2007; Walling, 2006). A catchment was considered to be undisturbed if: (1) it was not affected by canals, extensive drainage or mining; (2) no significant natural glaciers, lakes or man-made reservoirs were present (i.e. less than 10% of the catchment area is potentially affected by lakes or reservoirs); and (3) the areal fraction of disturbed land (i.e. arable land, permanent crops and built-up area) was less than 20%. This 20% threshold is more conservative than earlier studies (e.g. Dedkov and Mozzherin, 1984; Walling, 1999) where a threshold of 30% was used. Sixty catchments had a forest cover of at least 80% during the monitoring period. The undisturbed areas of the 86 remaining catchments (partly) corresponded with other types of natural vegetation, such as (alpine) pasture, shrubland or heathland. Pasture and heathland may also be affected by human activity but, due to their large vegetation cover, the effect of this disturbance on sediment production and yield can be expected to be generally limited (e.g. Cerdan et al., 2010; Maetens et al., 2012; Ward et al., 2009). Overall, these selected catchments represent a wide range of topographic, lithological and tectonic conditions in Europe (Figures 1 and 2). Table 1 gives an overview of the selected data, their original sources and information on the measuring procedures used.
Sources and characteristics of the European sediment yield data from the 146 undisturbed catchments. The numbers correspond to the numbers indicated in Figure 2. ‘Number of catchments’ indicates how many SY-values were retrieved from each reference. ‘Measuring method’ indicates how the SY-values were determined. ‘MP’ stands for the duration of the measuring period. ‘A’ reports the (range of) catchment areas.
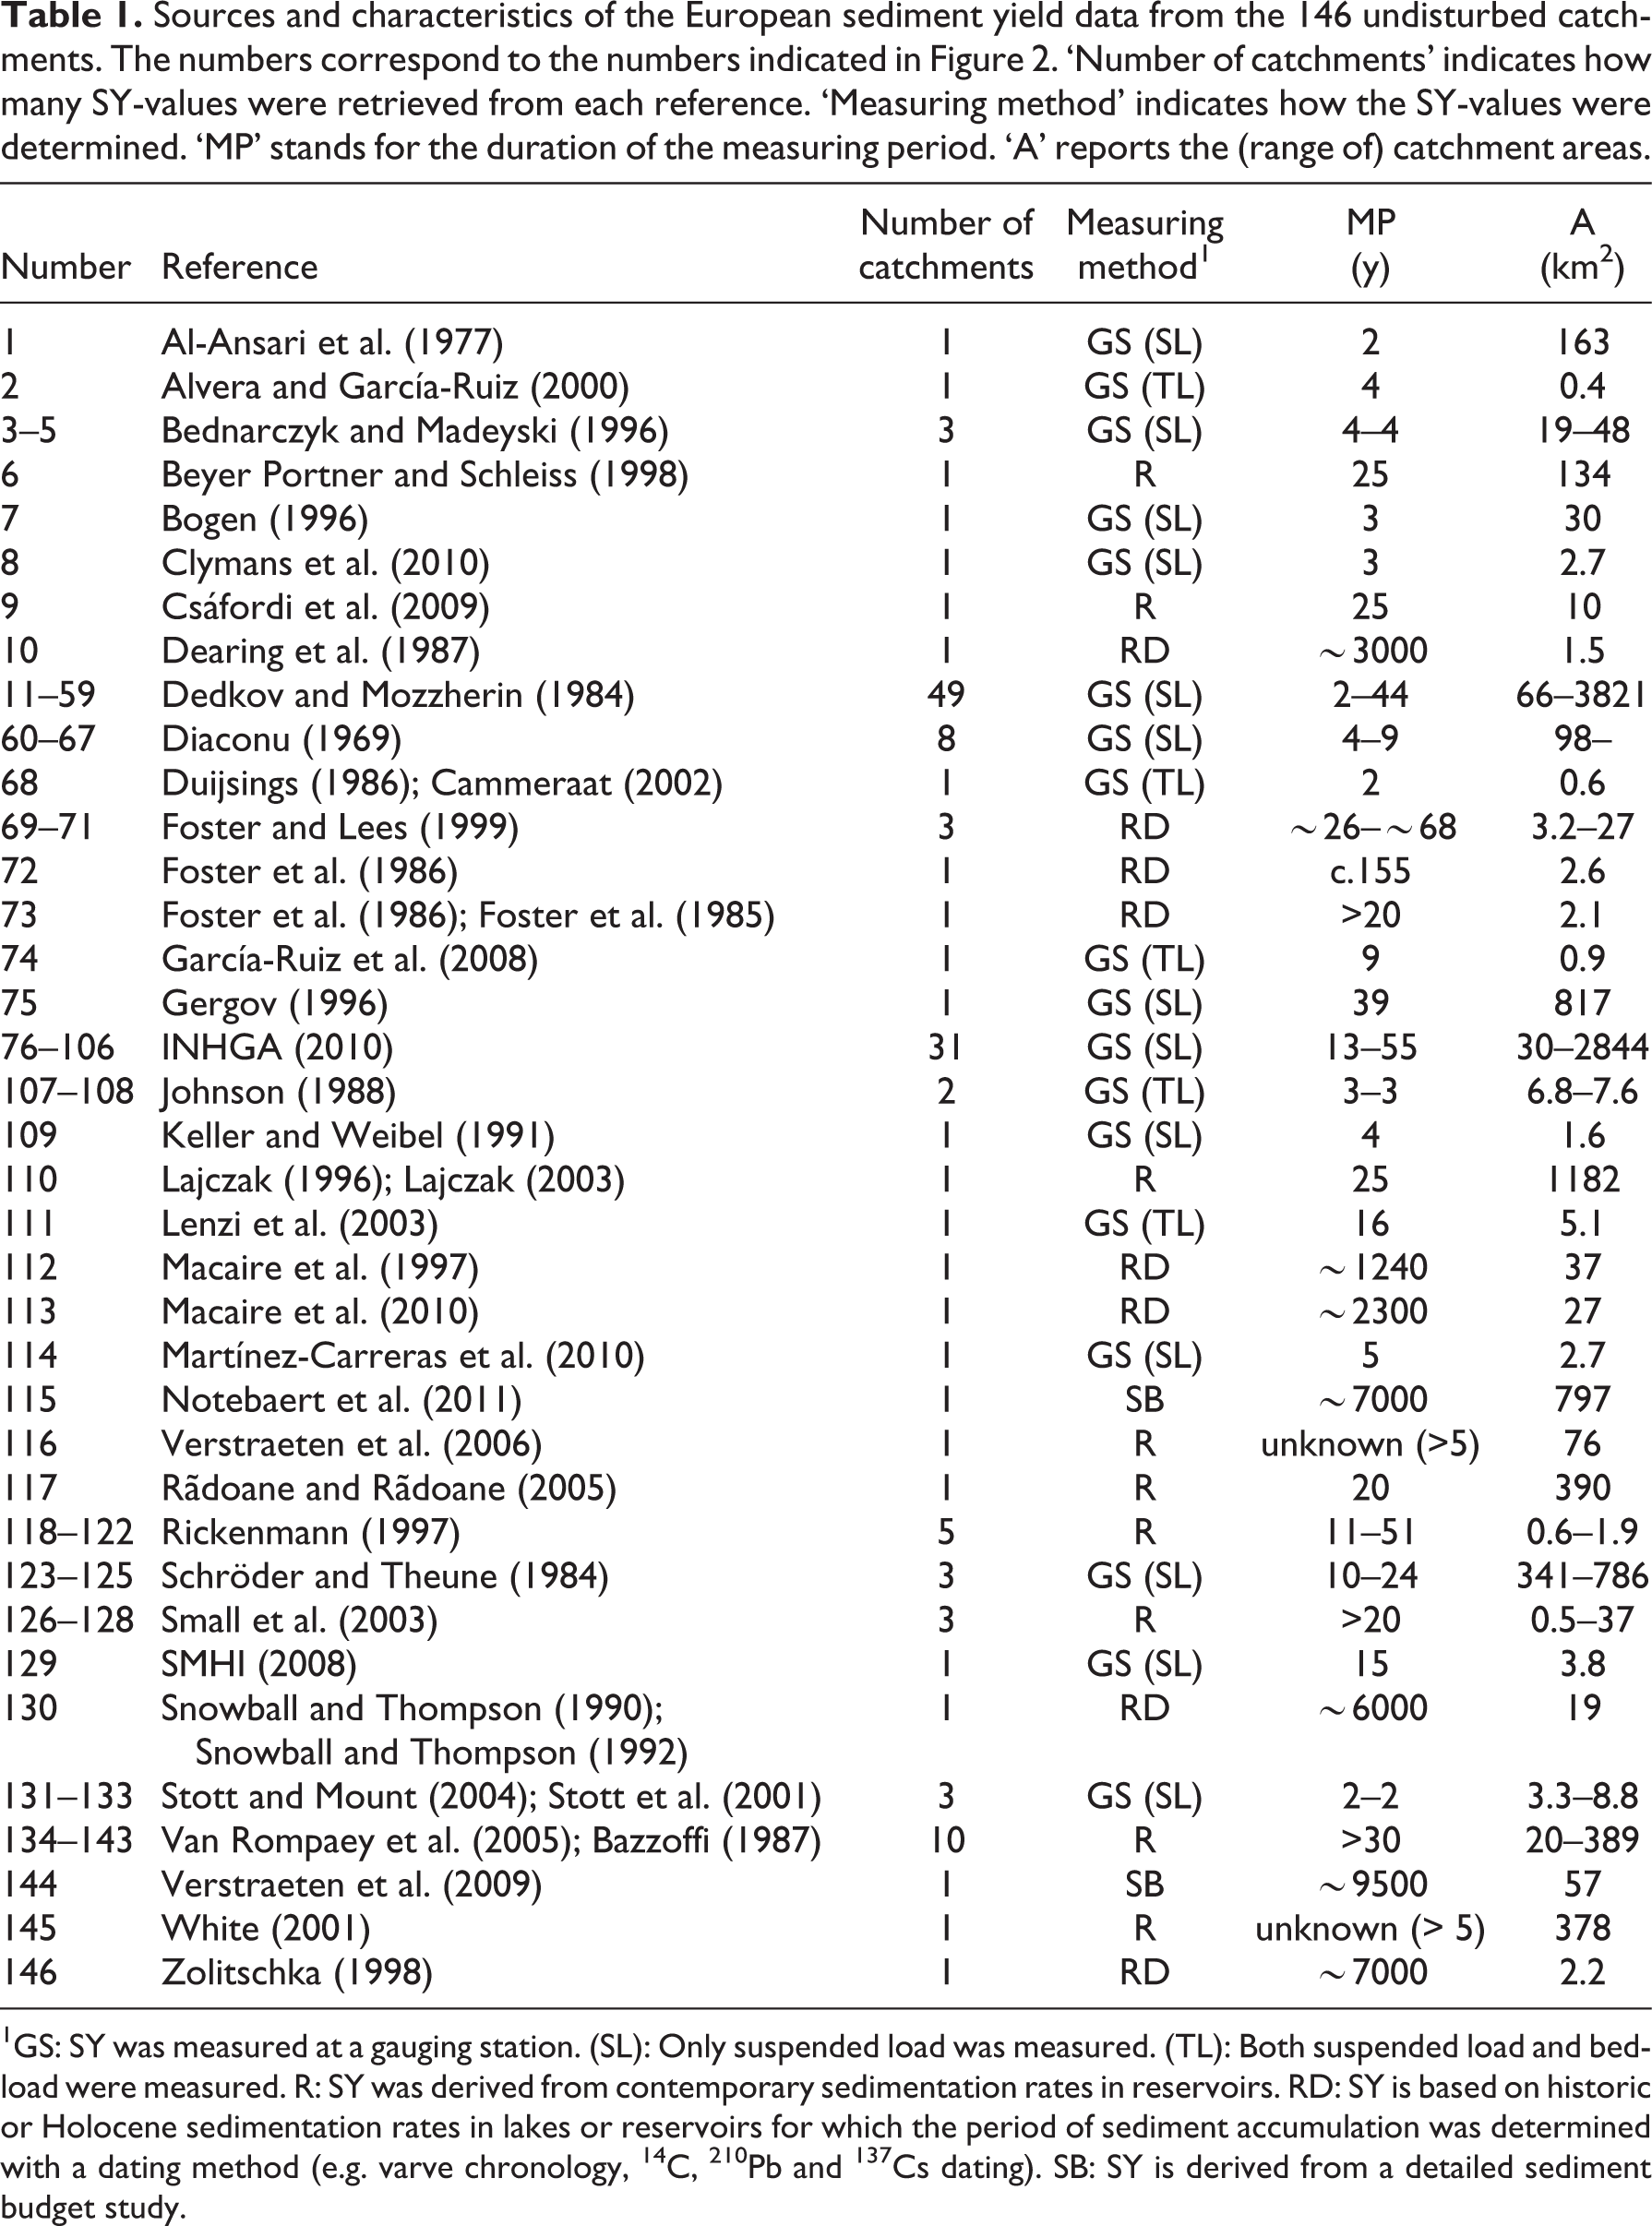
1GS: SY was measured at a gauging station. (SL): Only suspended load was measured. (TL): Both suspended load and bedload were measured. R: SY was derived from contemporary sedimentation rates in reservoirs. RD: SY is based on historic or Holocene sedimentation rates in lakes or reservoirs for which the period of sediment accumulation was determined with a dating method (e.g. varve chronology, 14C, 210Pb and 137Cs dating). SB: SY is derived from a detailed sediment budget study.
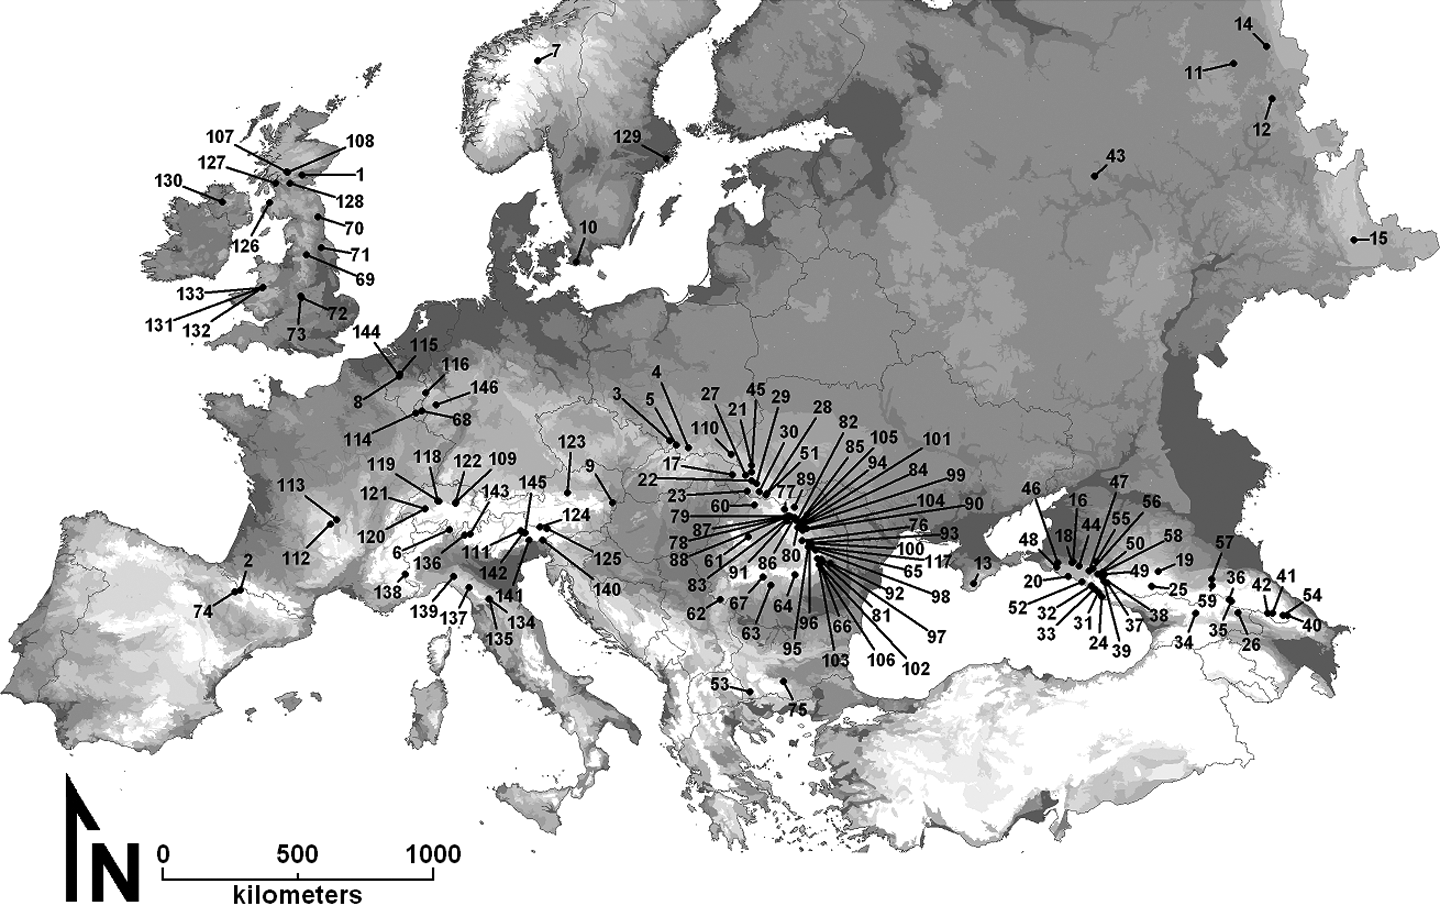
Location of the 146 undisturbed European catchments with sediment yield data available selected for this study. The map indicates the outlet locations of the study catchments. Original sources and characteristics of the SY-data are given in Table 1.
For each catchment a number of catchment characteristics that potentially explain differences in SY were determined by means of GIS-analyses and from information provided in the original data sources (Table 2). Most of these variables (or similar ones) are commonly used in studies investigating the controlling factors of SY at catchment scale (e.g. de Vente et al., 2011; Syvitski and Milliman, 2007). Topographic factors included total relief (R [m]), mean local relief (MLR [m]; where the local relief was determined within a radius of 5 km), average catchment slope (S [°]) and indices describing average channel steepness. A lithology factor (L [–]) was derived for each catchment describing the overall lithological susceptibility to erosion, following the same procedure as Syvitski and Milliman (2007). Climatic variables – e.g. average annual rainfall (P [mm]), rainfall erosivity (MFI [mm]), annual runoff potential (RI [mm]), average air temperature (T [°C]) – and variables describing the land cover and SY-measuring method were also included in the analyses. To estimate the degree of seismic activity an area-weighted PGA-value was calculated for each catchment based on the GSHAP data set (Shedlock et al., 2000; Figure 1).
Overview of all variables considered in the correlation analyses, their source and their range for the data set of undisturbed catchments.
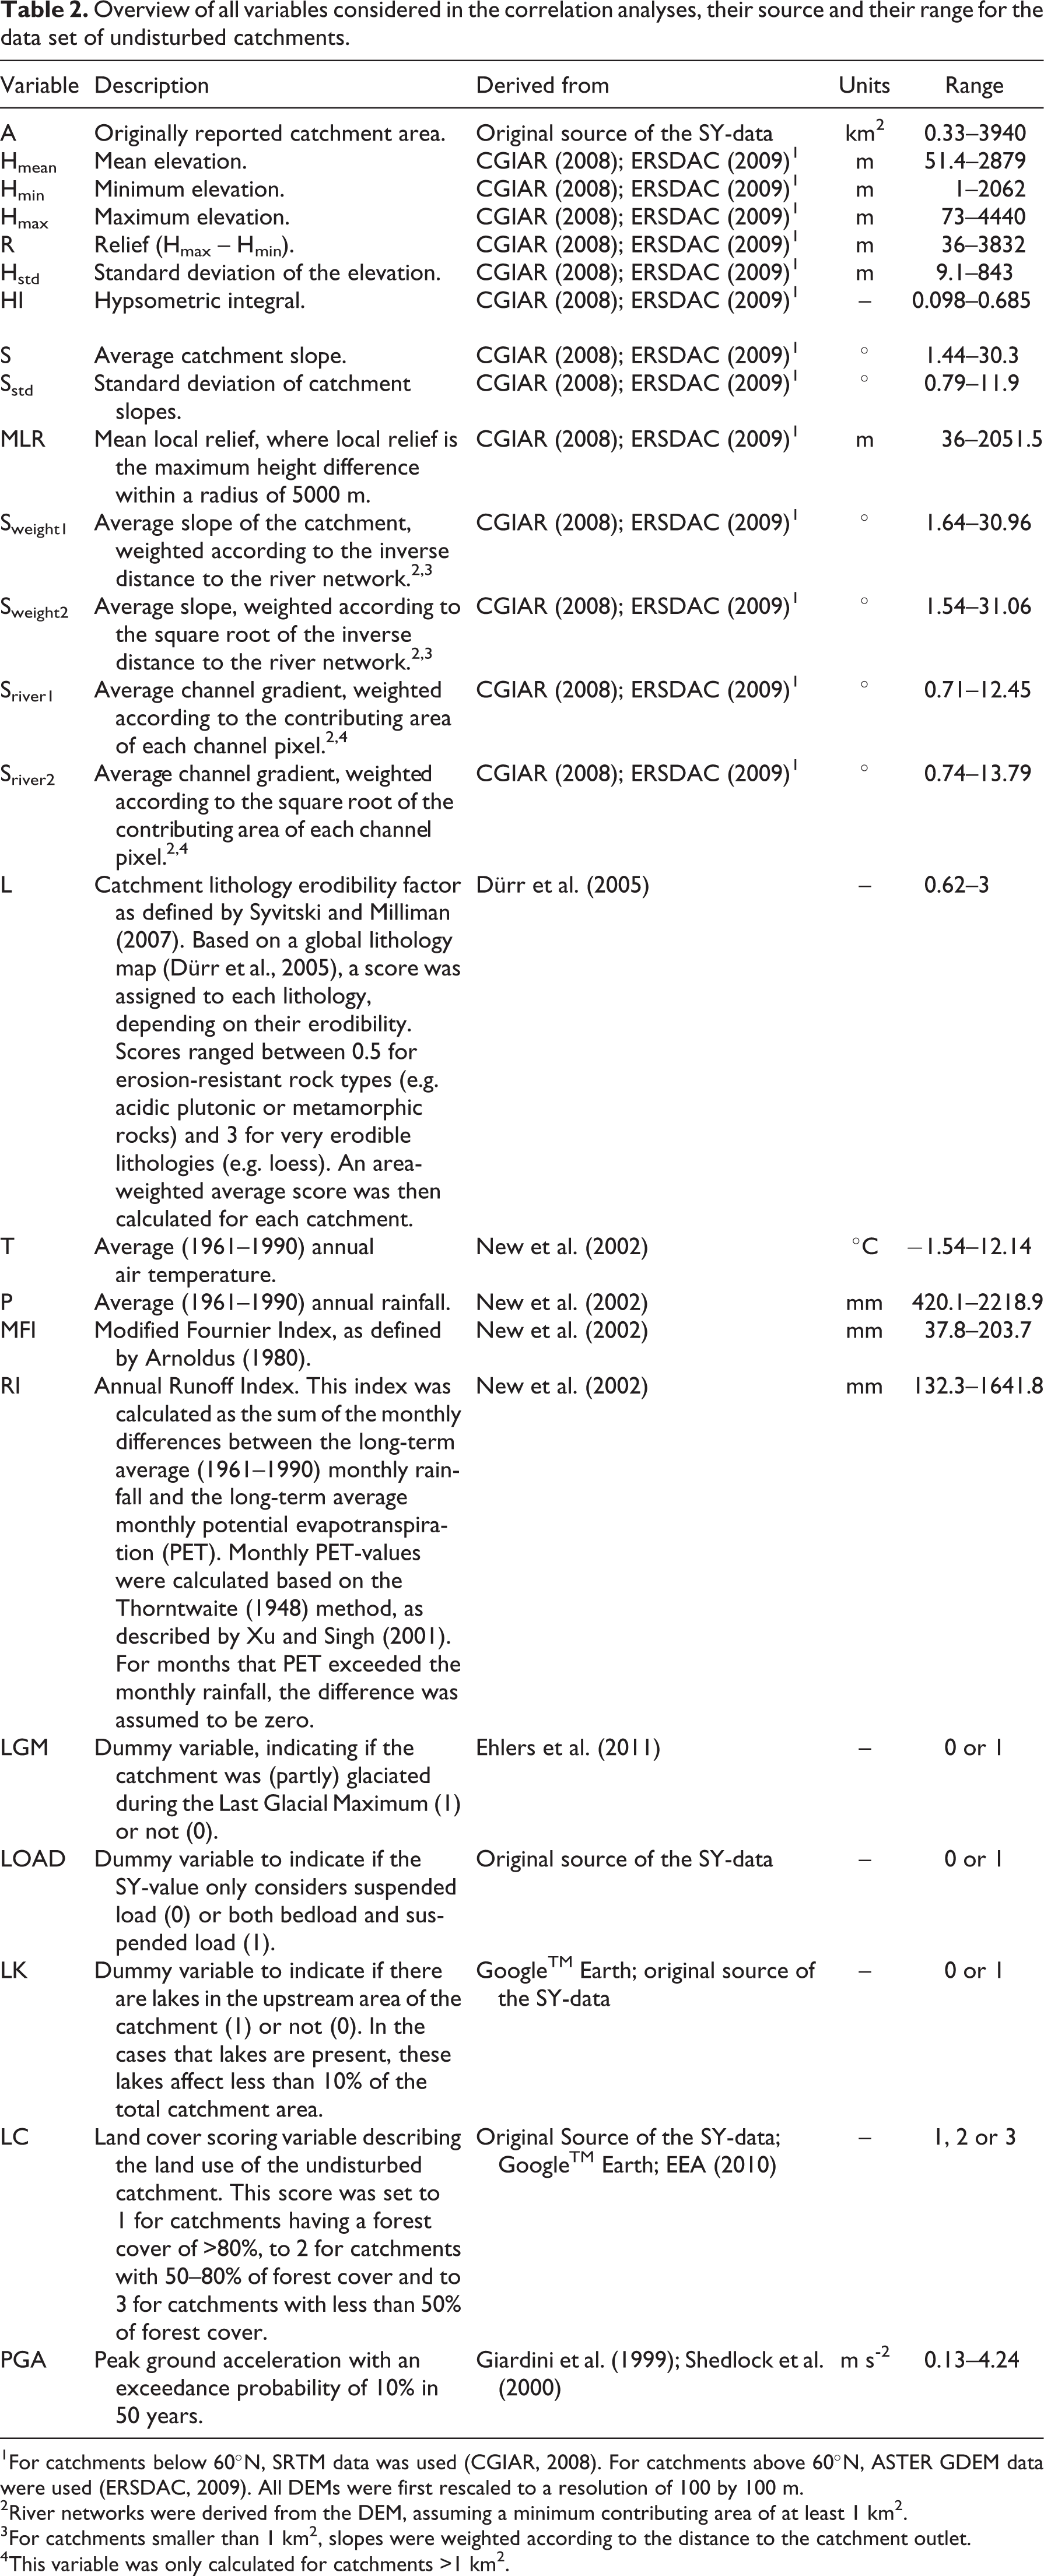
1For catchments below 60°N, SRTM data was used (CGIAR, 2008). For catchments above 60°N, ASTER GDEM data were used (ERSDAC, 2009). All DEMs were first rescaled to a resolution of 100 by 100 m.
2River networks were derived from the DEM, assuming a minimum contributing area of at least 1 km2.
3For catchments smaller than 1 km2, slopes were weighted according to the distance to the catchment outlet.
4This variable was only calculated for catchments >1 km2.
As SY and many of the variables considered ranged over several orders of magnitude, the data were first logarithmically transformed with the exception of temperature (T) and the categorical variables LGM, LOAD, LK and LC (Table 2). Using this (log-transformed) data set of catchment characteristics and SY-values, we conducted normal and partial correlation analyses, based on both Pearson (r) and Spearman rank (rs) correlation coefficients. Partial correlation measures the degree of association between two considered variables, with the effect of other controlling variables removed (Fisher, 1924; Steel and Torrie, 1960). This is done by conducting a regression between each of the considered variables and the control variables and by then calculating the correlation between the residues of these two regressions.
2 Results
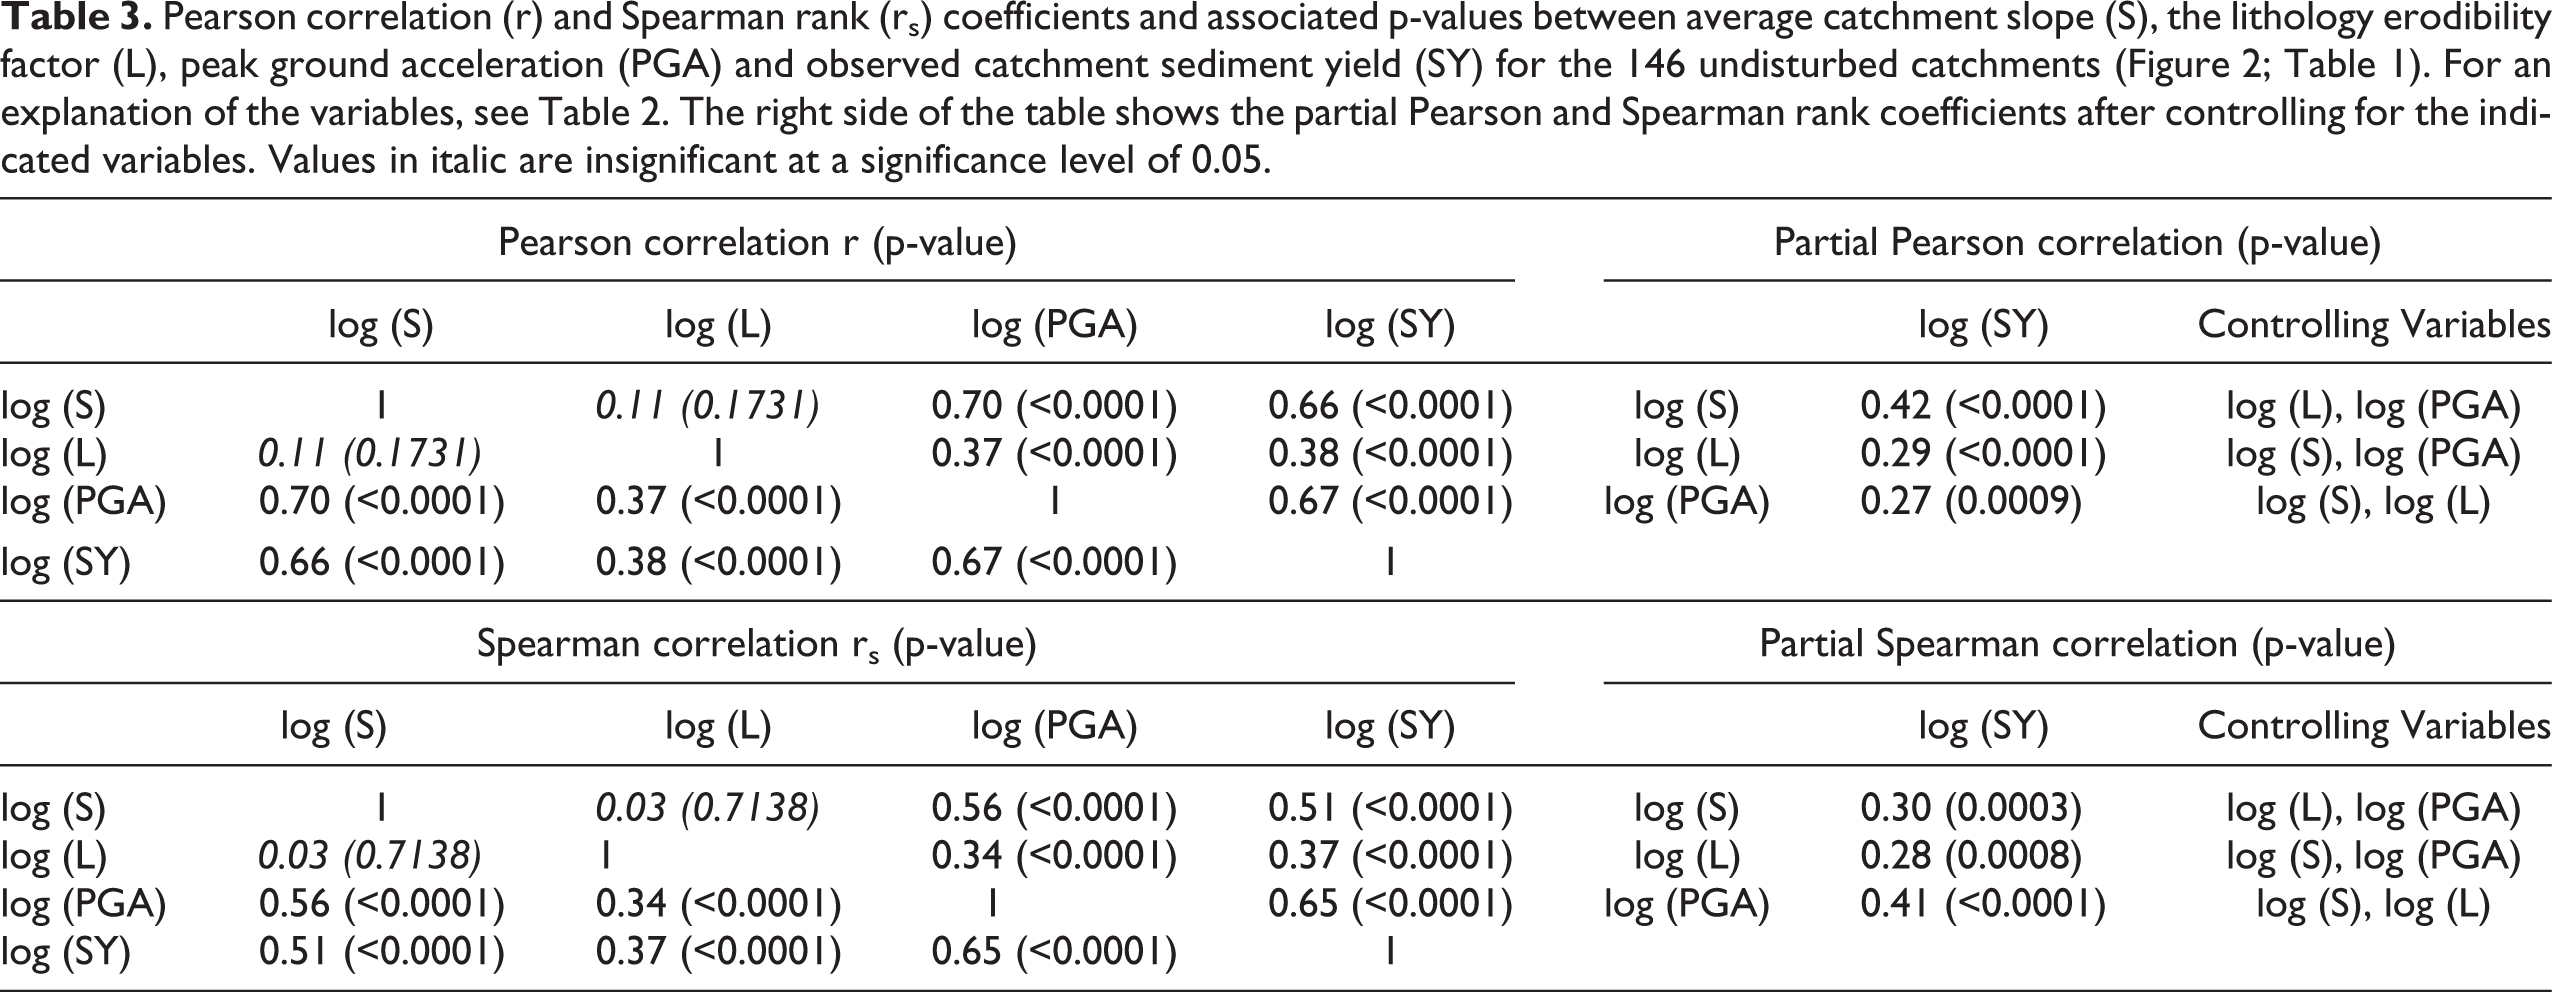
Results indicate that observed differences in SY for the undisturbed data set are best explained by peak ground acceleration (PGA; Figure 3a), average catchment slope (S; Figure 3b) and catchment lithology (L; Figure 3c). While PGA, S and L correlate significantly with the observed variation in SY, they also correlate significantly with each other (with the exception of S and L; see Table 3 and Figure 3d). Nonetheless, partial correlation analyses show that each of these three variables remains significantly correlated with SY after controlling for the other two variables. Therefore, the significance of the effects found for each of the three variables cannot be attributed to confounding. Partial correlation analysis further indicates that, for this data set, average catchment slope explains the largest part of the observed variation, while the contribution of lithology and PGA is similar (Table 3).
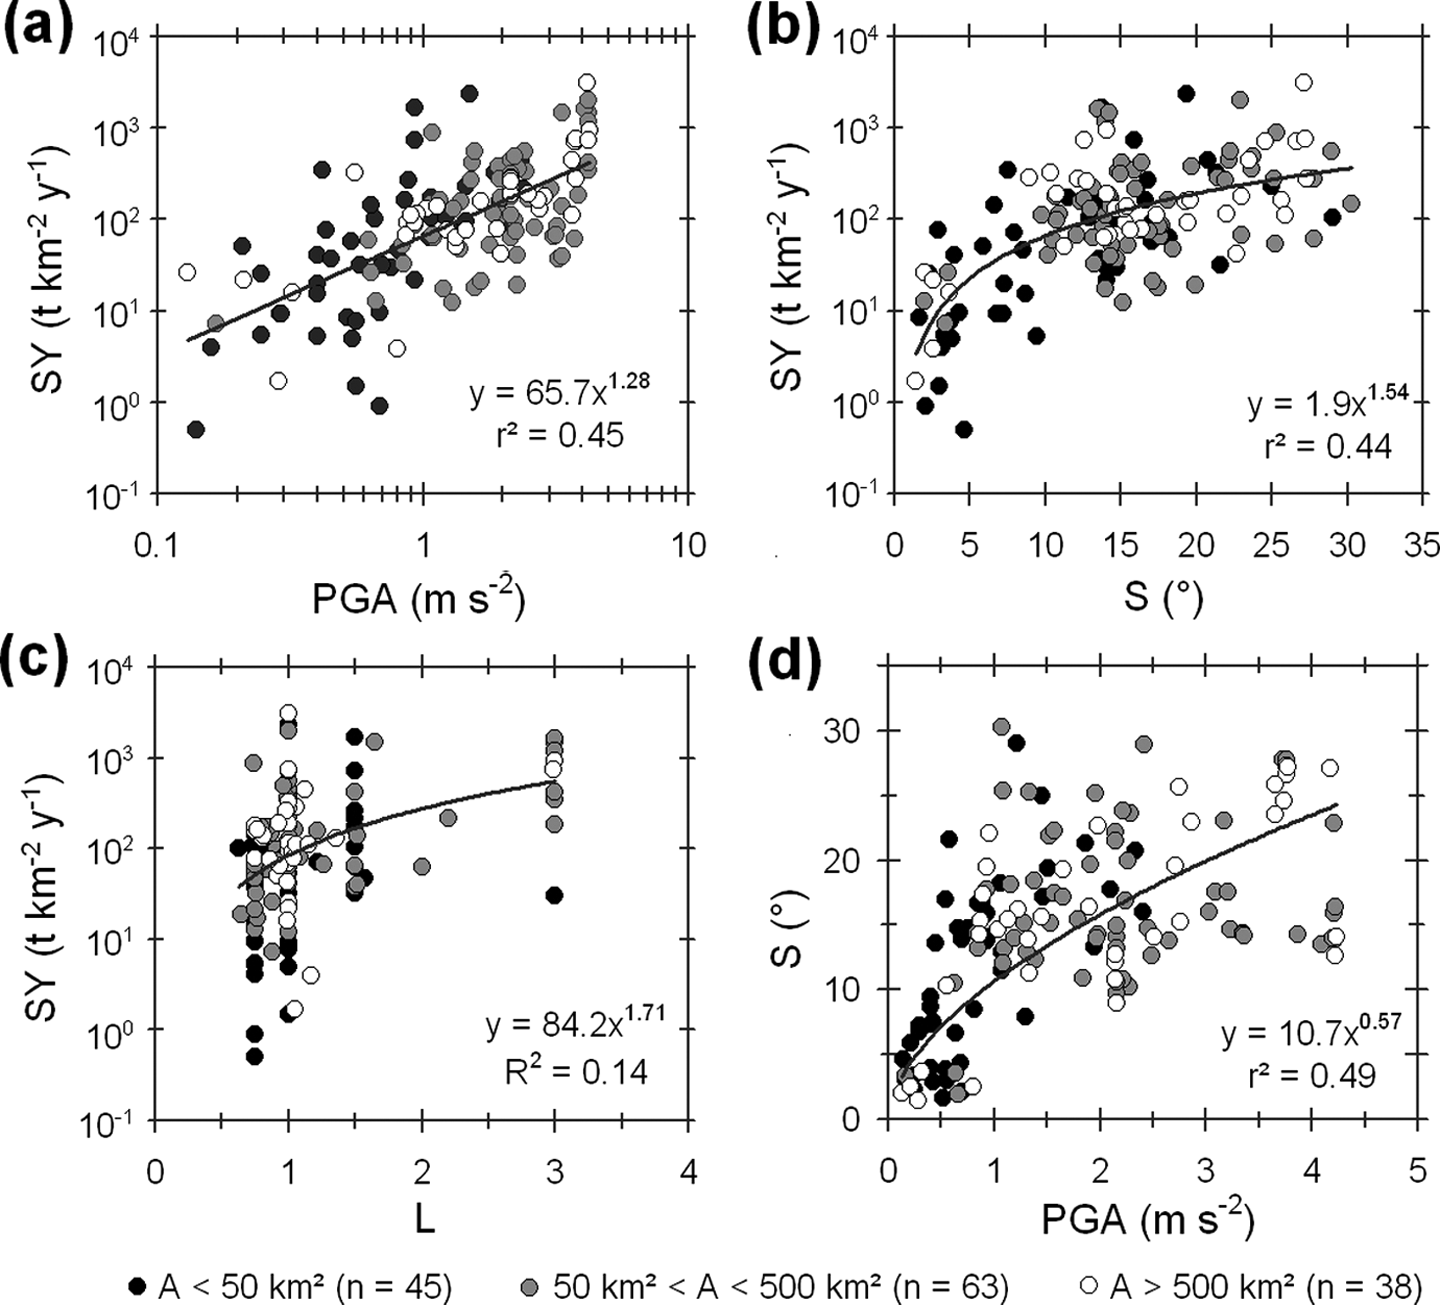
Main results of the correlation analyses for 146 undisturbed European catchments (see Figure 1 and Table 1). (a) Relationship between observed sediment yield (SY) and the average peak ground acceleration (PGA) that has an exceedance probability of 10% in 50 years. (b) Relationship between average catchment slope (S) and SY. (c) Relationship between the catchment lithology erodibility (L) as determined by Syvitski and Milliman (2007) and SY. (d) Relationship between S and PGA. Symbols are shaded according to the drainage area (A) of the catchments.
Pearson correlation (r) and Spearman rank (rs) coefficients and associated p-values between average catchment slope (S), the lithology erodibility factor (L), peak ground acceleration (PGA) and observed catchment sediment yield (SY) for the 146 undisturbed catchments (Figure 2; Table 1). For an explanation of the variables, see Table 2. The right side of the table shows the partial Pearson and Spearman rank coefficients after controlling for the indicated variables. Values in italic are insignificant at a significance level of 0.05.
After correcting for S, catchment area showed no significant correlation with SY. Likewise, we found no meaningful correlations between SY and any of the considered climatic variables (Table 2). Annual runoff observations were available for 90 of the considered catchments: statistical analyses indicated that runoff contributes very little in explaining the variability of SY. This concurs with the results of earlier studies on SY in undisturbed environments (e.g. Aalto et al., 2006). Also, on longer timescales climatic variables often exert only a limited influence on erosion rates (e.g. Riebe et al., 2001).
3 A baseline sediment yield model
Based on the results of our (partial) correlation analyses (section II.2), we constructed the following log-linear multiple regression model:
where SYmodel is the predicted sediment yield in t km-2 y-1. Calibration results show that our model explains about 56% of the variation in observed sediment yields (Figure 4). Circa 97% of the simulated SY-values deviate less than one order of magnitude from their corresponding measured value, while 85% of the data deviate less than a factor 5.
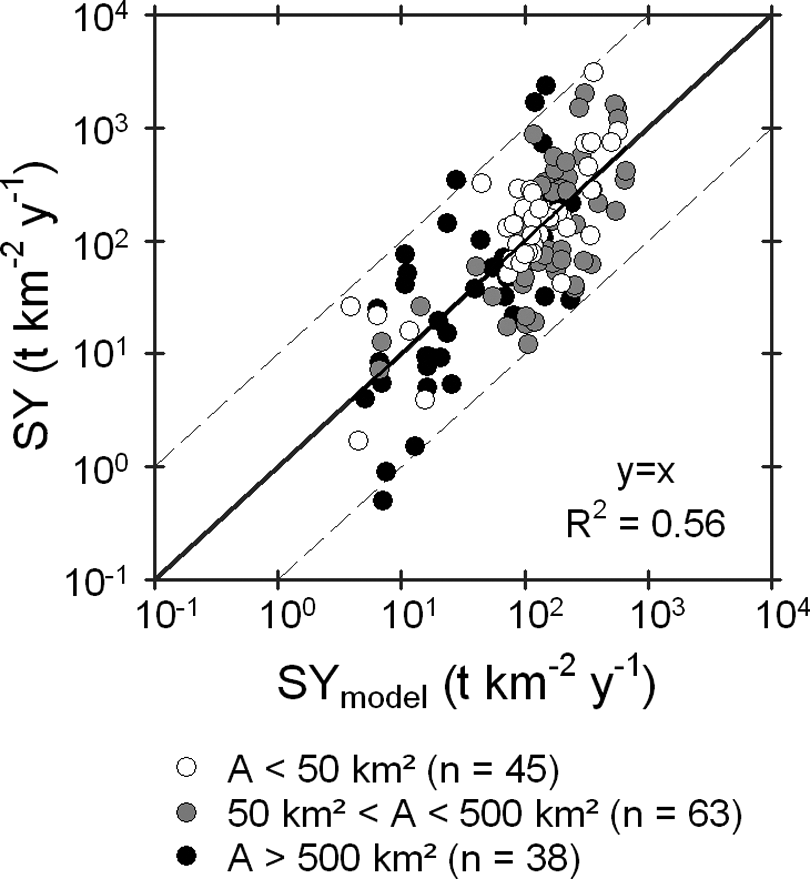
Comparison between observed sediment yield (SY) and the simulated sediment yield (SYmodel) using equation 1, for the 146 undisturbed European catchments (Table 1; Figure 1). Symbols are shaded according to the drainage area (A) of the catchments.
Additional analyses showed that the overall performance of the model (equation 1) or the significance of the incorporated variables are not significantly affected by the relative short measuring period of some of the SY-values used (Table 1). Also, our model could not be further improved by including any other considered variable (Table 2). A weak correlation was found between the categorical LOAD variable and model residuals (r2 = 0.04, p = 0.02). This indicates that SY-values calculated from both the bed and suspended load are indeed somewhat higher than values derived from suspended load measurement only, but the effect is limited. Likewise, a weak but significant correlation was found between the categorical variable describing land cover (LC) and model residuals (r2 = 0.05, p = 0.008). However, it is unclear whether this small residual effect is because of actual differences in vegetation cover or because of auto-correlations between LC and other (unconsidered) factors. Therefore we did not further consider the effect of LC in the analyses of this data set.
We tested the robustness of our model (equation 1) using the following procedure. A random number of catchments (between 5 and 141) was randomly selected from the original data set (Table 1; Figure 2) and used for calibration. The resulting alternative model was then applied to simulate the SY of the remaining catchments. This procedure was repeated 1000 times. For each validation the model efficiency (ME; Nash and Sutcliffe, 1970) was calculated: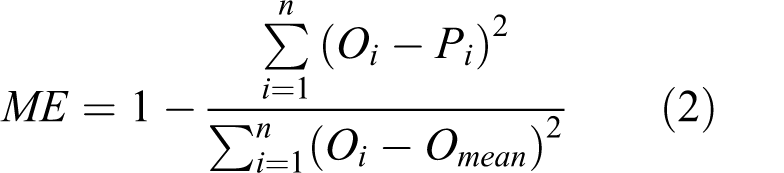
where n is the number of observations, Oi is the logarithm of the measured SY-value, Pi is the corresponding logarithm of the simulated SY-value, and Omean is the logarithm of the mean observed SY-value. ME can range from –∞ to 1 and indicates the part of the observed variance the model accounts for. A perfect model that accounts for all the observed variation has a ME of 1. Negative ME-values indicate that the model induces more variation than could be observed.
Results show that our model is robust: as long as ∼30 or more catchments are used for calibration, ME-values are similar to those obtained for the model based on all observations (Figure 5). On the other hand, the prediction quality may seem low when the model is validated on a limited number of observations (i.e. when more than 80% of the data is used for the calibration). This can be explained by the fact that, for some of these simulations, the variation in observed SY will be low. As a result, the overall deviations between observed and simulated values will be relatively large, which results in lower ME values (equation 2). The validations further showed that S, L and PGA generally remain significant when more than 30 catchments are used for calibration. We calculated probability ranges for the fitted parameter values using all calibrations obtained with ≥30 catchments. The 2.5–97.5% probability ranges are relatively large (S-exponent: 0.53–1.46; L-exponent: 0.39–1.75; PGA-exponent: 0.12–1) but do not include zero. Thus, the significance of L, PGA or S as explanatory variables for SY clearly does not depend on particular observations in the data set used.
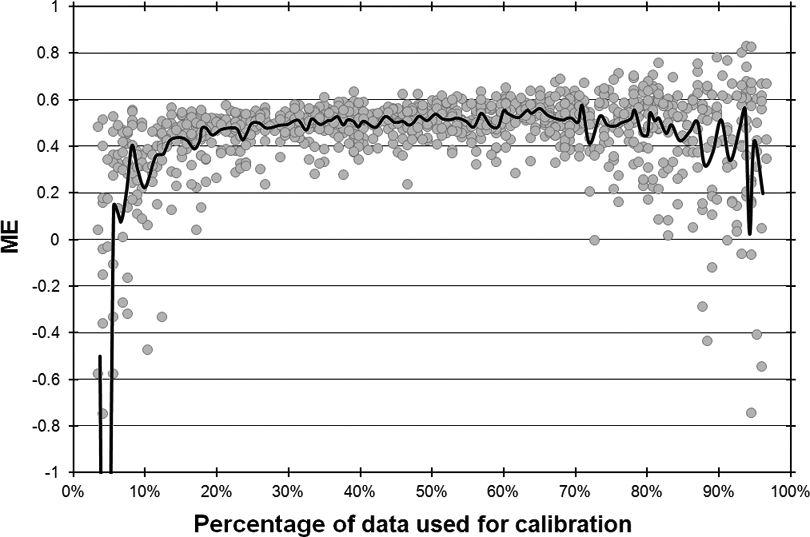
Validation model efficiency (ME; equation 2) in relation to the percentage of the original data set of undisturbed catchments that was used to recalibrate the model (see text). Each dot (n = 1000) represents the result of a single validation. The black line indicates the moving average, calculated per 10 validations.
A considerable proportion of the observed variation in SY remains unexplained by the model (equation 1). This implies that equation 1 cannot be used to exactly predict the SY of a specific catchment, but only to provide an order of magnitude indication of the expected SY. The large proportion of unexplained variance can be attributed to several reasons.
First, the observed SY data used to calibrate this model are subjected to important uncertainties. Earlier studies showed that these uncertainties pose a fundamental upper limit on the amount of variance that can be explained by a SY-model (e.g. Govers, 2011; Van Rompaey et al., 2001). These uncertainties on observed SY-values are caused by errors related to the procedures used to measure and calculate SY (e.g. Moatar et al., 2006; Phillips et al., 1999; Verstraeten and Poesen, 2002), but also by the fact that SY is commonly subject to an important interannual variability (Vanmaercke et al., 2012) while several of the used SY observations were measured over relative short measuring periods (Table 1).
Second, the variables included in the model (equation 1) also involve uncertainties. These relate not only to errors associated with the spatial data sets used to determine S, L and PGA (Table 2), but also to the fact that these variables provide only a spatially lumped estimate of the catchment topography, lithology and seismic activity. Likewise, PGA provides only a time-averaged assessment of seismic activity which may deviate from the degree of seismic activity during the SY measuring period.
Third, SY is most likely also influenced by factors that are not considered by our model. The lack of strong correlations between SY and variables that relate to spatial scale, climate or land use indicates that these factors are only of limited importance. However, more accurate measures to express these factors could potentially make a more significant contribution to the explained variance and, hence, a better model performance.
These issues not only affect the performance of the model presented in this study (equation 1) but relate to more fundamental problems that restrict the prediction capacity of all empirical models aiming at simulating erosion or SY (de Vente and Poesen, 2005; de Vente et al., 2013; Govers, 2011; Merrit et al., 2003). This is also indicated by the fact that the performance of our model (equation 1) is very similar to most other currently used regional or global SY-models (e.g. Delmas et al., 2009; de Vente and Poesen, 2005; de Vente et al., 2011, 2013; Syvitski et al., 2005; Syvitski and Milliman, 2007).
III Human impacts, seismic activity and sediment yield
The analyses above show that seismic activity significantly affects SY of small, undisturbed catchments. However, in other catchments this effect may be overwhelmed by the effects of human impacts in the catchment. To test whether seismicity remains a significant predictor of SY under a range of land use conditions, we conducted a similar analysis as describe above on a data set of 139 European small (0.84–3600 km2) catchments that represent a wide variety of land use conditions (Table 4; Figure 6).
Sources and characteristics of the European sediment yield data from the 139 catchments with detailed land use data. The numbers correspond to the numbers indicated in Figure 6. ‘Number of catchments’ indicates how many SY-values were retrieved from each reference. ‘Measuring Method’ indicates how the SY-values were determined. ‘MP’ stands for the duration of the measuring period. ‘A’ reports the (range of) catchment areas.
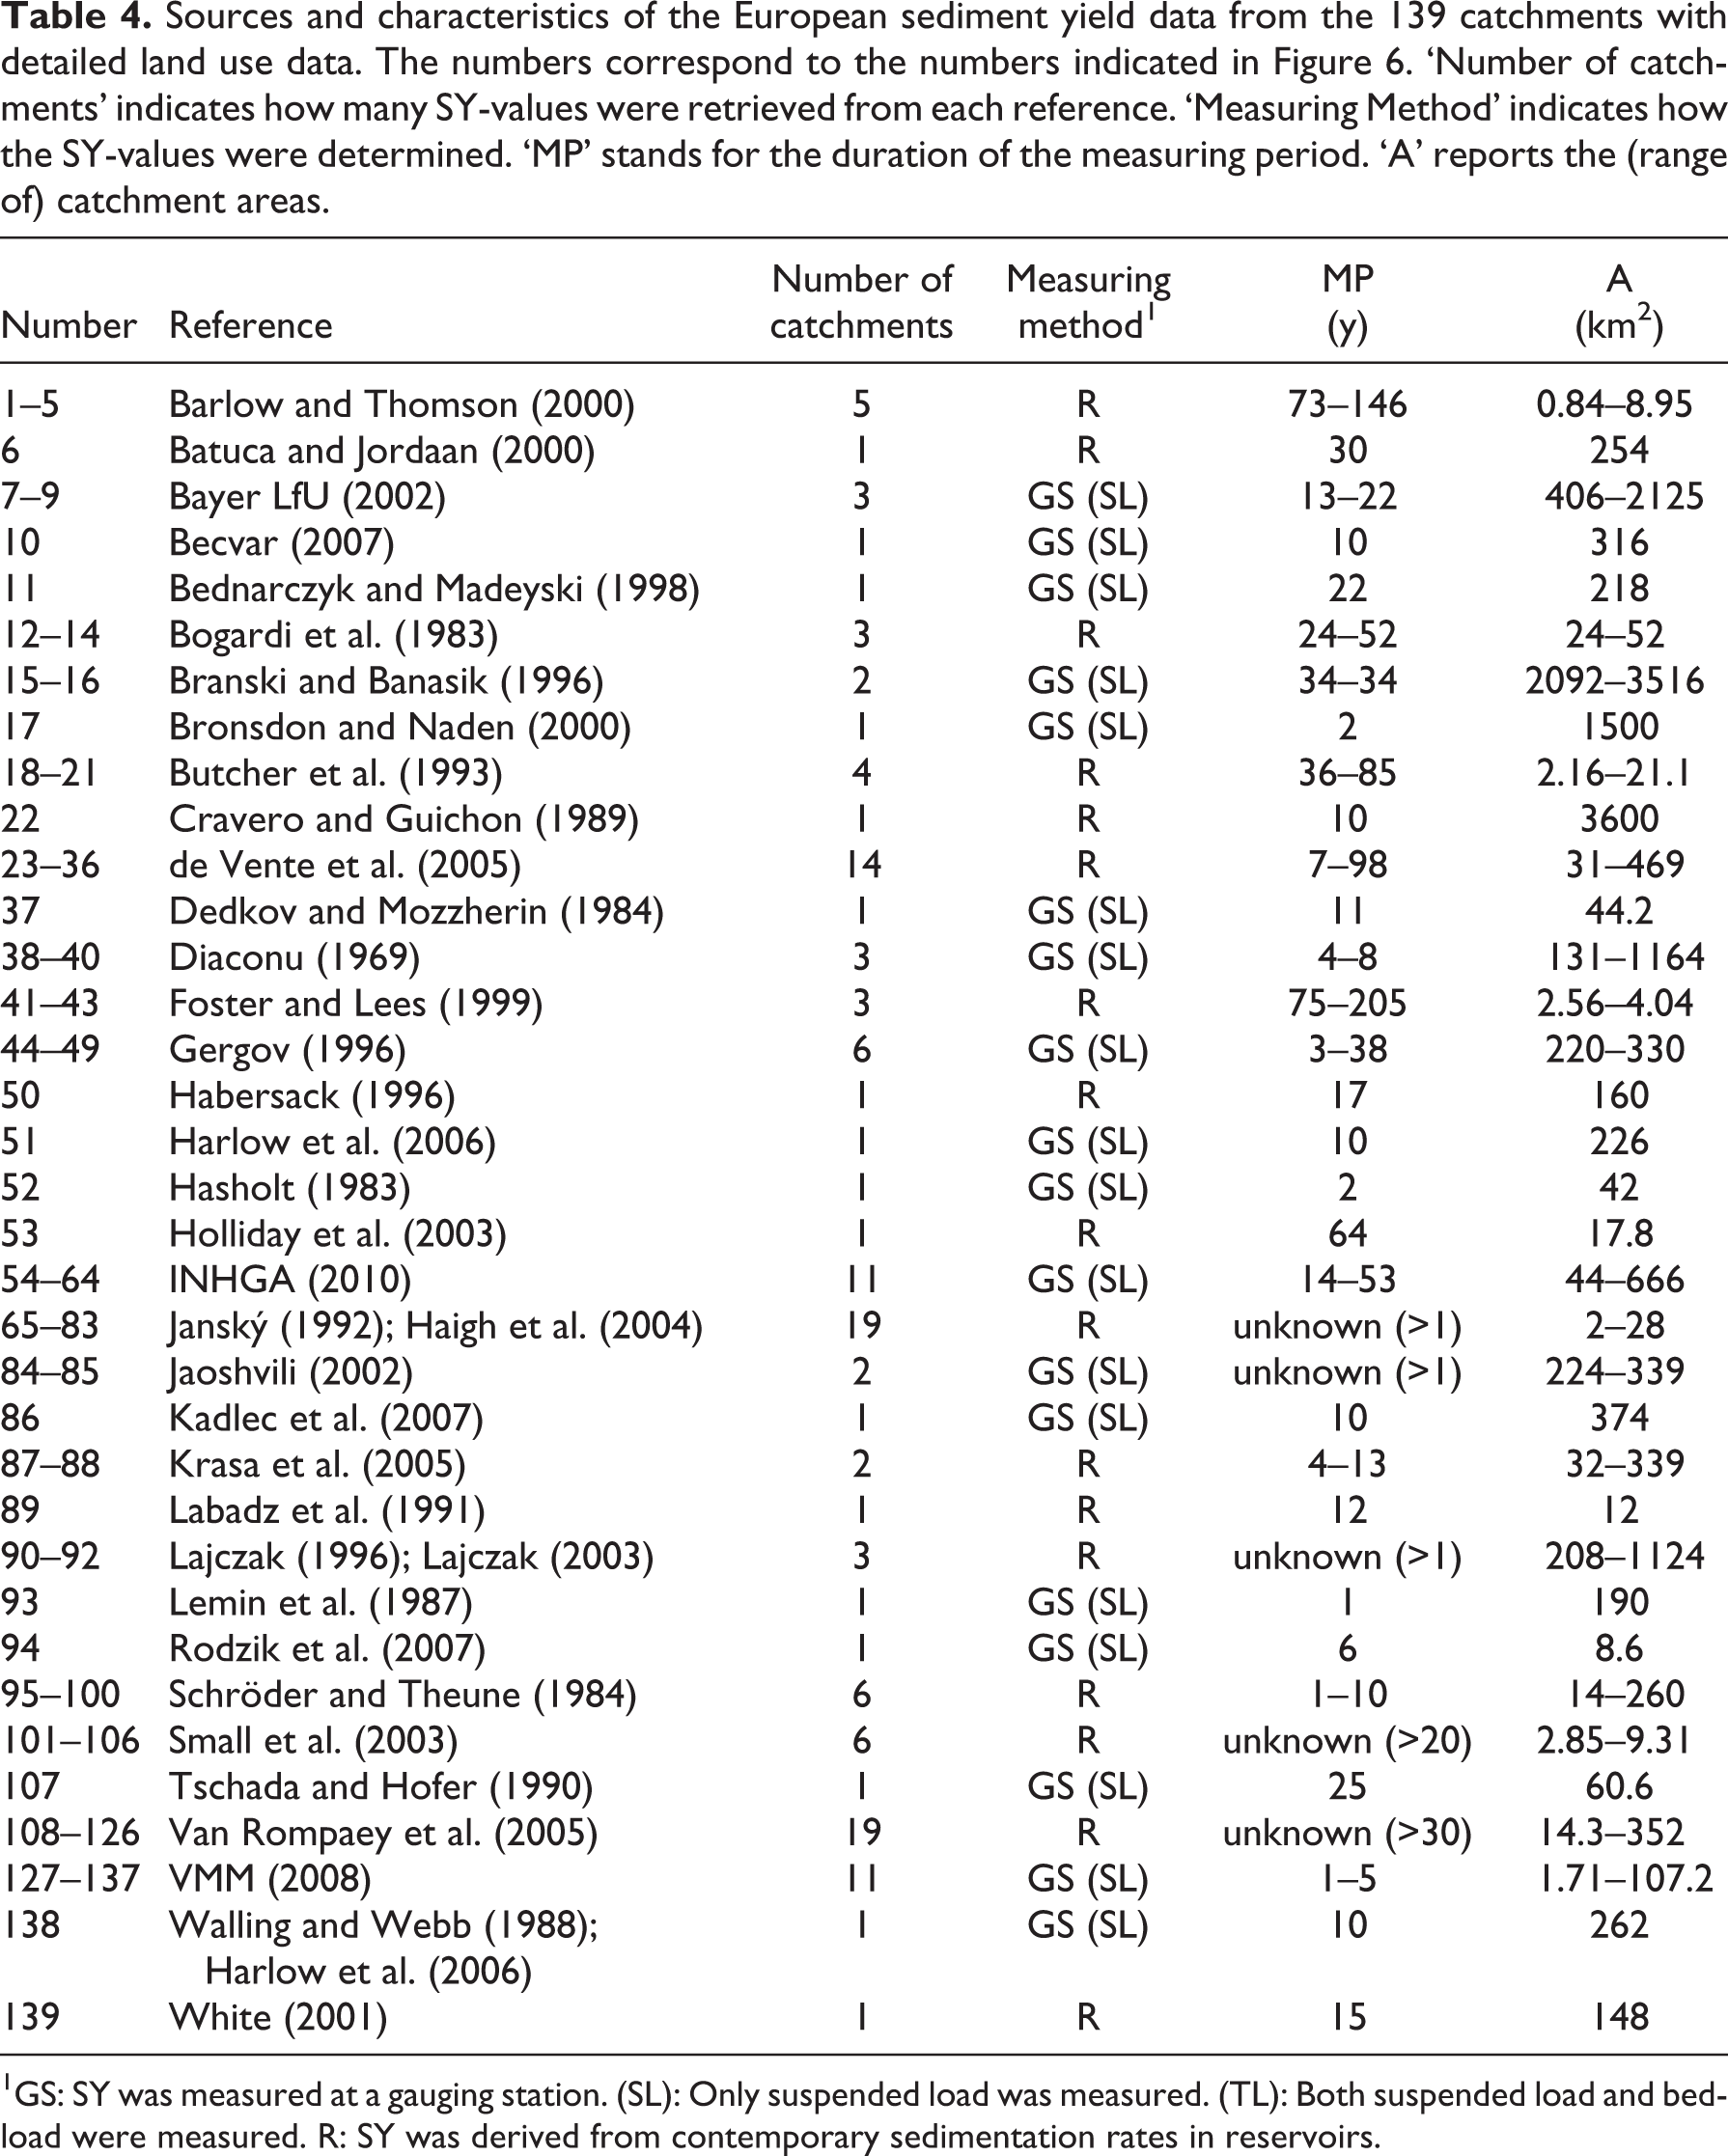
1GS: SY was measured at a gauging station. (SL): Only suspended load was measured. (TL): Both suspended load and bedload were measured. R: SY was derived from contemporary sedimentation rates in reservoirs.
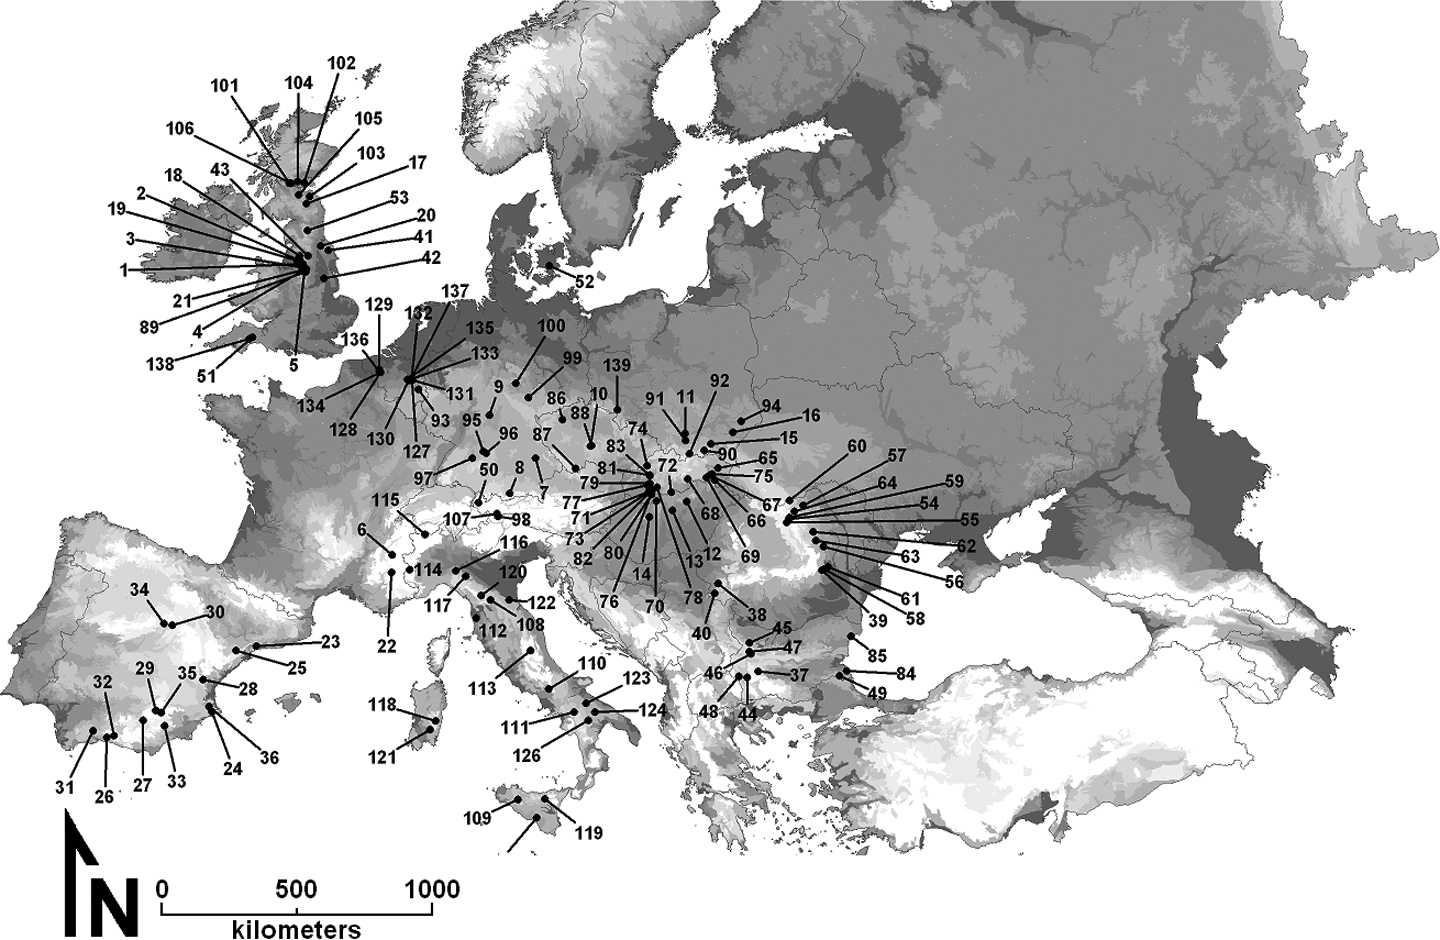
Location of the 139 European catchments with SY and detailed land use data available, covering a wide range of land use characteristics. The map indicates the outlet locations of the study catchments. Original sources and characteristics of the SY-data are given in Table 4.
These catchments were selected from an existing SY-database (Vanmaercke et al., 2011b) because their SY was not significantly affected by lakes or reservoirs and because they are covered by the CORINE land cover data set (EEA, 2010), which allowed the extraction of detailed land use characteristics. The land use of these catchments is highly variable with fractions of arable land ranging between 0 and 100%. Comparison with the GLIMS glacier database (Amstrong et al., 2005) showed that six of these catchments were partly (0.1–50 %) glaciated.
We used the same variables as those calculated for the undisturbed European catchments (see Table 2), with the exception that the categorical variable describing the land cover of the undisturbed catchments (LC) was replaced by the percentage of arable land (AL), as derived from the CORINE data set (EEA, 2010). Correlation and partial correlation analyses were conducted on this data set, using the same procedures as for the data set of undisturbed European catchments (section II.1).
Of all considered variables, PGA showed again the strongest correlation with SY (r2 = 0.28; Figure 7a; Table 5), followed by S (r2 = 0.19; Figure 7b). Also L was significantly but weakly correlated with SY (r2 = 0.06, Figure 7c), while the considered climatic variables or the fraction of arable land showed no significant correlations with SY (Figure 7d). Topography, lithology and PGA were intercorrelated. However, partial correlation coefficients indicate that each of these factors explain a significant part of the variation in SY (Table 5). After correcting for PGA, S and L, SY showed a significant Pearson partial correlation with the fraction of arable land in each catchment, suggesting that land use may indeed explain some of the variability in SY. However, this correlation is very weak and even insignificant when the Spearman partial correlation is considered (Table 5). This indicates that the importance of land use for explaining the observed variability in SY is limited compared to that of seismic activity, topography and lithology.
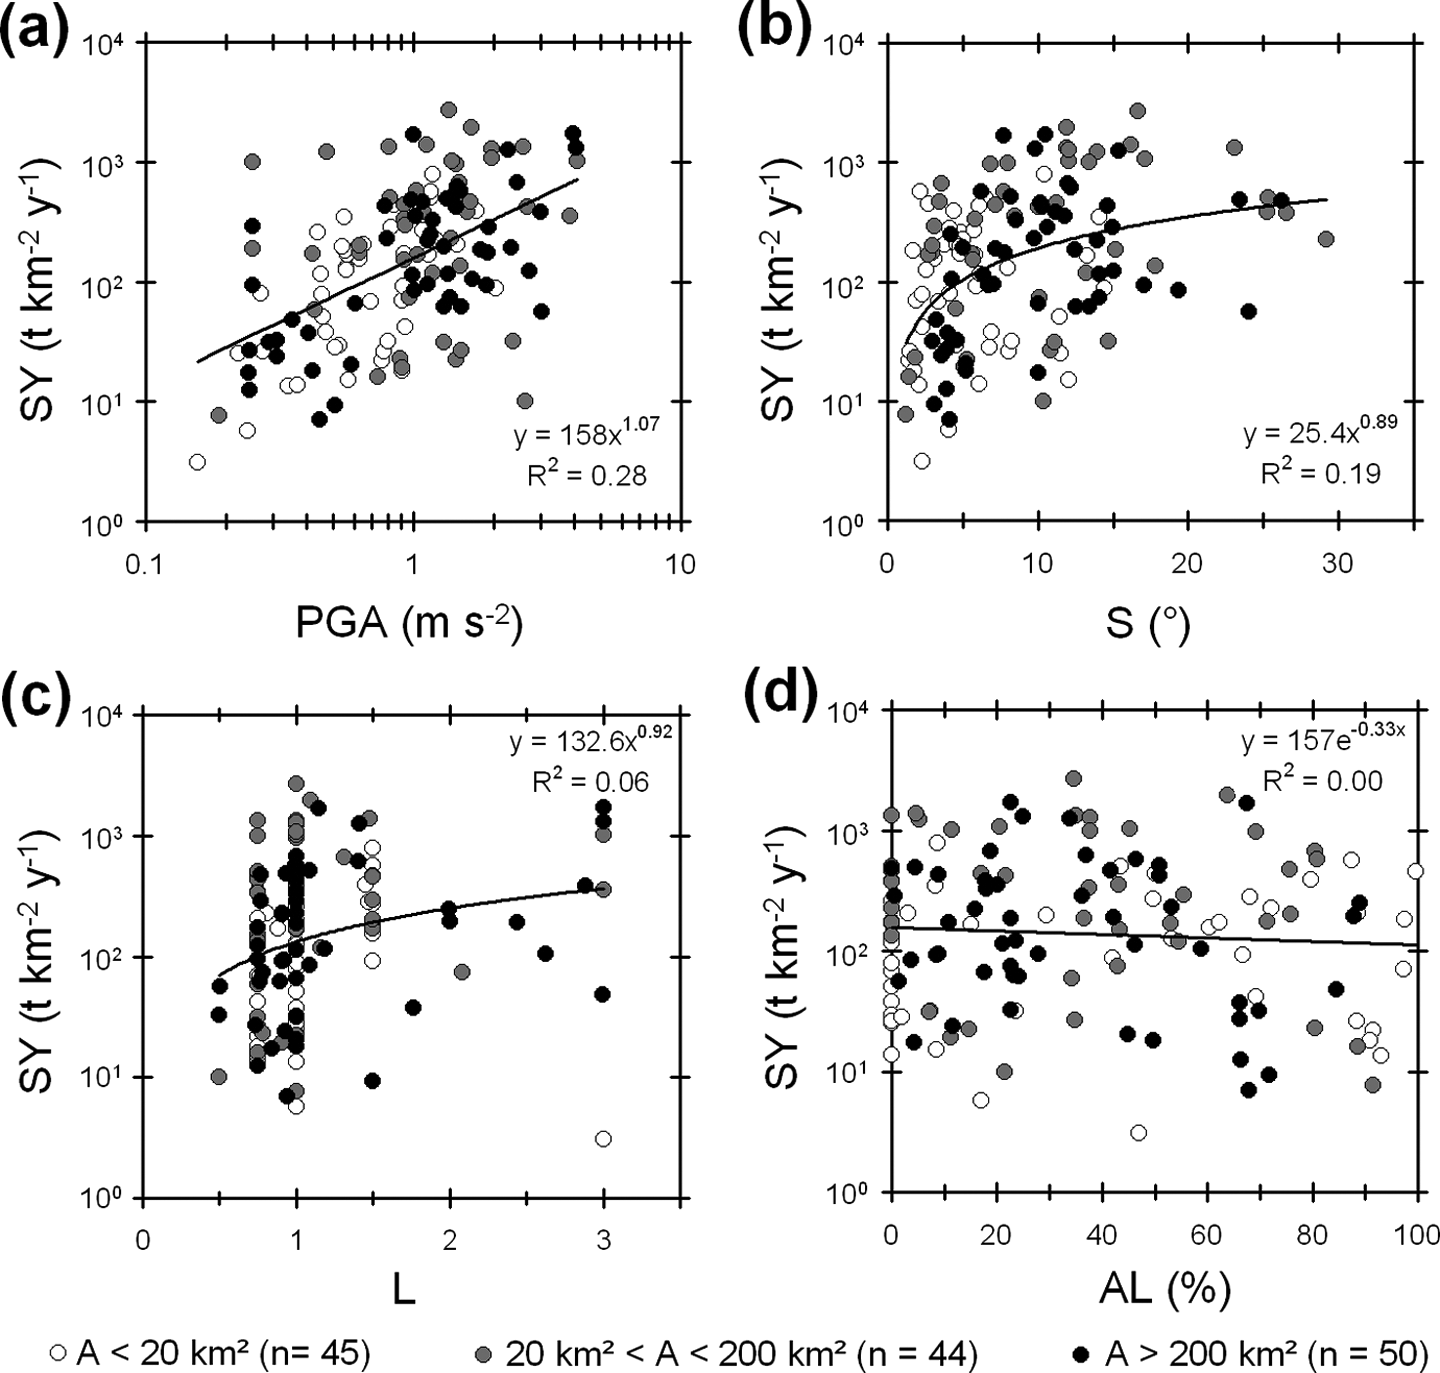
Principal results of the correlation analyses for 139 European catchments with variable land use characteristics (Figure 5; Table 4). (a) Relationship between observed sediment yield (SY) and the average peak ground acceleration (PGA) with an exceedance probability of 10% in 50 years. (b) Relationship between average catchment slope (S) and SY. (c) Relationship between the catchment lithology erodibility (L) as determined by Syvitski and Milliman (2007) and SY. (d) Relationship between the percentage of arable land in the catchment (AL) and SY. Symbols are shaded according to the drainage area (A) of the catchments.
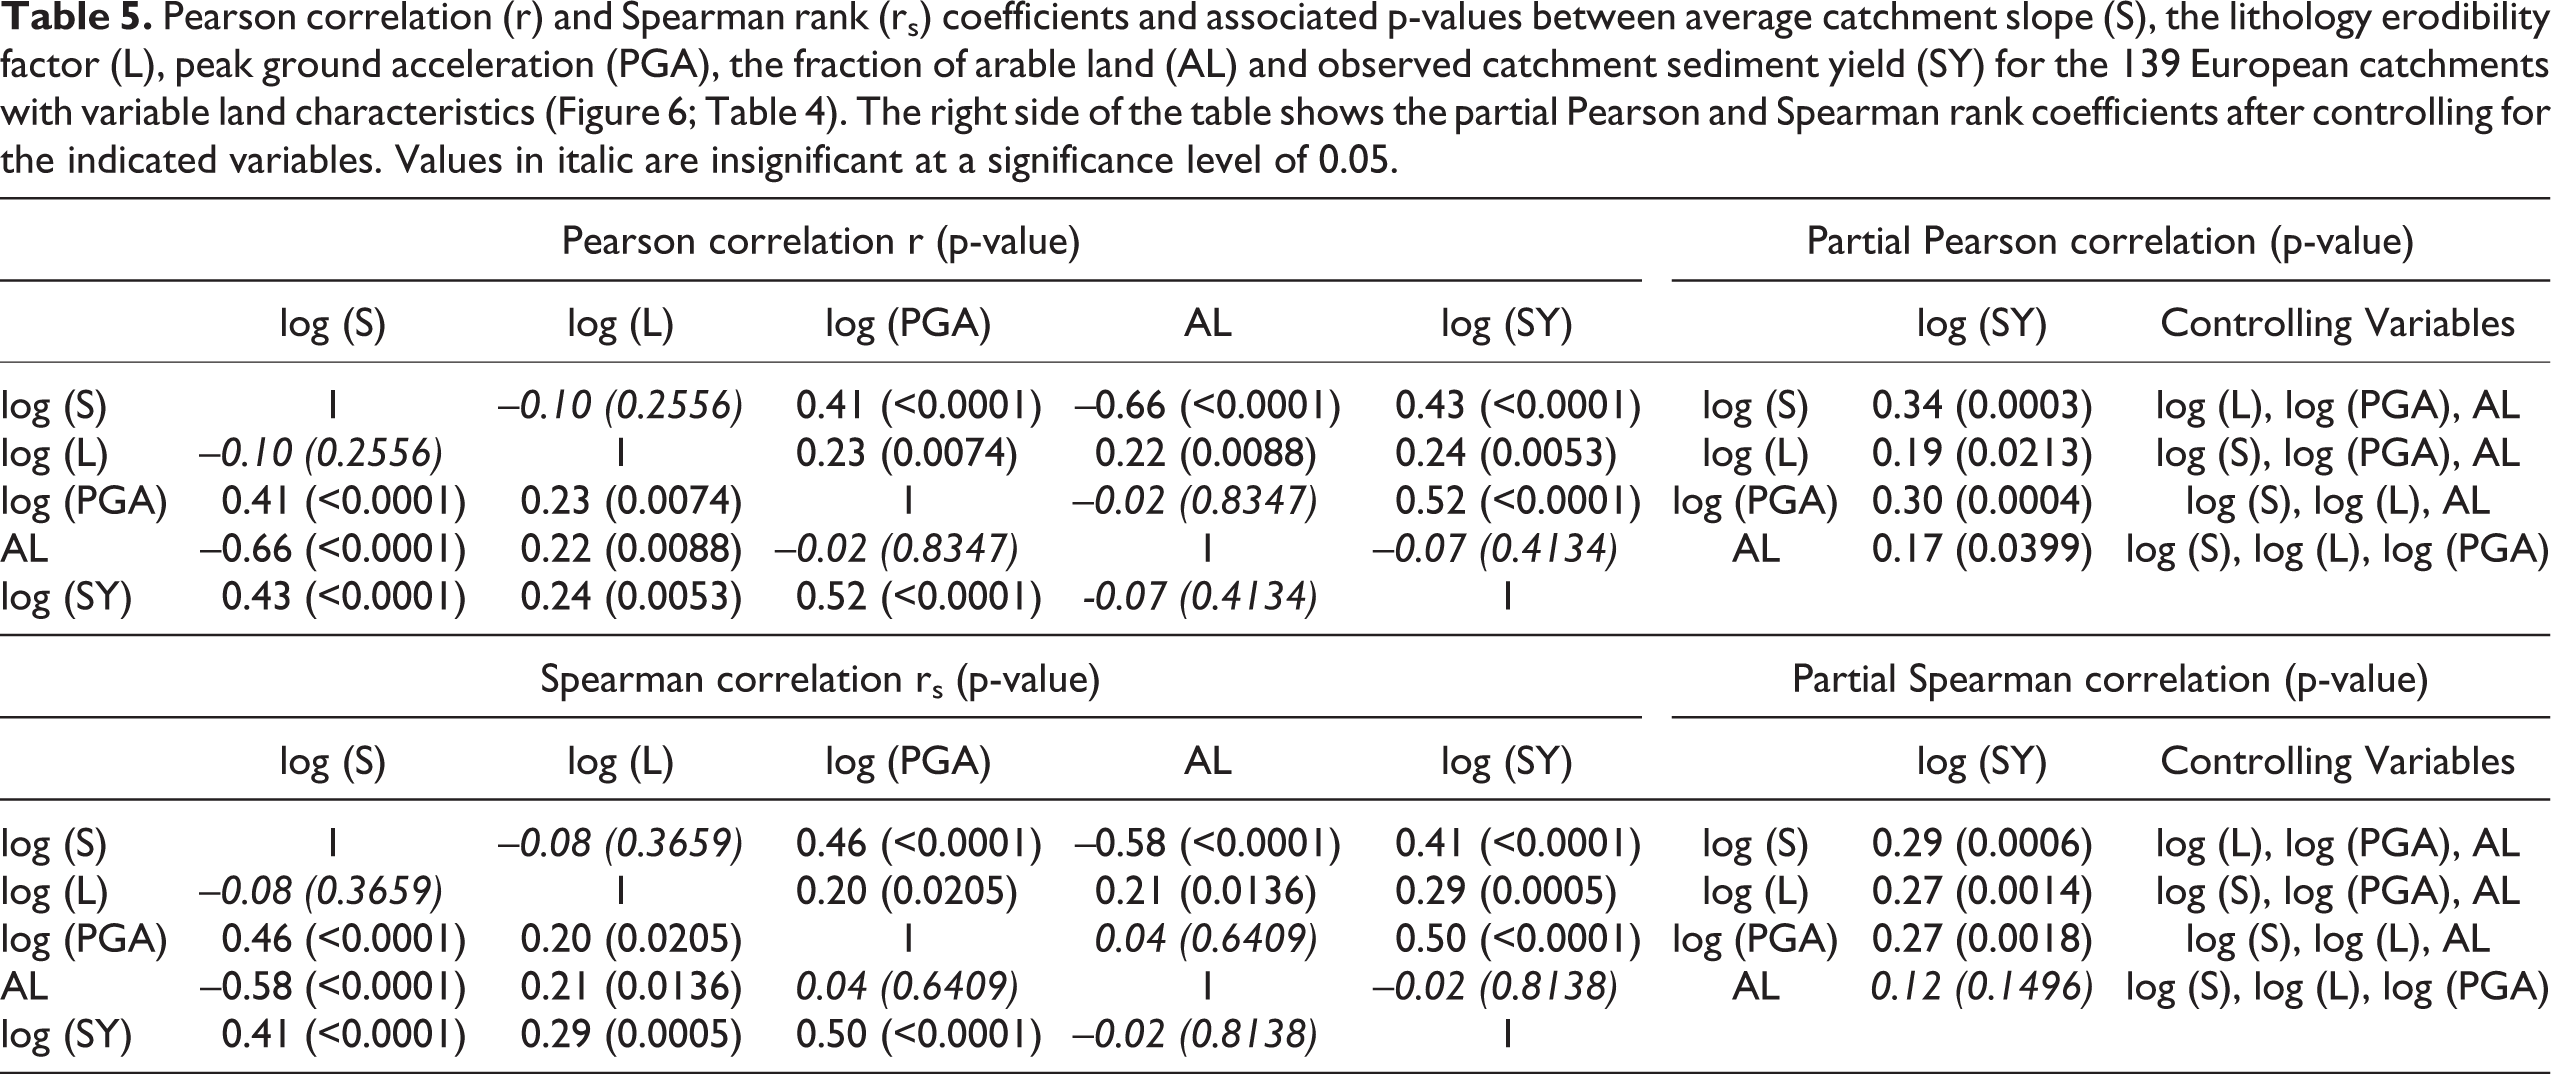
Pearson correlation (r) and Spearman rank (rs) coefficients and associated p-values between average catchment slope (S), the lithology erodibility factor (L), peak ground acceleration (PGA), the fraction of arable land (AL) and observed catchment sediment yield (SY) for the 139 European catchments with variable land characteristics (Figure 6; Table 4). The right side of the table shows the partial Pearson and Spearman rank coefficients after controlling for the indicated variables. Values in italic are insignificant at a significance level of 0.05.
IV What about large river systems?
In large river basins, fluctuations in sediment load due to earthquakes have the potential to be attenuated by alluvial sediment storage (e.g. Phillips, 2003) or averaged out by the impact of other factors that may be dominant at this scale (e.g. climate). We used a previously published global data set of 216 large (1580 – 6.15 × 10⁶ km2) river systems covering ca. 46% of the total global land mass, for which SY was measured before major dams were installed (Syvitski et al., 2005). These catchments cover most of the global variability in topography, lithology, climate, land cover and seismic activity. As for the European data sets (sections II and III), we calculated average PGA and L-values for each catchment.
Since digital elevation models with a sufficiently high resolution to calculate S were not available for all catchments, we used mean local relief (MLR) instead of S. Earlier studies showed that MLR is a robust and meaningful proxy for S at continental and global scales (e.g. Montgomery and Brandon, 2002). The MLR of each catchment was calculated based on the GTOPO30 DEM, which has a horizontal resolution of 30 arc-seconds (USGS, 2011).
PGA showed the strongest correlation with SY (r2 = 0.39; Figure 8a), while the correlation between SY and MLR was slightly weaker (r2 = 0.34; Figure 8b). L was not significantly correlated with SY (Table 6). PGA and MLR were intercorrelated (r2 = 0.54; Figure 8c). However, partial correlation analyses showed that, also for this data set, both MLR and PGA explain a significant part of the observed variation in SY (Table 6). The partial correlation coefficients further suggest that in large river basins PGA is more strongly correlated to SY than MLR (Table 6).
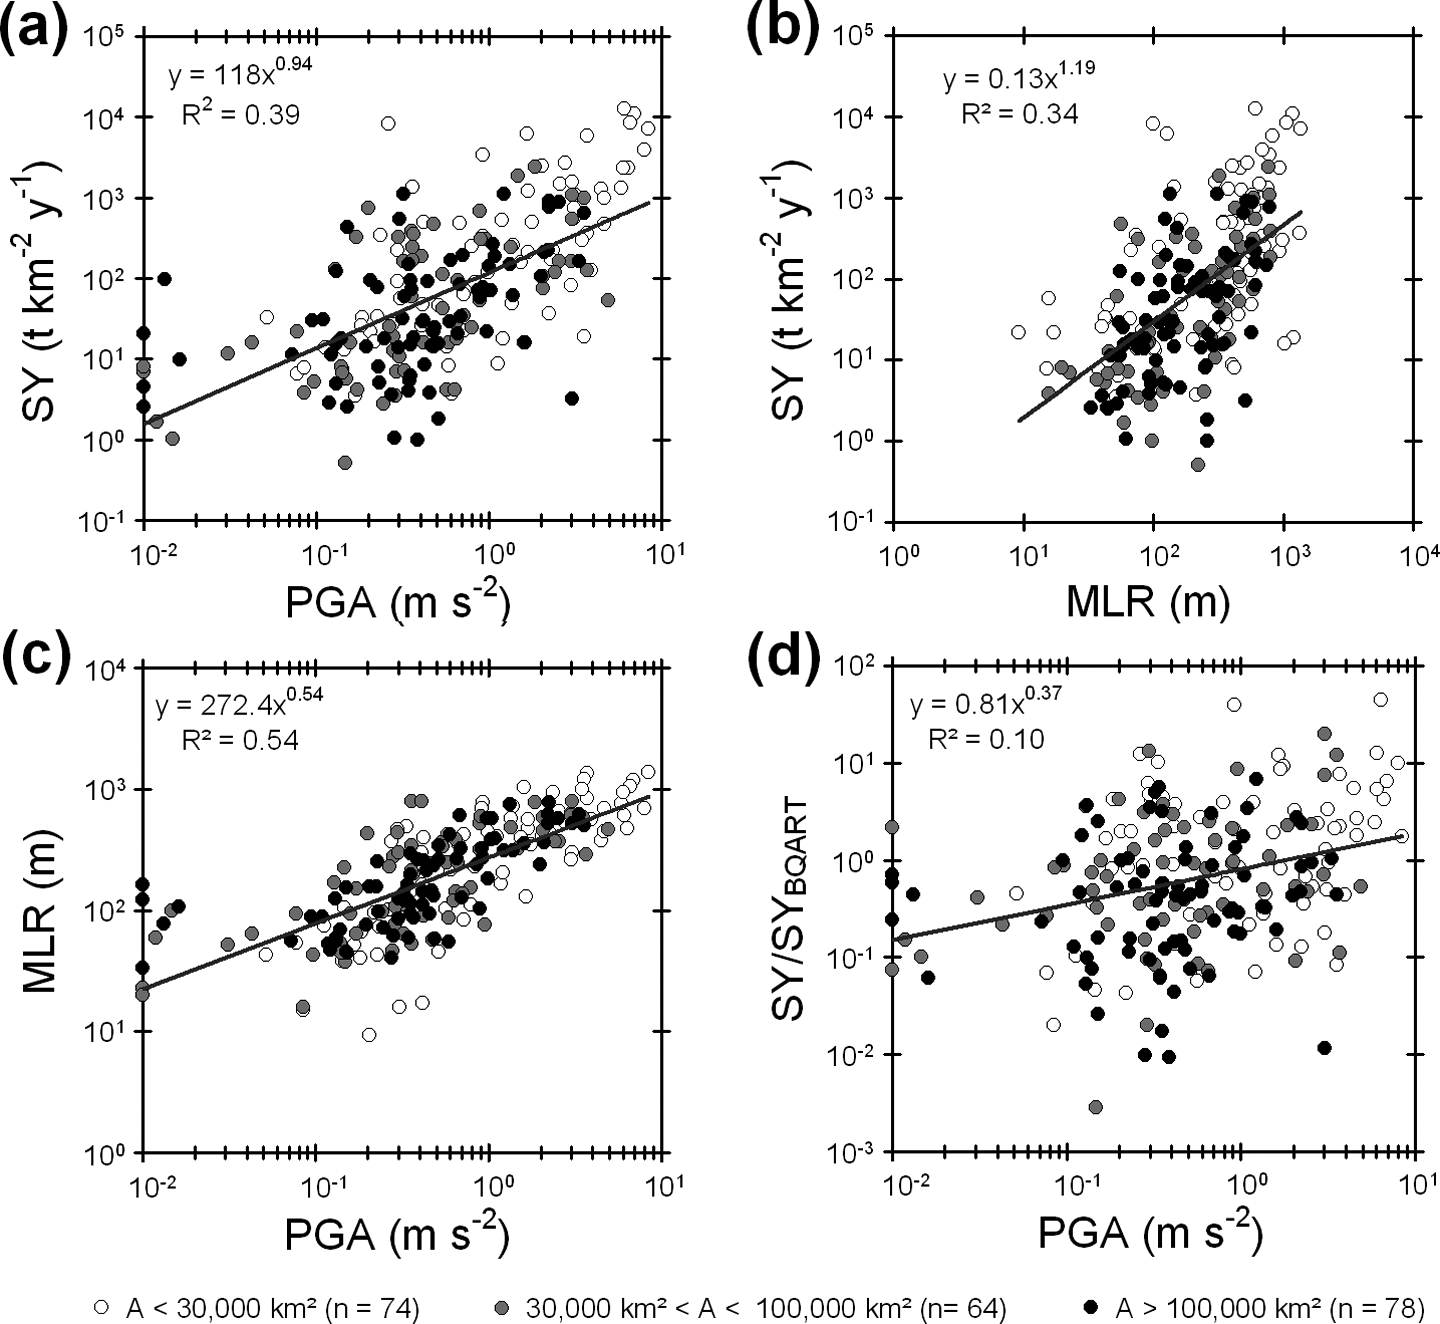
Principal results of the correlation analyses for 216 large catchments worldwide. (a) Relationship between observed sediment yield (SY) and the average peak ground acceleration (PGA) with an exceedance probability of 10% in 50 years. (b) Relationship between mean local relief (MLR) and SY. (c) Relationship between PGA and MLR. (d) Relationship between PGA and the residues of the BQART model. Residues were calculated as the ratio between SY and sediment yield values simulated by the BQART-model (SYBQART). Symbols are shaded according to the drainage area (A) of the catchments.
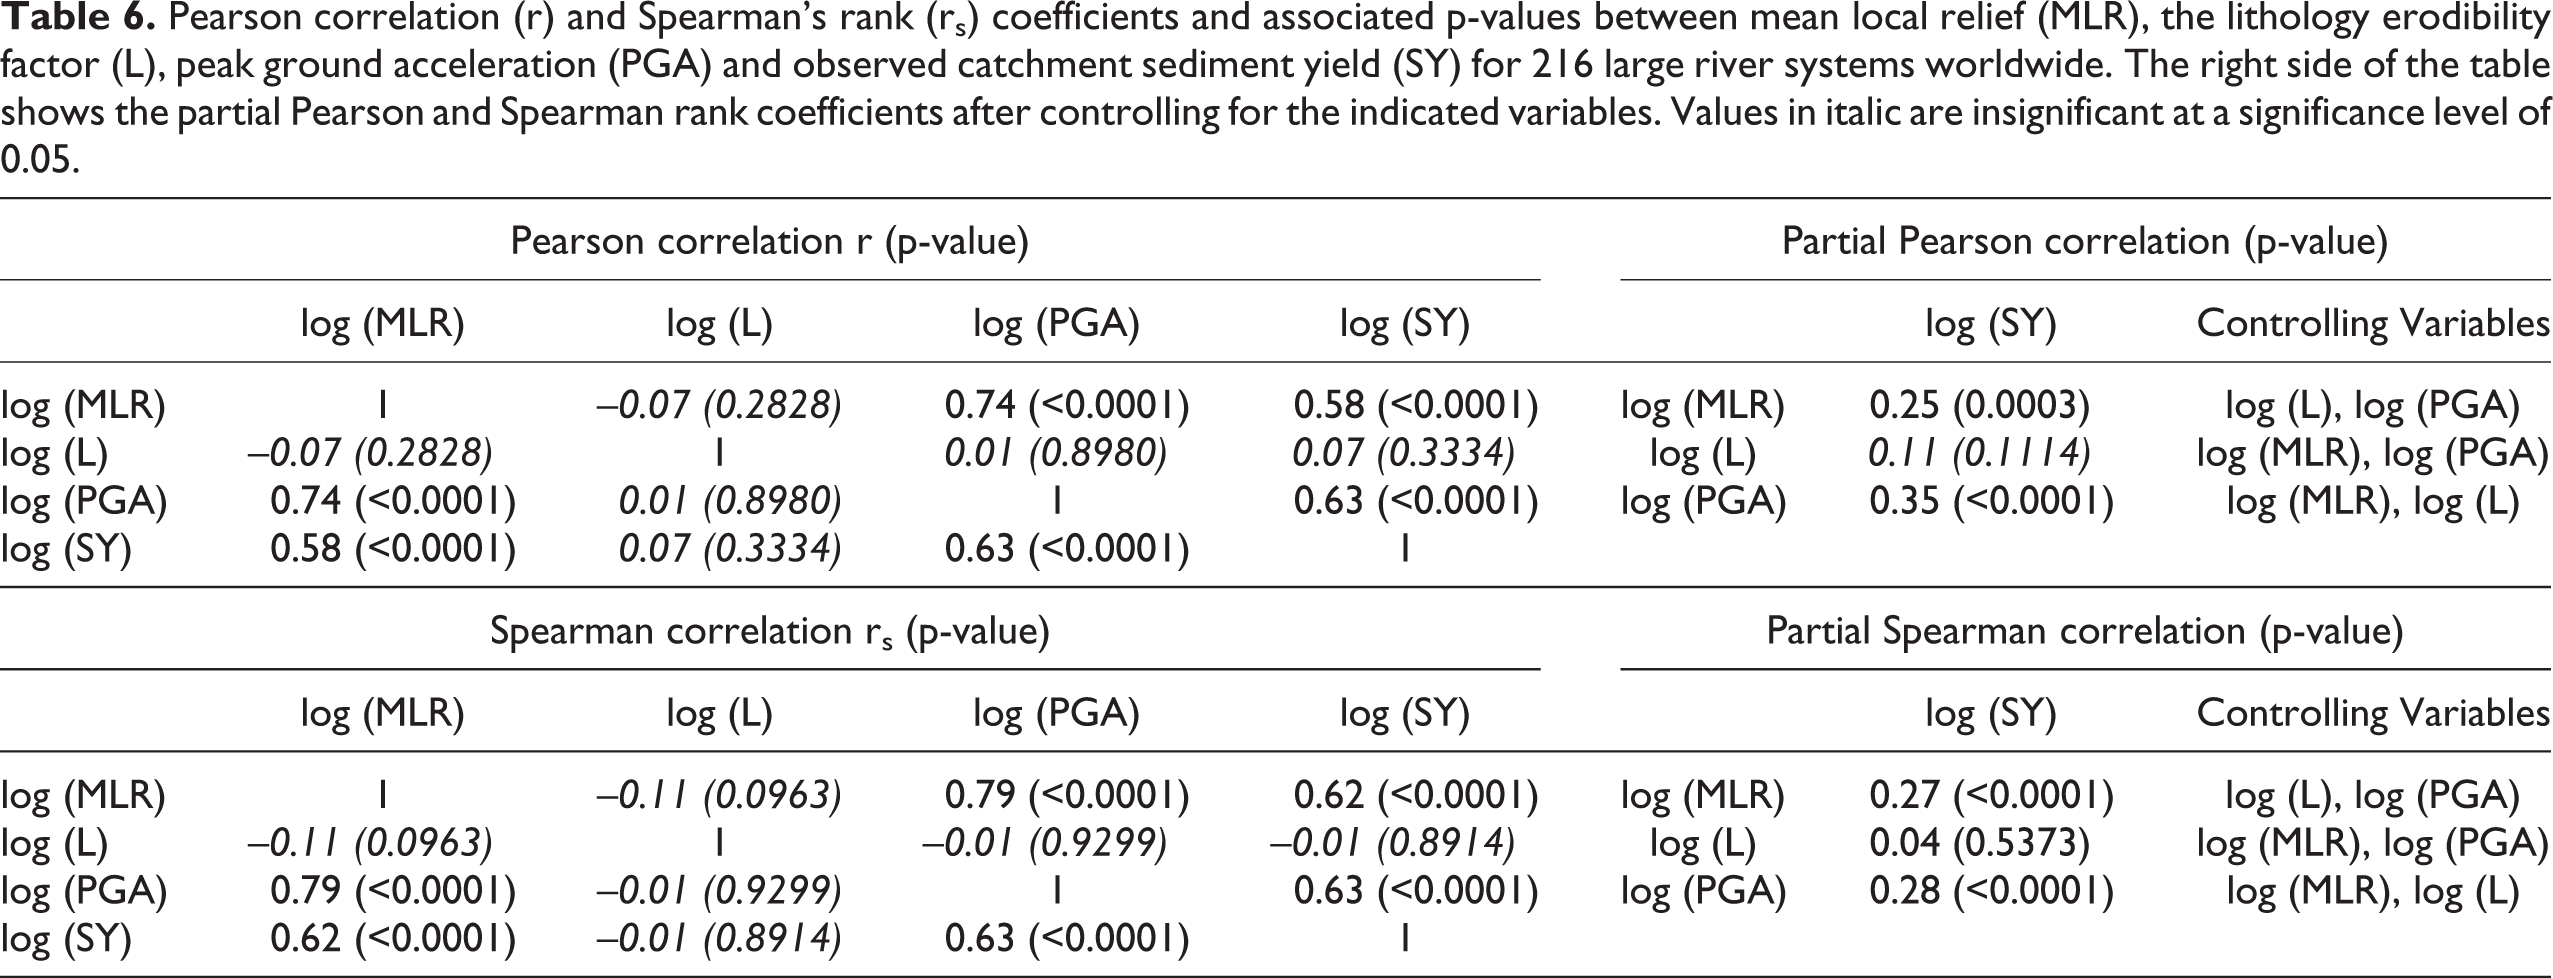
Pearson correlation (r) and Spearman's rank (rs) coefficients and associated p-values between mean local relief (MLR), the lithology erodibility factor (L), peak ground acceleration (PGA) and observed catchment sediment yield (SY) for 216 large river systems worldwide. The right side of the table shows the partial Pearson and Spearman rank coefficients after controlling for the indicated variables. Values in italic are insignificant at a significance level of 0.05.
Evidently, variation in SY at a global scale is not controlled by topography, lithology and seismicity alone. Syvitski and Milliman (2007) demonstrated that sediment fluxes at a global scale can be related to catchment area, relief, climate (expressed by the average basin temperature), runoff discharge, human impacts, the presence of glaciers and catchment lithology. The BQART-model considers these factors and allows fairly accurate predictions of sediment fluxes (for details, see Syvitski and Milliman, 2007). To test whether seismic activity remains a significant explaining factor of SY after taking all these factors into account, we applied the BQART model to our data set, which was also used to calibrate the original BQART model (Syvitski and Milliman, 2007). Relative prediction residuals were calculated as the ratio between the observed SY and the SY simulated by the BQART-model (SYBQART). These residuals show a clear and significant positive (r2 = 0.10, p < 0.0001) correlation with PGA (Figure 8d).
V The importance of seismicity for simulating sediment yield
The analyses that we described above clearly show the significant control of seismicity on the SY of a catchment, but do not quantify its effects. To do so, we developed two grid-based regression models to estimate SY. Both models were calibrated on the data set of undisturbed European catchments (Table 1; Figure 2). The first model (equation 3) is similar to the model proposed in section II.3 (equation 1) but uses MLR rather than S as a measure for relief. This resulted in the following equation (Figure 9): Calibration results of the two models used to quantify the effects of seismic activity on the spatial variation of sediment yield in Europe. The left figure shows the sediment yield simulated with equation 3 (SYTLS) versus the observed sediment yield (SY) for the data set of 146 undisturbed European catchments (Table 1; Figure 2). The right figure shows the sediment yield simulated with equation 4 (SYTL) versus SY for the same data set.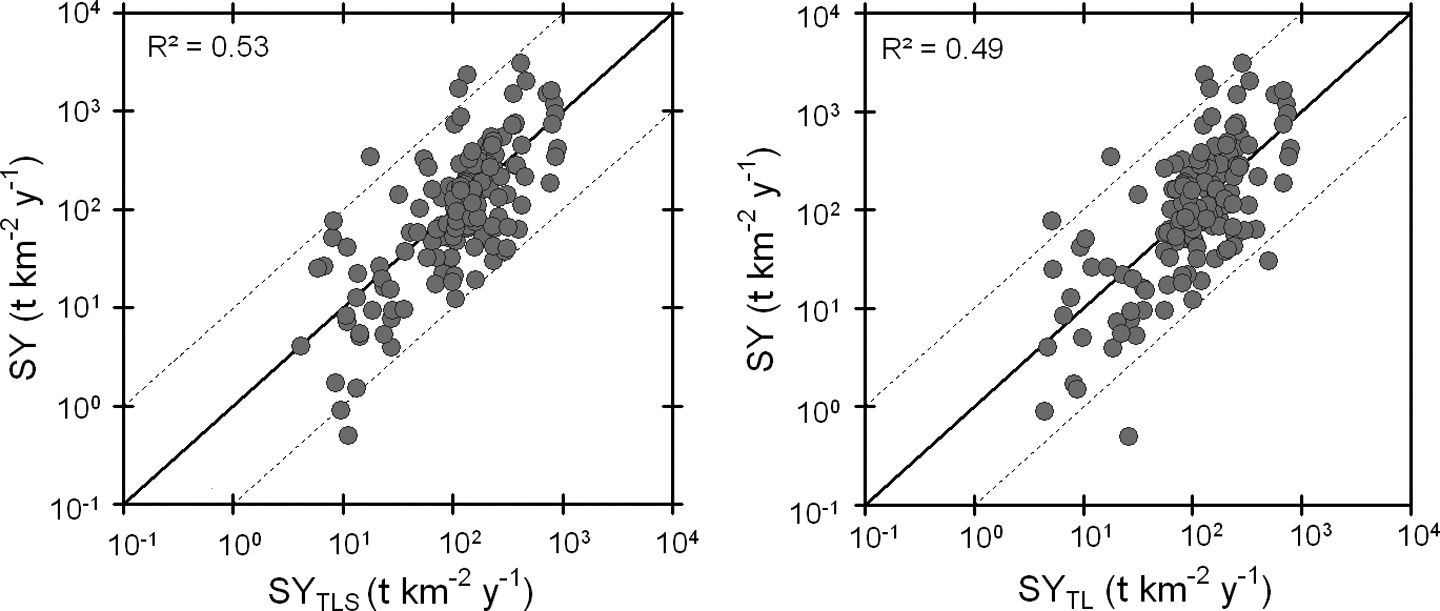

The second model only considers topography (MLR) and lithology (L) to simulate the sediment yield (SYTL, [t km-2 y-1]). Calibration results were slightly worse for this model (Figure 9):
Lithology (L) and seismicity (PGA) data sets were both resampled at a horizontal resolution of 30’, i.e. the same resolution as the MLR data set. Next, we applied both models (equation 3 and equation 4) to each pixel of the European continent and determined the ratio between SYTLS and SYTL (Figure 10). We only retained those pixels with an SYTLS-value between 10 t km-2 y-1 and 1000 t km-2 y-1 as this was the original range for which the model (equation 3) was calibrated (Figure 9).
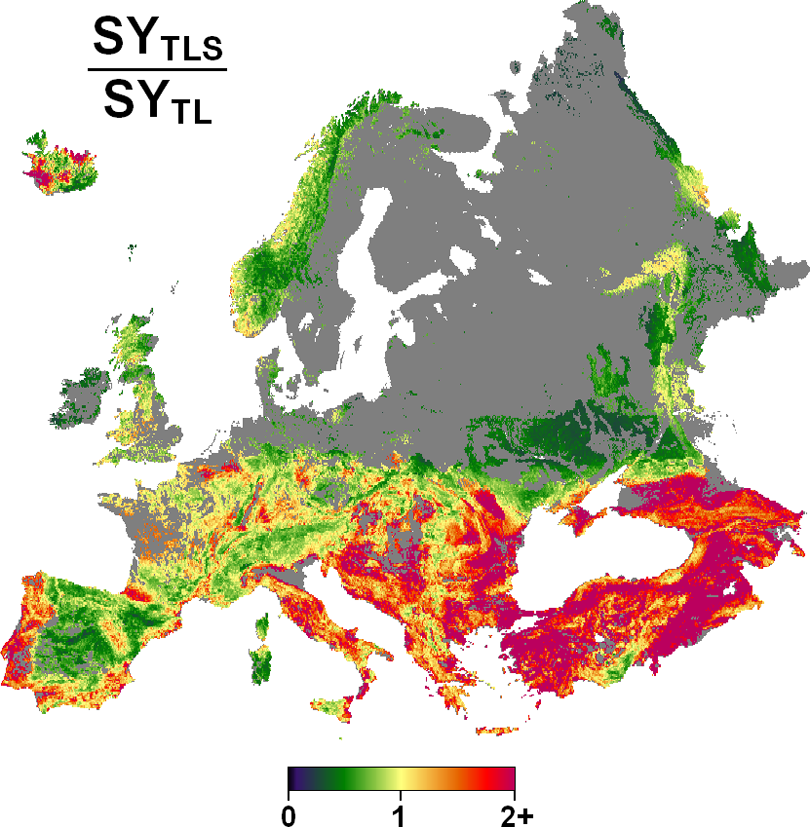
Estimated effect of seismic activity on sediment yield in Europe. The map shows the ratio of predicted sediment yield, based on a regression model that includes seismic activity (SYTLS; equation 3) and a model that does not (SYTL; equation 4). The model without seismic activity implicitly assumes that tectonic effects on SY are fully reflected by mean local relief and lithology. This latter model overestimates SY in the green regions and underestimates SY in the red regions compared to the model that also considers seismic activity. Pixels for which the SYTLS-values are less than 10 t km-2y-1 or larger than 1000 t km-2y-1 (i.e. the range of the predicted SYTLS-values during model calibration; see Figure 9) are indicated in grey.
The values obtained by applying equations 3 and 4 to the pixel scale are not necessarily representative for SY-values of catchments at this location (e.g. because the potential effects of sediment deposition within larger catchments are not considered by this approach). Nonetheless, we found that for the considered data set (Table 1; Figure 2), the modeled SY-values obtained by aggregating the SYTLS-values of all pixels in the catchment corresponded almost perfectly with the SY-values obtained by applying equation 3 to spatially lumped L, PGA and MLR values at the catchment scale (y = 0.94x1.02; r2 = 0.97; n = 146). Moreover, errors resulting from the assumption that each pixel corresponds to a catchment will affect both models. Since Figure 10 only considers the ratio of the two models, the obtained spatial pattern is most likely not heavily affected by the assumption that pixels are representative for catchments.
Figure 10 illustrates the importance of explicitly including seismic activity in models aiming to simulate SY at a regional scale. Although the overall performance of the model without PGA (equation 4; r2 = 0.49) was only slightly worse than that for the model including PGA (equation 3; r2 = 0.53), the simulated patterns in sediment yield are clearly different. Not including seismicity could lead to estimations of SY that are twice as high in areas where seismic activity is relatively limited compared to the topography (e.g. the Alps and Pyrenees; Figure 10). On the other hand, SY in tectonically active areas (e.g. Caucasus, Anatolia and the eastern Mediterranean region) may be underestimated by a similar factor. Thus, while accounting for seismic activity may result in small but significant improvements of prediction accuracy for individual catchments, taking into account these seismic effects becomes highly relevant when considering spatial patterns of sediment fluxes at the regional level.
The spatial pattern that can be seen on Figure 10 is subject to uncertainties. These uncertainties cannot be quantified exactly as they depend on unknown uncertainties in the data used (SY, MLR, L and PGA) as well as on uncertainties in model parameterization. We did test, however, whether the simulated spatial pattern of the seismic effects on SY depended on the presence or absence of catchments from a specific region in our data set. This was done by excluding catchments from regions for which we had at least 10 SY-observations (i.e. the Alps, Caucasus, England/Ireland and the Carpathians; see Figure 2) and recalibrating both models (equations 3 and 4) using the remaining catchments. Next, these recalibrated models were applied to the catchments of the excluded region. Based on these four alternative model calibrations, we found that leaving out a specific region had only a minor effect on the SYTLS/SYTL ratios (generally <20% deviation; Figure 11). Thus, the patterns presented in Figure 10 are robust and do not depend on the presence or absence of SY-observations from a specific region.
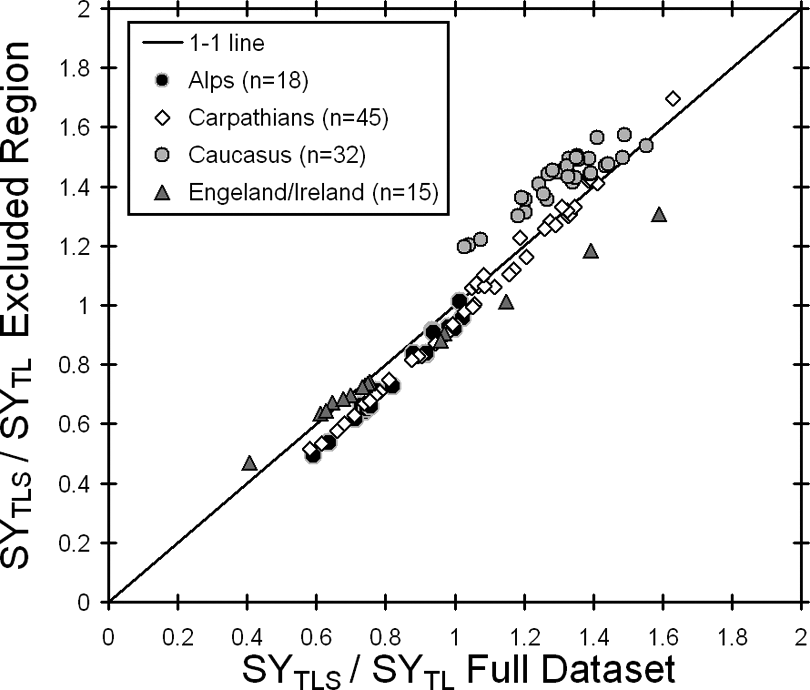
Comparison between the modelled effects of seismic activity on catchment sediment yield when the entire data set of 146 undisturbed catchments is considered (SYTLS/SYTL Full Dataset) and the same modelled effect when catchments from one specific region (i.e. the Alps, Carpathians, Caucasus or England/Ireland) are not considered for the model calibration (SYTLS/SYTL Excluded Region). Each time, SYTLS/SYTL–ratios are plotted for the catchments of the region that was not considered for the model recalibration.
VI Conclusions and implications
Our analyses of three distinct data sets show that seismic activity has a significant impact on contemporary sediment yields. This effect is robust and not attributable to intercorrelations with topography, lithology or other factors controlling SY. While topographical measures and seismicity are statistically related, their effect on SY is at least partly independent. This has important implications for our understanding about sediment fluxes and their sensitivity to human impacts, as well as for our understanding about landscape evolution.
The signficance of human impact on SY in relation to climate, geology and topography is an important topic of discussion (e.g. Dearing et al., 2006; Meybeck, 2003; Syvitski and Milliman, 2007; Walling, 2006). This study points out that seismic activity cannot be neglected in this context. Even for catchments with widely varying degrees of human impact and climatic conditions, seismic activity shows a highly significant correlation with SY. Moreover, observed correlations between SY and seismicity were clearly more significant than between SY and land use or climate. One of the possible reasons for the persistence of this seismic signal may be positive interactions between land use changes and the landscape’s sensitivity to the effects of seismicity. For example, deforestation can lead to a significant increase in landsliding (e.g. Sidle et al., 2006) which may be relatively more important in areas subject to earthquakes compared to seismically stable areas. Likewise, gully erosion is often triggered by agricultural activities and stock breeding (e.g. Poesen et al., 2003). However, Cox et al. (2010) have shown that the distribution of Lavakas (large erosional gullies) in Madagascar is mainly explained by local differences in seismic activity. The mechanisms that explain this strong correlation are currently poorly understood (Cox et al., 2010). Our results further indicate that the relationship between land use changes, seismic activity and various erosion processes should be a focus of further research.
A crucial issue in estimating human impacts on SY is assessing the baseline SY of a catchment, i.e. the SY that can be expected before the catchment was altered by human impacts (e.g. Dearing et al., 2006; Syvitski et al., 2005). The model presented in this paper (equation 1) allows estimating baseline SY-values for small catchments in central and western Europe. It is also the first model to explicitly account for the effects of seismic activity on SY. Based on this model, we demonstrated that explicitly considering seismic activity may lead to SY-estimates that easily deviate 100% (factor 2) or more from estimates that do not explicitly consider seismic activity (Figure 9). Such deviations are comparable in magnitude to what may be expected from human disturbance by deforestation and/or conversion to arable land (e.g. Verstraeten et al., 2009).
We further showed that seismicity not only affects the SY of small catchments but also has an influence on large river systems worldwide. This cannot be explained by the effect of individual large earthquakes, as the response of large river systems to such an event will be most likely buffered or averaged out. However, although local shifts in seismic activity can occur over relatively short periods of time (e.g. Fuchs et al., 1979), spatial variation in average seismic activity at a (sub)continental scale may be expected to occur at timescales similar to those of changes in plate tectonic configurations. Such configurations can be considered to be stable for periods of well over 20,000 years (e.g. Roberts et al., 2004). The alluvial sediment residence time in large river systems is estimated to be less than 20,000 years (e.g. Dosseto et al., 2008). Thus, sustained regional seismic activity should also be reflected in the SY of large river systems, provided that the effect is sufficiently large in comparison to other factors. Our results show that this is indeed the case and that a SY model can indeed be significantly improved by including variables that describe seismic activity as an independent controlling factor of SY.
Since regional patterns of seismicity are generally constant over long time periods and processes related to seismicity can directly affect sediment production, seismic controls on sediment fluxes may also be relevant over longer timescales. Current long-term erosion and landscape evolution models only consider tectonic uplift as a controlling factor (e.g. Montgomery and Brandon, 2002; Tucker and Hancock, 2010). However, there are several plausible mechanisms that may causally link seismic activity directly to sediment fluxes, e.g. by triggering mass movements (e.g. Dadson et al., 2004; Hovius et al., 2011; Howarth et al., 2012; Parker et al., 2011) and/or by weakening surface lithology (e.g. Koons et al., 2012; Molnar et al., 2007). As recent studies indicated (e.g. Parker et al., 2011), it may therefore be worthwhile to also consider seismic activity as an independent driver of landscape evolution.
Understanding the different mechanisms that determine the correlation between seismicity and sediment fluxes remains an important challenge. For example, disentangling the roles of seismic activity and tectonic uplift will be difficult given the fact that uplift and earthquakes often strongly correlate in space and time. Future studies may improve our analyses by explicitly considering tectonic uplift and/or alternative measures of seismic activity as a potential controlling factor of SY. Likewise, studying sediment fluxes and landscape evolution in areas with contrasting tectonic regimes (e.g. areas where uplift is due to isostatic rebound versus areas along major strike-slip faults) may strongly increase our comprehension.
Above all, our analyses show that seismic effects on SY are not restricted to specific geomorphic and tectonic settings. While previous studies have shown that seismicity affects SY in steep and tectonically highly active mountain ranges (e.g. Dadson et al., 2004; Hovius et al., 2011; Howarth et al., 2012), our results demonstrate that this is also true for areas with a much more moderate relief and much lower levels of seismic activity. The effect of seismicity is present over the whole range of PGA values studied: also differences in seismicity between catchments characterized by low to moderate seismicity are reflected in different SY-values. Recent studies have demonstrated that, due to their vast extent, areas with a gentle to moderate relief (i.e. MLR < 1000 m) have a dominant impact on the global sediment flux to oceans (Kirchner and Ferrier, 2013; Willenbring et al., 2013). However, the very large spatial variability in denudation rates within these lower regions remains currently poorly understood (Willenbring et al., 2013). As this study demonstrates, regional differences in seismic activity may be of crucial importance for this variability.
Footnotes
Acknowledgements
The research described in this paper was conducted within the framework of the EC-DG RTD 6th Framework Research Programme (sub-priority 1.1.6.3) – Research on Desertification, project DESIRE (037046): Desertification mitigation and remediation of land – a global approach for local solutions. The authors wish to thank everyone who provided sediment yield data for this study, as well as the anonymous reviewers for their constructive comments.
Funding
M. Vanmaercke received grant-aided support from the Research Foundation – Flanders (FWO), Belgium.