
Abstract
Digital photogrammetry has experienced rapid development regarding the technology involved and its ease of use over the past two decades. We revisit the work of Jim Chandler who in 1999 published a technical communication seeking to familiarise novice users of photogrammetric methods with important theoretical concepts and practical considerations. In doing so, we assess considerations such as camera calibration and the need for photo-control and check points, as they apply to modern software and workflows, in particular for structure-from-motion (SfM) photogrammetry. We also highlight the implications of lightweight drones being the new platform of choice for many photogrammetry-based studies in the geosciences. Finally, we present three examples based on our own work, showing the opportunities that SfM photogrammetry offers at different scales and systems: at the micro-scale for monitoring geomorphological change, and at the meso-scale for hydrological modelling and the reconstruction of vegetation canopies. Our examples showcase developments and applications of photogrammetry which go beyond what was considered feasible 20 years ago and indicate future directions that applications may take. Nevertheless, we demonstrate that, in-line with Chandler’s recommendations, the pre-calibration of consumer-grade cameras, instead of relying entirely on self-calibration by software, can yield palpable benefits in micro-scale applications and that measurements of sufficient control points are still central to generating reproducible, high-accuracy products. With the unprecedented ease of use and wide areas of application, scientists applying photogrammetric methods would do well to remember basic considerations and seek methods for the validation of generated products.
I Introduction
In his technical communication published in 1999, Jim Chandler (1999) identified and compiled key considerations for the application of digital photogrammetry in geomorphology. Indeed, his paper was written when automated techniques implemented in readily available software were enabling the application of digital photogrammetry by non-experts for the first time, at a relatively low financial cost, with great potential to deliver “primary data necessary for morphological representation at all scales, using the digital elevation model” (Chandler, 1999: 51). Observing this development, Chandler published recommendations to guide non-expert users towards successful application of the method, recognising that tie points identified from images had the potential to provide a much higher sampling rate than can be achieved realistically from conventional methods such as total stations or digital tacheometers. Chandler’s recommendations include a number of basic considerations that are applicable to photogrammetry at any scale, such as the importance of camera calibration and understanding its effect on the result, as well as the need for control points to constrain the results to a desired reference coordinate system, and the necessity for check points to evaluate accuracy. He also presented effective solutions for using oblique-view imagery captured from a proximal ground-based system.
Since Chandler’s paper in 1999, there have been considerable developments in the discipline of digital photogrammetry, first among which is the operational implementation (and now the subsequent widespread application) of structure-from-motion with Multi-View Stereopsis photogrammetry (SfM–MVS, often abbreviated to just “SfM”). SfM photogrammetry represents a more flexible approach to photogrammetric scene reconstruction, as, unlike conventional stereo photogrammetry, the camera pose and position can be derived using image data alone, without the explicit need for reference points of known three-dimensional (3D) position in the imaged scene (Westoby et al., 2012).
Despite recent developments in photogrammetry, and as evidenced through this special issue, no less, there are still a great number of Chandler’s (1999) original considerations and recommendations that remain highly relevant to scientists seeking to apply photogrammetric methods today. The purpose of this short paper is to “revisit” some of Chandler’s key points and to demonstrate their relevance to the contemporary digital SfM photogrammetry workflow. There are certainly some difficulties highlighted by Chandler (1999), which have now been addressed effectively by advancements in software, computing capacity and algorithms; however, we argue that there are other challenges identified by Chandler (1999) that have been accentuated by the very same developments. Importantly, the short format of this “classics revisited” paper does not permit an in-depth analysis of the complexities of new developments in photogrammetry for the geosciences – for such matters, we redirect readers to the contents of this special issue, and to the excellent syntheses that already exist (see Micheletti et al., 2015; Smith et al., 2015; Westoby et al., 2012). Instead, we focus on a few specific aspects of Chandler’s (1999) work to show, through the lens of recent application areas, the considerable recent advancements that have benefited physical geography. This includes the application to systems for which these methods may have originally seemed unsuited. Our discussion begins with Chandler (1999), but we chart progress beyond geomorphology, demonstrating how many of Chandler’s points of consideration still hold relevance, across a broad suite of disciplines.
II Photogrammetric considerations today
Advancement of photogrammetric workflows and especially the shift towards the usage of SfM photogrammetry for applications provides the motivation to reassess Chandler’s (1999) recommendations for non-expert users. In the following, we seek to highlight a number of key recommendations from his original work in the context of contemporary applications from the peer-reviewed literature.
1 Automated camera calibration
The rise in popularity of photogrammetric methods in the recent past can, in part, be attributed to the low cost of equipment needed; with consumer-grade camera systems and affordable software able to generate satisfactory results. The cameras used for many photogrammetric applications today are far removed from the calibrated, “metric” camera systems regarded as a necessity for accurate measurements by Chandler (1999); in fact, Chandler himself later revealed the potential of using consumer-grade camera systems for close-range photogrammetry, given appropriate calibration (Chandler et al., 2005). This is simplified by automated camera calibration using self-calibrating bundle adjustment (SCBA) being refined and today handled internally by the software with minimal to no input required by the user. However, care must be taken to understand the influence of sub-optimal image networks on self-calibration and associated uncertainties (James and Robson, 2014). For weak image networks and limited camera positions, as is the case for stationary ground-based acquisitions, pre-calibration using targets may be necessary (Eltner et al., 2017). While the basic requirements for the types of sensors feasible for data acquisition for photogrammetric workflows are low, the accuracy of the acquired results can still be greatly influenced by this choice. Users should, therefore, be aware of considerations for the selection of suitable cameras and settings for their applications (discussed in detail by O’Connor et al., 2017). We point to the important issue that has arisen from the streamlining of photogrammetric workflows, which is that current systems are increasingly “black box” and so it is easy for users to overlook the need for fine-tuning available parameters to optimise results or reporting results without proper validation. As with all remote or proximal sensing workflows, validation should be considered a critical element of the practice.
2 The drone and software revolution in photogrammetry
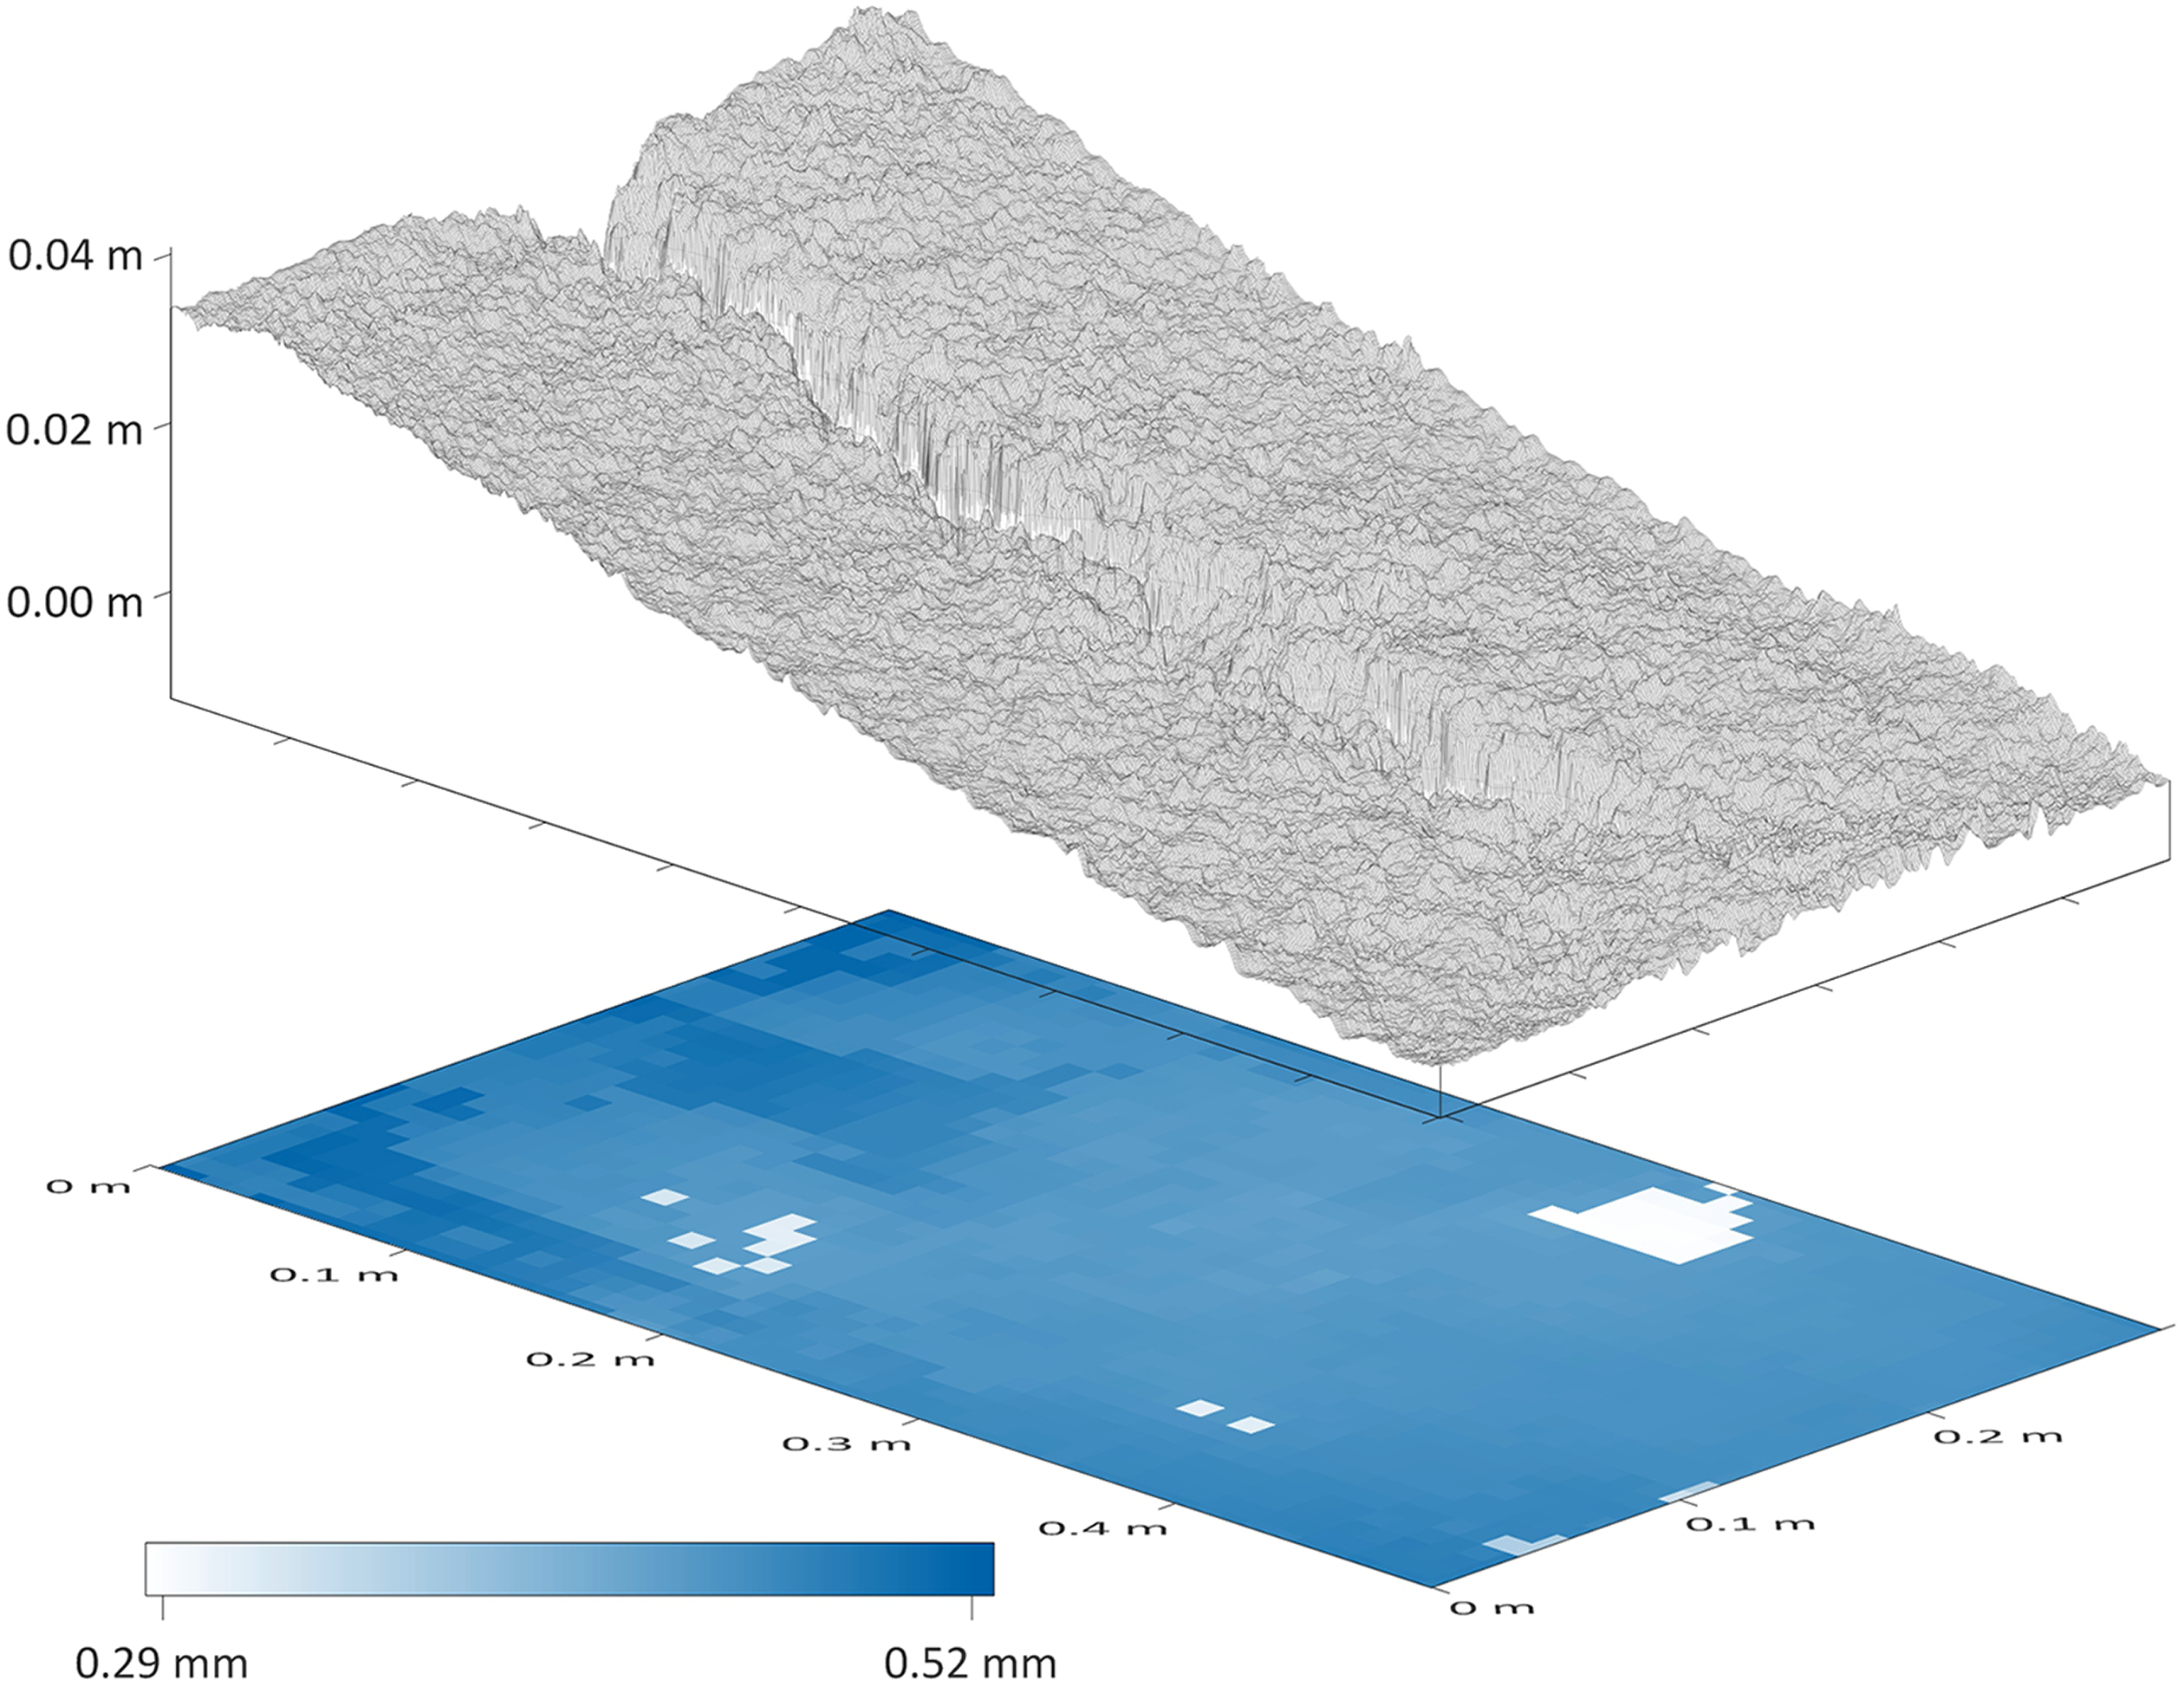
Besides the development of software options and the use of low-cost sensors, what has driven a recent upsurge and essentially led to a democratisation of structural data acquisition is the emergence of lightweight drones with on-board computers as autopilots, enabled by the miniaturisation of critical sensor systems (e.g. inertial measurement unit). Chandler (1999) may not have foreseen the rise of drones as the platform of choice for photogrammetric surveys, however, his advice of “start simple, start small” is still highly pertinent in an age when drones facilitate the collection of terabytes of finely resolved image data, which can be processed without requiring much prior technical knowledge. Even with increased computational resources and storage, generating dense point clouds and gridded products (e.g. surface models) from image data requires considerable processing time and handling of large datasets. Inexperienced users should, therefore, acquire a prior understanding of the quality level options used by “black box” softwares and critically evaluate which one is adequate for their project – for example, by initially working on subsets and assessing intermediate products to avoid investing time into the generation of sub-optimal results. Indeed, it is important to highlight the great diversity of SfM photogrammetry software products now available. Table 1 shows a snapshot of the most widely used options, along with the number of results returned by scientific search engines. The choice of software is often motivated by availability, ease of use and integration in larger processing pipelines, but users should be aware that many of these softwares implement subtly different methods for tie-point detection and bundle adjustment (mostly proprietary and confidential but usually based on scale invariant feature transform and Bundler) and product generation. While some cross-comparisons exist (Eltner and Schneider, 2015; Fraser and Congalton, 2018; Turner et al., 2014), they are case-specific and there remains an important need to clarify the advantages of each software – for example, for micro- and meso-scale geomorphology and vegetation-focused studies.
Popular SfM photogrammetry software packages and the number of publications referring to them. The date of this search was 16 December 2018 and the keywords used were “[name of software] + photogrammetry” to avoid including names used in a different context. Table modified following Eltner and Schneider (2015).
3 The importance of control-points
For traditional photogrammetric applications, Chandler (1999) discussed how the importance of photo-control (now, in the context of drone and airborne photogrammetry, this is usually termed ground-control point (GCP)) was a necessity for the determination of camera exterior orientation parameters, even in automated workflows, arguing for the need for high-quality control information for accurate result generation. In contrast, the SfM photogrammetry workflow can be completed without GCPs or camera-locations as input, yielding relative height information only. GCPs are required in order to register the output accurately to real-world coordinates, and it has been shown that few well-placed markers can be sufficient to achieve this (Tonkin and Midgley, 2016). GCPs also add constraints that can mitigate systematic errors in the derived point cloud, provided GCP locations are measured with sufficient accuracy (James et al., 2017a). Due to the scale, resolution and desired precision of most current photogrammetric applications, the utilisation of natural features as control points, recommended as an alternative to pre-marked points by Chandler (1999), is not advisable for drone-based surveys. Instead, current applications rely on the appropriate placement of sufficient GCP markers within the scene. By using available flight-planning software, desired GCP locations can be easily pre-determined and should favour the boundaries of the surveyed area (James et al., 2017a). Furthermore, the development of an on-board, real-time kinematic (RTK) Global Positioning System (GPS) for drones is leading towards precise direct georeferencing of aerial image data (Fazeli et al., 2016) and may at some point eliminate the need for GCPs entirely. This is a drone development that SfM photogrammetry users worldwide are no doubt watching with intent, and it will be interesting to see in the future the extent to which this streamlines or revolutionises the workflow.
A drawback of current SfM photogrammetry workflows is that metrics relating to the quality of results are limited (James and Robson, 2012), and Chandler’s (1999) key concern regarding the unquestioning application of the methodology by novice users may prove more current than ever, as SfM photogrammetry software packages become increasingly user-friendly (e.g. Pix4D), while their quality reports are either brief or difficult to interpret. As Chandler (1999) states, there may be a dangerous presumption that accurate data are being generated due to the application of sophisticated, automated techniques, today reinforced by appealing point cloud and textured mesh visualisations which can be of millimetre grain, and, thus, deceptive. Numerous influencing factors originating from flexible constraints can lead to SfM-based reconstructions being less accurate than conventional photogrammetric outputs (James and Robson, 2012), which means that while limited GCP or on-board RTK–GPS information may appear to generate plausible results, independent validation measurements or “check points” are highly recommended for validation (linking to our earlier point in Section II relating to the choice of software and its unknown influence on output data quality). Ideally, check points should be marked unambiguously within the scene, identical to GCPs in order to quantify error in all dimensions. As the deployment, collection and measurement of markers is time-intensive, a common method to provide supplemental product quality information for generated digital terrain models is the measurement of a large number of height validation points localised only using high-precision differential GPS information (Cunliffe et al., 2016). Control and validation measurements, therefore, remain an integral part of photogrammetric survey workflows today and researchers should dedicate adequate resources in order to guarantee high accuracy and reliability, even if direct georeferencing becomes commonplace.
III Multi-scale applications in physical geography
Chandler (1999) highlighted the unique strength of the photogrammetric method as opposed to other survey techniques in its ability to deliver height information at multiple scales, ranging from micro- over meso- to macro-scale applications. While no explicit definition of these scales is provided in his original work, it becomes clear that micro-scale corresponds to extents typically covered by data from proximal sensors, meso-scale from airborne sensors and macro-scales from space-borne sensors. As foreseen by Chandler himself, at meso- and macro-scales the acquisition of robust elevation data has predominantly become the domain of airborne laser scanning (ALS) and synthetic-aperture radar (SAR) satellite missions (e.g. TerraSar-X/TanDEM-X, SAR interferometry), respectively (James and Robson, 2012; Zink et al., 2017). While photogrammetric methods are still used at these scales as low-cost alternatives enabling more frequent surveys (e.g. Bühler et al., 2015), the bulk of their application in the geosciences has increasingly shifted to smaller scales with the advent of drone-based photogrammetry, where accuracies have been shown to be comparable to ALS- and terrestrial laser scanning (TLS)-based studies (Kolzenburg et al., 2016; Wallace et al., 2016). Following Chandler’s scale definition, common drone-based studies fall on the boundary between upper micro- and lower meso-scale, their spatial extent limited by maximum flying altitude, battery life and line-of-sight restrictions. Furthermore, proximal ground-based photogrammetry using consumer-grade digital cameras has also become common as a low-cost alternative to TLS or, at very small scales, where laser pulse density would prove insufficient and edge effects occur (Eltner et al., 2017; Hänsel et al., 2016; Rose et al., 2015).
In the following two sections, we shed a spotlight on three applications of photogrammetry from two scales (micro and meso) derived from our own experiments in the fields of (a) micro-scale soil erosion science, (b) landscape hydrology and (c) vegetation science. In doing so, we hope to provide some more detailed insights into the methodological developments and constraints associated with them, and reflect also on Chandler’s (1999) recommendations.
1 Micro-scale digital photogrammetry for monitoring geomorphological change
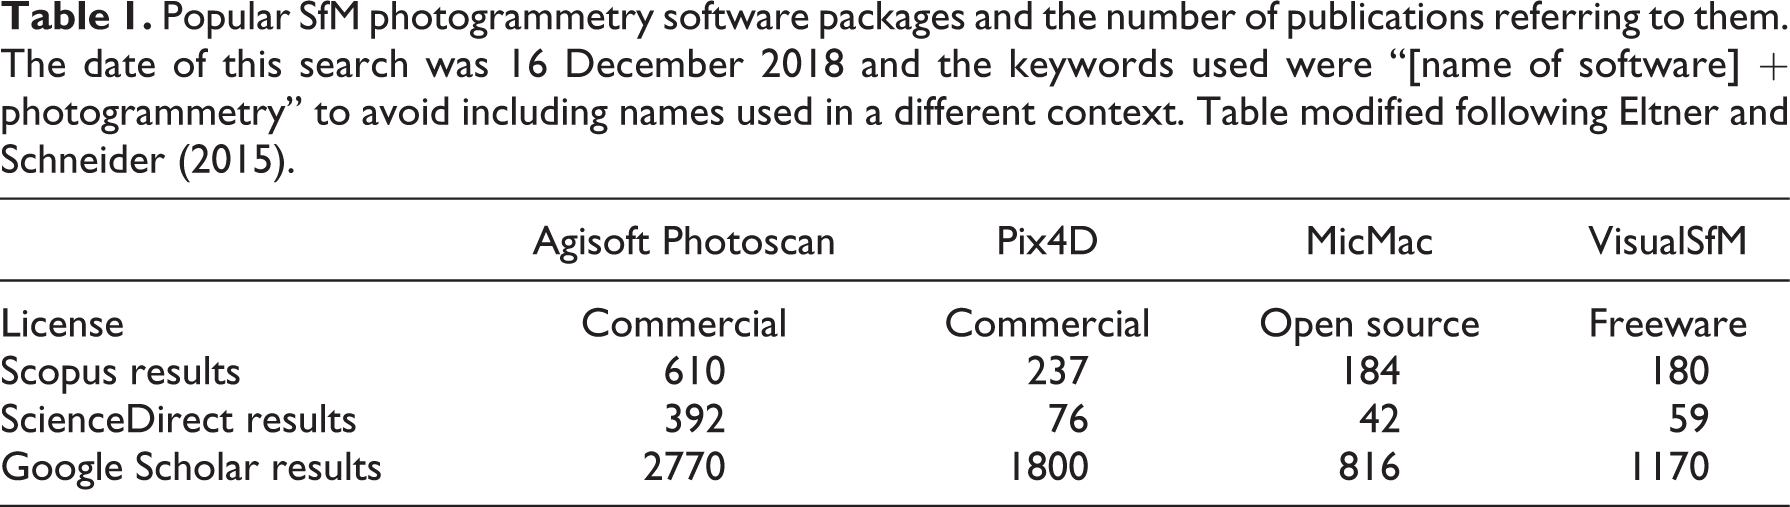
Micro-scale soil erosion studies are essential for developing scientific understanding of soil erosion processes and potential magnitudes of soil loss. Traditionally, the quantification of soil erosion rates in laboratory and field environments has been resource intensive and heavily reliant on expert knowledge and/or specialist equipment (Armstrong et al., 2011; Berger et al., 2010; Jester and Klik, 2005). With the potential to capture fine-resolution temporal and spatial information, photogrammetry and its recent developments present an exciting platform for monitoring the evolution of soil surfaces during erosion events. Using a metric camera and rotating photo control, Chandler was able to produce a ca. 10 mm digital surface model (DSM) in a micro-scale application, as shown in Figure 1. In similar micro-scale applications (≤3 m from sensor to surface) modern non-metric digital SLR cameras, with image resolutions in excess of 18 megapixels, are capable of delivering data with sub-millimetre ground sampling distances. However, as discussed by Chandler (1999), camera calibration models and photo control influence the precision and accuracy of photogrammetry-derived surface models, ultimately limiting the final (DSM) resolution. Therefore, understanding their role in the context of modern methodologies is of particular importance when monitoring geomorphological change at the micro-scale, where reduced precision and accuracy has a negative impact on the magnitude of change that can be detected confidently.
DSM produced by Chandler (1999, Figure 4, p.61, reprinted by permission from John Wiley & Sons, Inc.).
Adequate camera calibration models can be achieved through the standard SfM photogrammetry SCBA process for meso-scale and macro-scale applications, where the number of frames are typically in the hundreds and, thus, easily meet the criteria set out by Chandler (≥40 photo control in a minimum of four frames). However, in micro-scale applications, a single frame from two to three cameras can provide sufficient overlap and detail within the area of interest, reducing the computational resources required for processing. To demonstrate how pre-calibration, employing a modern SCBA process, can improve model quality, we used a stereo camera set-up fitted with three Canon 600D 18-55 mm III over a 0.5 × 0.3 m experimental soil plot, with 54 coded control markers around the periphery, as detailed in Benaud (2017). The tie-point precision, using the presented method by James et al. (2017b), was used to quantify the precision of the SfM model.
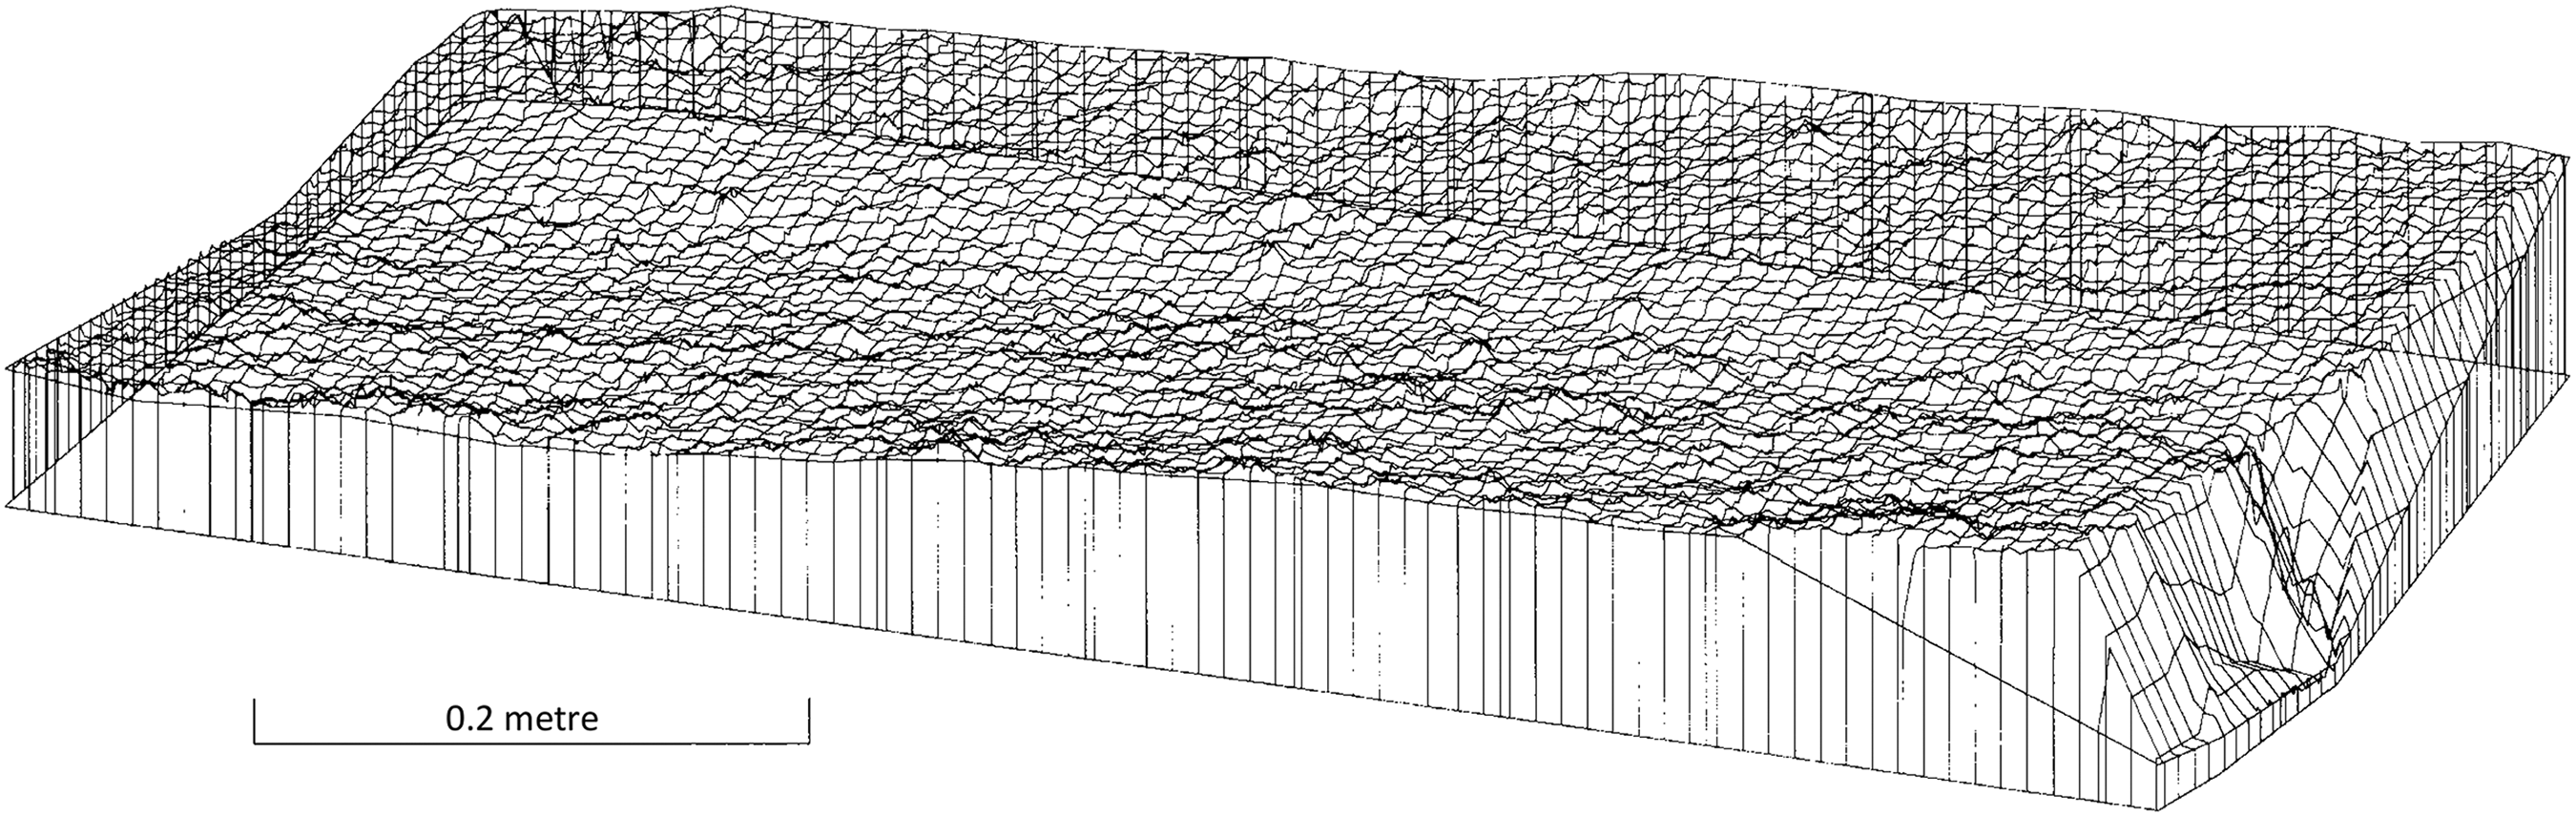
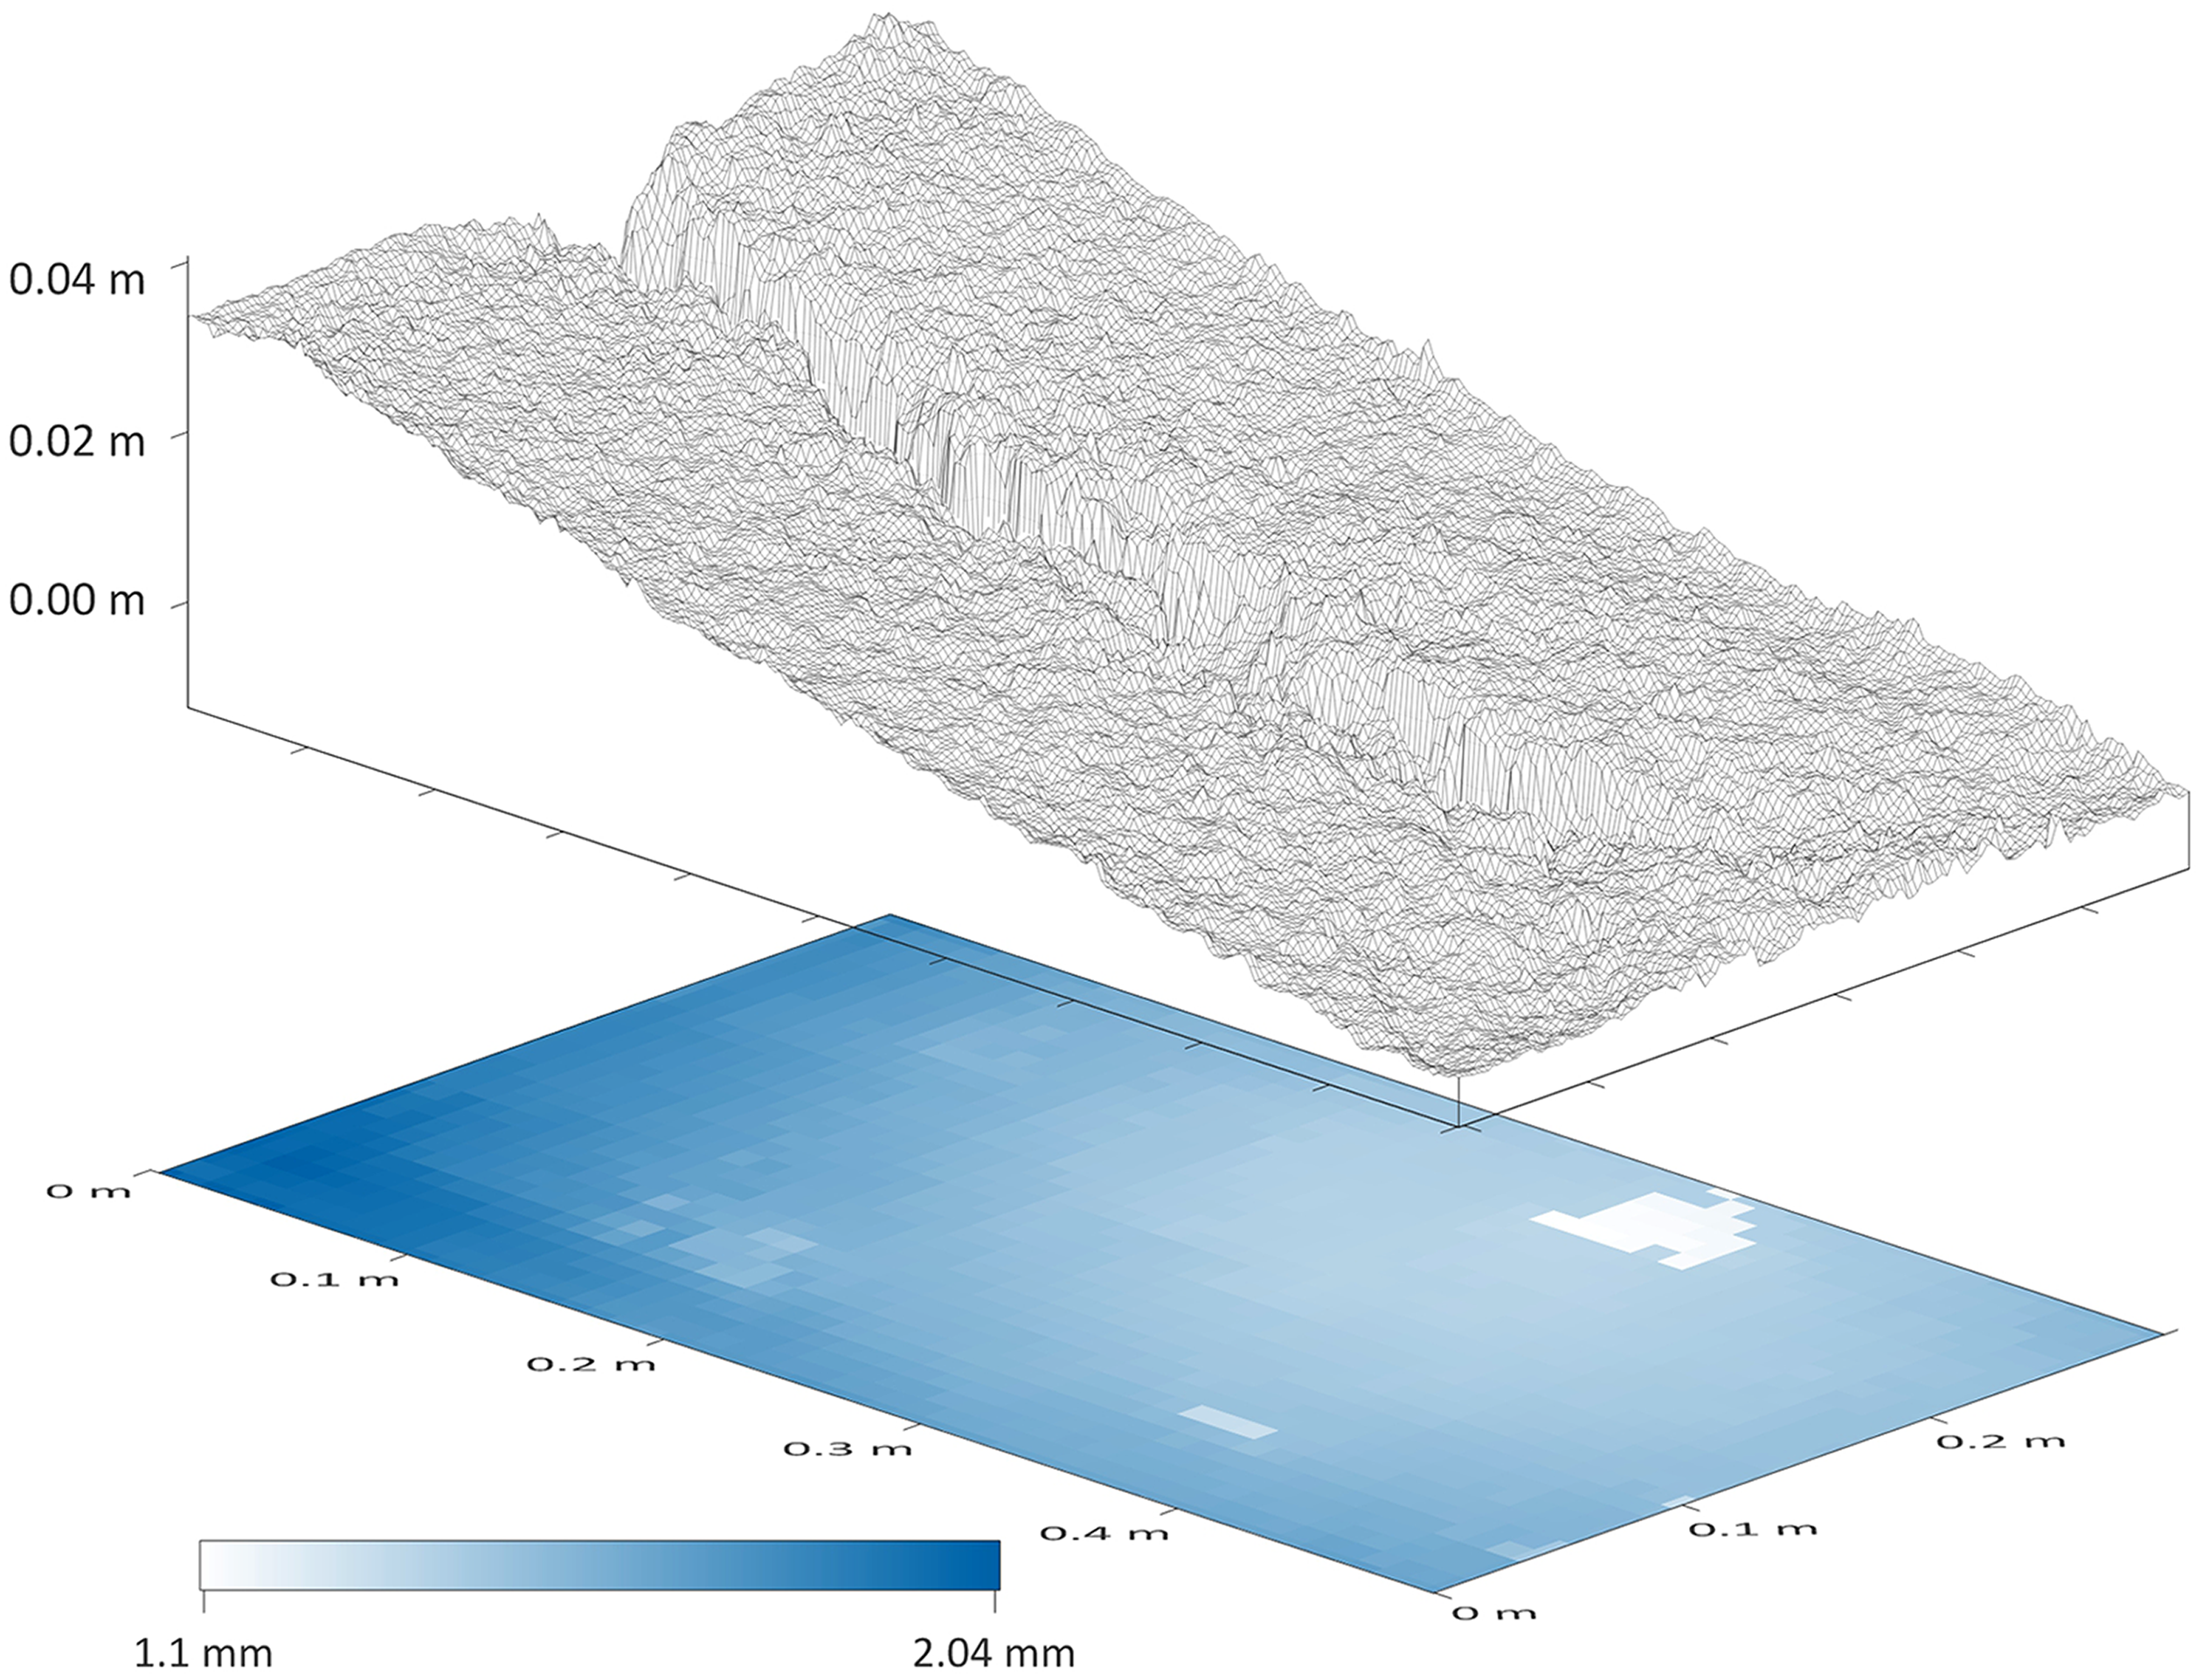
Figure 2 presents a wire-frame visualisation of a 2 mm DSM produced using only the experimental imagery, along with a raster of interpolated “z” axis tie-point precision estimates. By contrast, Figure 3 represents the same outputs produced using an identical workflow, but with camera calibration parameters derived for each camera from 30 frames of a control area and processed using the software’s SCBA prior to the experiment, permitting a 0.5 mm DSM. Whilst both SfM photogrammetry approaches produced sub-millimetre models, without obvious distortions and similar checkpoint root-mean-squared error values, there was an order of magnitude difference in the precision of the tie points in each (relative precision of 1:720 vs. 1:3080, respectively) and, thus, the resolution of the DSM that could be confidently produced. The difference in tie-point precision also had an impact on the level of change in the “z” axis that could be detected; that is, surface changes between models must exceed the precision of the tie points. This example has illustrated that pre-calibrating cameras, in micro-scale applications, can increase the level of change that can be confidently detected using SfM photogrammetry-derived models. Accordingly, the guidelines provided by Chandler (1999) regarding the number of frames required for adequate camera calibration are still applicable for micro-scale applications today, although given the “black-box” nature of SfM photogrammetry software, it would be sensible to use far greater than four frames from each camera for pre-calibration. Pre-calibration of non-metric cameras is also an option for meso-scale applications with limited image network flexibility (James and Robson, 2014; Shahbazi et al., 2015).
2 mm wire-frame DSM produced without pre-calibration plotted above a 10 mm gridded interpolation of the median tie-point z-axis precision estimates.
0.5 mm wire-frame DSM produced with pre-calibration plotted above a 10 mm gridded interpolation of the median tie-point z-axis precision estimates.
2 Meso-scale digital photogrammetry for landscape characterisation
2.1 Hydrological applications
The application of digital photogrammetry can provide insights into the processes that modify terrain, not only at micro-scales but also at the landscape level, where it allows improved studies of geomorphological, hydrological and biological processes. By providing finely resolved Digital Terrain Models (DTM) for the derivation of topographic attributes (e.g. slope, aspect, flow length, watershed area), the previously discussed advances in photogrammetry enable the creation of landscape-scale hydrological models at low costs and high frequency, making it possible to study the effects of micro-topography (Lucieer et al., 2014), and the impact of changing terrain on the landscape’s hydrology. This also allows the study of different components of hydrological systems, such as surface and subsurface flows, which are key to understanding nutrients and sediments transport in the landscape (Stieglitz et al., 2003).
However, a number of detrimental effects can limit the quality of photogrammetry-based DTMs. A common issue that arises are holes which require interpolation due to the terrain being obscured at particular camera view angles. It is, therefore, helpful if convergent images are acquired to ensure that these gaps are minimised (Nouwakpo et al., 2016). By doing so, surfaces that are occluded by the terrain or different objects (e.g. rocks or vegetation) at nadir may be visible from other angles and the derived DTM will be more complete. While Chandler (1999) listed considerations and the processing steps to be followed by the user working with oblique imagery, off-nadir views are much simpler to include in modern SfM photogrammetry workflows, especially when camera orientation per image is provided.
A further issue in the same vein for deriving terrain information by applying photogrammetric methods is vegetation cover. Unlike ALS, only limited information on the obscured ground below the vegetation canopy can be derived (Chandler, 1999). Depending on the required spatial resolution of the derived products, vegetation above a certain size threshold should, therefore, be removed from the previously generated point clouds or DSMs. To enable the filtering of vegetation, point cloud classification software such as CANUPO (Brodu and Lague, 2012) can be easily applied but such approaches require extensive fine tuning to achieve the best results. This filtering is key for ecohydrological studies, especially when the aim is to generate digital terrain/surface and hydrological models automatically.
We demonstrate the recreation of a stream network of a semi-arid landscape in central Spain (Aranjuez) using a DTM created by applying SfM photogrammetry to drone image data. This area of varying elevation and slope is covered predominantly by shrubs of different sizes and shapes. A Phantom 4 (DJI, China) quadcopter was used to acquire a total of 132 images with 75% overlap. These include two acquisitions with the camera pointing to nadir for the first and tilted by 45° for the repeat acquisition, as recommended by Cunliffe et al. (2016). The dense point cloud was created using Agisoft Photoscan (V. 1.4.0, Agisoft, St Petersburg, Russia) and the sparse vegetation was removed from the point cloud using the CANUPO plugin (Brodu and Lague, 2012), implemented in CloudCompare (V. 2.9.1, http://www.danielgm.net/cc/). This open-source software, originally designed to work with LiDAR data, allows the automatic classification of point clouds into desired classes, which, for this study, were vegetation and bare ground. Once the vegetation was removed from the point cloud, the resulting gaps were interpolated in Agisoft Photoscan using inverse distance weighting during DTM creation (1.5 cm/pixel spatial resolution). The DTM was then used to calculate the stream network of the study area (Figure 4) using the D8 flow direction algorithm (O’Callaghan and Mark, 1989), implemented in the TauDEM toolbox (V. 5.3.7, http://hydrology.usu.edu/taudem/taudem5/index.html).
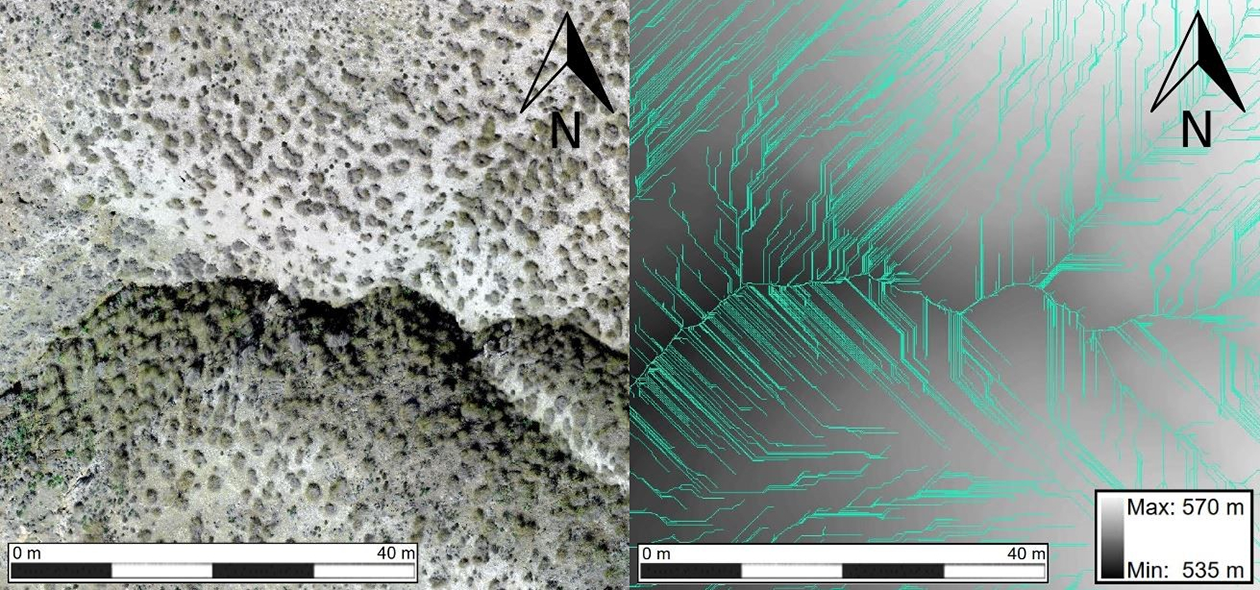
Detail of the orthomosaic of the study area (left) and the corresponding stream network (blue lines), created using the D8 flow direction algorithm (right).
It is evident that areas where vegetation is dense and subsequently removed from the point cloud will show a decreased level of topographic detail in the resulting interpolated DTM. This can lead to likely errors in the representation of the stream network and subsequent calculations (e.g. long segments of identical flow directions, as visible in Figure 4).
Therefore, like Chandler (1999), we argue that although digital photogrammetry-generated DTMs show potential for hydrological products, care must be taken when working with very high-resolution terrain models and interpreting their results, since slight errors can propagate within the hydrological model and yield results that do not align with reality (see Fisher and Tate (2006) for the possible consequences of DTM uncertainties), especially considering parameters such as flow-path length, which are central to sediment transport (Goulden et al., 2016). For this reason, creating adequate methodologies for removing vegetation and other objects that might influence generated digital models are a priority in order to create reliable products. While the reconstruction of the surface beneath these objects can be facilitated by acquiring images at different angles, it should be carefully assessed at which level of vegetation cover and desired spatial resolution canopy-penetrating methods such as laser scanning become a necessity.
2.2 Study of vegetation
While for geomorphology- and hydrology-focused applications vegetation has always presented an issue, as identified by Chandler (1999), pioneering work by Dandois and Ellis (2010) has given rise to photogrammetry being increasingly used for studies on vegetation structure. The motivation for this is the same as in the previously presented fields and is related to financial cost and increased flexibility, which drone-based acquisitions offer. While missing ground information (e.g. from ALS) limits the applicability of photogrammetry-derived information for vegetation surveys, it has been shown that simple metrics derived from SfM photogrammetry point clouds can be successfully related to key parameters of interest such as canopy height, leaf-area index and biomass (Cunliffe et al., 2016; Dandois and Ellis, 2010, 2013; Mathews and Jensen, 2013). The ability to include arbitrary oblique-angle views of vegetation canopies in the image network has greatly improved the possibilities both for the description of canopies, moving from 2.5D closer to true 3D representations of the scene. This has been exploited by Cunliffe et al. (2016) to derive shrub canopy volumes and improve the SfM photogrammetry-derived DTM information.
Going further, the agility of drone platforms could be fully exploited to retrieve increasingly complete descriptions of single vegetation canopies. Figure 5 presents a study of a single oak tree canopy imaged by a consumer-grade, gimballed camera on a drone (DJI Inspire with Zenmuse X3, DJI, China) from many angles and high overlap using a hemispherical flight pattern. The waypoints and camera orientations were generated based on freely available code by Burkart et al. (2015) by specifying the radius and focus height above ground and imported into flight-planning software for a fully automated acquisition with a duration of approximately 10 min. The point cloud of the canopy was generated from 672 images using Agisoft Photoscan (V. 1.3.4, Agisoft, Russia) and was co-registered to a TLS point cloud of the same canopy, acquired from four positions around the tree using a Leica ScanStation P16 (Leica, Germany), for comparison. The average cloud-to-cloud distance of the SfM photogrammetry-based point cloud to the closest TLS points was 6.5 cm as computed in CloudCompare (V. 2.9.1, http://www.danielgm.net/cc/). Providing control points for an internal coordinate system as well as very small angular differences between acquisitions are crucial for a coherent and geometrically accurate reconstruction. Due to dealing with a non-metric camera with considerable lens distortion, this is also needed for reliable SCBA.
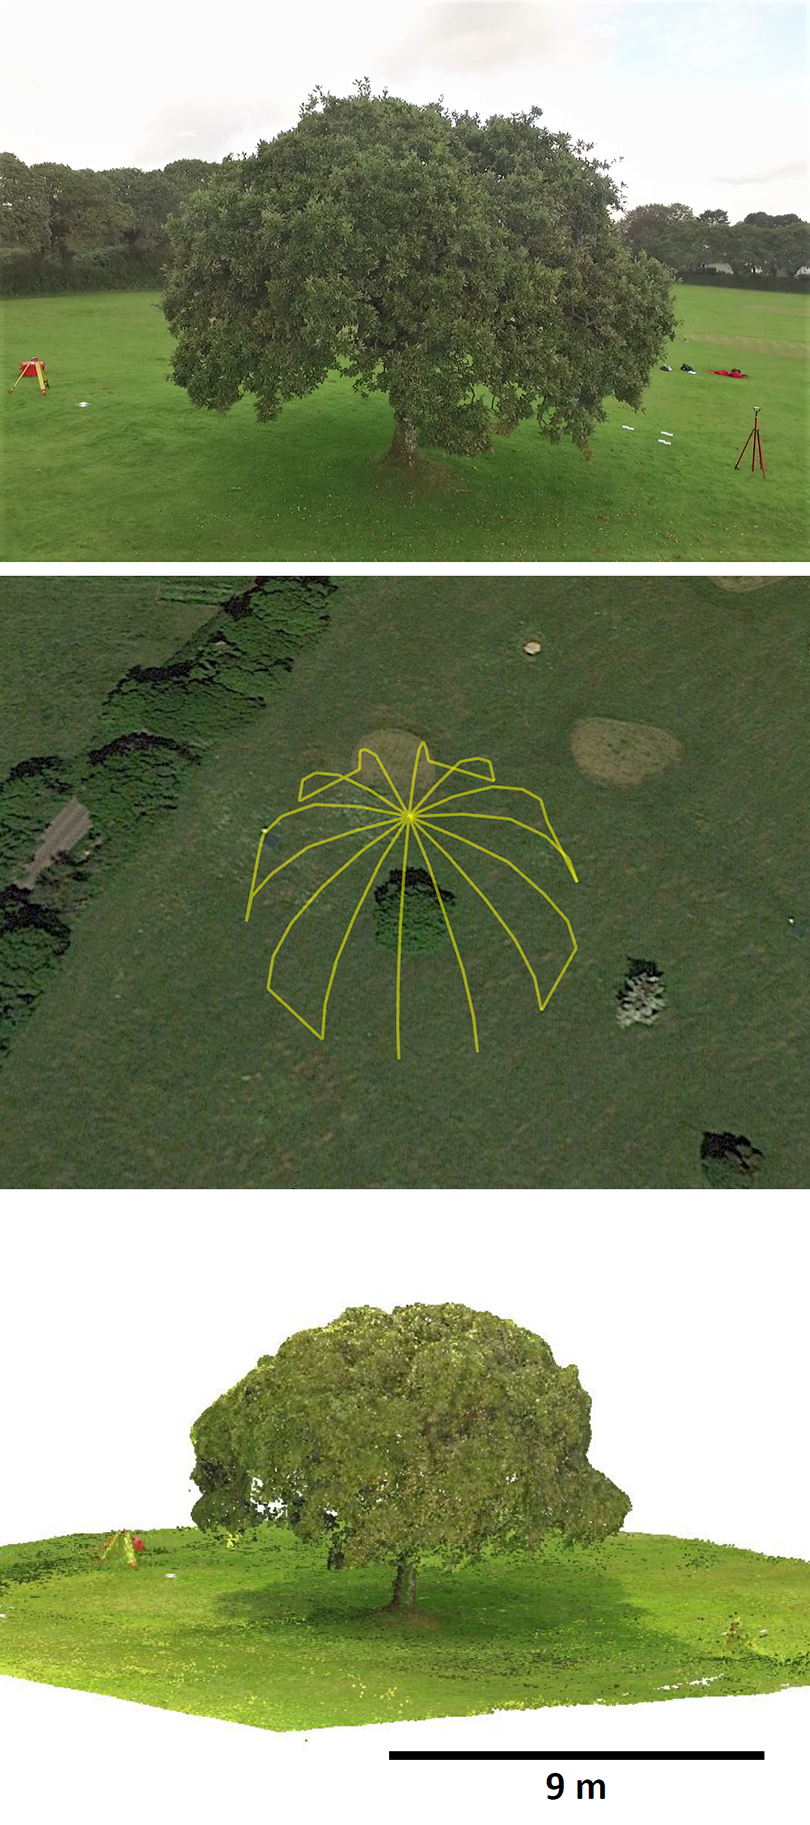
Top: RGB image of lone standing oak tree (Quercus robur); middle: hemispherical flight plan to be executed by drone displayed over high-resolution satellite imagery (Google Earth); bottom: RGB dense point cloud derived from the multi-angle drone-based images.
While the internal structure of this tree could only ever be captured by active laser scanning methods, the acquisition of image data from a drone platform is, by contrast, rapid and the reconstruction demonstrates the techniques’ capability to deliver information on canopy shape, volume and stem information. The opportunities opened up by the agility of small aerial drone platforms coupled with the SfM photogrammetry methodology are only starting to be explored, and while the angular coverage as presented in this example can be difficult to achieve in a natural environment, it may be a viable alternative where the use of TLS is limited due to the inaccessibility of the study area.
One of the reasons that photogrammetry has previously only found fringe application for vegetation is due to the 3D complexity and instability of identified features as caused by wind conditions for many types of vegetation canopies (Duffy et al., 2017). The errors and noise within the resulting point clouds can be expected to greatly exceed those of rigid surfaces. Quantifying uncertainties is, therefore, highly important before drawing conclusions from derived information. Similar to the above example, this can be achieved by comparing results to those derived from laser scanning (ALS or TLS) point clouds (Ota et al., 2015; Wallace et al., 2016). Where such data are unavailable, uncertainty can be assessed by acquiring replicate acquisitions (Dandois et al., 2015). Complete replicate surveys are not addressed by Chandler (1999) (instead encouraging analysis of differences between single stereo pairs), presumably in part due to the cost and data volume required. The acquisition of sufficient replicates remains a limitation to resource allocation for photogrammetry-based studies, and efforts should be made seeking to employ the same methodology for deriving precision estimates developed for geomorphological applications, as presented in the previous section (James et al., 2017b).
IV Summary
Formulated as cautionary considerations when first software packages were contributing to the automation of the photogrammetric workflow, we showed that Chandler’s (1999) advice regarding product validation by check points, the influence of inaccurate camera calibrations and processing high volumes of data remains relevant to the growing community of non-expert photogrammetry users. Practitioners should familiarise themselves with the importance of control and check points and know for which studies it is necessary to pre-calibrate the cameras used. Being aware of these considerations while making use of the wealth of new tools available ensures high-quality outputs capable of providing new insights in diverse areas of physical geography. Three such example applications spanning different areas and scales were presented, where developments in photogrammetry and acquisition methods open up new opportunities in micro-scale erosion modelling, landscape hydrology and the study of vegetation canopies. Although digital photogrammetry has advanced considerably since the publication of Chandler’s (1999) seminal paper, many of the principles and precautions he advocates are as relevant in contemporary workflows as they were 20 years ago at the time of his publication.
Footnotes
Declaration of conflicting interests
The author(s) declared no potential conflicts of interest with respect to the research, authorship, and/or publication of this article.
Funding
The author(s) disclosed receipt of the following financial support for the research, authorship and/or publication of this article: D. Fawcett and J. Blanco-Sacristán received funding from the European Union’s Horizon 2020 research and innovation programme under the Marie Skłodowska-Curie Grant Agreement No 721995. Work by P. Benaud was funded by and carried out under the UK Department for Environment, Food and Rural Affairs project SP1311 `Piloting a cost-effective framework for monitoring soil erosion in England and Wales’.