
Abstract
Coastal erosion in 45 sandy beaches covering nearly 2000 km along the tectonically active Chilean coast is assessed during the last four decades. The historical analysis is based on the assessment of decadal changes of the shoreline position extracted from topographic surveys, aerial photographs, satellite images and survey maps using the DSAS software. Results show that 80% of the sites presented erosion rates (>−0.2 m/y), 7% beaches accreted (>0.2 m/y) while 13% remained stable. Eroded beaches include headland bay beaches, embayed and pocket beaches. A discussion on the possible causes explaining these results is conducted. While changes in offshore wave climate are spatially smooth within the region, relative mean sea level changes are highly variable and modulated by tectonic activity; the reduction of the sediment supply explains erosion rates in few cases.
I Introduction
The multiple factors triggering coastal erosion are difficult to understand due to the complexity of phenomena, spatial scales and time scales involved (Komar, 1976; Van Rijn, 2005; Van Rijn, 2011; Rodríguez et al., 2012). In recent years, coastal erosion has worsened worldwide due to the higher frequency and intensity of extreme events – typhoons, hurricanes, tropical cyclones and coastal storms – associated with climate variability and global environmental change (Yáñez-Arancibia, 2013; Zhang and Sheng, 2015). The significant consequences of coastal erosion have been addressed in several studies on extreme events, coastal vulnerability, climate change adaptation and coastal resilience (e.g. Ranasinghe and Stive, 2009; Chust et al., 2010; Mulder et al., 2011; Parker et al., 2013; Masselink et al., 2016). The evidence of coastal erosion worldwide is irrefutable but the rates at which it occurs are still debatable. Bird (1996), for example, found that nearly 70% of the beaches receded between 1976 and 1984 while Luijendijk et al. (2018), showed that 24% of sandy beaches are eroding at speeds greater than 0.5 m/year, while 28% are accreting and 48% remain stable. Chronic erosion appears to be linked to sea-level rise due to anthropogenic climate change (Vitousek et al., 2017).
Climate-driven projections suggest coastal erosion will be enhanced in the coming decades (Stive et al., 2010; Bagheri et al., 2019). Vitousek et al. (2017), for instance, predicted that up to 67% of the beaches may erode completely along 500 km of the south coast of California by 2100, while Voudouskas et al. (2020) claimed that trends in shoreline dynamics, combined with coastal recession driven by sea-level rise, could result in the extinction of almost half of the world’s sandy beaches by the end of the century. These results have generated severe criticism since their methodology, based on the use of Bruun’s rule, neglects the possibility of unperturbed beaches to migrate landwards as sea level rises (Cooper et al., 2020). Still, Bruun’s Rule–derived shoreline changes are used as first order estimates of the effects triggered by sea-level-rise (SLR) in uninterrupted coastlines (Toimil et al., 2017).
The increase in the frequency and intensity of extreme coastal events worldwide, specifically coastal storms (Harley, 2017), can cause dramatic changes in the coast, affect lives and destroy valuable coastal infrastructure. Its impact is also increased due to the generalized urbanization of the coastal area (Barragán and De Andrés, 2015). According to Callaghan et al. (2009), coastal erosion needs to be accurately quantified in order to facilitate effective coastal management strategies. On the Catalan coast, for example, the damage caused to infrastructure has increased by 40% in the last 50 years due to both coastal erosion and explosive urban growth (Jiménez et al., 2012). Both on the Atlantic coast and the Pacific, erosion has been much greater in places affected by abnormal water levels (Masselink et al., 2016) stemming from atmospheric phenomena acting at different spatial scales (Del Río et al., 2012). The bathymetry and geomorphological characteristics of the coast also induce differentiated effects and would condition the potential for damage (Jiménez et al., 2012).
Up to date, coastal erosion in Chile has not been comprehensively studied. On a decadal scale, some bays in the central region have remained stable or shown an erosive trend (Martínez, 2007; Martínez and Salinas, 2009; Martínez et al., 2011). In addition to oceanographic and anthropogenic causes, some of these changes are associated geophysical phenomena, namely, megathrust earthquakes and tsunamis. For example, some beaches already experiencing erosion incremented their width due to the coseismic uplift caused by the 27 February 2010 earthquake (Martínez et al., 2015). Since then, many of the beaches have experienced erosion and dramatic morphological changes. Recently, a study carried out in the urban beaches of Valparaíso Bay (Martínez et al., 2018) showed that one beach experienced accretion, two proved to be in stable conditions and one was significantly affected by a shoreline retreat on a decadal scale. Episodic erosion has also been caused by episodic extreme events, which have additionally produced structural damage throughout coastal cities located in Central Chile (Carvajal et al., 2017; Winckler et al., 2017; Igualt et al., 2019).
Given the natural fragility of sandy shorelines and the intense urbanization along the Chilean coast (Martínez et al., 2020), it is urgent to support public policies and design adaptive measures based on the scientific understanding of the coastal processes involved. The aim of this research, therefore, is to determine the magnitude of historical coastal erosion on sandy shorelines, its relation to oceanographic variables and the projection of shoreline retreat as a response to SLR and changes in wave climate, according to climate change scenarios.
II Study area
The geomorphology of the Chilean Coastal Zone (CCZ) is shaped by the tectonic activity of the Peru-Chile trench – formed by the subduction of the Nazca Plate beneath South America at a convergence rate of 70 mm/yr (Angermann et al., 1999 in Carvajal et al., 2019) – along with changes in sea-level during the Quaternary (Garrett et al., 2020). Six large earthquakes within the analyzed period (1985, 1995, 2005, 2010, 2014, and 2015) have partially affected the study area has in different regions (Poulos et al., 2019), some of which caused significant seafloor changes. For example, the M8.8 2010 Maule earthquake – a type of earthquake with a recurrence rate of 250–500 years (Zones 2.3 in Poulos et al., 2019) – produced highly variable coseismic changes, ranging from a maximum uplifts of 2 m to subsidence of 0.35 m in the continental coast (Quezada et al., 2010a, 2010b). Smaller but more frequent earthquakes, however, are highly probable and can also trigger shoreline changes. For example, the M7.7 2007 Tocopilla earthquake, which recurrence period is ∼35 years (Zone 2 in Poulos et al., 2019), produced an uplift of 0.35 m (Schurr et al., 2012).
Between 18.4°S and 41.5°S, its morphology is characterized by rocky coasts carved in metamorphic, intrusive or volcanic rocks, seldom alternated by beaches, wetlands, dune systems and few bays where major coastal cities are situated (Araya-Vergara, 1971; Winckler et al., 2020). The CCZ is sited on one of the narrowest continental shelves worldwide (Paris et al., 2016), which is seldom interrupted by submarine canyons. It is characterized by strong latitudinal climatic gradients, ranging from the most arid desert worldwide in the north (18°S∼30°S) to an oceanic climate in the fjords of Patagonia (41°∼55°S). Its central and south regions present a Mediterranean-type climate (Di Castri and Hajek, 1976) controlled by the Southeast Pacific Subtropical Anticyclone, the Humboldt Current System, the southern circumpolar current and the Andean range (Winckler et al., 2020). During winter, the climate is characterized by extratropical cyclones moving on a latitudinal belt between 40°S and 60°S which transfer energy to waves that propagate toward the CCZ. Due to the range of distances between the CCZ and the wave generation zone, strong latitudinal gradients in wave climate range from highly energetic western waves in the south to relatively mild swells in the north of the country (Beyá et al., 2017). Tides are mixed semi-diurnal, with maximum amplitudes of 160 cm (SHOA, 1984).
According to the 2017 census, a million people lived in 477 settlements in low elevated coastal zones throughout the CCZ, (Ministerio del Medio Ambiente, 2019), that is, those below 10 m above mean sea level (McGranahan et al., 2007). This relatively narrow strip of coastal territory embraces a wide variety of natural systems including 1172 beaches, a significant portion of which are threatened by erosion (Ministerio del Medio Ambiente, 2019). In this study, we analyze historical shoreline changes and projections in 45 sandy beaches covering nearly 2000 km along the CCZ (Figure 1). The study includes sites with different wave climate, geomorphological types and degree of anthropization. Geographical context of the 45 beaches under study.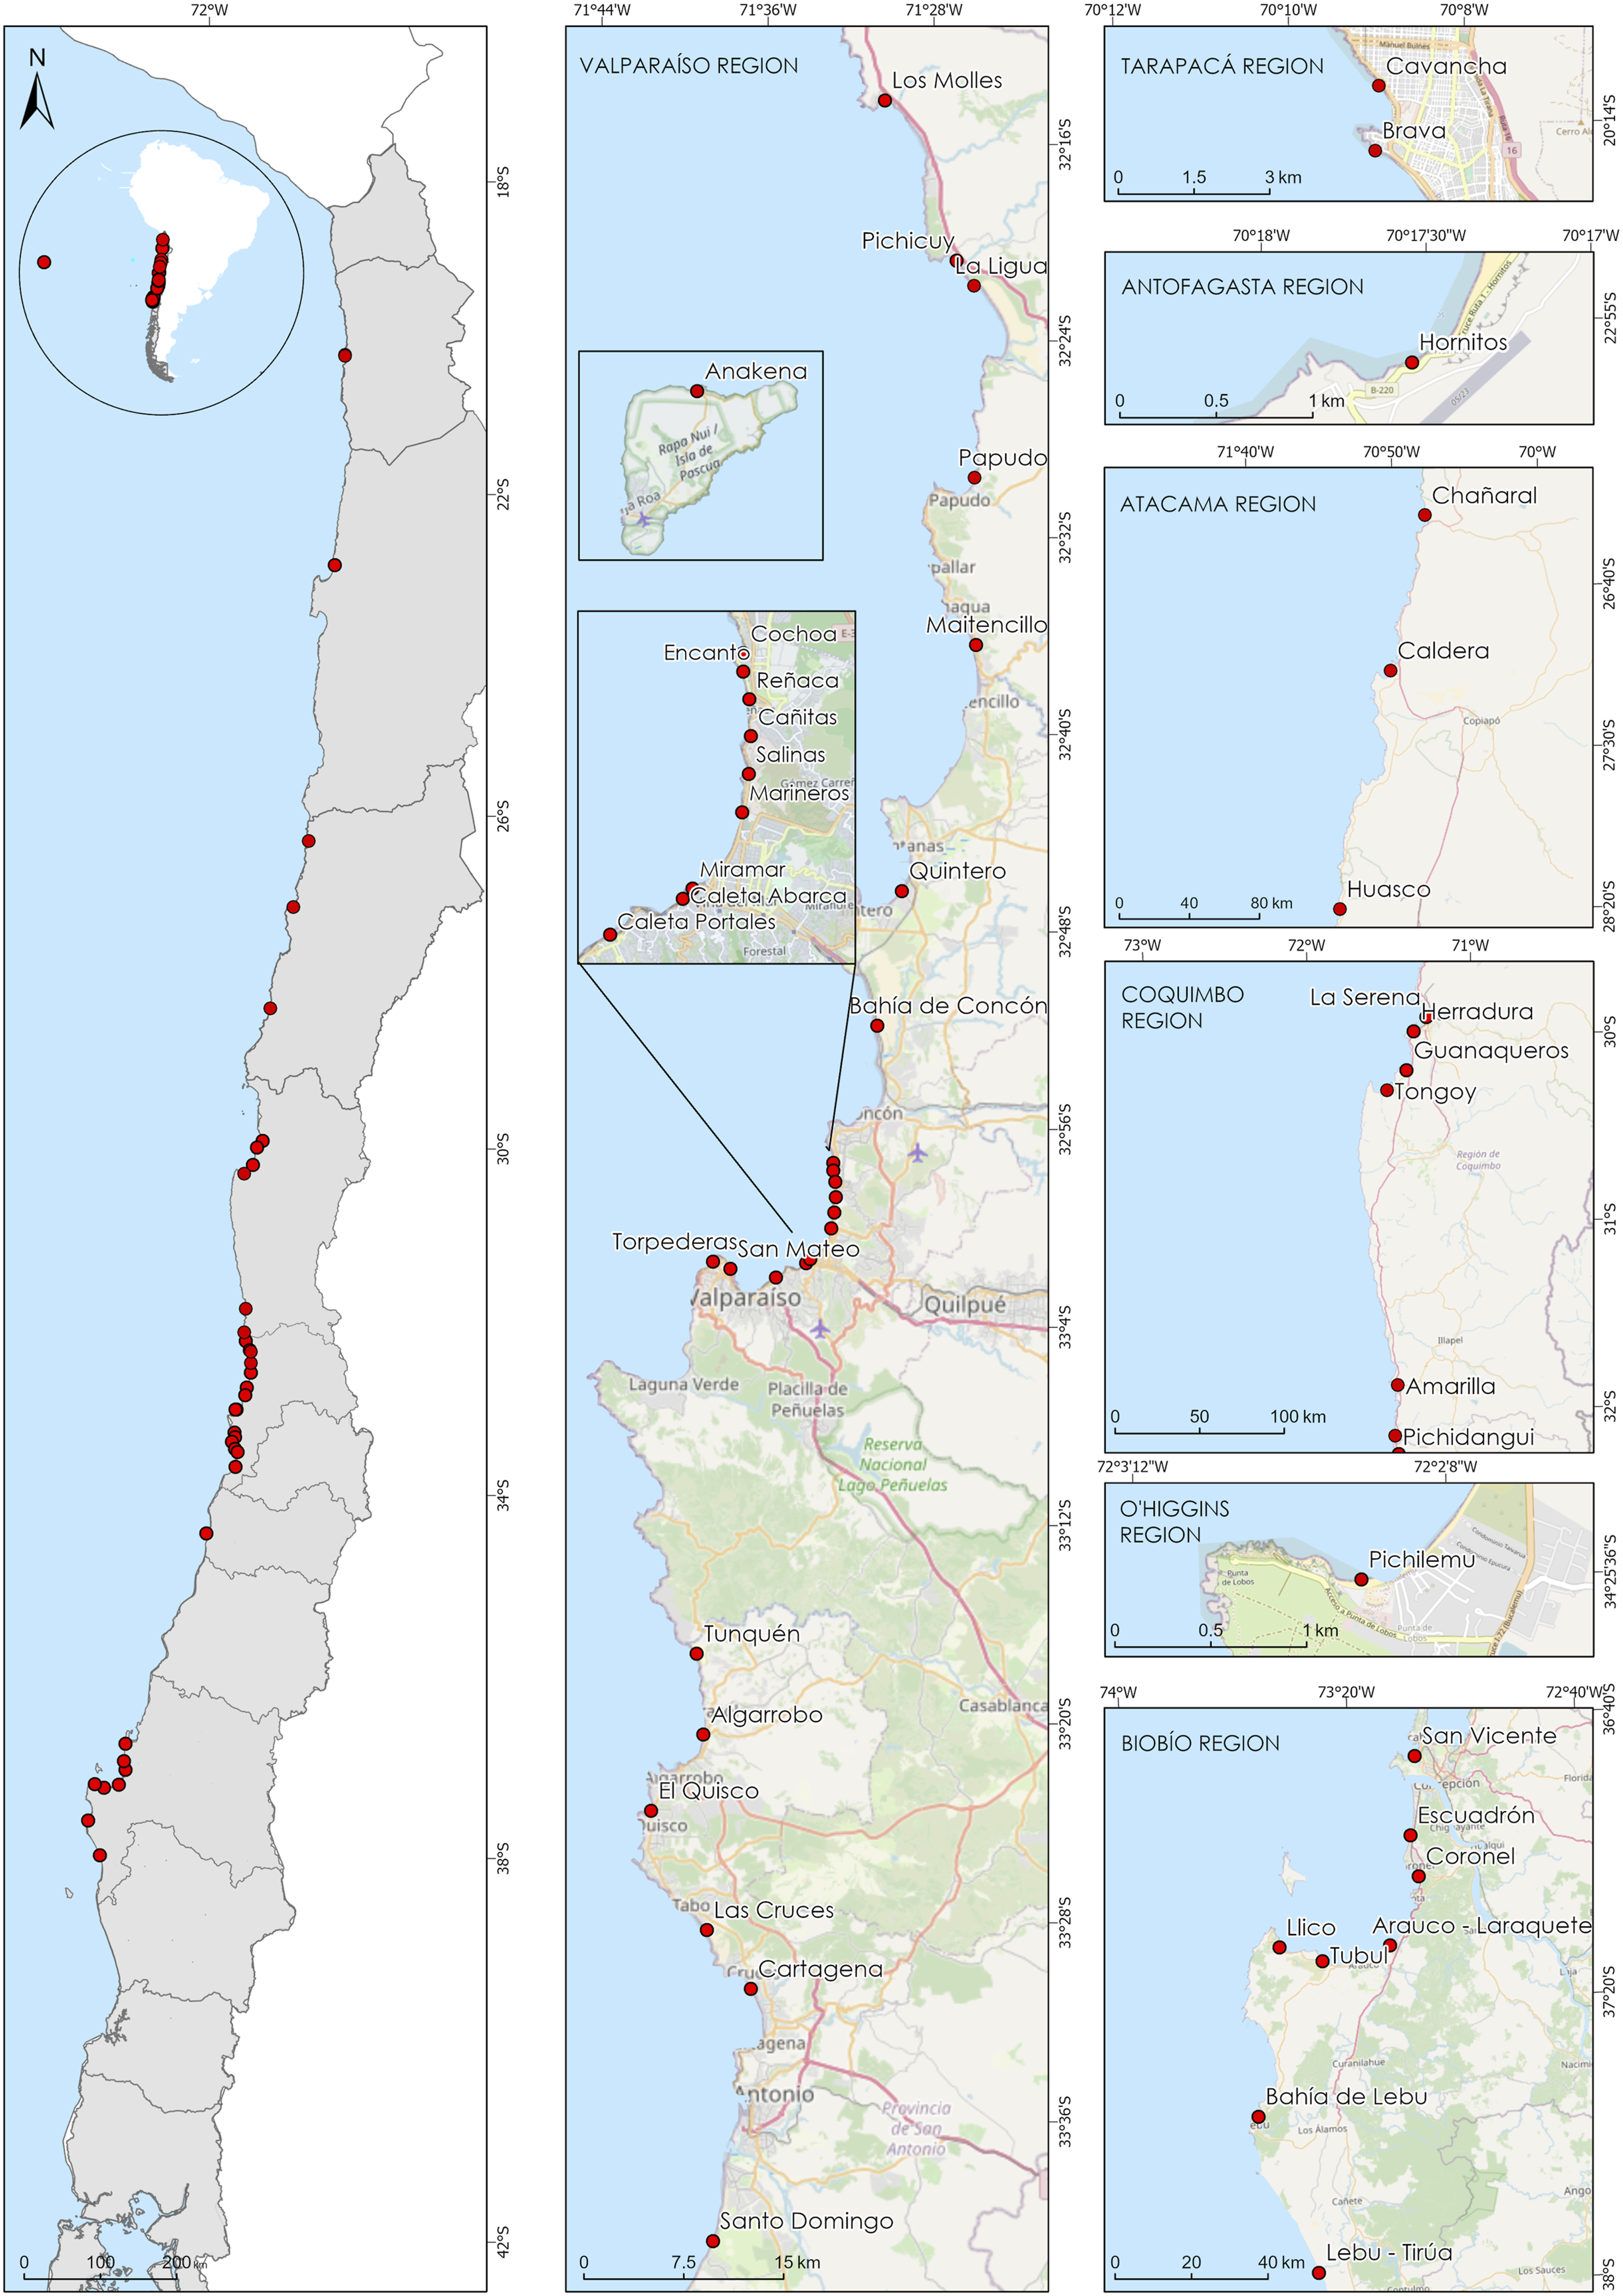
III Methodology
Changes in the shoreline position in 45 beaches were determined from topographic surveys, aerial photographs, satellite images and survey maps using the USGS’s Digital Shoreline Analysis System DSAS (Thieler et al., 2009), in combination with ArcGis 10 (Figure 1). Details of the data is included in Table A1. DSAS has been used at regional scale and for long series of time in Colombia (Rangel et al., 2015), Malaysia (Bagheri et al., 2019) and Australia (Konlechner et al., 2020). The annual rates of change in shoreline position were determined through the Linear Regression Rate method (LRR) along several transects within each beach, during winter and spring (Figure 2). Then, the mean rate of change for each beach was then computed as the average of the rates obtained from each profile. The LRR calculates the rate of change by fitting a least squares regression line to all the points in the shoreline for each transect. The method is easy to use and well suited for the amount of beaches and transects under scrutiny. Example of application of the Digital Shoreline Analysis System (DSAS) in Pichilemu. The annual shoreline rate of change is classified according to Rangel-Buitrago et al. (2015) categories: high erosion (>−1.5 m/yr), erosion (between −0.2 and −1.5 m/yr), stability (between −0.2 and +0.2 m/yr) and accretion (>+0.2 m/yr).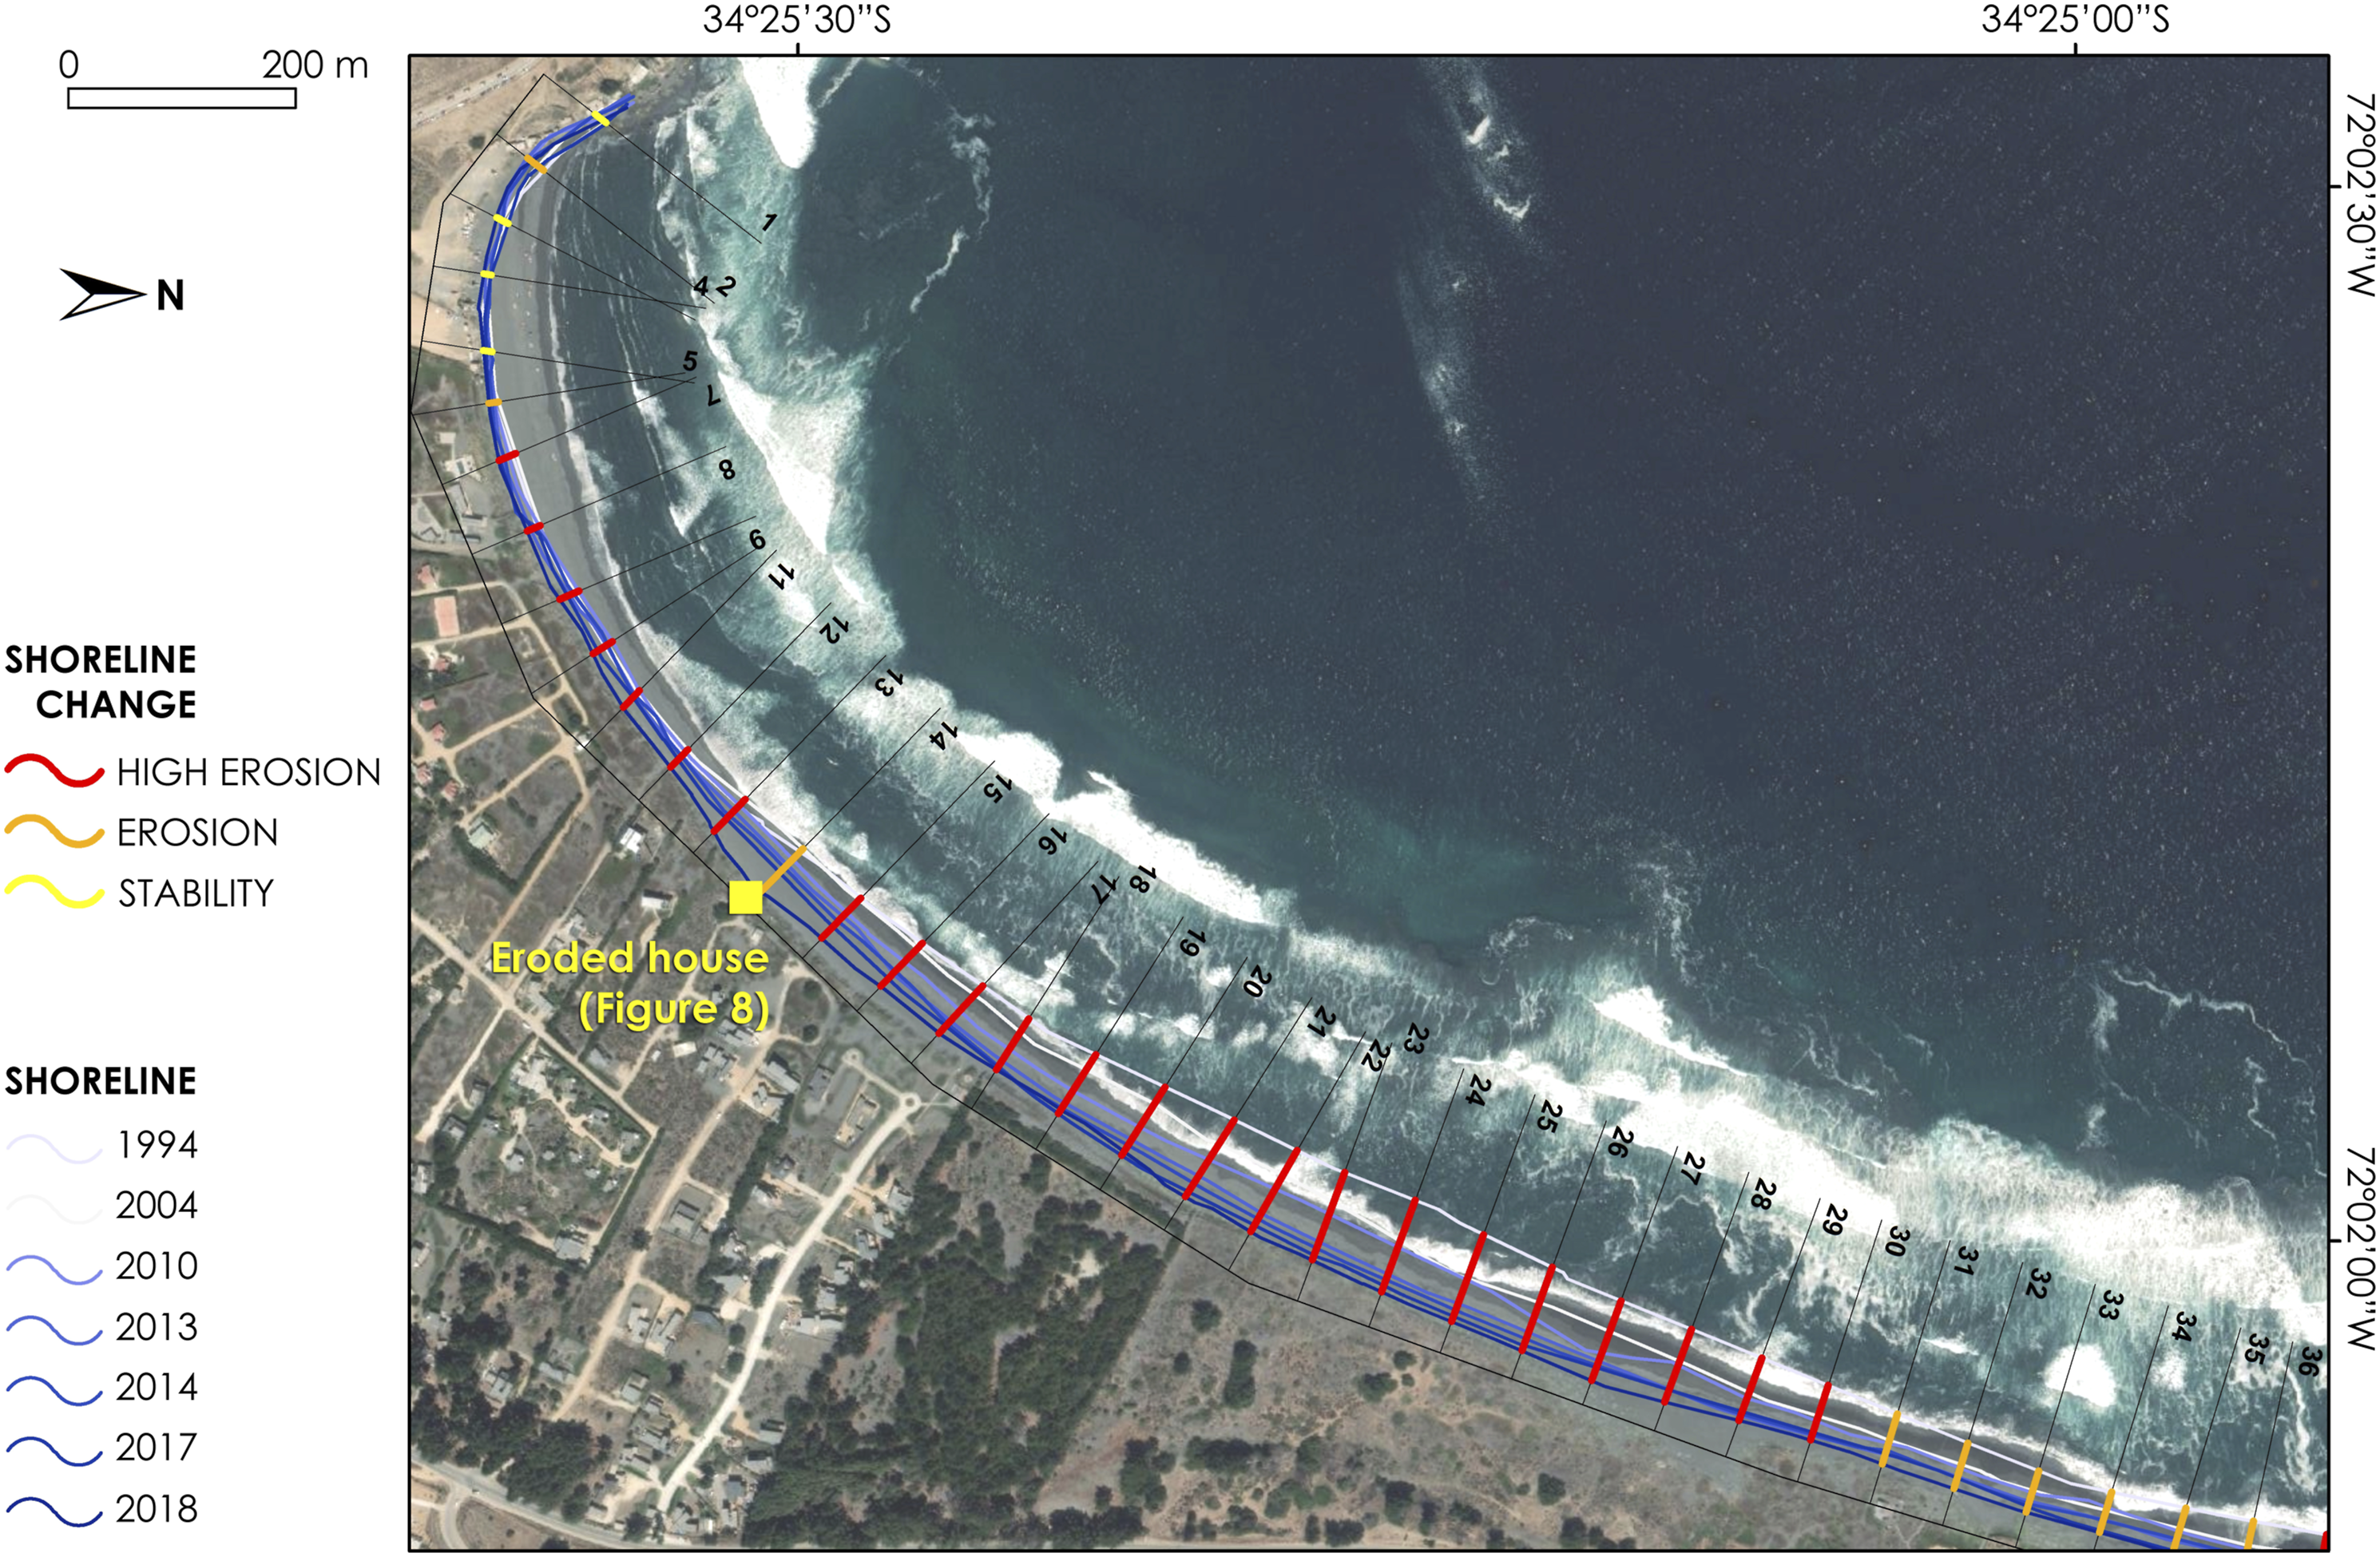
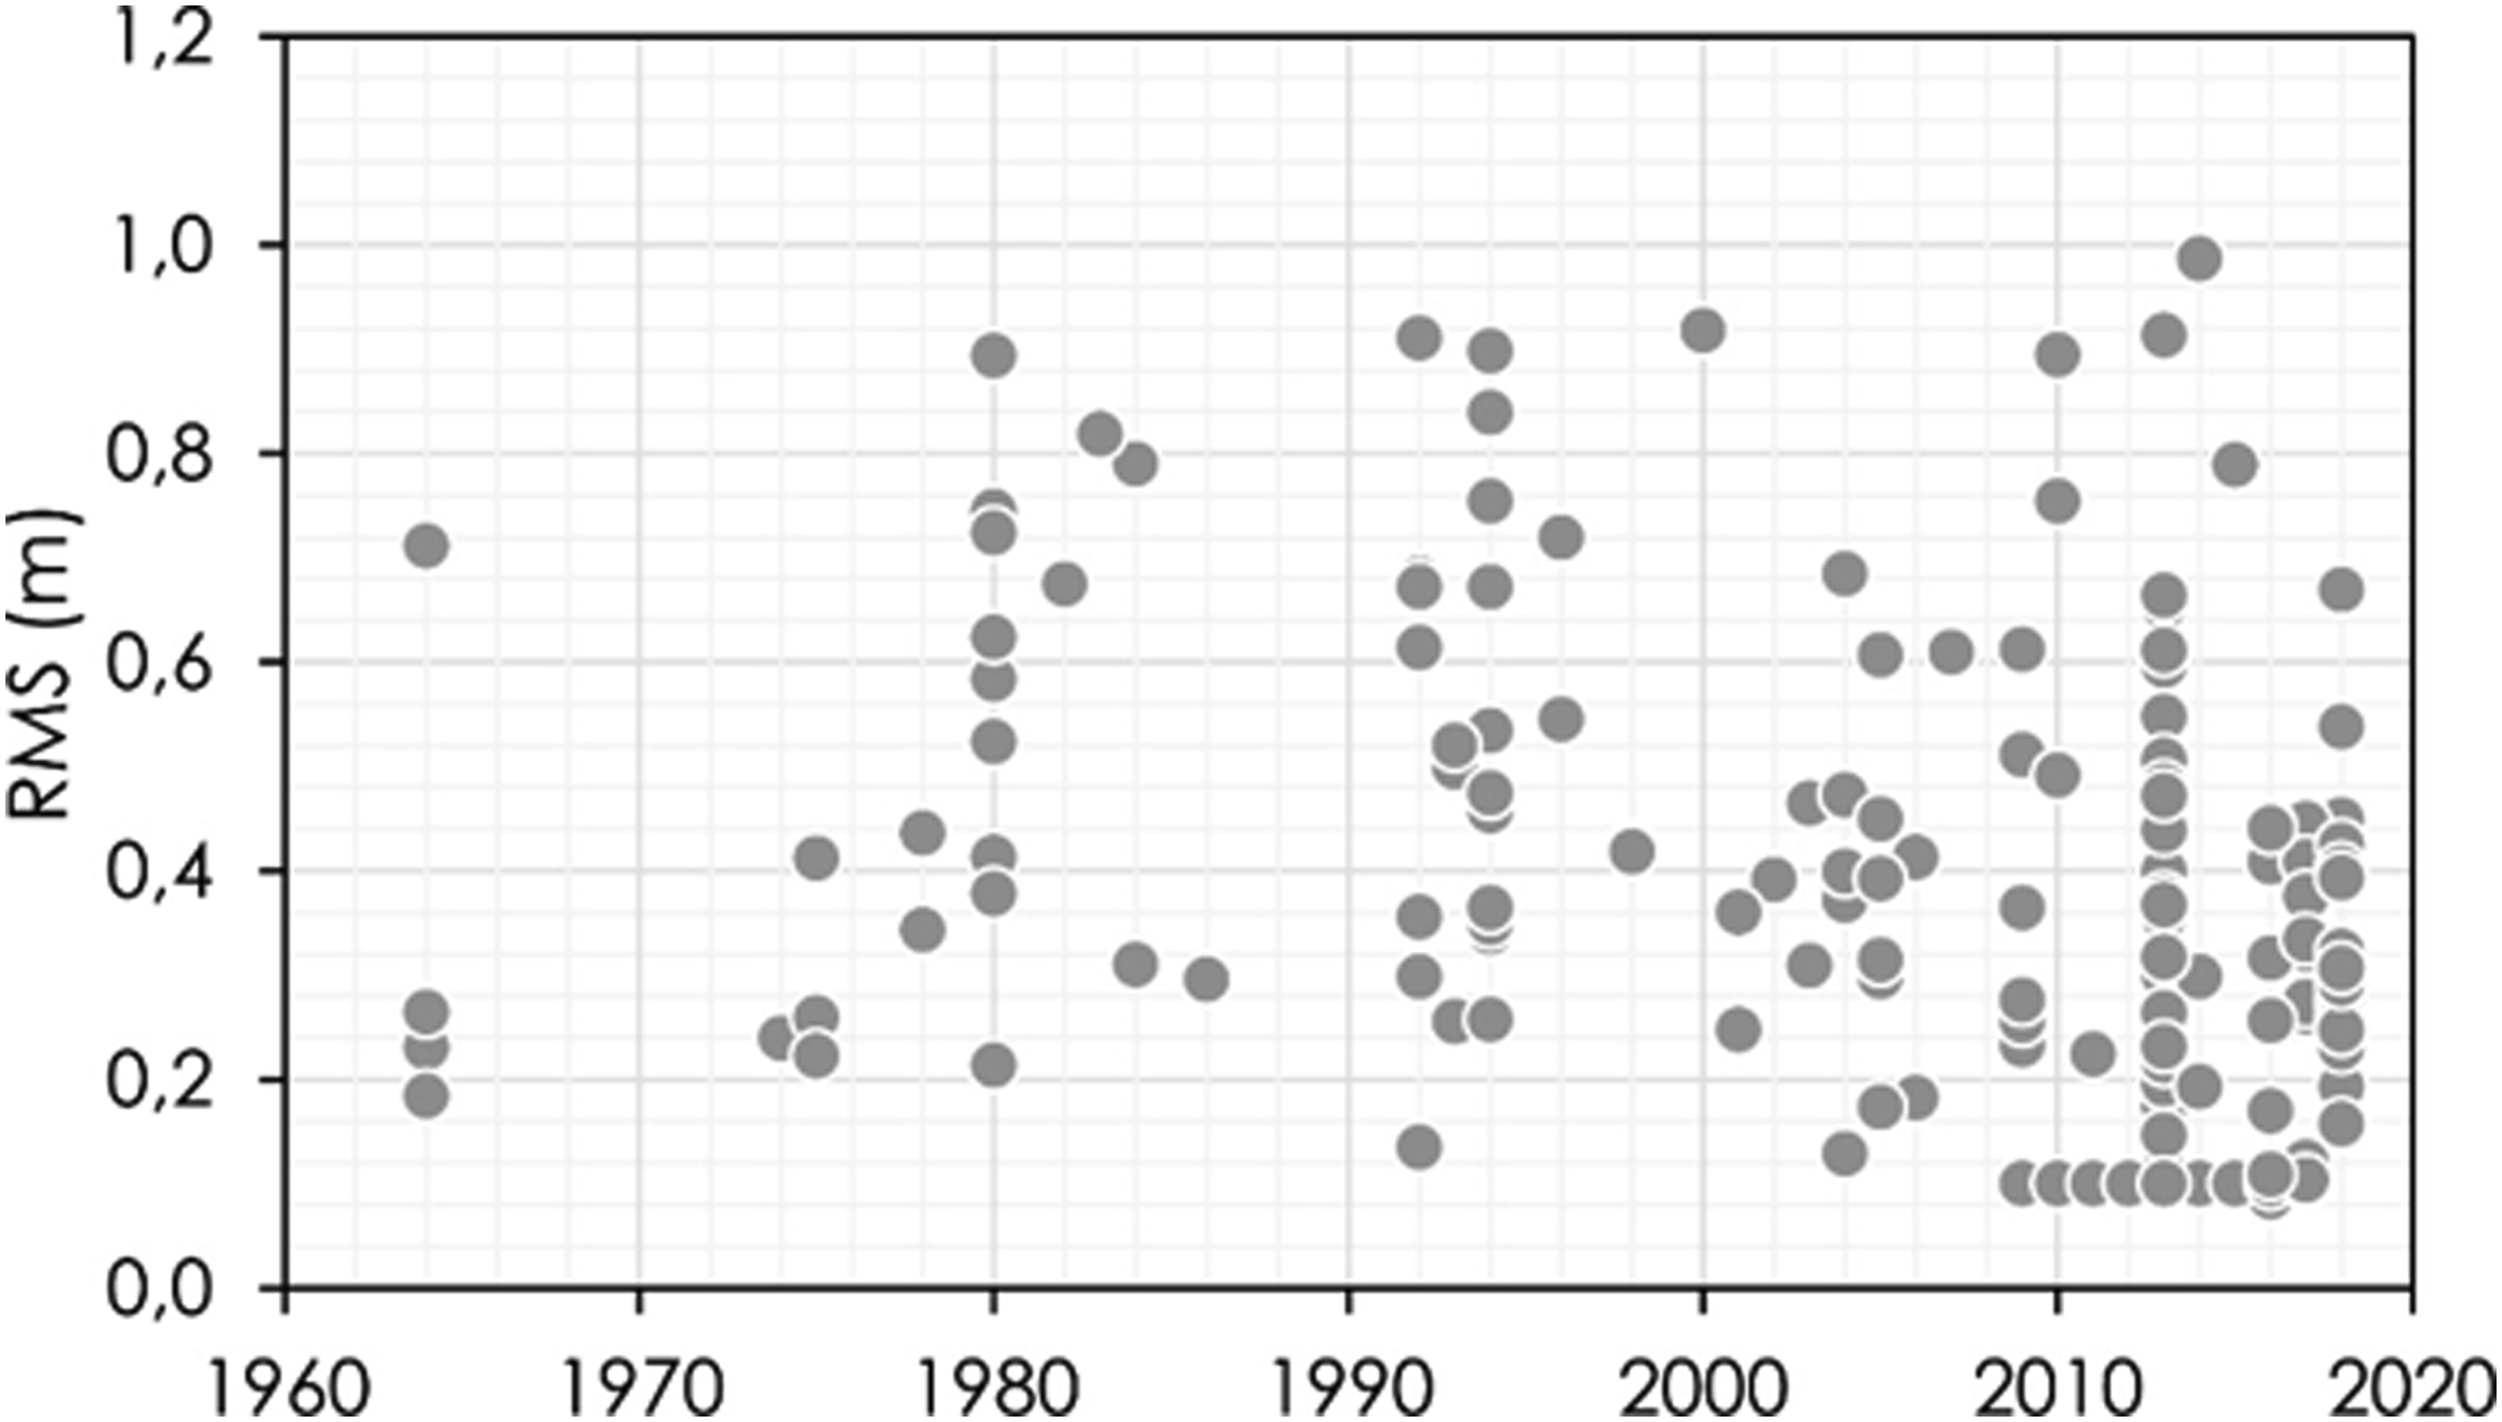
The maximum high tide visible in aerial photograph/satellite images or recorded in topographic surveys was used as a proxy in the identification of the shoreline. This limit generally coincides with the beginning of the foredune where the rear beach is stabilized. Historical aerial photographs available for 45 beaches were georeferenced and complemented with detailed topographical surveys and Google Earth Pro satellite images. Figure 3 depicts the spatial-temporal distribution of topographic surveys, aerial photographs, satellite images and survey maps used in the analyzed beaches. The error in the shoreline position from aerial photographs and satellite images was estimated based on the criteria of Pixel Representativeness and Mean Square Error/RMS (Araujo et al., 2009), thus ensuring errors less than 1 m. To constrain the error where no detailed aerial photographs were available, in situ control stations points were referenced with a Differential GPS in beaches. Figure 4 shows the availability of aerial and satellite images which additionally fulfilled the criterion RMS < 1m. The rates of change were classified according to Rangel-Buitrago et al. (2015) four categories of coastal evolution trend: high erosion (>−1.5 m/yr), erosion (between −0.2 and −1.5 m/yr), stability (between −0.2 and +0.2 m/yr) and accretion (>+0.2 m/yr). (a) Spatial-temporal distribution of topographic surveys (magenta), aerial photographs (cyan), satellite images (blue) and survey maps (black) used in the analysis of the shoreline evolution in 45 beaches. (b) same as (a) but distributed latitudinal. (c) Latitudinal distribution of the annual shoreline rate of change for each beach classified according to Rangel-Buitrago et al. (2015) categories. RMS error for the 201 aerial photographs and satellite images used in the study.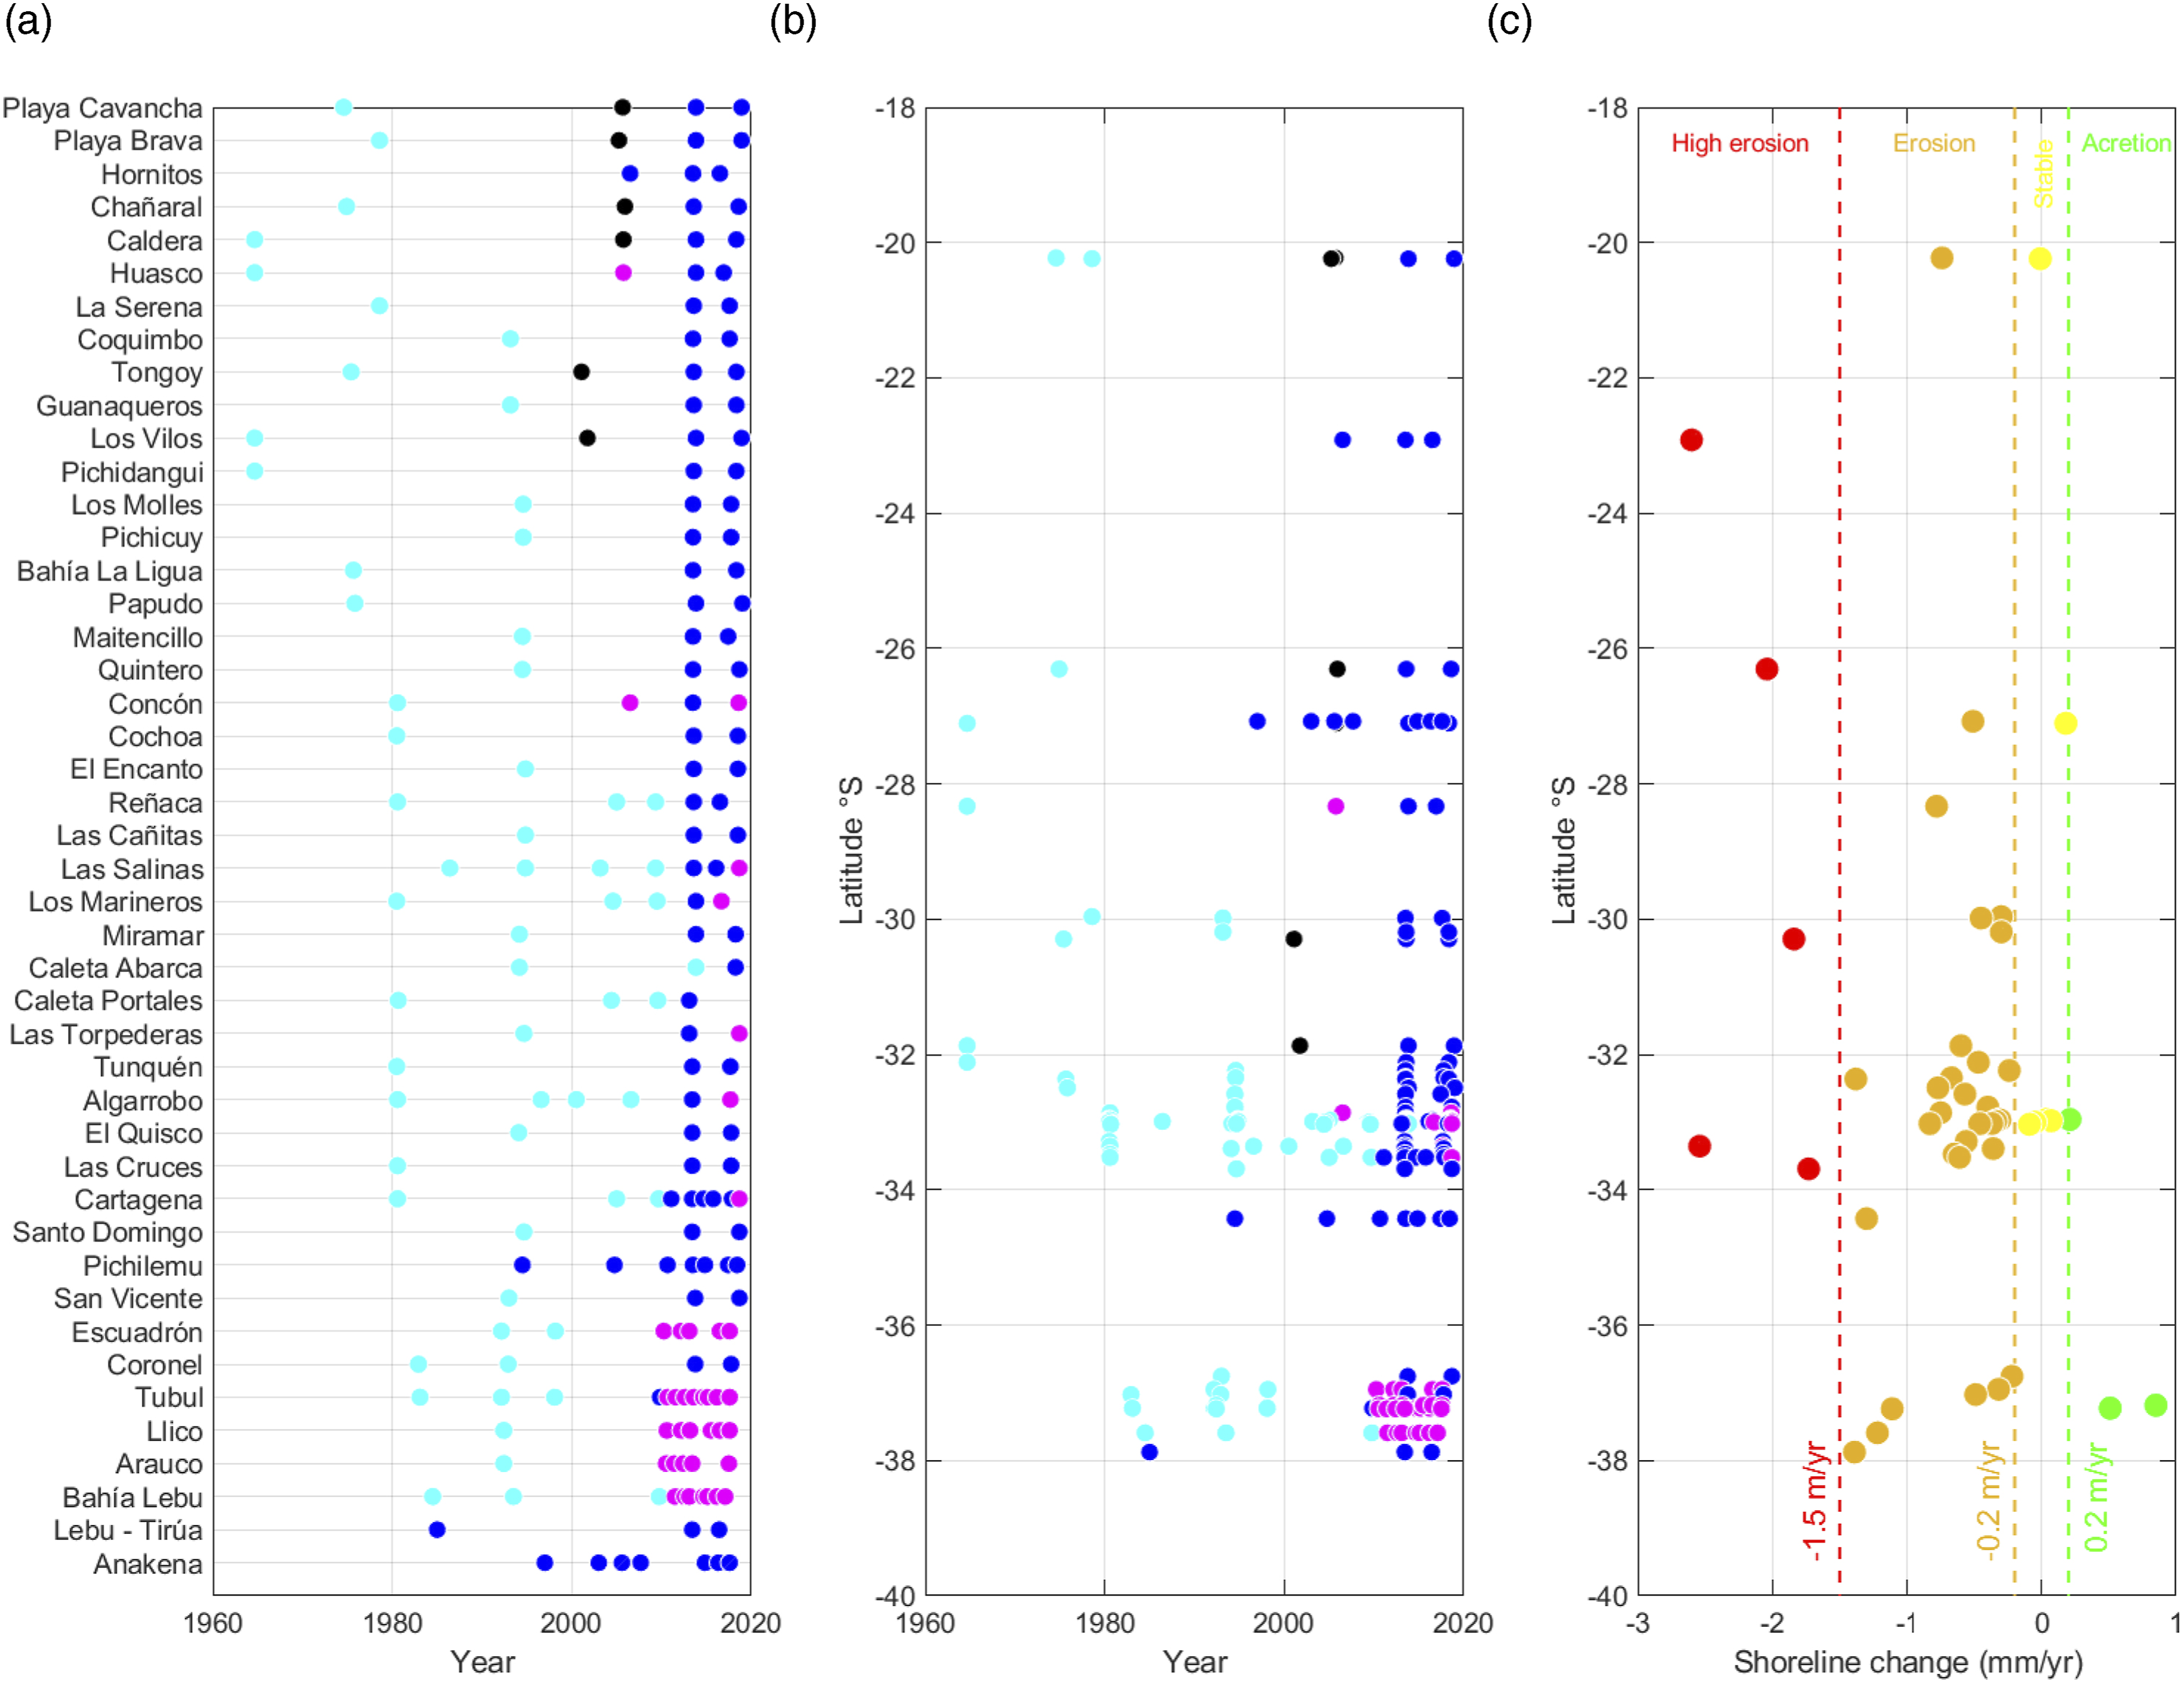
IV Results
Changes in the shoreline position in 45 beaches were determined from 39 topographic surveys, 63 aerial photographs and 91 satellite images and 6 survey maps (Figure 3(a)). The sampling frequency and periods differ among beaches, the longest period being 54 years between 1964 and 2018 (Caldera, Los Vilos and Pichidangui) and the most recent 2006–2016 (Hornitos). The mean range of analysis was 32.6 years. The total number of data sources ranged from 3 to 12 (Tubul); being 4,4 data sources the average (Tables A1 and A2).
Overall, 2903 transects were analyzed in 45 beaches which, combined with the data sources, account for 13,150 shoreline positions used to compute shoreline rates of change. The latitudinal distribution or sites (Figure 3(b)) shows an uneven availability of sources. The earlier data correspond to aerial photographs while satellite images were generally available after 2010, during winter and spring months. With the exception of two topographic surveys in Huasco and Concón, most of the topographic surveys (37) were conducted after a magnitude Mw = 8.8 earthquake occurred off the coast of Chile’s Maule region (Fritz et al., 2011), causing significant changes in sandy beaches (Martínez et al., 2015; Villagrán et al., 2013). As for their plan shape, 70% of the analyzed beaches were nearly rectilinear while the remaining 30% are partly confined in bays or located in estuaries. Additionally, 80% of the analyzed beaches were urban or peri-urban (semi-urban) and 20% rural (Vaz et al., 2009) (Table A1).
Figure 5 shows the annual shoreline rate of change classified in, for example, four headland bay beaches along north-central Chile (32º–33ºS). The beaches of Algarrobo (−2.54 m/yr between 1980 and 2017) and Santo Domingo (−1.73 m/yr; 1992–2018) showed high erosion rates for the winter season according to Rangel-Buitrago et al. (2015) categories. Pichilemu (−1.3 m/yr; 1992–2018) presented erosion rates for data covering both winter and part of spring. Lebu-Tirúa (−1.39 m/yr; 2013–2016) also showed erosion rates for a relatively short period where data was available (may). Figure 6 depicts, in addition, three pocket beaches which erosion rates (between −0.2 and −1.5 m/yr) in north-central Chile (32º-33ºS). Sandy shorelines in Cartagena bay and Tunquén beach revealed erosion rates of −0.61 and −0.56 m/yr, respectively, for the same period and seasons (37 years for winter and spring). Finally, Los Molles (−0.24 m/yr; 1994–2017) also showed erosion rates for the winter-spring season. The sampling rate of aerial photographs and satellite images, however, hinders the role of individual storms or storm clustering in the erosional process. Spatio-temporal changes of the shoreline at headland bay beach in south-central Chile. Spatio-temporal changes of the shoreline in the embayed beaches of central-northern Chile.

Overall, 5 (11%) the 45 beaches analyzed presented high erosion rates, 31 (69%) presented erosion and, 6 (13%) were categorized as stable and only 3 (7%) showed accretion (Figure 7). Beaches with high erosion rates located in the north (Hornitos, Chañaral) and central Chile (Tongoy, Algarrobo, Santo Domingo – El Yali) correspond to extensive sandy shores. Annual shoreline rate of change in all beaches, classified according to Rangel-Buitrago et al. (2015) categories: erosion in red (>−1.5 m/yr), erosion in yellow (between −0.2 and −1.5 m/yr), stability in grey (between −0.2 and +0.2 m/yr) and accretion in green (>+0.2 m/yr). Annual shoreline rate of change in all beaches, classified according to Rangel-Buitrago et al. (2015) categories: erosion in red (>−1.5 m/yr), erosion in yellow (between 0.2 and −1.5 m/yr), stability in grey (between −0.2 and +0.2 m/yr) and accretion in green (>+0.2 m/yr).
The beaches with stable conditions are Playa Brave in Iquique, Caldera and various beaches in the neighboring cities of Viña del Mar and Valparaíso (Cochoa, Las Cañitas, Los Marineros and Caleta Portales); all corresponding to pocket beaches. The beaches showing accretion were El Encanto (Viña del Mar), Tubul and Llico. These last two experienced a coastal uplift of ∼1.4 m during the 2010 Maule Earthquake (Farías et al., 2010), which may explain the increase in width. The remaining beaches showed erosion. When compared to global trends, these results are consistent with studies showing that a substantial proportion of the world’s sandy coastline is eroding (Luijendijk et al., 2018; Mentaschi et al., 2018).
V Discussion
Coastal erosion can be caused by human activities or due to natural processes (Cai et al., 2009) associated to oceanographic, geophysical or hydrologic phenomena. Natural processes include the increase in the frequency and intensity of coastal storms, sea level rise, changes in wave direction, coseismic and/or interseismic subsidence, land subsidence due to natural consolidation of alluvial deposits, land changes due to glacial-isostatic rebound of the Earth’s crust and reduction of the sediment supply from rivers due to climate-driven changes in the hydrologic regime. Human activities include the reduction in sediment supply due to urban expansion, land reclamation and sand mining from rivers, dunes and beaches, the construction of dams, ports, buildings and coastal structures (groins, detached breakwaters, inlet jetties, seawalls and revetments), the extraction of algal cover and land subsidence due to excessive groundwater extraction and construction loads, among others. Determining the magnitude and cause of shoreline retreat, however, is challenging and cannot be straightforwardly generalized to a region covering nearly 2000 km of the CCZ.
Scientific evidence of erosion in Central Chile is scarce and has only established partial hypothesis on the role of the agents causing shoreline retreat (Martínez et al., 2007, 2011). During the analyzed period, three large subduction earthquakes with magnitudes greater than 8.0 and associated tsunamis (2010, 2014 and 2015) as well as smaller earthquakes (1985 and 1995) have caused severe morphological changes in different regions of the CCZ, to which the effects of storm surges and meteotsunamis are added (Carvajal et al., 2017). The occurrence of the 2010 Maule earthquake and tsunami (Fritz et al., 2011) boosted research on beach morphodynamics, incorporating metocean data in combination with modeling techniques (Carvajal et al., 2017; Winckler et al., 2017) and monitoring with video (Villagrán et al., 2014). Additionally, beach monitoring became more systematic after the extreme event of 8 August 2015 (Martínez et al., 2018; Agredano et al., 2019), which caused considerable losses in coastal infrastructure (Winckler et al., 2017). Nevertheless, knowledge about climate-change driven impact on shoreline retreat, tectonic control and anthropization on the Chilean coast is incipient and its consideration is vital to the future impacts.
For this active seismo-tectonic margin exposed to the Pacific Ocean, shoreline retreat can be attributed to a combination of climate-driven changes in wave climate, changes in mean sea level, coseismic subsidence, tsunamis, changes in the sediment supply from rivers and local effects. The possible relations with shoreline changes are explored as follows.
Results show that the analyzed beaches showed severe changes, with high erosion to erosion rates in short periods of time. High erosion rates are evident in headland bay beaches, which presented larger erosion in the area of maximum curvature (close to the rocky promontory) to a lesser extend in the rectilinear area. These systems are strongly dependent on the interaction with Andean watersheds, which provide the sediments that are redistributed by longshore currents, which in Chile is, with a few exceptions, from south to north. The study of this type of interaction is, however, embryonic in the study area, and has been focused on land use, water and great anthropic stressors, considering that most of the analyzed beaches are highly intervened by anthropic activities (Vargas et al., 2013; Pérez et al., 2015).
1 Changes in wave climate
One of the possible causes of the ubiquitous shoreline retreat in the analyzed beaches is large-scale changes in mean wave climate in north and Central Chile. Indeed, Winckler et al. (2020) showed that the strengthening, expansion and southward migration of the of the Southeast Pacific Subtropical Anticyclone (SPSA) partially explain the increase in the significant wave heights (
Along with slow-varying changes in mean wave climate, the increase in the frequency and severity of coastal storms occurring in the region could also alter the patters of beach erosion and/or accretion. Indeed, Winckler et al. (2020) showed that the number of extreme wave events increased between 1 and 12 per year in the same period and study area, rate which is slightly smaller than those by Martínez et al. (2018), who estimated that these events increased from an average of 5 per year by 1960s to currently 20 per year in Valparaíso. Recent topographic surveys have shown drastic geomorphological changes in some of the analyzed beaches during these events (Agredano et al., 2019). Unfortunately, the spatial-temporal availability of topographic surveys, aerial photographs, satellite images and survey maps is too coarse to evaluate the relation between extreme events and decadal trends in shoreline changes.
2 Changes in relative mean sea level
Coastal erosion is very sensitive to RMSL, defined herein as the monthly mean sea level related to a local reference land level, as measured by tide gauges. The availability of long-lasting records throughout the CCZ is, however, scarce (Winckler et al., 2020). RMSL records at 9 stations with more than 30 years of data show that historical trends are spatially heterogeneous. The northern stations of Iquique (20.2°S, 1984–2016) and Antofagasta (23.7°S, 1946–2016) show decreasing rates of −1 mm/yr, probably associated to the interseismic coastal uplift occurring since the 1877 earthquake (Métois et al., 2013), which could be faster than sea-level rise. Caldera (27.1°S, 1950–2015), in contrast, shows an increase +1.5 mm/yr. The central region shows decreasing rates of −0.5 mm/yr in Coquimbo (30.0°S, 1980–2016) and −1 mm/yr in Valparaíso (33.0°S, 1944–2016), followed by positive trends of +4.5 mm/yr in San Antonio (33.6°S, 1985–2016) and +1.5 mm/yr in Talcahuano (36.7°S, 1949–2015). With the exception of San Antonio, RMSL rates are smaller than global absolute sea-level trends of +3.2 mm/yr estimated for 1993–2010 (Church et al., 2013). Considerable differences between the neighboring stations could be attributable to differences in seismicity (e.g. Comte et al., 1986), secular subsidence (i.e. slow process occurring after a load is applied) or local effects. The rates of RMSL changes are also affected by ENSO events causing a rise (drop) in the absolute mean sea level of up to 30∼40 cm during strong El Niño (La Niña) years (Enfield and Allen 1980; Reguero et al., 2018).
As observed, the CCZ being one of the most seismically active margins on the planet (Giesecke et al., 2004), RMSL changes reflect climate change, climate variability and crustal deformation throughout the seismic cycle (Montecino et al., 2017), among other phenomena acting at different spatial-temporal scales. RMSL records are spatially heterogeneous and cannot explain by themselves the historical trends observed in the analyzed beaches. The limited understanding of the fundamental processes of the seismic cycle in subduction zones, including those that control the recurrence and size of large earthquakes which trigger coseismic uplift or subsidence (Moreno et al., 2018), should be further explored on a local level for each beach.
3 Coseismic uplift and subsidence
The study area has been affected by 6 large earthquakes within the analyzed period, some of which caused significant seafloor changes (i.e. > |20 cm|) which could partially explain shoreline changes within a decadal scale. These changes, coseismic uplift/subsidence obtained from the Nevada Geodetic Laboratory (Blewitt et al., 2016), post tsunami surveys and source inversions are detailed for these earthquakes at each 45 beaches on Table A3. Coseismic changes, which can be highly variable in space, determine the fate of shoreline changes: while coseismic subsidence in combination with sea level rise enhances beach erosion due to the increased RMSL, coastal uplift may induce accretion.
Between the extreme north (20°S) and Coquimbo (32°S), seafloor changes have been rather small during the analyzed period. Beaches in Iquique, for example, were affected by ∼0.04 m uplift and ∼0.035 m subsidence during the Mw 7.8 2005 Tarapacá intermediate depth earthquake (Delouis and Legrand, 2007) and the much shallower Mw 8.0 2014 Iquique (Gusman et al., 2015), respectively. Coastal uplift of ∼0.5 m was recorded during the Mw 8.1 1995 Antofagasta earthquake (Pritchard et al., 2002), but uplift in Hornitos beach was negligible (Barrientos and Tanioka, 1997). GPS data also shows a ∼0.15 m subsidence in Coquimbo Region (La Serena, Herradura, Tongoy and Guanaqueros) during the Mw 8.0 Illapel earthquake (Heidarzadeh et al., 2016). In all these cases, for typical beach slopes of 5%–10%, shoreline recessions would be of a few meters, according to Bruun’s rule (1962).
In contrast, the central and south regions (32°S to 38°S) were affected by the Mw 8.8 2010 Maule Earthquake (Fritz et al., 2011) which caused maximum uplifts of ∼2 m in beaches like Tubul and Lebu, and a subsidence of ∼0.2–0.8 m in Pichilemu, depending on the type of record (Delouis and Legrand, 2007; Farías et al., 2010; Quezada et al., 2010a, 2010b; Vargas et al., 2011). Additionally, Valparaíso region was affected by a generalized uplift of ∼60 cm during the Mw 8.0 1985 Chilean Earthquake (Bravo et al., 2019; Castilla, 1988). These shoreline changes triggered by the 2010 earthquake are comparable with centuries of sea-level-rise due to climate change and could generate chronic shoreline changes.
The nearly 20-year evolution of Pichilemu (Figure 8) provides an interesting case of significant shoreline recession following the 2010 Maule Earthquake. In 2003, the beach was characterized by a wide backshore and dunes (a,b), the latter which were enhanced with plantation of Ammophila arenaria and access-control fences (c). The February 27th tsunami flooded the dune but caused no significant change in beach morphology. In the subsequent months, due to the significant coseismic subsidence, the dunes begun to erode (e) until a house (f, g) was washed away. By 2012, the coastline had receded ∼50 m from its pre-earthquake position and remained relatively stable, with seasonal changes, until 2018 (h). In recent months, the backshore advanced (i) due to both natural processes and small-scale dune restoration projects. In contrast, Tubul and Lebu provide evident counter-examples of accreting beaches following the 2010 Maule Earthquake. As reported by Martínez et al. (2015) the width of these beaches was incremented by ∼100 m and a few tens of meters, respectively, as product and of a coastal uplift following the earthquake. Series of photographs evidencing the significant shoreline recession following the 2010 Maule Earthquake in Pichilemu (34°25′33.55″, 72°2′15.09″). Photographs’ credits: (a) to (g) Nicolás Recordón. (i) Pablo Sanz.
4 Tsunamis
The role of earthquake-induced tsunamis has shown to be minor in decadal-scale shoreline changes. In some cases, tsunamis triggered significant shoreline changes which returned to pre-earthquake conditions within years-to months, given that coseismic land changes were minor. For example, the southernmost part of La Serena beach was affected by a ∼100 m shoreline retreat following the 2015 Illapel earthquake, which was recovered in the following months (Contreras-López et al., 2017). This relatively rapid recovery was observed in other sandy coastlines such as the Mataquito sand split following the 2010 Maule Earthquake (Villagrán et al., 2013) and the northern beach in Tongoy after the 2015 Illapel Earthquake (Contreras-López et al., 2017).
5 Reduction of the sediment supply from rivers
Among the analyzed cases, a few beaches are fed by rivers which basins have been intervened with dams, affected by illegal/deregulated sand mining or expanding croplands which altogether favor beach erosion and ecosystem degradation. From north to south, the beaches (rivers) are La Serena (Elqui), Concón (Aconcagua), Santo Domingo (Rapel) and Escuadrón/Coronel Bay (Biobío river). All these beaches show erosion or high erosion rates during the analyzed period. In some cases, the relation between upstream interventions and coastal erosion is evident. In La Serena, Puclaro Dam was built on the Elqui River in 1999 to benefit downstream irrigators and indirectly urban water consumers (Noguera and Vidal, 1999). According to the National Hydraulic Institute (INH, 2020), the dam had accumulated ∼0.77 × 10⁶ m3 by 2018, which, in addition to ∼2.29 × 10⁶ m3 of sand extraction downstream between 2009 and 2020, may partly explain the erosion rate (−0.30 m/yr) during the analyzed period.
In other cases, the cause-effects mechanism can only be hypothesis. Illegal sand extraction is rather large but unquantified in Aconcagua River, the main sediment source of Concón beach (Nehren et al., 2016). Though there are no large dams in the basin, expanding croplands, growing population and a changing climate (Webb et al., 2020) have reduced the river flow and sediment inflow to the beach, which shows erosional rates (−0.75 m/yr) within the analyzed period. Further south, the construction of Rapel dam in 1968 (Alcayaga et al., 2019) is presumably one of the sources of beach erosion (−1.73 m/yr) in Santo Domingo – El Yali (Contreras-López et al., 2014). This hypothesis is based on the similar sediment characteristics found in the river and the beach (Vergara, 2014). Finally, the hydrological regime of Biobio river was significantly altered by the construction of Pangue and Ralco dams in 1996 and 2004, respectively (García et al., 2011), effect which adds to legal gravel/wet-pit mining activities of ∼0.25×10⁶ m3/yr (Álvarez, 2019) in the river basin. The combination of the local effects in the erosion of Escuadrón (−0.32 m/yr) and Coronel Bay (−0.49 m/yr) remains unclear.
6 Current gaps
Being the first effort to systematize the state of erosion on a national scale, it is necessary to emphasize the scientific gaps that are urgent to solve in order to provide adequate knowledge for decision-making: 1. Although changes in a few coastal systems within the coastline in Chile have been studied in different spatio-temporal scales, it is necessary to deepen the relationship between short-term climate variability and long-term climate impacts with natural and anthropic factors. Though satellite images gradually provide better information to improve interpretations of coastline changes, error control and validation are aspects that have not yet been fully resolved local scale uncertainty (Wessel and Smith, 1996; Pardo-Pascual et al., 2012; Vitousek et al., 2017; Vos et al., 2019; Vousdoukas et al., 2020; Castelle et al., 2021). 2. The relationship between coastal erosion and interannual climate variability in the Pacific in the form El Niño Southern Oscillation (ENSO), the Southern Annular Mode (SAM) and the Pacific Decadal Oscillation (PDO) has not been established in Chilean sandy shorelines. The relation between ENSO and coastal erosion, however, seems to be significant, given its role in the recurrence and intensity of the swells that have affected the Chilean coast in recent years (Martínez et al., 2018) and the relationship both with the variability of rainfall and river flow in the Andean basins of the country (Martínez et al., 2012; Caviedes and Waylen, 1998; Waylen and Caviedes, 1990). Recently, Smith and Barnard (2021) evaluated the impacts of the 2015/2016 El Niño on California’s sandy beaches – one of the strongest of the last 145 years – finding a significant correlation found between cumulative wave energy flux and record shoreline changes, as well as alongshore erosional patterns indicating statewide north to south net sand transport direction. In relation to the wave-beach-dune interaction, the geomorphological sensitivity of the sandy coastlines to extreme waves is an important aspect to establish given their role in stabilizing the beach against erosion. Recent studies have established that the increase in the frequency of coastal storms (Hs> 9 m) and an alteration in wave direction can lead to significantly greater erosion of coastlines with the presence of dunes (Flor-Blanco et al., 2021). 2. Understanding how the beaches recover after extreme events is a priority to look for adequate restoration alternatives a tectonically active coast. Studies of beach response to extreme events in England have shown that the magnitude and alongshore variability of beach response to storms can be grouped into four key response types controlled by the level of exposure, angle of storm wave approach and degree of embaymentisation. Konstantinou et al. (2021), for example, established that 7 of 23 beaches affected by an unprecedented sequence of storms in 2013/14 recovered more than 90% of their sediments in 3 years or less; while fully exposed beaches experienced a slow recovery after 3 years, semi-exposed beaches showed the highest net recovery. Erosional patterns in BEBs systems (sandy beaches in estuaries and bays) along the Australian coast, is related with the frequency of coastal storms, the rates of recovery and the proximity to sediment sinks and sources (e.g. dredging sites, deltas and river outlets) and anthropic interventions (Fellowes et al., 2021).
7 Adaptation measures
The selection of adaptive measures to reduce climate change impacts is essential to avoid future losses in the coastal area for the next decades (Ranasinghe, 2016) and pursue UN’s Sustainable Development Goals directly related to the coast (11, 13 and 15), according to the 2030 Agenda (UN, 2021). This is particularly relevant given the ubiquitous anthropization in coastal areas – that is, the conversion of open spaces, landscapes, and natural environments by human action – and the high value of coastal assets worldwide (Barragán and De Andres, 2015). In view of the expected sea-level-rise, future subduction earthquakes and the strong urban growth on the Chilean coast, a combination of hard measures for shoreline stabilization, beach and dune restoration, the conservation of ecosystems, the use of nature-based solutions, the improvement of drainage and the use of elevated buildings in lowlands and the acquisition and relocation of exposed structures (USACE, 2015). These adaptation measures are for short (2030–2050) and medium term (2080–2100), where it is necessary to consider the delay between the implementation and its results (Baills et al., 2020). Besides, accurate hazard projections are needed to better select the adaptation measures in specific locations, given their design life. In the case of Chile, where the wave climate is highly energetic, coastal morphology is shaped a strong tectonic activity and there is almost no experience of this type of adaptation measures, the use of mixed solutions that combine the resistant properties of hard measures with green infrastructure seems to be a road to explore.
VI Conclusions
Our analysis of shoreline changes in 45 beaches distributed along 2000 km the Chilean coast shows a strong erosional trend during the last four decades, which could be partially attributed to changes in wave climate, highly variable sea-level changes constrained by tectonic activity and the reduction of the sediment supply, among other local phenomena. As for future trends, coastal erosion is expected to be increasingly enhanced as the XXI century evolves, driven by sea-level rise and changes in wave climate. These more stringent forcing conditions will put pressure on beaches, dunes and wetlands, and will increase the damage likelihood of coastal infrastructure. Given the complexity and nature of the phenomena, it is necessary to deepen the understanding of cause-effect mechanisms at different spatial-temporal scales between shoreline erosion and geophysical, climate and anthropogenic factors of change.
A better understanding of global, regional and cause-effect mechanisms complementing the diagnosis provided herein is therefore needed to propose suitable adaptation schemes and strengthen resilience on tectonically active coasts affected by climate change.
Supplemental Material
sj-pdf-1-ppg-10.1177_03091333211057194 – Supplemental Material for Coastal erosion in sandy beaches along a tectonically active coast: The Chile study case
Supplemental Material, sj-pdf-1-ppg-10.1177_03091333211057194 for Coastal erosion in sandy beaches along a tectonically active coast: The Chile study case by Carolina Martínez, Patricio Winckler Grez, Roberto Agredano Martín, César Esparza Acuña, Iván Torres and Manuel Contreras-López in Progress in Physical Geography: Earth and Environment
Footnotes
Declaration of conflicting interests
The author(s) declared no potential conflicts of interest with respect to the research, authorship, and/or publication of this article.
Funding
The author(s) disclosed receipt of the following financial support for the research, authorship, and/or publication of this article: This work was supported by Agencia Nacional de Investigación y Desarrollo (ANID); ANID/FONDAP N°15110017, ANID/Millennium Science Initiative Program–ICN20, FONDECYT N°1200306 and ANID/FONDEF ID20I10404.
Supplemental material
Supplemental material for this article is available online.
References
Supplementary Material
Please find the following supplemental material available below.
For Open Access articles published under a Creative Commons License, all supplemental material carries the same license as the article it is associated with.
For non-Open Access articles published, all supplemental material carries a non-exclusive license, and permission requests for re-use of supplemental material or any part of supplemental material shall be sent directly to the copyright owner as specified in the copyright notice associated with the article.