
Abstract
Irrigation has been widely implemented across the globe as a mitigation strategy to combat climate change and erratic rainfall. Irrigation in the confined geographic region like the Arkansas Delta of the US has likely affected heat and moisture fluxes at the land surface with possible effects on regional climate conditions. Irrigation unquestionably benefits crop yields with direct water supplies. However, the effect of irrigation-climate interactions on Arkansas Delta crop yields remains unclear. In this study, we applied multiple satellite and climatic datasets to assess the influence of soybean irrigation in the US Arkansas Delta on the regional climate from 2003 to 2017 and how the resultant climate variability has affected soybean yields. Our findings show that soybean irrigation in the Arkansas Delta leads to statistically insignificant precipitation change and significant daytime and night time cooling during the growing season from June to August over the period of 2003–2017. Using a statistical crop yield model, we further demonstrate that such surface temperature cooling due to irrigation could enhance soybean yields as much as ∼1.13 (
Introduction
Fossil fuel combustion has warmed the planet by ∼ 1°C compared to the preindustrial era (IPCC, 2018). Negative effects of this warming on agriculture have already occurred and are projected to intensify further (Coffel et al., 2019). To combat climate change, irrigation has been widely implemented across globe as an important mitigation strategy. The influence of irrigation on climate has a long history of investigation (Mahmood et al., 2006). Irrigation induced land use transitions can significantly affect temperature, moisture, and circulation through biogeophysical and biogeochemical processes at the land-atmosphere interface (He and Lee, 2016; Liu et al., 2021). For example, irrigated cropland expansion in Northeast China could reduce average daily surface air temperature by increasing energy partitioning towards latent rather than sensible heat fluxes (He et al., 2020). In the US High Plains, a similar response has been documented, with the cooling effect of expanding irrigation leading to a 1.2°C decrease in the average daily near-surface temperature (Adegoke et al., 2003). In contrast, Chen and Jeong (2018) found a nighttime surface warming because of irrigation in the North China Plain, which was attributable to energy storage in the wetter soil during the daytime. The annual and seasonal precipitation have been affected as well. Boucher et al. (2004) suggested increased water vapor due to irrigation could increase local precipitation over irrigated areas in the Columbia Basin and the Snake River Plain in the US. Complicating this finding, however, is another work arguing that the enhanced surface pressure due to evaporative cooling of irrigation could sustain anticyclonic air circulation, thus inhibiting precipitation over irrigated areas in Gezira Scheme in East Africa (Alter et al., 2015). These reviews suggest that the impact of irrigation on local climates differs in different geographic regions.
The impacts of irrigation-induced climate variability on crop yields are an emerging and recent exploration. Over the last several decades, most attention focused on the water supply effects of irrigation on crop yields (Szilagyi, 2018). Irrigation increases crop yields by supplying an adequate amount of water to crops when rainfall is not sufficient or timely to meet the water demands of crops (Troy et al., 2015). For example, Kukal and Irmak (2020) found that irrigation could reduce crop yield variability by 41% across U.S. through meeting crop water demand in arid/semi-arid regions, buffering within-season precipitation variability in humid/sub-humid regions, or remedying other environmental variabilities. Crop yield is sensitive to changes in temperature and precipitation (Ray et al., 2015; Zhao et al., 2017; Li et al., 2019; Lesk et al., 2020), as such the precipitation or temperature changes due to irrigation can affect crop yield. The cooling effect of irrigation shifted the high temperature thresholds, reduced heat stress, increased photosynthesis, and thereby increased maize yield in the state of Nebraska in the US (Li et al., 2020). Similarly, the irrigation and agricultural intensification in the US Midwest reduced killing degree days for crops, thus benefiting maize and soy yields (Coffel et al., 2022). While most previous studies focus on the effects of irrigation resultant mean or extreme temperature variability on crop yields, few studies assessed how changing daytime and nighttime temperature influenced crop yield due to irrigation.
The US state of Arkansas, particularly in the Delta region (Figure 1) has experienced a tremendous increase in irrigation lands. The irrigated areas in Arkansas expanded by 121% from 1978 to 1997 and continued to increase to 4.9 million acres in 2017 (Evett et al., 2003; USDA, 2017). Because of the huge water demand for agriculture, Lonoke County in the Arkansas Delta drew off an average of 584.5 million gallons of groundwater per day for irrigation in 2015 (Walkenhorst, 2018). Such massive groundwater pumping has resulted in aquifer overdraft, particularly in the Arkansas Delta, leaving large areas of the Delta as critical groundwater zones (West et al., 2020). Given the continuing global warming, the reduction in the availability of groundwater, as well as erratic rainfall and frequent summer droughts, poses immense threats to agricultural sustainability in Arkansas. A quantitative understanding of the interactions of irrigation, climate variability, and crop yield is required for Arkansas farmers and policymakers to promote and implement sustainable irrigation practices. The Arkansas Delta Study Area. Graticule Datum: North American Datum 1983.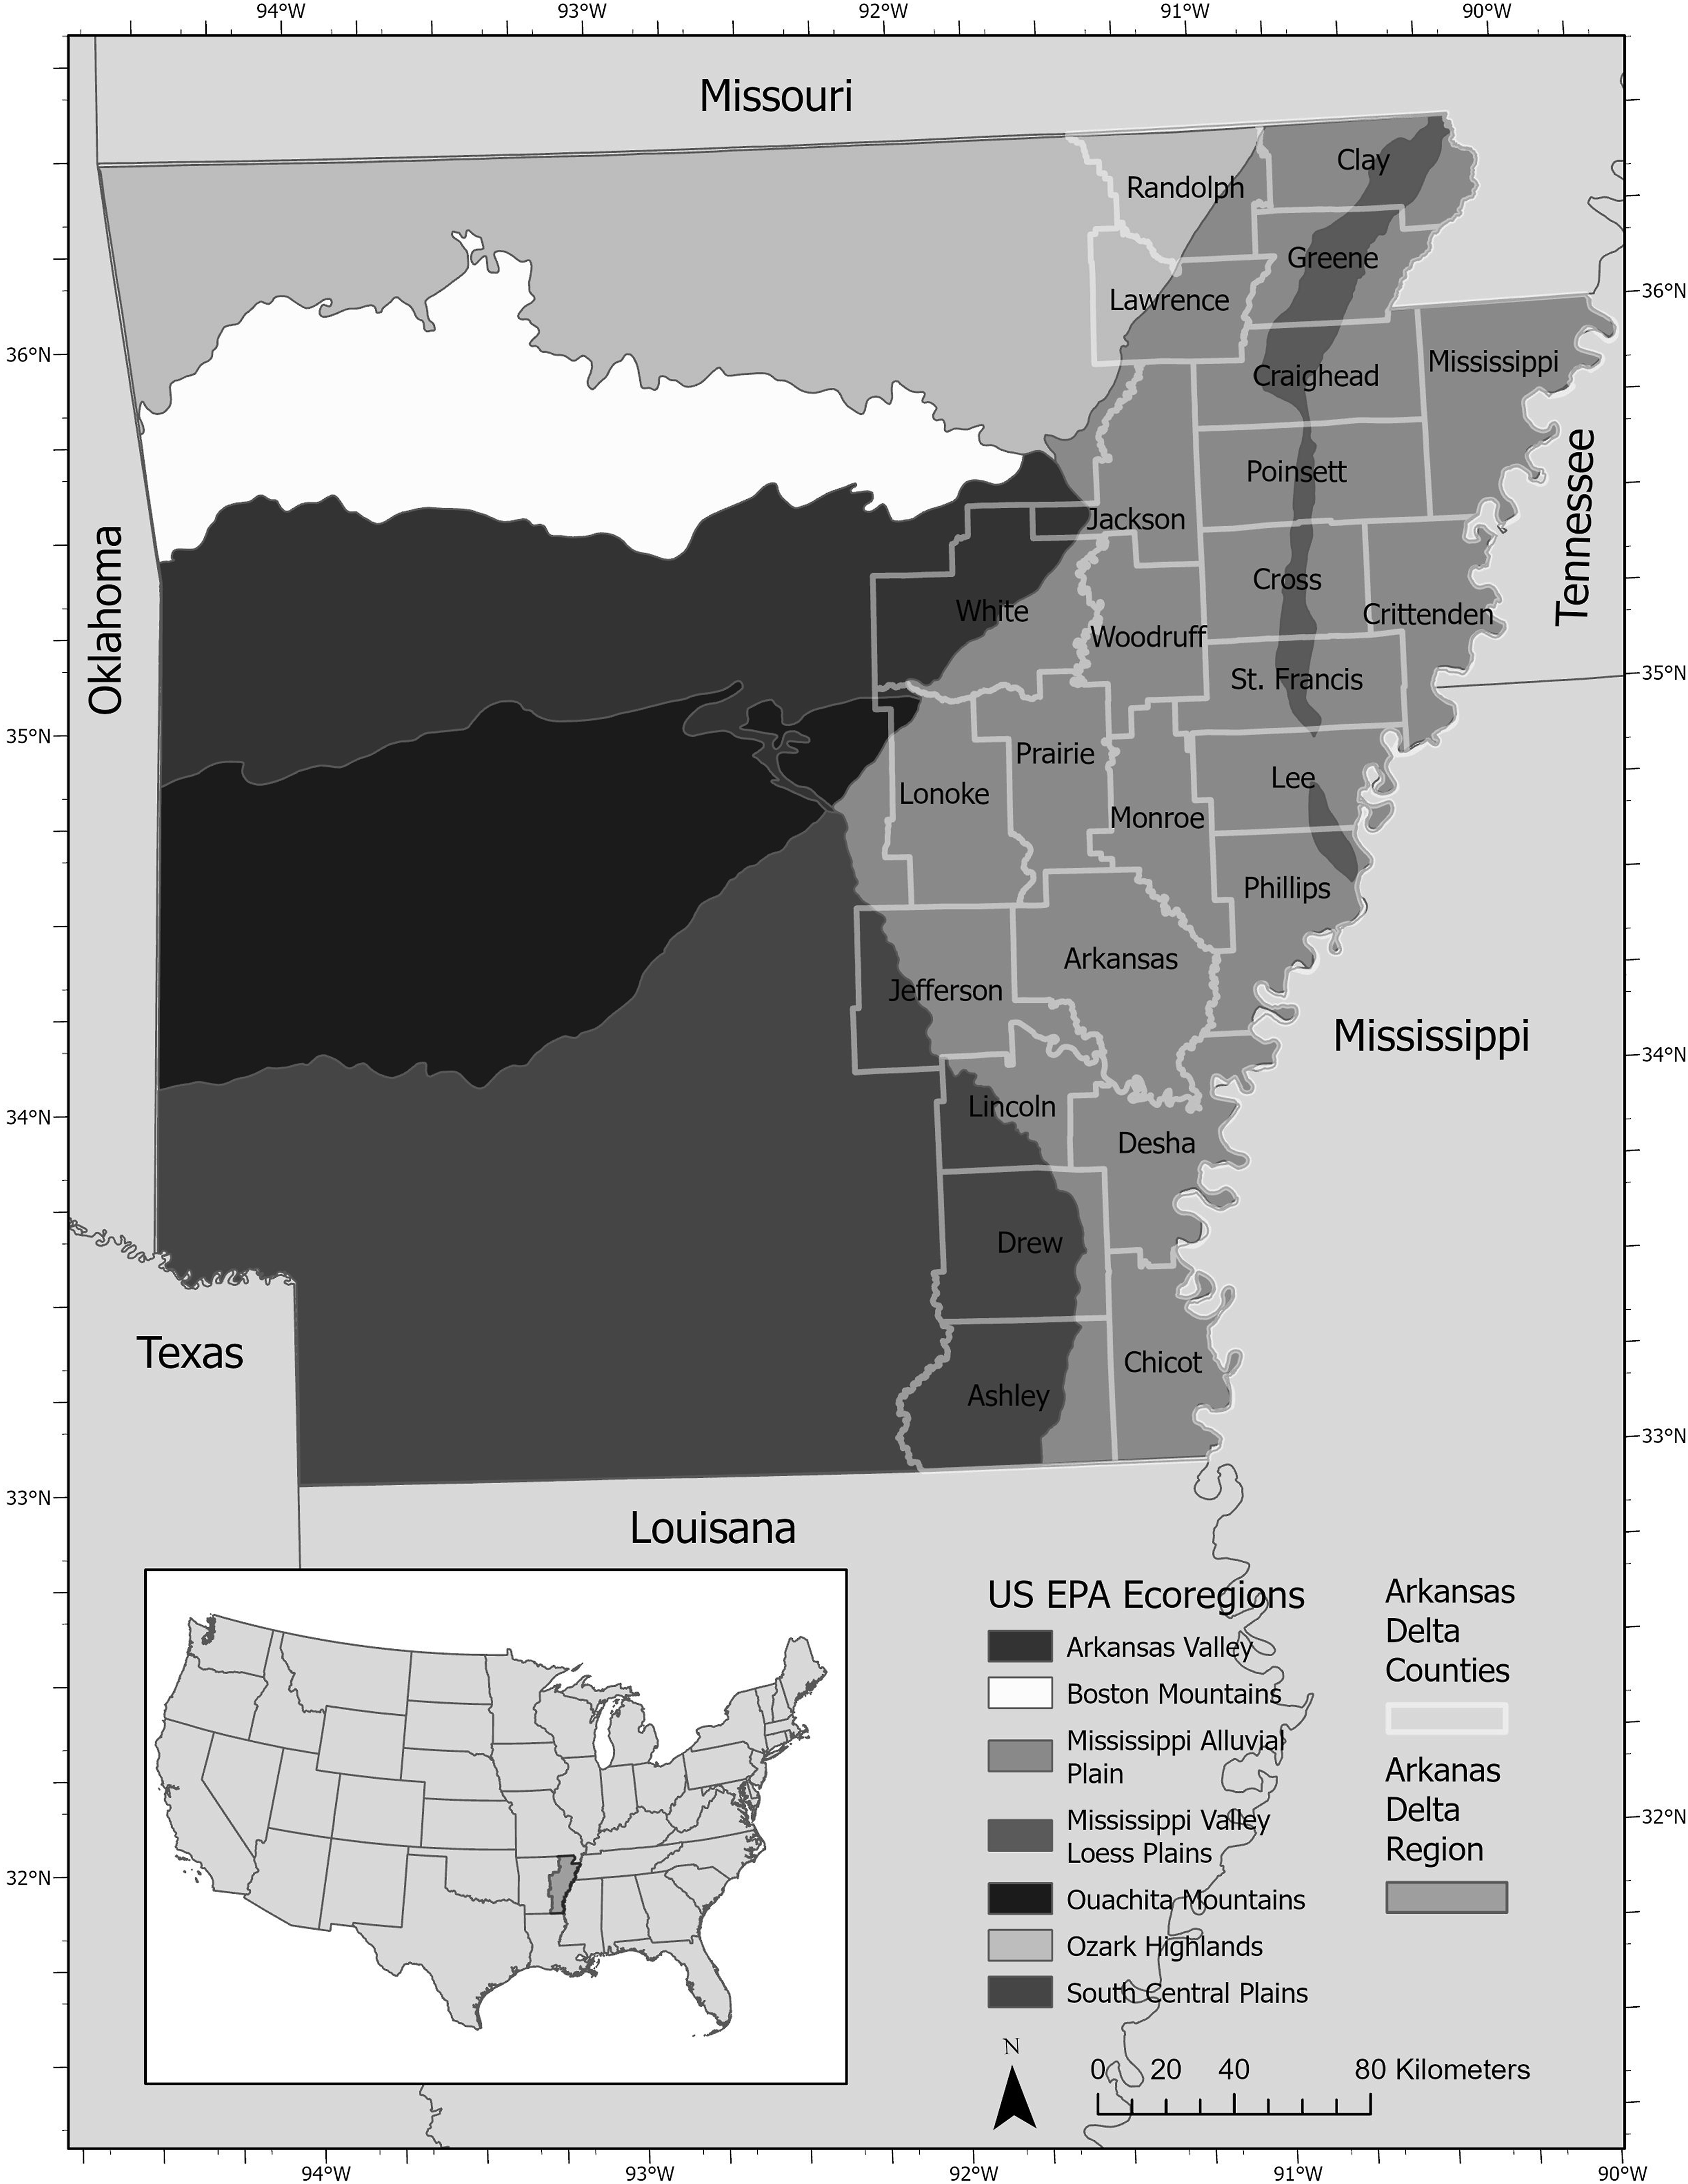
In this study, we filled these research gaps by investigating the effects of irrigation-induced climate variability on soybean yields in the Arkansas Delta by utilizing remote sensing, national inventory, and climate datasets. We address three research questions: (1) What are changes in the spatiotemporal dynamics of soybean areas in the Arkansas Delta from 2003 to 2017? (2) How does the irrigation of soybeans influence Delta climate during the growing seasons from June to August? (3) How does the changed climate affect soybean yields?
Materials and method
Study area
The Arkansas Delta located in eastern part of Arkansas (Figure 1), is extremely flat with little variations in local elevation. Most Arkansas Delta counties are wholly within the Mississippi Alluvial Plain ecoregion, but several counties also contain portions of the Mississippi Loess Valley (Clay, Greene, Craighead, Poinsett, Cross, St Francis, Lee, and Phillips) and South Central Plains (Jefferson, Lincoln, Drew, and Ashley) (Figure 1). Jackson and White counties (Mississippi Alluvial Plain and Arkansas Valley) and Lonoke County (Mississippi Alluvial Plain and Ouachita Mountains) also have mixed ecoregion compositions (Figure 1). The Arkansas Delta has annual precipitation of ∼1250 mm and temperature of ∼16° (Scott et al., 1998). There are abundant productive Sharkey clay soil series formed from Mississippi River slack water depositions in the region (Francis, 2022). Such flat topography, temperate climate, and fertile soil lead the Arkansas Delta as a home to various crops, such as soybean, rice, and cotton.
Data
To identify the soybean lands in the Arkansas Delta, we obtained the Cropland Data Layer (CDL) from the US Department of Agriculture-National Agricultural Statistics Service (USDA-NASS) (https://nassgeodata.gmu.edu/CropScape/). CDL with a spatial resolution of 30 m was generated using moderate resolution satellite imagery and extensive agricultural ground truth (Boryan et al., 2011). There are more than 140 crop types (soybean included), provided by CDL. The accuracy for major crop types is approximately 95% in most regions, according to CDL metadata, with some exceptions in the early years (USDA-NASS, 2021). For instance, CDL for Arkansas in 1999 has an overall accuracy of ∼70% (USDA-NASS, 2021). CDL from 1997 to 2020 covers the entire continental US, while data in some states in some years (e.g., Arkansas in 1997–1998) are missing.
To differentiate irrigated from rainfed lands, we used the newly developed, annual-scale, Landsat-based Irrigation Dataset (LANID) at a 30-m spatial resolution from 1997 to 2017 (https://zenodo.org/record/5548555#.YgGrMS-B2SU). LANID was created by Xie et al. (2021) using a random forest classifier based on an automatic training sample generation method and satellite-derived vegetation indices (e.g., normalized difference water index (NDWI)) and environmental variables (e.g., pressure of water vapor) (Xie and Lark, 2021). Validating against more than 10,000 ground-truthing samples, LANID has an overall accuracy of 90% across all the years and regions. We validated the accuracy of LANID in the Arkansas Delta with USDA-NASS harvested areas for irrigated and rainfed soybean.
The daily minimum and maximum temperature were derived from Moderate Resolution Imaging Spectroradiometer (MODIS) Land Surface Temperature (LST) product (i.e., MYD11A2 Version 6.1) (https://lpdaac.usgs.gov/products/myd11a2v061/) (Wan et al., 2015). We used LST as it can better capture canopy energy balance and improve crop yield prediction (Zhu and Burney, 2022). The Aqua (MYD) satellite rather than Terra (MOD) was chosen because its overpass times of 01:30 and 13:30 are closer to the times of normal daily morning minimum and afternoon maximum temperature (Botje et al., 2022). The MYD11A2 Version 6.1 product with a spatial resolution of 1 km and a temporal resolution of 8-days is available from July 2002 to current. The quality control information is provided along with LST data. We decoded the quality control information using NASA MODIS-VIIRS ArcGIS Python Toolbox (https://git.earthdata.nasa.gov/projects/LPDUR/repos/arcgis-modis-viirs-python-toolbox/browse). The resulting mandatory QA flags (i.e., 00 for good quality, 01 for other quality, 10 for unproduced due to cloud effects, and 11 for unproduced due to other reasons) were used to retain the pixels with good quality (i.e., QA flag = 00). The daily precipitation was obtained from Daily Surface Weather Data (Daymet) version 3 (https://daymet.ornl.gov/getdata). Daymet has a spatial resolution of 1 km and was derived from a collection of statistical modeling techniques to interpolate and extrapolate from daily meteorological observations (Thornton et al., 2016). The daily climatic variables covering North America are available from 1980 to present.
The annual yield data for irrigated and rainfed soybean are available on USDA-NASS Quick Stats Database (https://www.nass.usda.gov/Quick_Stats/). USDA-NASS provides survey yield data for irrigated and rainfed soybean at the US county level from 1972 to 2018 in the Arkansas Delta. The unit of soybean yield is bushels per acre (bu/acre, hereafter), and a bu/acre of soybean is equivalent to 67 kg ha−1.
Considering the limited coverage and poor accuracy of CDL data in Arkansas before 2000 and the common years of the aforementioned datasets, the study period was set from 2003 to 2017. The crop yield and harvest area data from USDA-NASS for some counties may not cover the entire period; therefore, we used the available data for the following analyses.
Methods
We summarized data processing and statistical analyses in Figure 2 followed by the details of each step. The flowchart of the methods (green, golden, blue, and purple boxes denotes the input data, methods, intermediate results, and final results, respectively).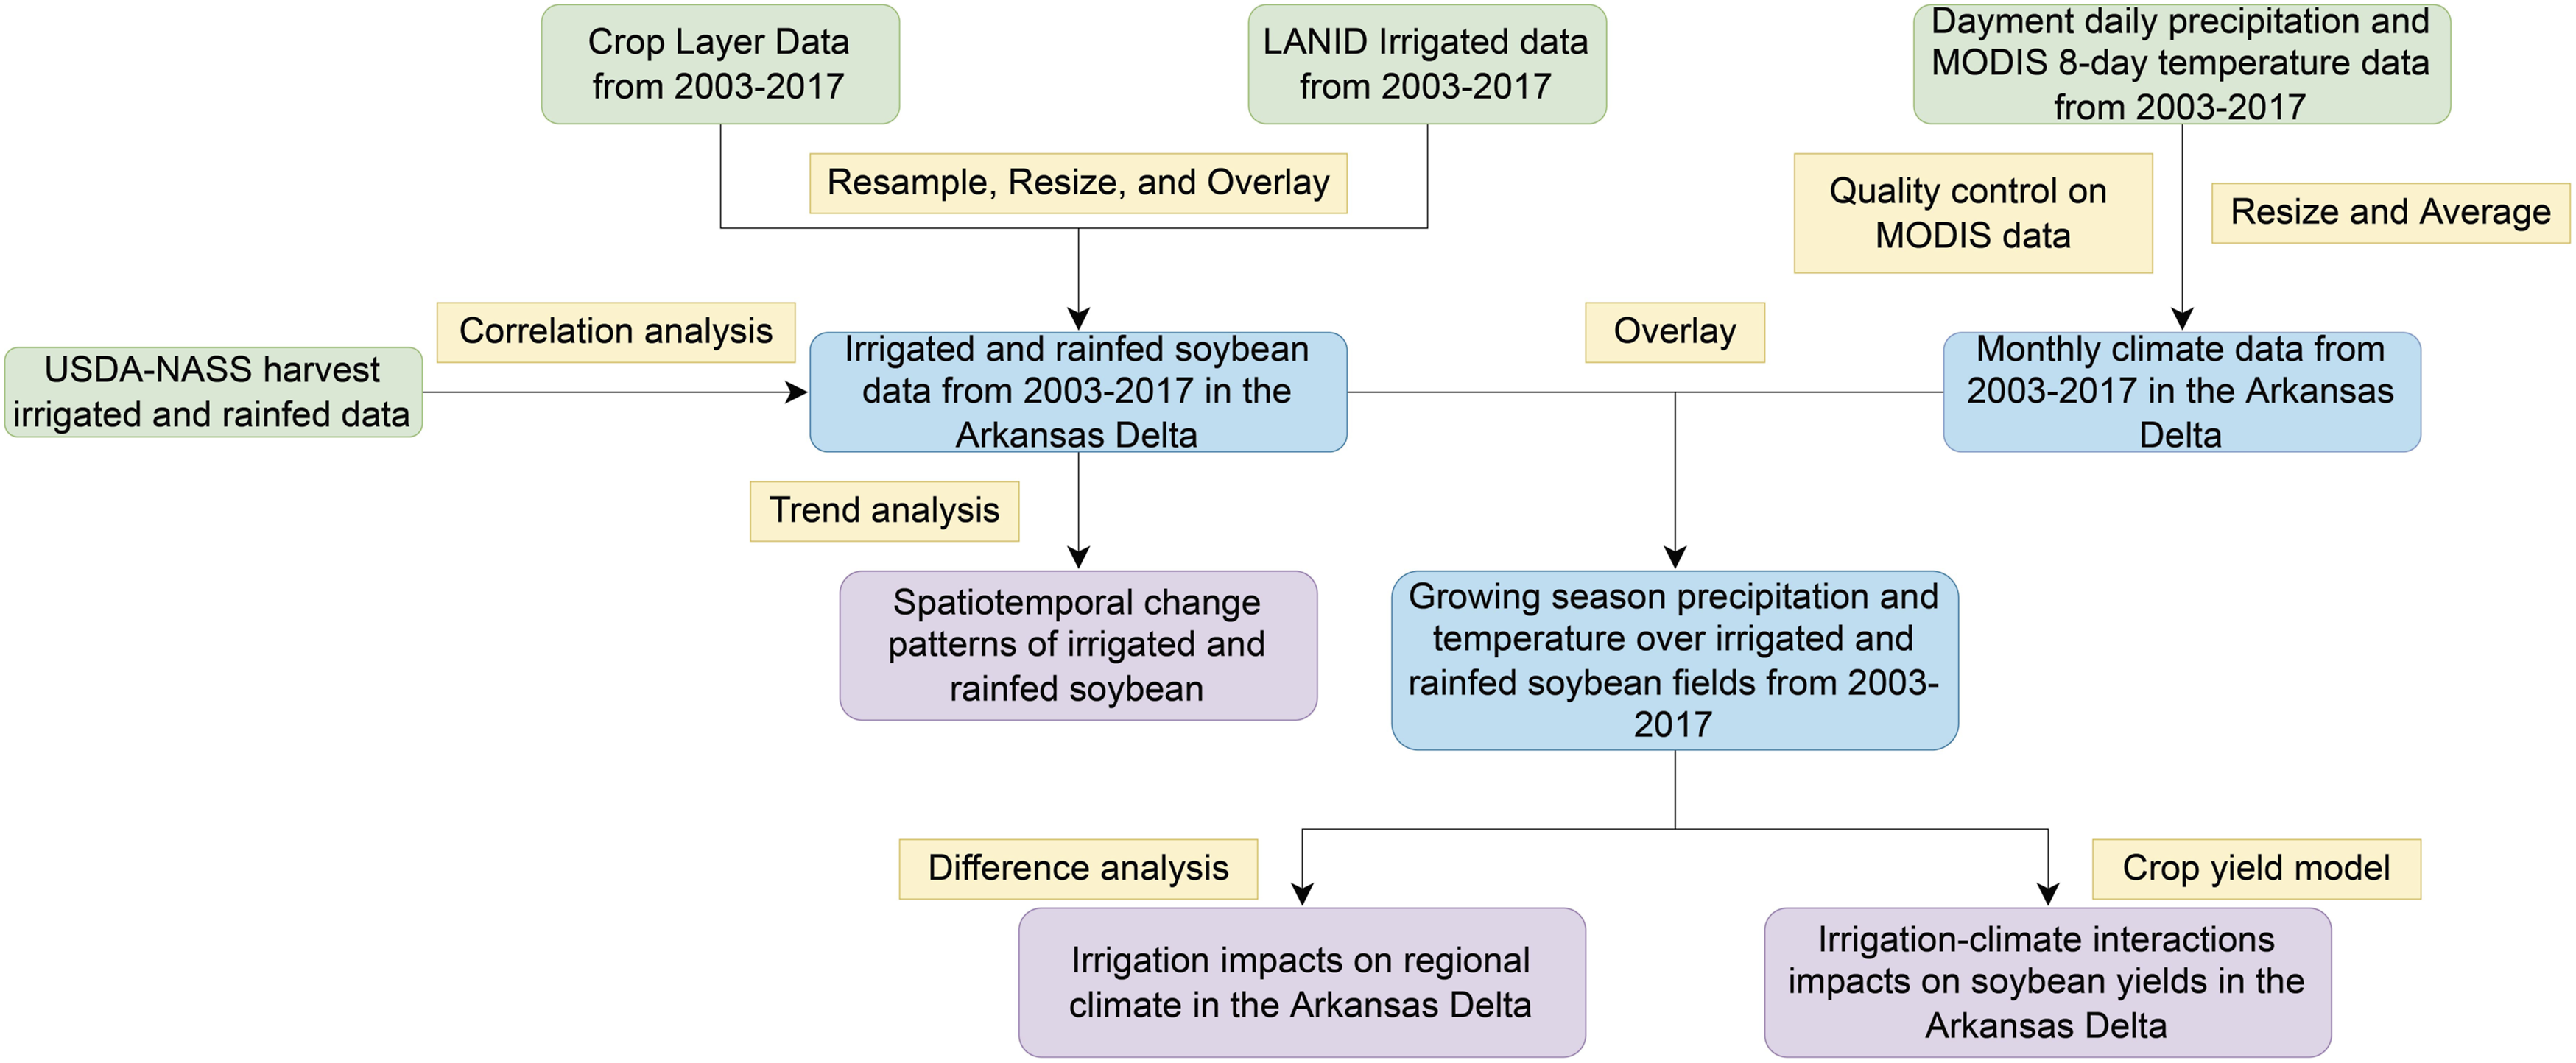
Extracting climatic variables over irrigated and rainfed soybean lands
To extract precipitation and temperature over irrigated and rainfed soybean lands in the Arkansas Delta, we firstly resampled CDL and LANID maps to 1 km from 2003 to 2017, a spatial scale that is consistent with that of MODIS and Daymet data, using a majority-aggregation method (He et al., 2018). We then used the Arkansas Delta boundary to resize CDL, LANID, MODIS, and Daymet data to obtain the data that only covers the Arkansas Delta region. After that, we extracted soybean areas using CDL and overlaid it with LANID data in the same year to identify Delta irrigated and rainfed soybean areas for each year from 2003 to 2017. We averaged the daily Daymet precipitation and 8-days MODIS temperature data in each month to obtain monthly average precipitation, and monthly average daily maximum and minimum temperature for the growing season from June to August during the investigated period. These climatic variables were subsequently overlaid with irrigated and rainfed soybean areas to acquire monthly average precipitation and temperature for irrigated and rainfed soybean lands, respectively.
As crop yield data from USDA-NASS are available only at the county level, precipitation and temperature for all irrigated and rainfed soybean pixels were averaged within a county to get county average values for irrigated and rainfed soybean, separately. In doing so, we obtained growing season monthly average precipitation and monthly average daily maximum and minimum temperature of irrigated and rainfed soybean for each county in the Arkansas Delta from 2003 to 2017.
Statistical analysis
Correlation analysis
To assess data accuracy, the irrigated and rainfed soybean areas from remote sensing products were aggregated to the county level to compare with the irrigated and rainfed soybean harvested areas from USDA-NASS from 2003 to 2017 using Pearson correlation coefficient (He et al., 2018). The significance of the correlation coefficient was tested by a Student’s t test. To confirm the results, we also computed the non-parametric Spearman’s rank and Kendall’s Tau correlation coefficients. This process was conducted using R 4.4.1 function cor.test.
Trend analysis
We conducted linear regression trend analysis (
Mean difference analysis
To reveal the impacts of irrigation on precipitation and temperature for each county in the Arkansas Delta, we applied mean difference analysis (Yang et al., 2021). We subtracted climatology mean monthly average precipitation, and monthly average daily maximum or minimum temperature values of rainfed soybean, averaged from 2003 to 2017 from that of irrigated soybean. The positive, negative, or zero values of the differences indicate that irrigation has positive, negative, or no effects on local precipitation or temperature for each county in the Arkansas Delta. A two-sample t test (R 4.1.1 function t.test) was used to test the significance of the difference for each individual county.
Crop yield model
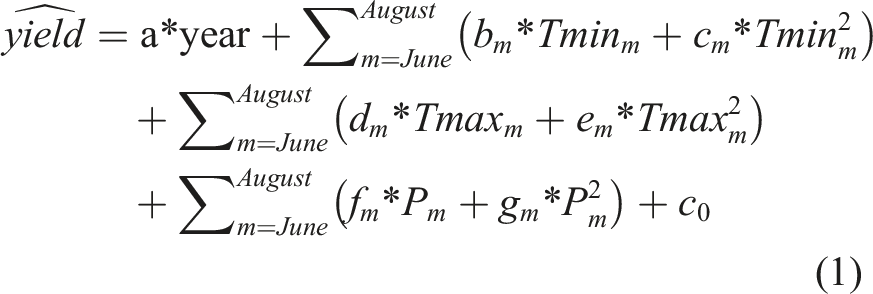
We used a statistical quadratic model to predict soybean yields, following (Li et al., 2020) (Equation (1)). The soybean yield of all counties in the Arkansas Delta is used as the dependent variable, and the county-level monthly average precipitation, monthly average daily maximum and minimum temperature are used as independent variables
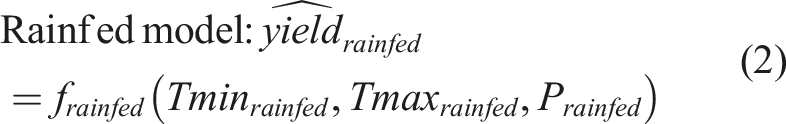
We built quadratic model for rainfed soybean (Equation (2)) (Li et al., 2020) to identify the irrigation-climate effects on crop yields
The irrigation-climate interactions on yields
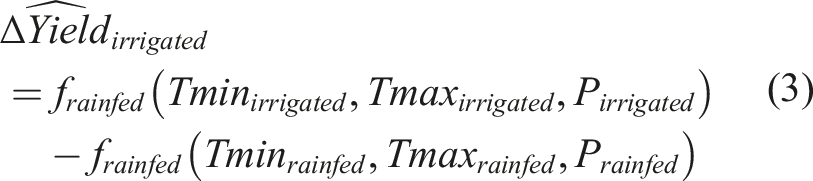
To further estimate the soybean yield change due to other effects (i.e., increasing water supply from irrigation), we also built quadratic model for irrigated soybean (Equation (4))
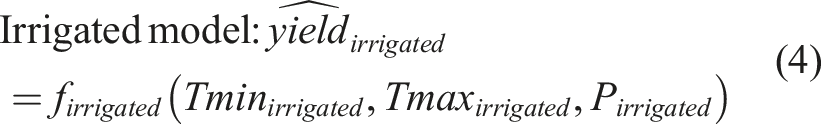
The water supply effect is embedded in the irrigated model
The
Results and discussion
Spatiotemporal change patterns of soybean areas in the Arkansas Delta
The correlation coefficient value of irrigated soybean areas derived from CDL and LANID with that from USGS-NASS survey irrigated areas is 0.879, which is higher than that of rainfed soybean areas (r = 0.624) (Figure 3). The relatively poor agreement of rainfed areas may be because of the inaccurate classification of rainfed croplands during some high precipitation years (Xie and Lark, 2021). Nevertheless, both values are statistically significant at 1% level, indicating the reliability of remote sensing-derived irrigated and rainfed soybean data. This is largely consistent with the significant (p-value <0.1) non-parametric Spearman’s rank and Kendall’s Tau (shown in parentheses) correlation coefficients of 0.837 (0.656) and 0.666 (0.470) for irrigated and rainfed soybean lands, respectively. The correlation relationships of (a) irrigated and (b) rainfed soybean areas in each county in the Arkansas Delta derived from remotely sensed data and USDA-NASS survey data.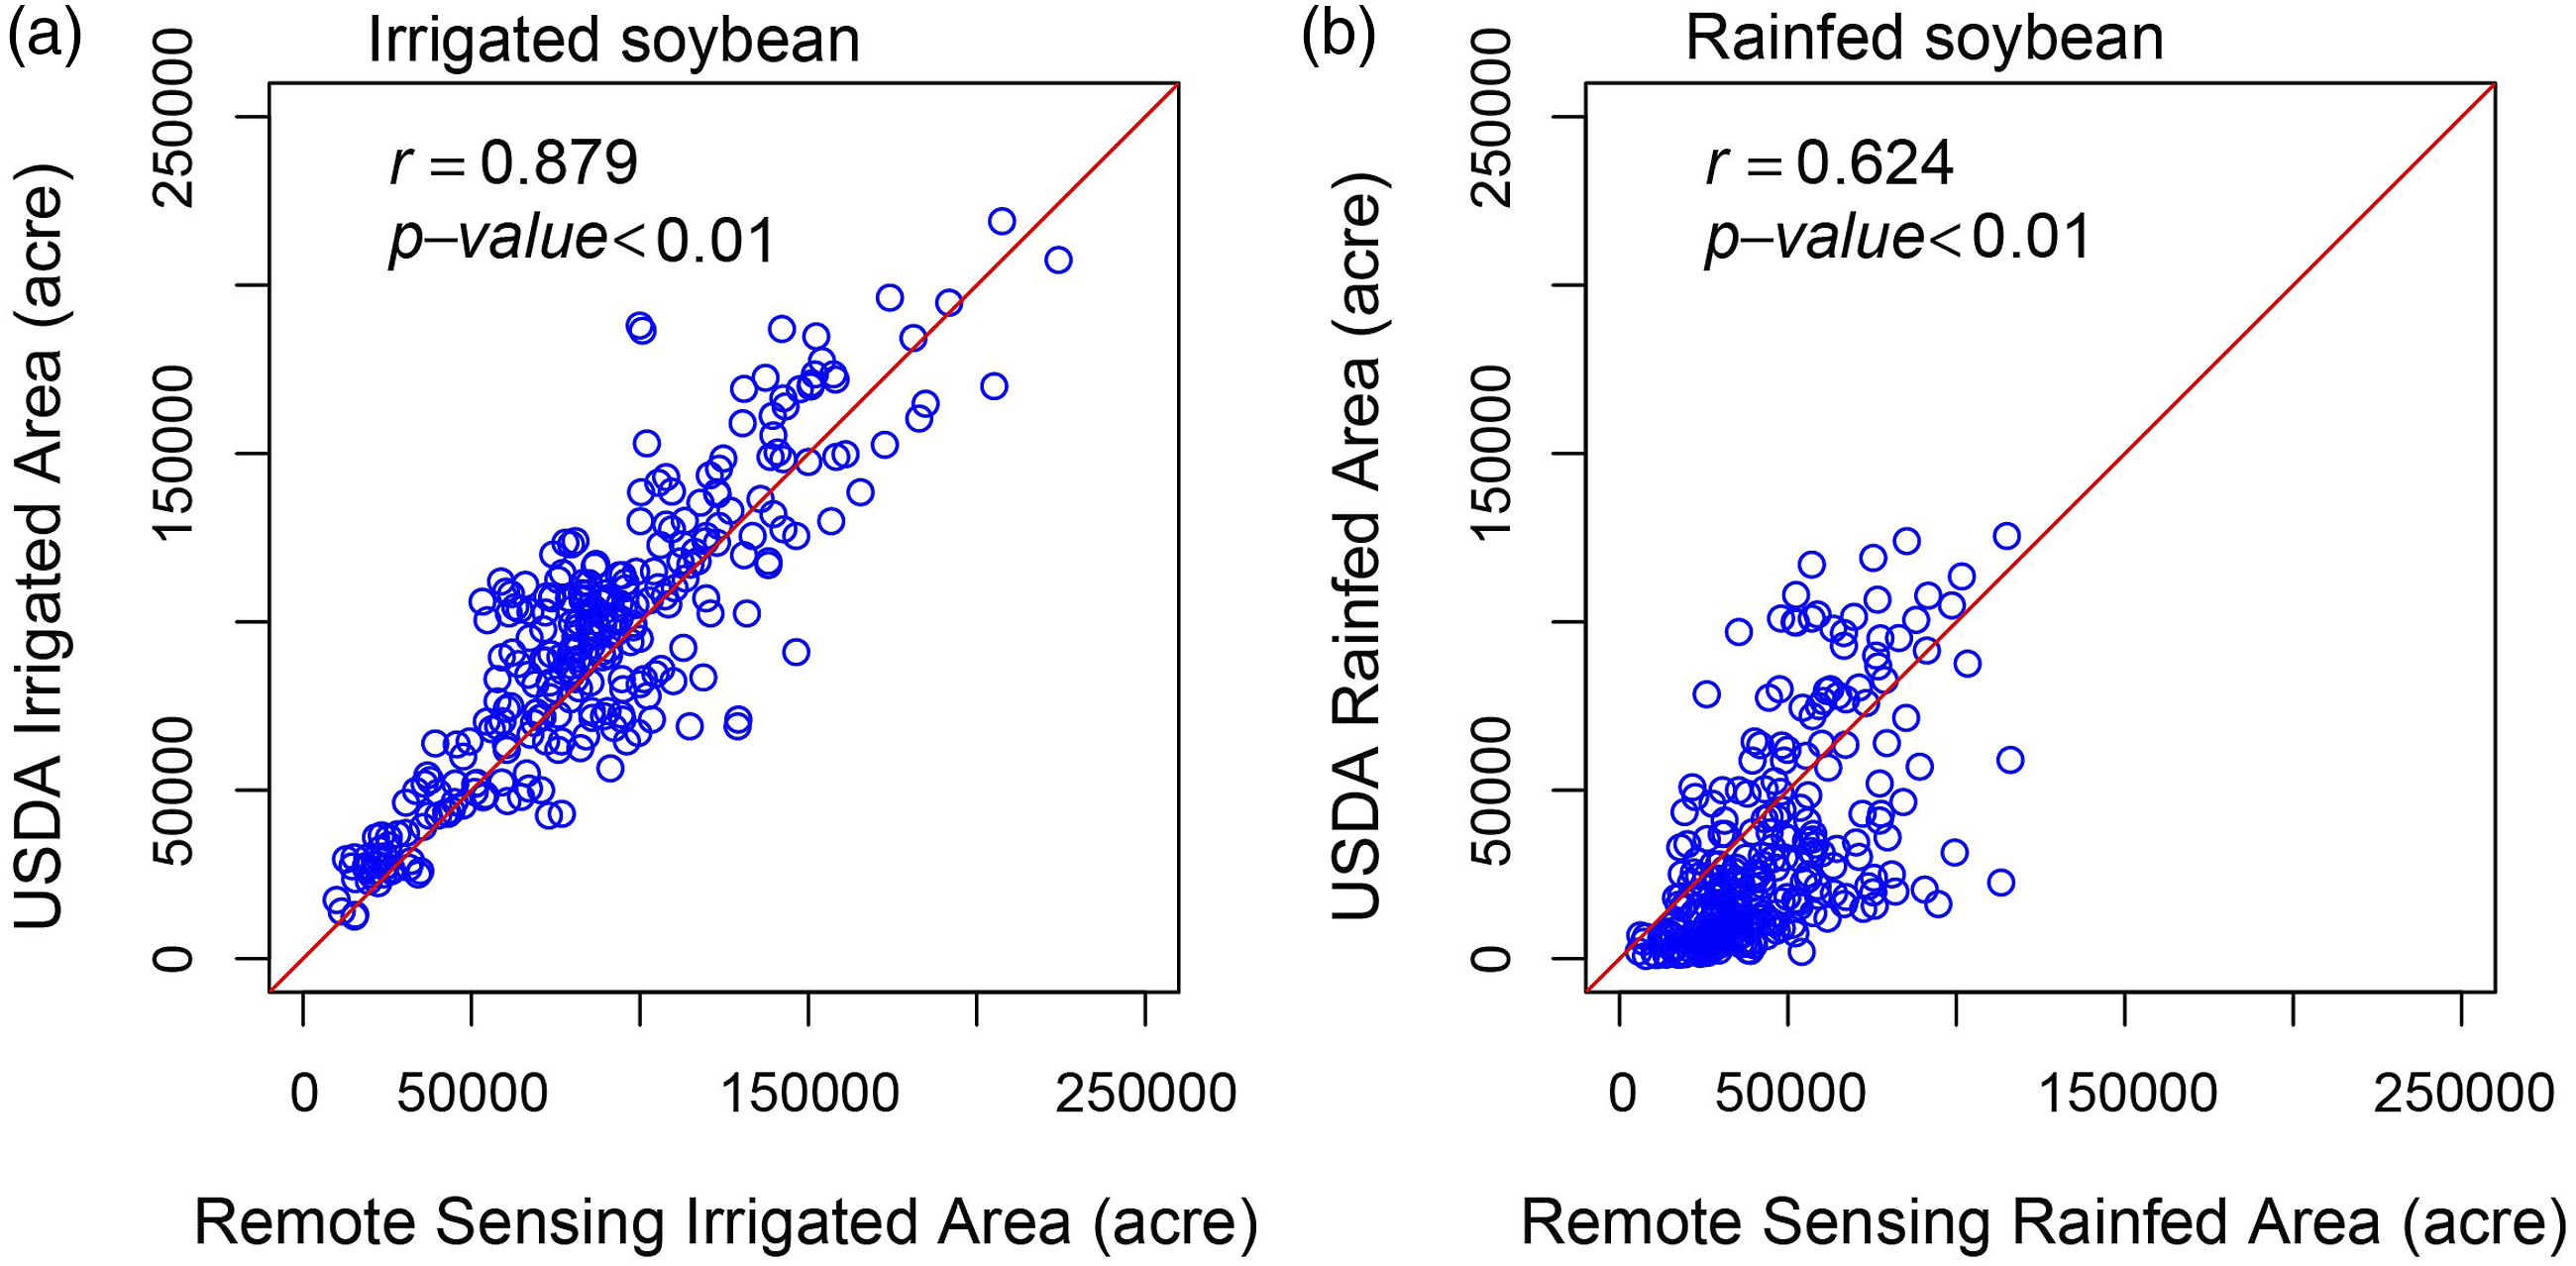
Figures 4 (a) and (b) present the averaged irrigated and rainfed soybean areas from 2003 to 2017 in the Arkansas Delta. The areas of irrigated soybean lands have much larger areas compared to that of rainfed soybean (Figures 4 (a) and (b)). Irrigated soybean lands are dominant in the eastern part of the Delta, such as Mississippi, Poinsett, Cross, Crittenden, Phillips, Arkansas, and Desha counties, with the areas ranging from ∼90,000 acres to ∼150,000 acres. The rainfed soybean areas in most of the counties range from ∼30,000 acres to ∼60,000 acres, with some counties having low areas, such as the Drew County. Mean (a) irrigated and (b) rainfed soybean areas for each county in the Arkansas Delta averaged over the period from 2003 to 2017, and temporal trends in (c) irrigated and (d) rainfed soybean areas estimated from 2003 to 2017. The un-stippled areas in (c) and (d) indicate significant trends at the 10% level.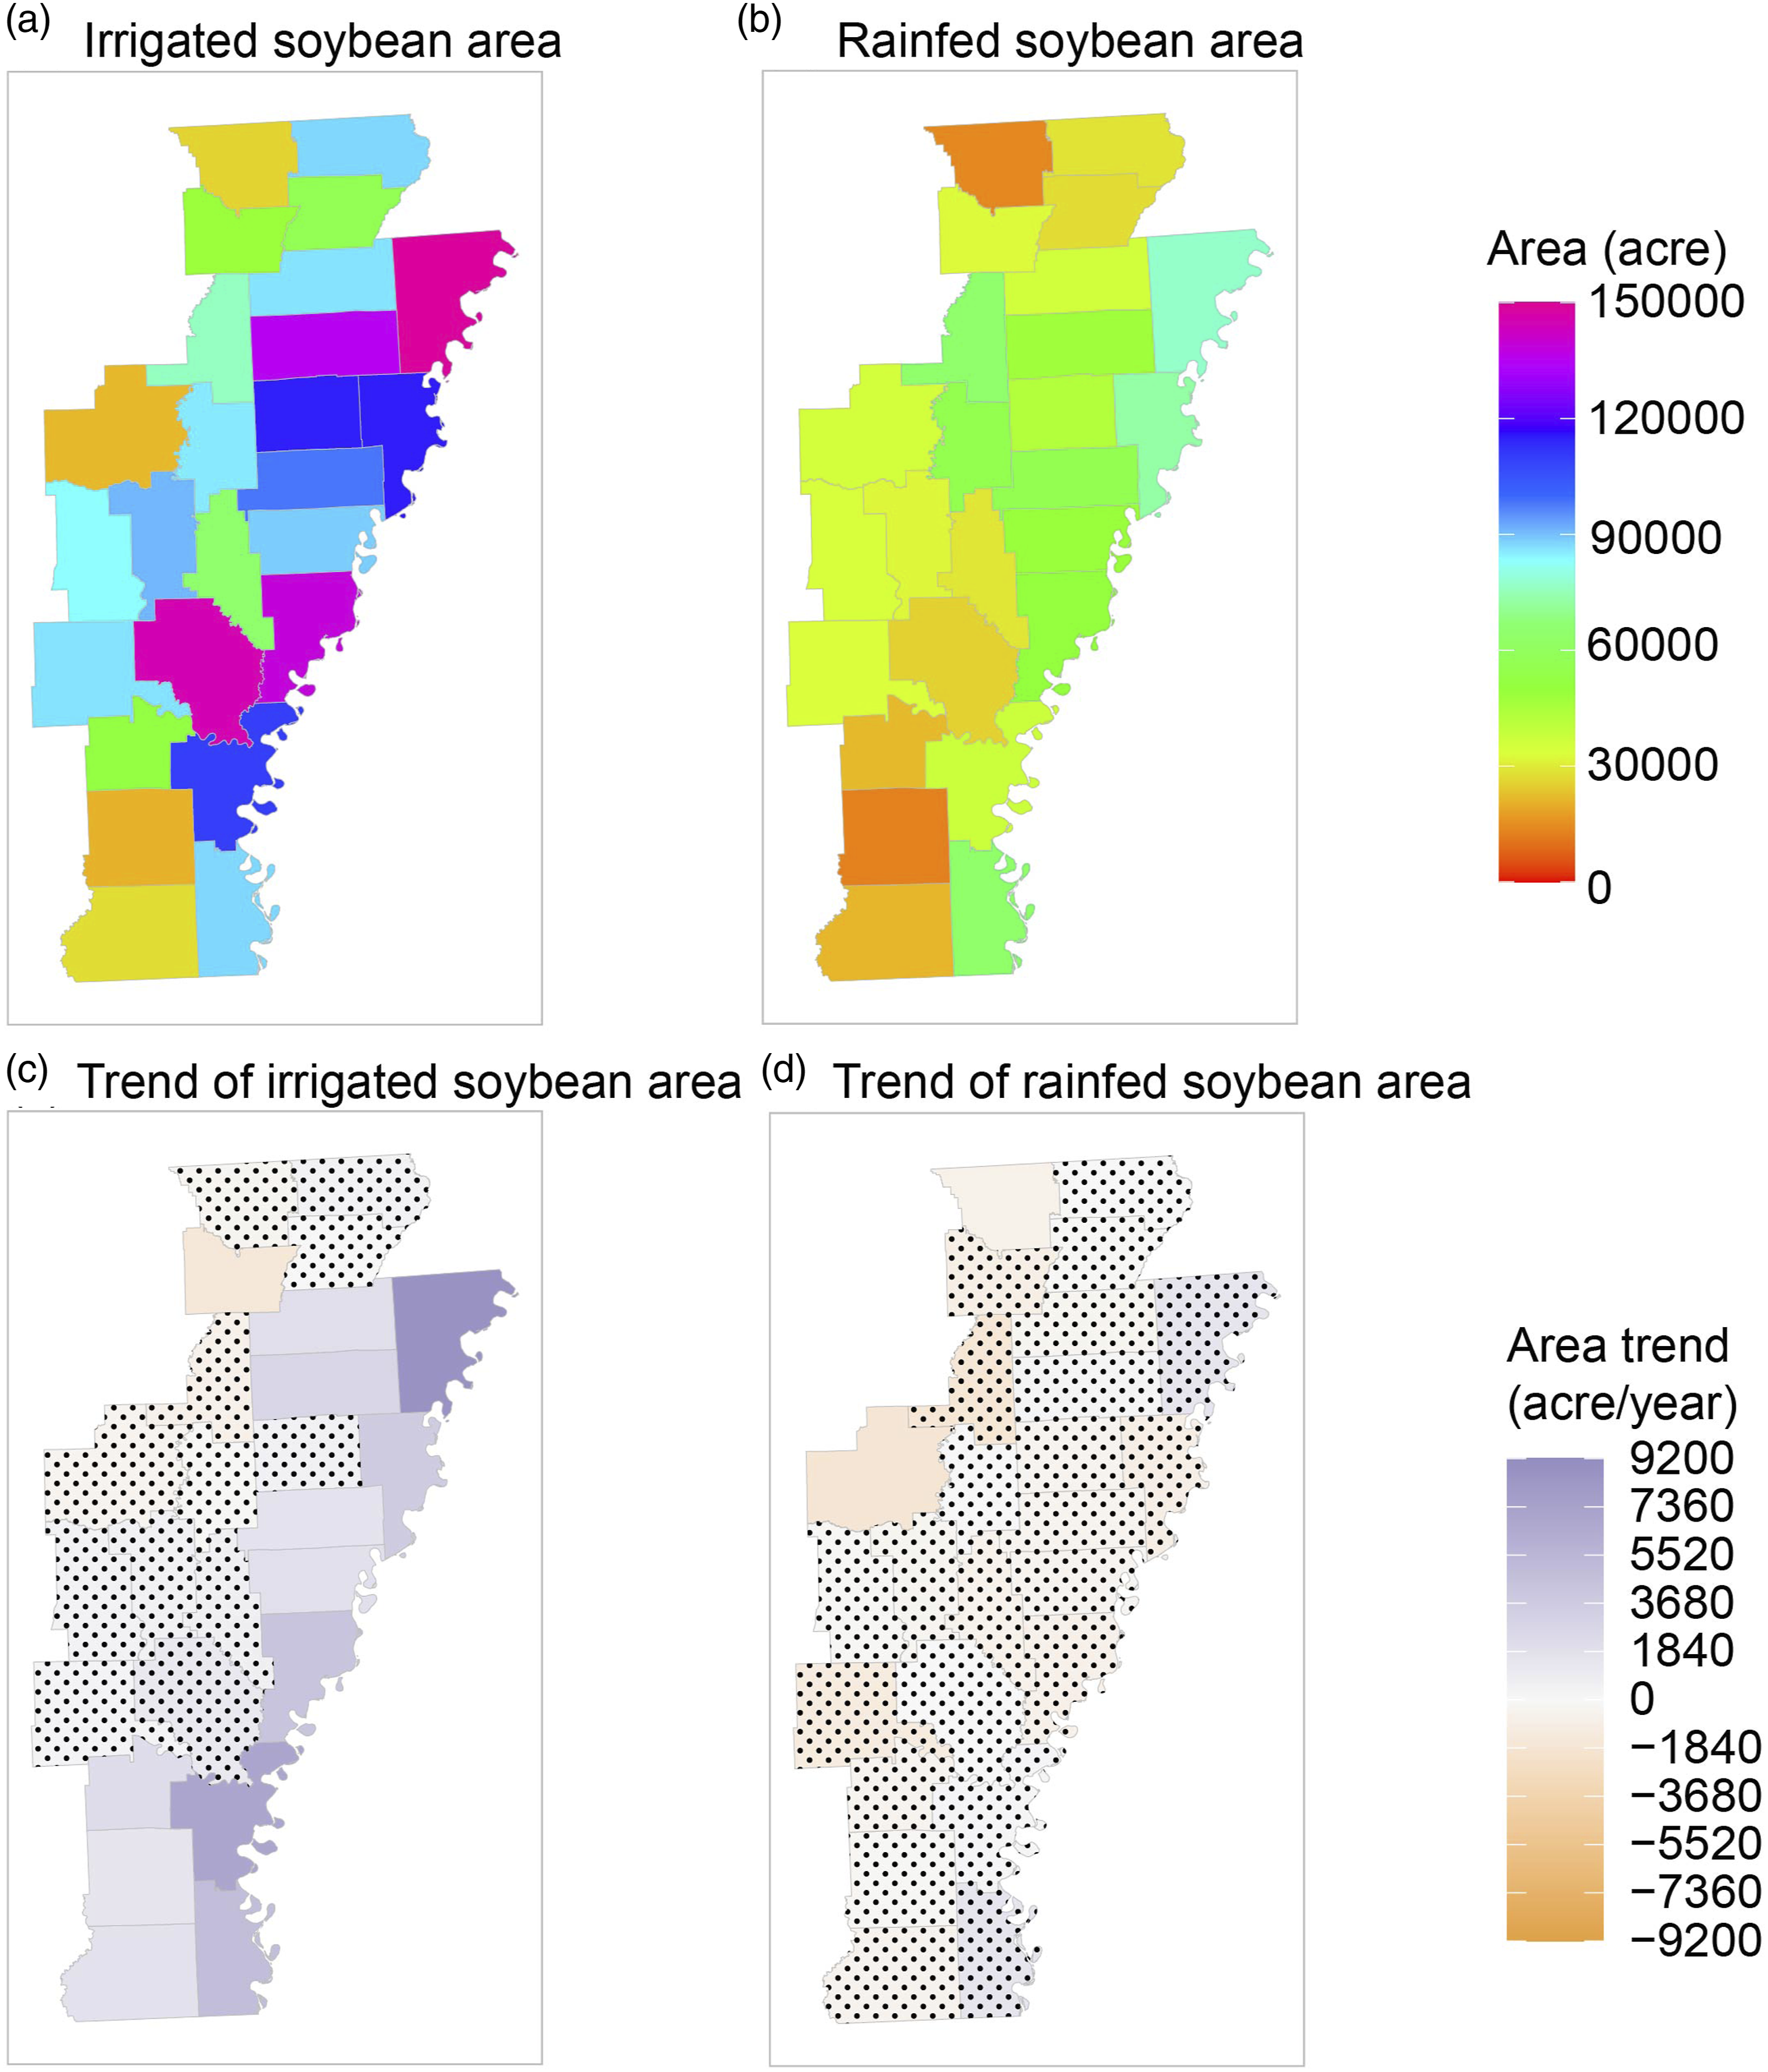
Linear regression trend analysis reveals that irrigated soybean areas significantly increased in the eastern part of the Arkansas Delta from 2003 to 2017, with an increase rate ranging from 1840 acre/year to 9200 acre/year (Figure 4(c)). Among these counties, Mississippi and Desha counties have the largest increase. The irrigated areas in Lawrence County in the northern Arkansas Delta have significantly decreased. The rainfed soybean areas show insignificant changes in most of the counties in the Delta, while Randolph and White counties have significantly decreased areas (Figure 4(d)). The non-parametric trend analysis confirms the change pattern of soybean lands in the Arkansas Delta (Figure S1).
Impacts of soybean irrigation on precipitation and temperature
Figures 5(a)–(c) show the climatology mean difference of monthly average precipitation over irrigated soybean lands with that over rainfed lands, averaged from 2003 to 2017 for each month during the growing season of soybean. Irrigation has negative effects on precipitation over most counties, which is consistent with the fact that irrigated lands are generally drier than rainfed areas. Yet, these negative effects are statistically insignificant, indicating soybean irrigation has negligible impacts on precipitation variability in the Arkansas Delta. These limited impacts of irrigation on precipitation have been identified by several previous studies. For example, Puma and Cook (2010) used the Goddard Institute for Space Studies (GISS) ModelE to estimate irrigation effects on climate during the 20th century and showed insignificant changes in precipitation during summer over several regions across the globe, including the State of Arkansas. By using an Advanced Research Weather Research and Forecasting (WRF) model, Yang et al. (2016) demonstrated that irrigation over the Huang-Huai-Hai Plain in China also had negligible effects on precipitation during summertime in this region, although its impacts over northern and southern parts were statistically significant. In a recent study, Qian et al. (2020) found negative but insignificant precipitation changes due to irrigation during summer in most parts of eastern Arkansas, which was attributable to the compound effects of increased Convective Available Potential Energy (CAPE) because of increased irrigation moisture and enhanced convective inhibition (CIN) due to irrigation-induced evaporative cooling. Irrigation impacts on monthly average (a–c) precipitation, (d–f) daily maximum temperature, and (g–i) daily minimum temperature in each county of the Arkansas Delta during the growing season of June to August. The unhatched regions indicate significant differences at the 10% level.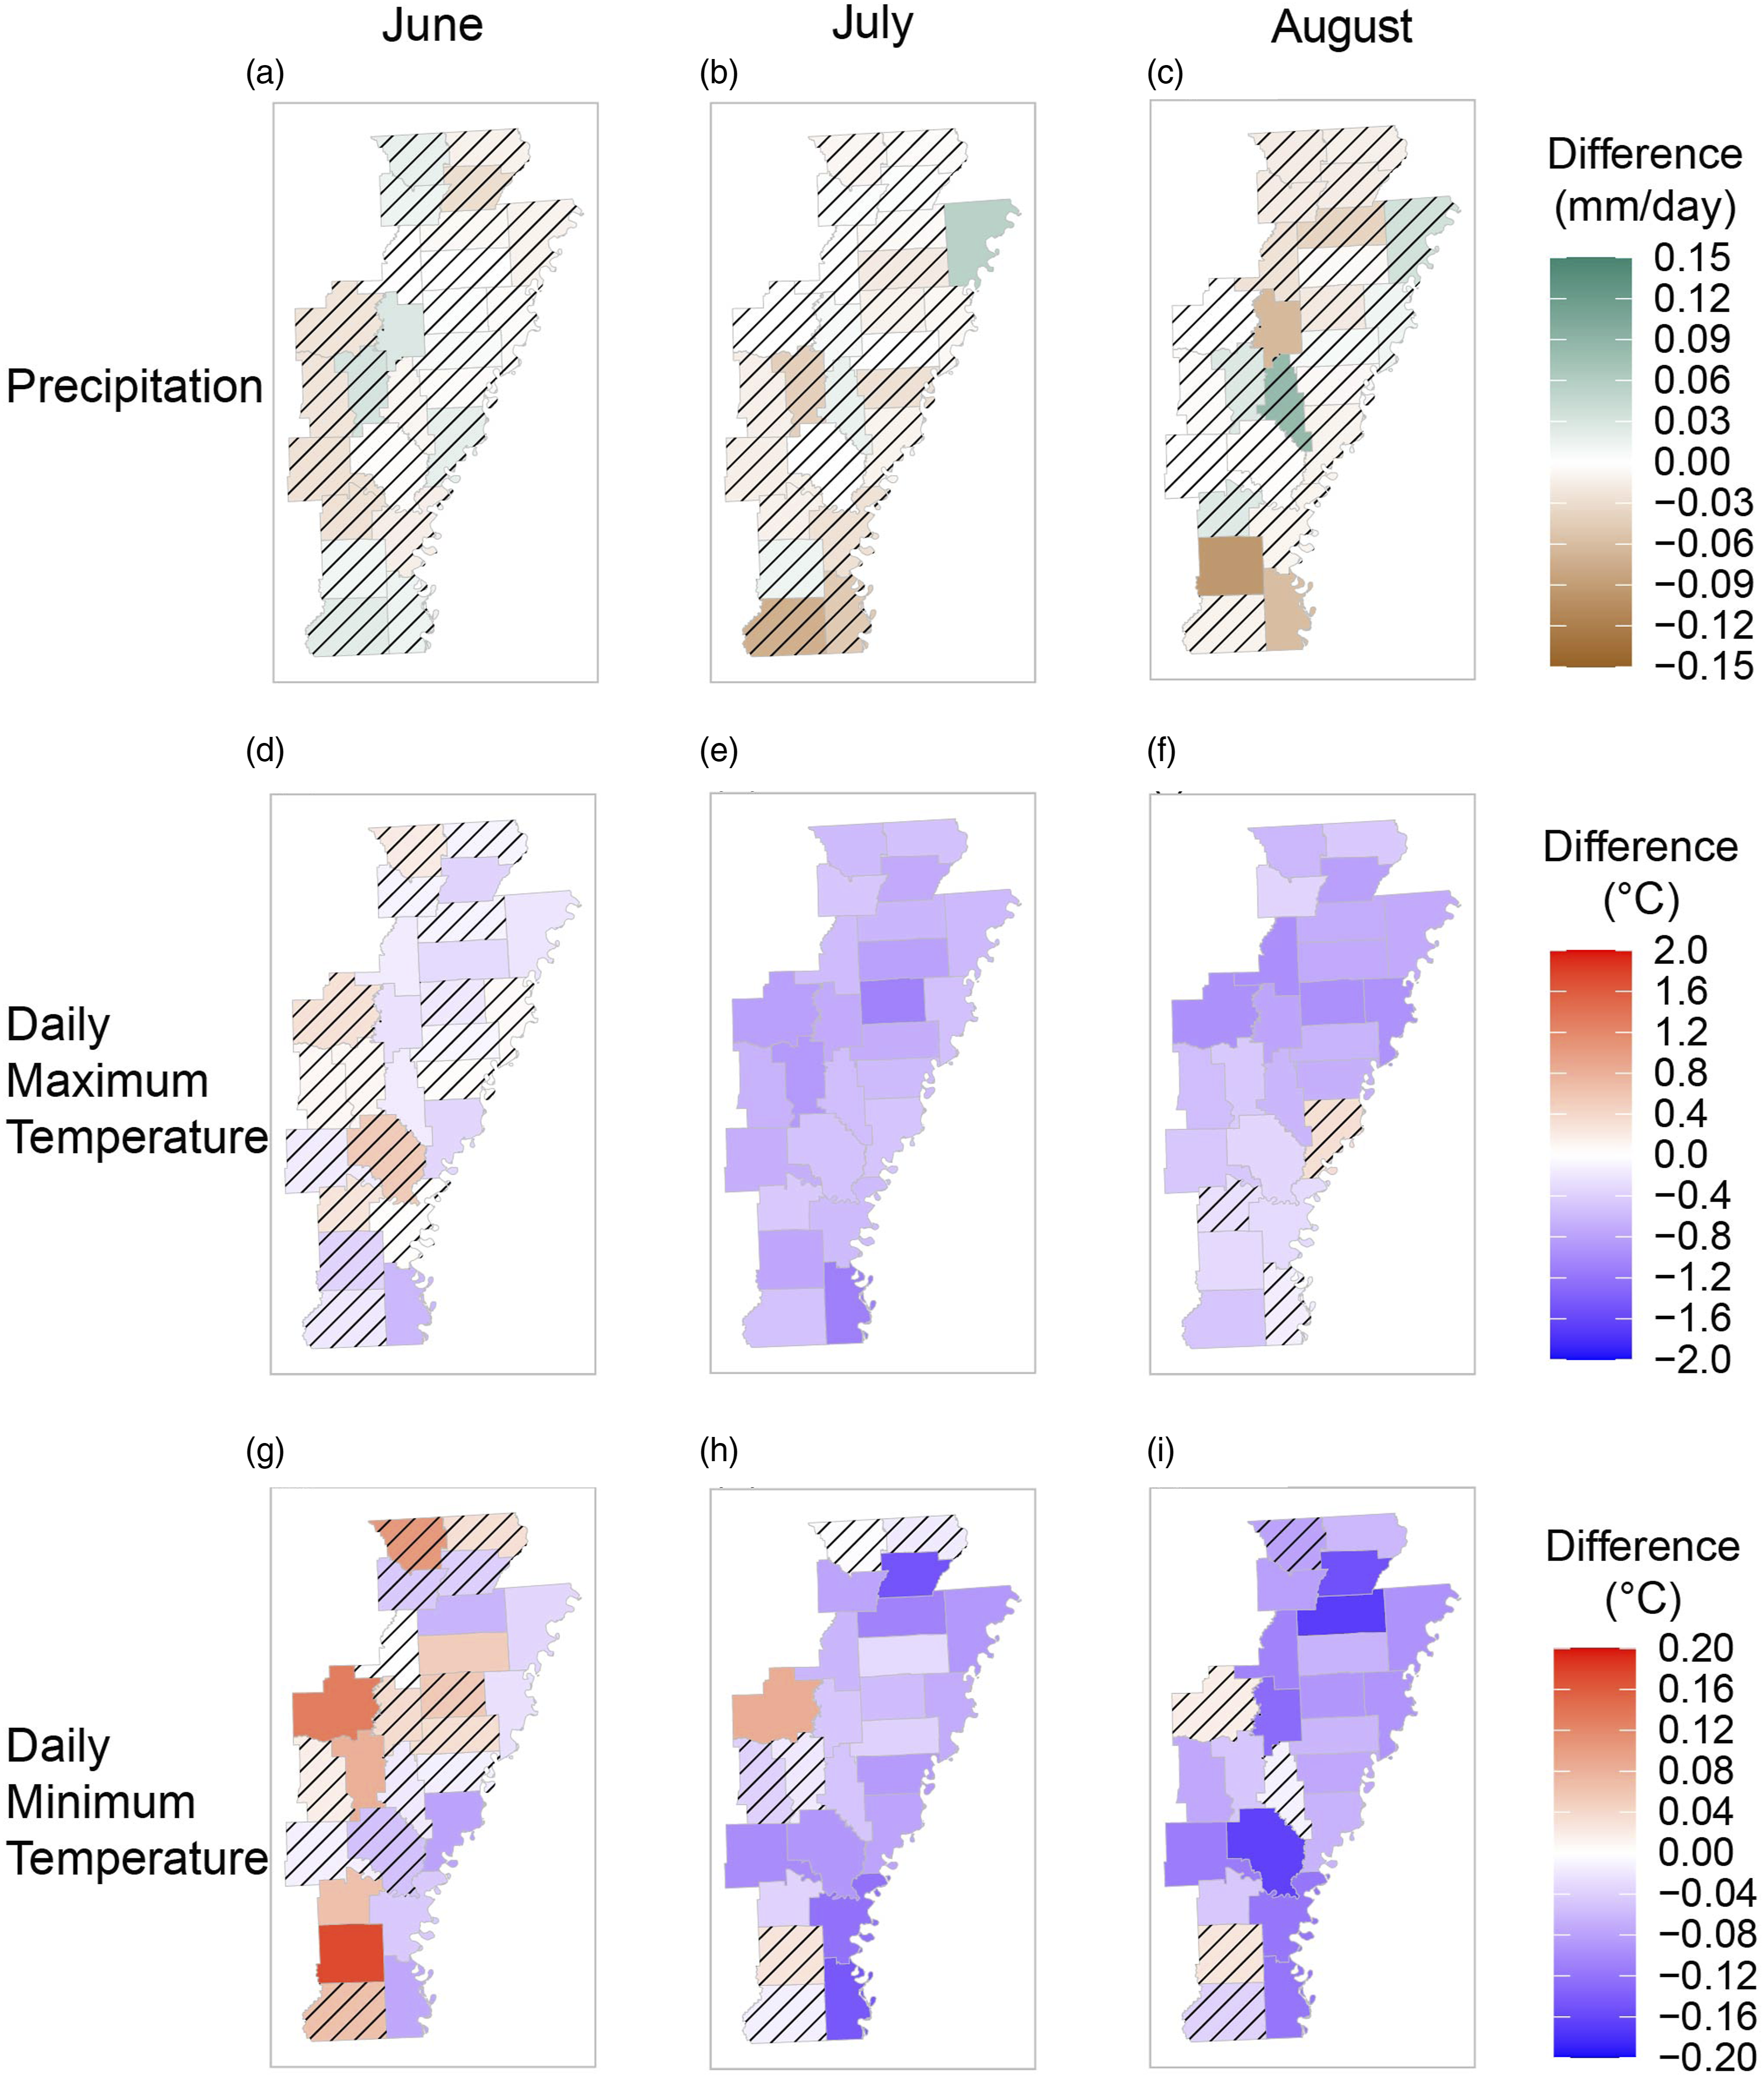
For most counties in the Arkansas Delta, irrigation shows significantly negative impacts on monthly average daytime (i.e., daily maximum) temperature (Figure 5(d)–(f)). These cooling effects were also revealed by Barnston and Schickedanz (1984), who reported irrigation appeared to lower the daily surface maximum temperature by ∼ 1°C–2°C during the warm season in the Southern Great Plains. Similarly, a recent study of Yang et al. (2020) found irrigation averagely decreased daytime land surface temperature by 1.15 K across irrigated lands in China. This temperature decrease may be attributable to a shift away from sensible and toward latent heat fluxes in the irrigated areas (Mahmood et al., 2004; Kueppers et al., 2007; He et al., 2020). Few counties also witness insignificant effects of irrigation on monthly average daytime temperature in the Arkansas Delta. These negligible impacts were consistent with the findings of Chen and Dirmeyer (2019), who used MODIS temperature data and stated that cooling effects of irrigation during summer were less evident in the areas of the Lower Mississippi River Basin, US.
As the impacts of irrigation on daytime temperature, irrigation also has significantly negative effects on monthly average nighttime (i.e., daily minimum) temperature in most of counties in the Arkansas Delta, although their magnitudes are much smaller than that of daytime temperature (Figure 5(g)–(i)). Such phenomena are also demonstrated in Yang et al. (2020) that in the night time, cooling was still the dominant effect in the majority of the irrigated areas, relative to non-irrigated areas, but with a much weaker magnitude. Yang et al. (2020) further claimed that the enhanced heat loss through higher evapotranspiration (ET) in the irrigated regions exceeded the extra energy gain induced by the lower albedo, leading to cooling effects of irrigation. Meanwhile, there are some counties showing significant nighttime warming effects of irrigation, especially during June (Figure 5(g) and (h)). Interestingly, the counties with significant warming effects mainly have relatively small areas of irrigated soybean (Figure 4(a) and Figure 5(g)). This largely supports Coffel et al. (2022)’s hypothesis that crops-induced cooling may fade in years with poor yields or a smaller harvested area. Nevertheless, these warming effects were also observed in the California Central Valley by a study using the Scripps Experimental Climate Prediction Center (ECPC) Regional Spectral Model (RSM) (Kanamaru and Kanamitsu, 2008). A similar finding was identified by an observational study that presented a dramatic warming in the daily minimum temperature in the irrigated California Central Valley compared to that in the non-irrigated adjacent highlands of Sierra (Christy et al., 2006). These warming effects are possible due to (1) the enhanced greenhouse warming because of increased water vapor concentrations in the atmosphere from soil evaporation and crop evapotranspiration into the boundary layer; (2) enhanced night time downward infrared flux due to swelling of aerosols as humidity increases toward morning; and (3) enhanced night time sensible heat flux from the surface due to the increased heat capacity of moist soil (Christy et al., 2006; Chen and Jeong, 2018).
Impacts of irrigation-climate interactions on soybean yield
We used equation (1) to build the crop yield models for rainfed and irrigated soybean, respectively. Due to the limited effects of irrigation impacts on monthly average precipitation as identified in the section 3.2, the average precipitation from irrigated and rainfed areas was used for both rainfed and irrigated crop yield models. The F statistics for the two models are 12.3 and 12.68, respectively. Both models have significant quadratic relationships with corresponding p values less than 0.01. The residuals of both models distribute evenly around the zero line, meaning that the average of the residuals is approximately zero (Figure 6(a) and (d)). The histograms of the residuals for both models suggest that the residuals are nearly normal with a zero mean (Figure 6(b) and (e)). The quantiles of the residuals show good fit with the quantiles of standard normal in the Q-Q plot (Figure 6(c) and (f)). All these statistical inspections support the normality of the residuals for both models. Normality test of the residuals for (a–c) rainfed and (d–f) irrigated crop yield models.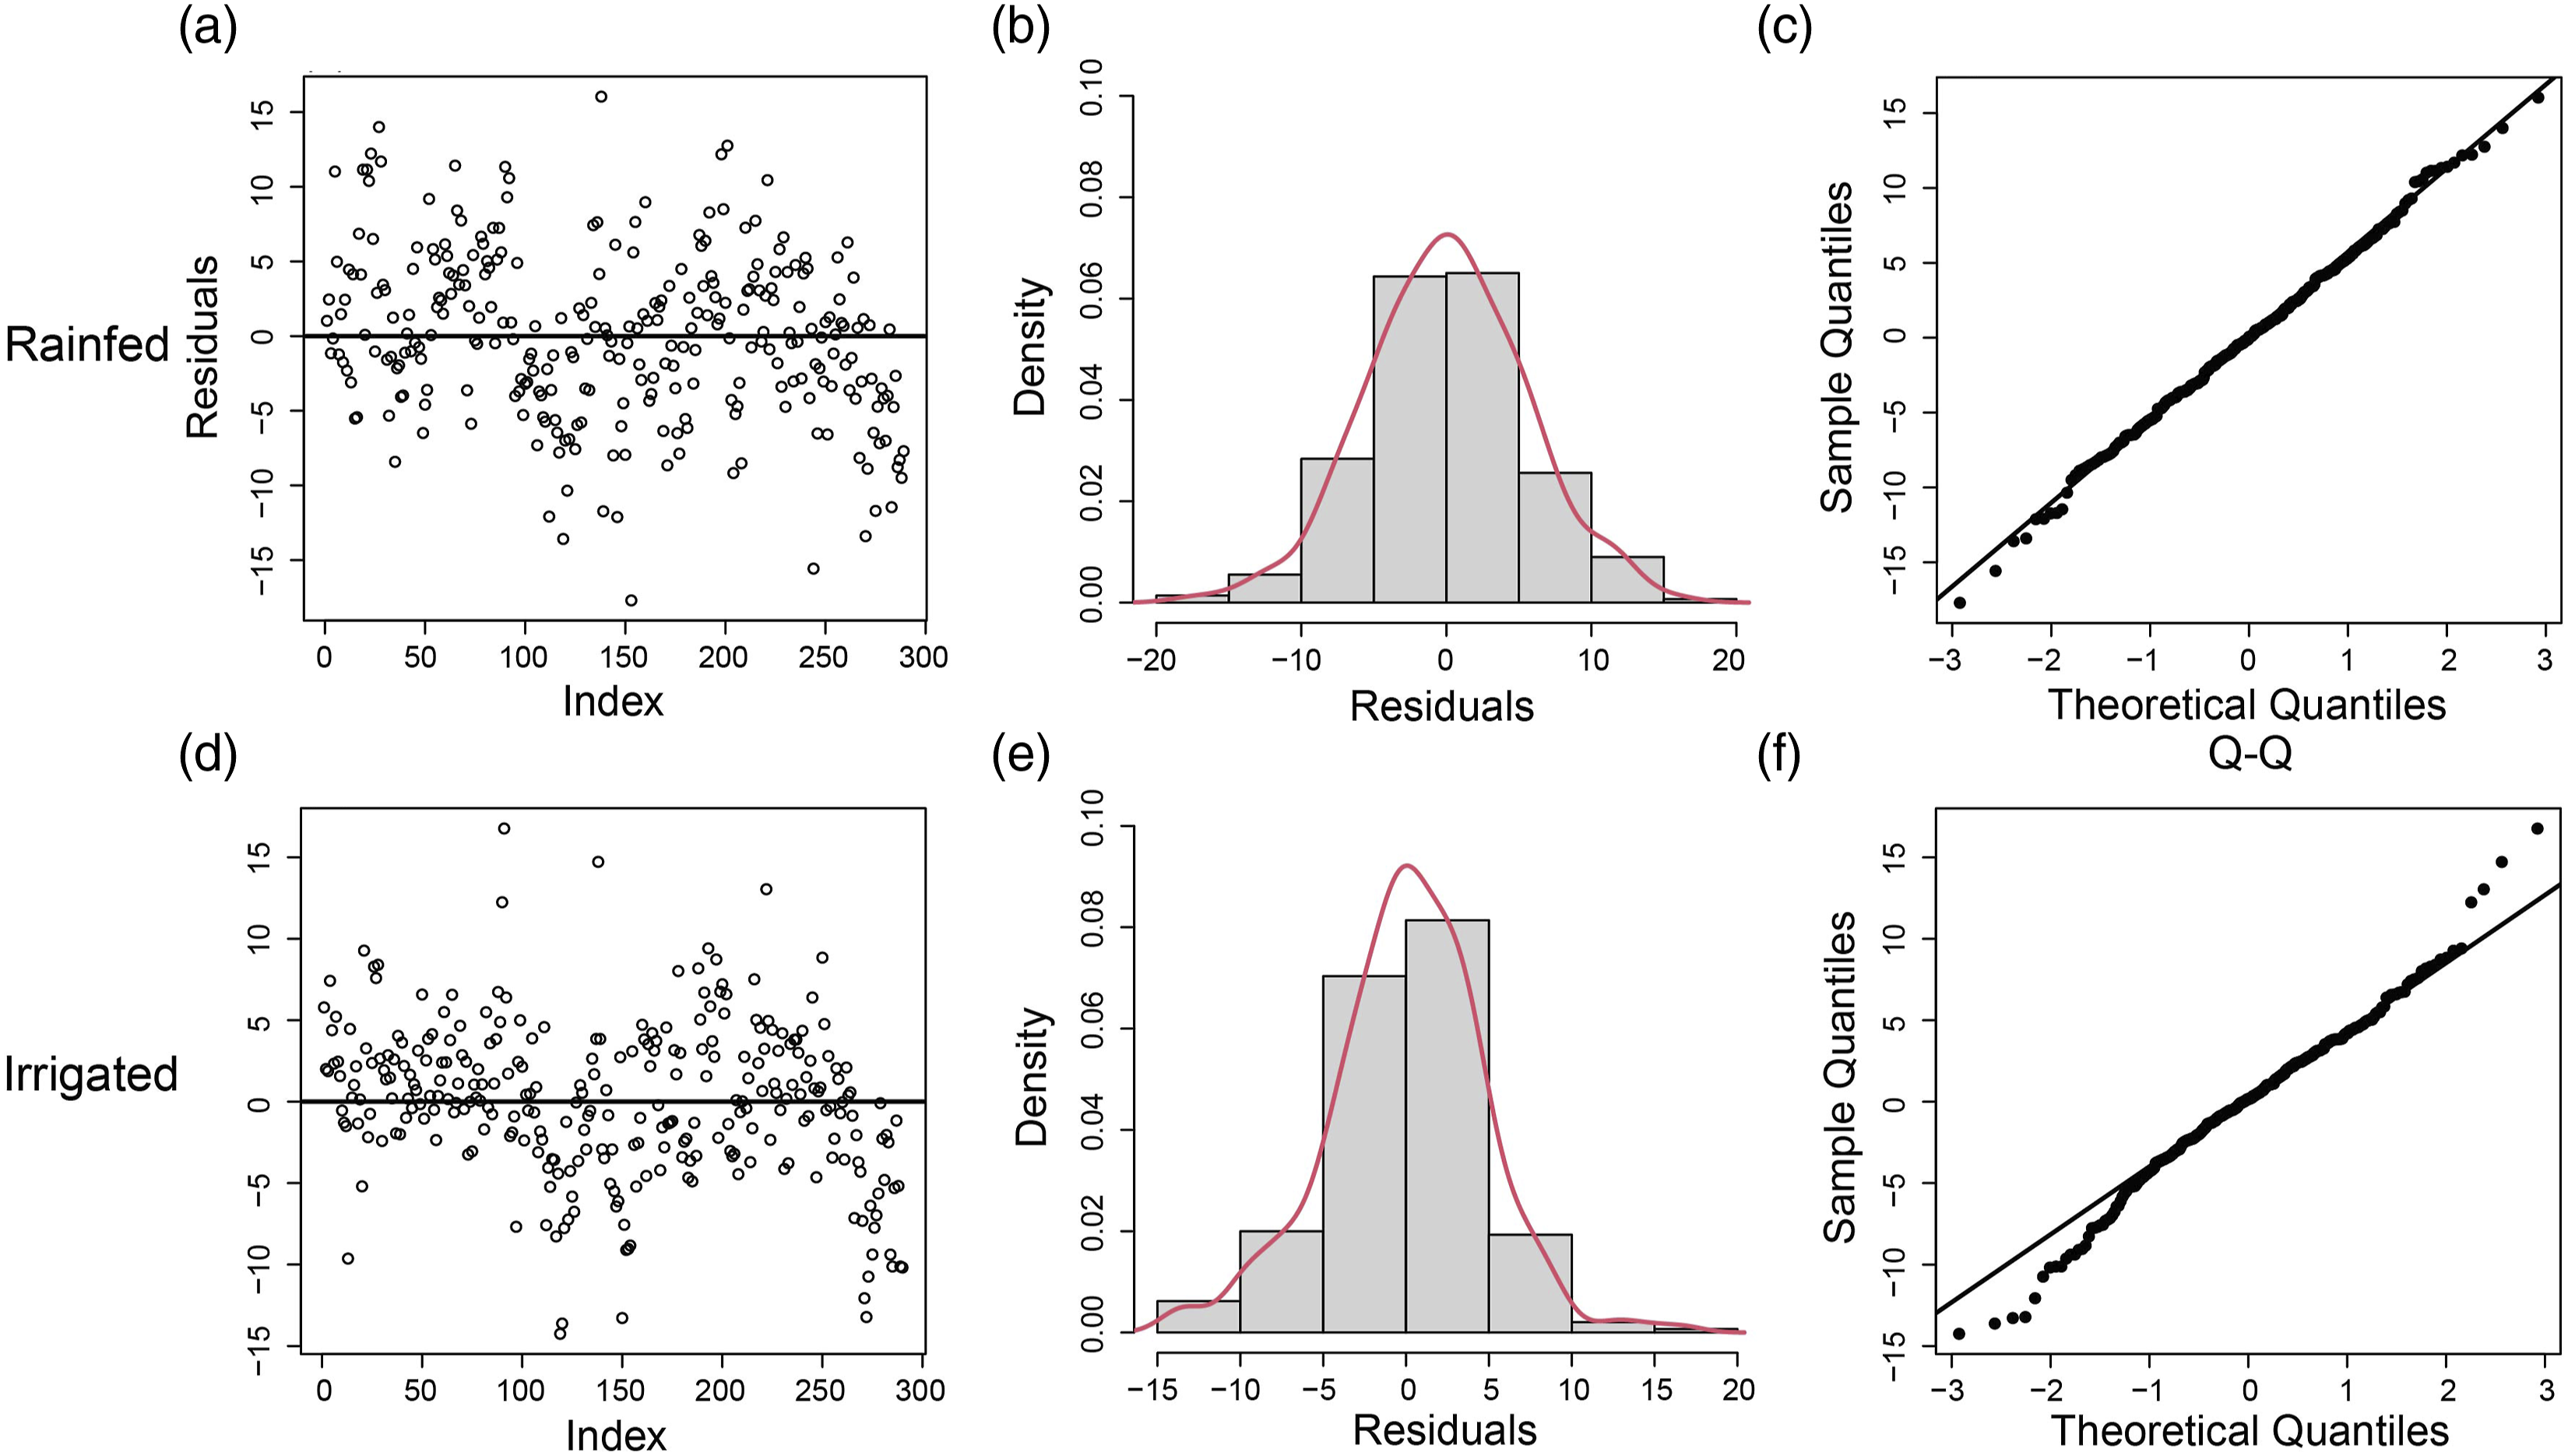
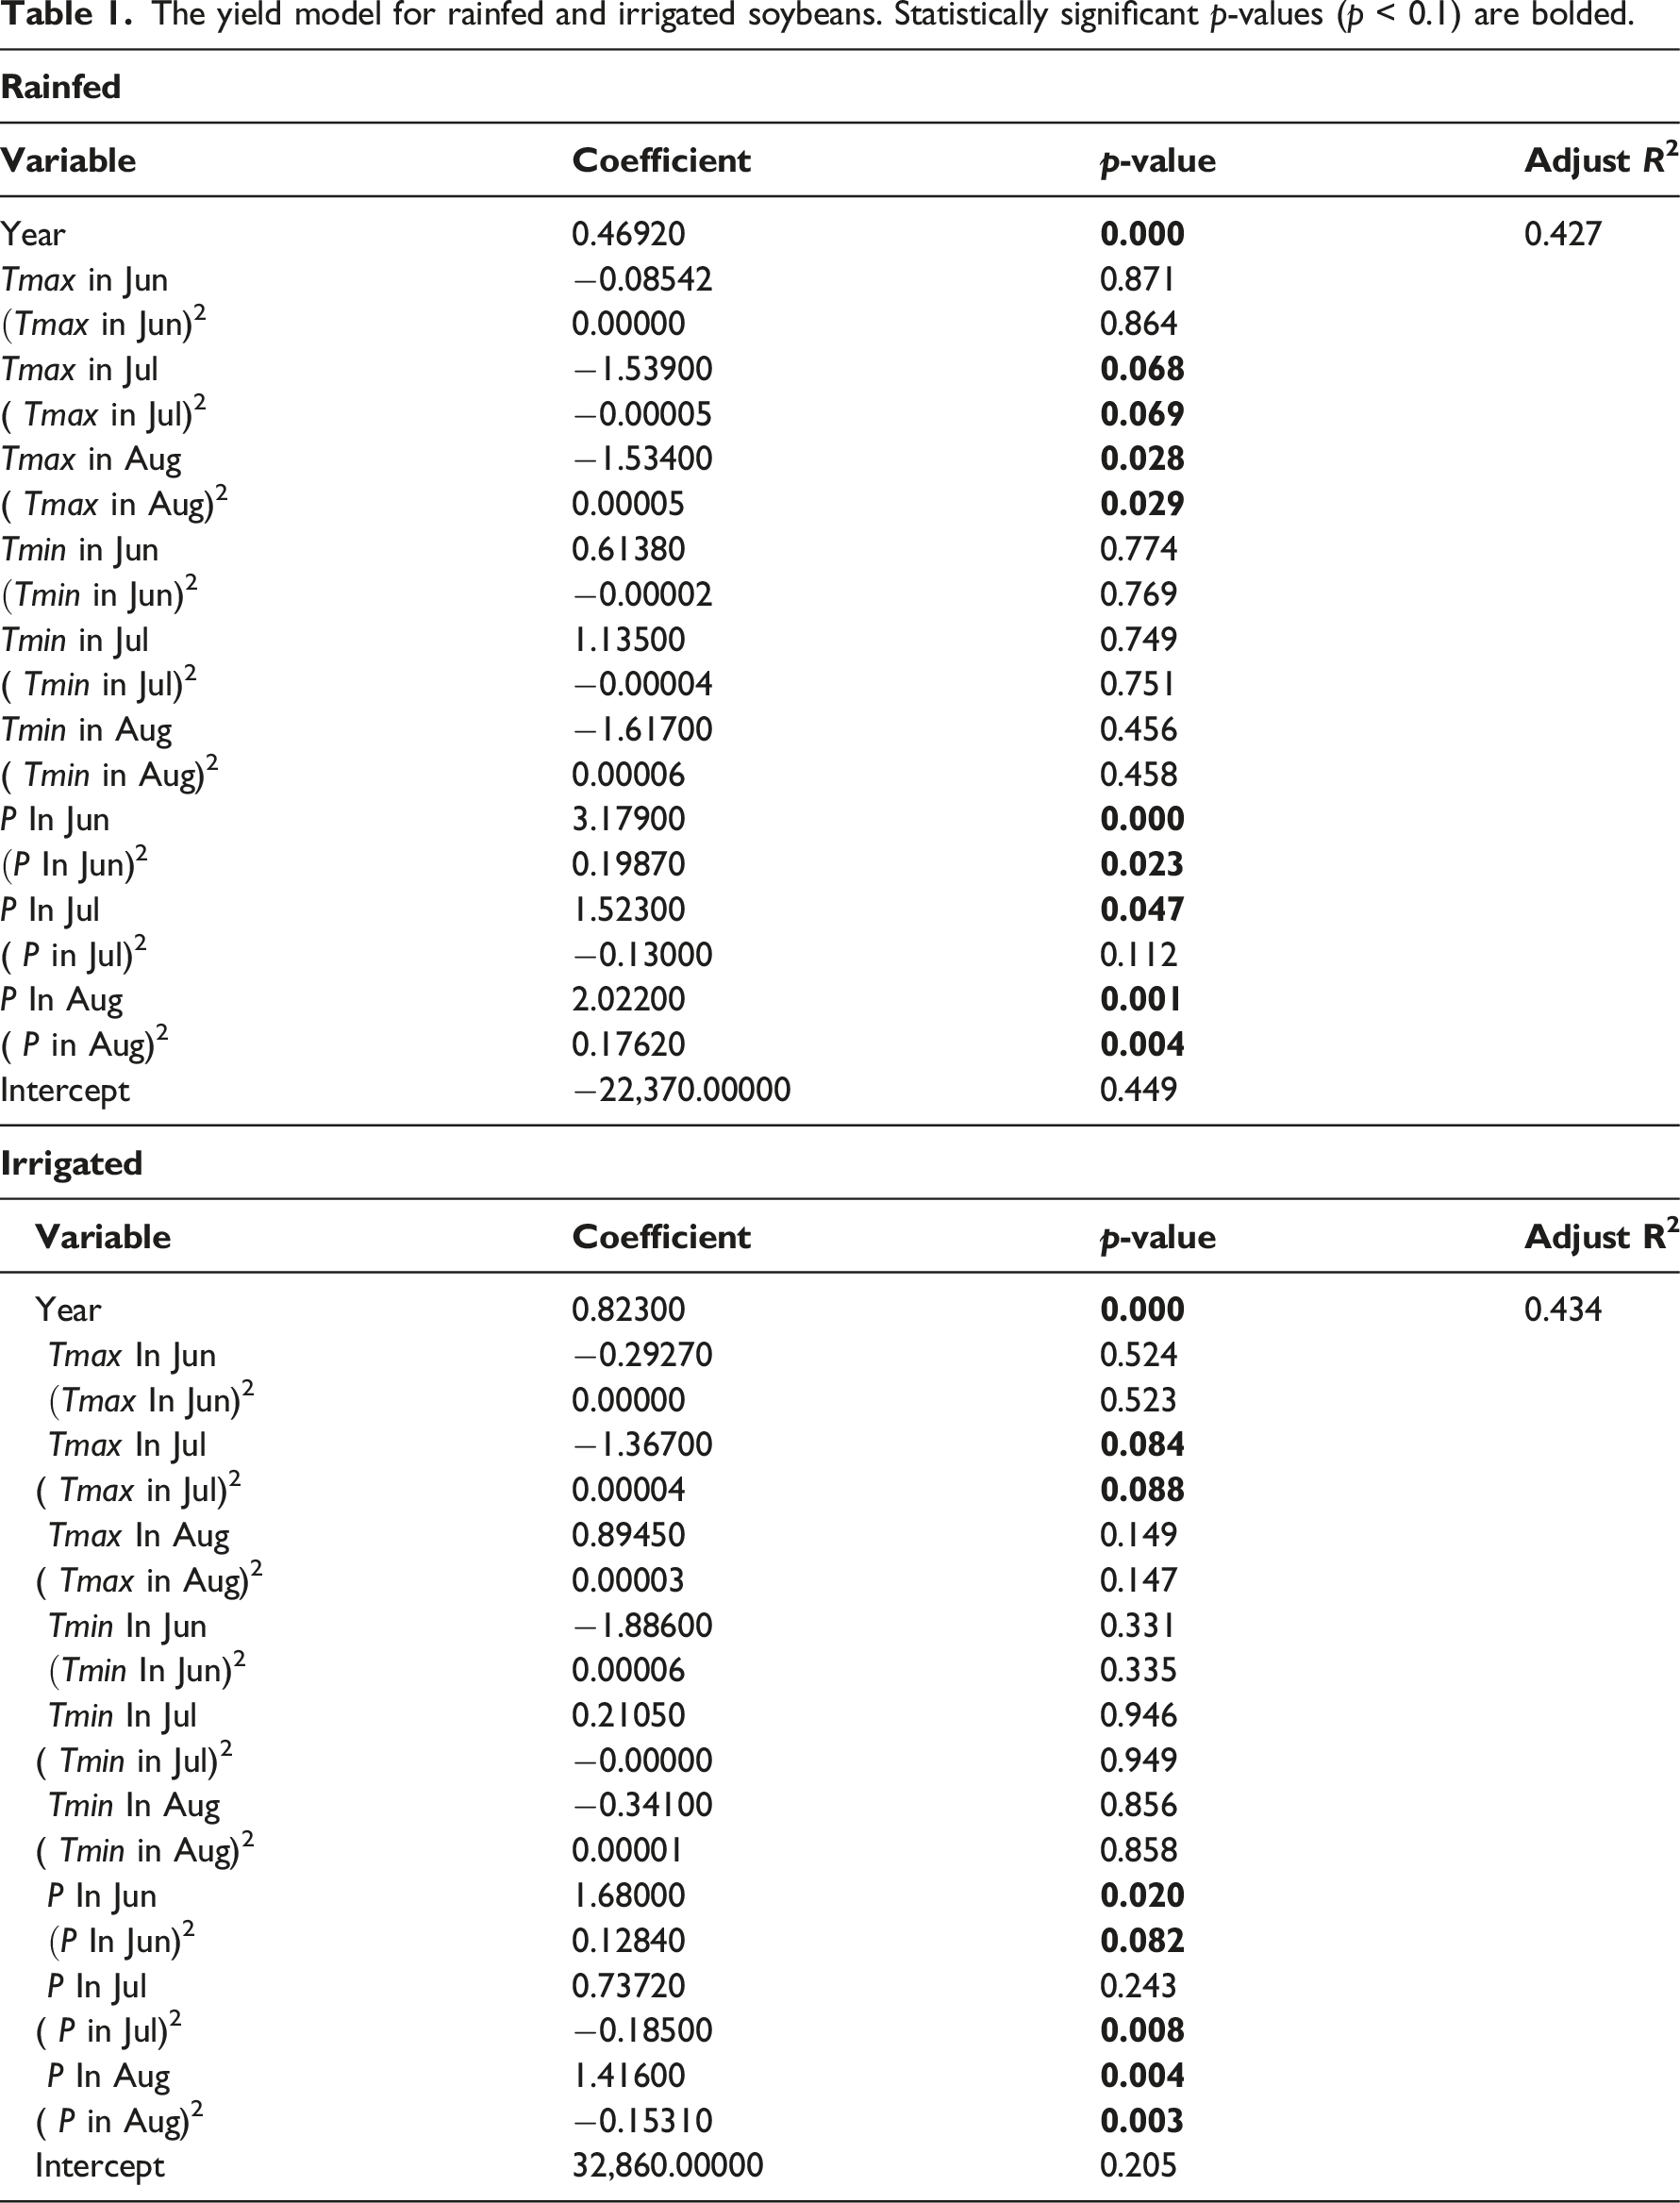
The yield model for rainfed and irrigated soybeans. Statistically significant p-values (p < 0.1) are bolded.
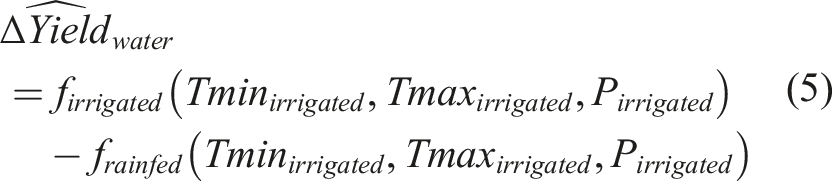
Equation (3) was used to assess how the irrigation-climate interactions influenced soybean yields for each year from 2003 to 2017. Figure 7(a) shows that irrigation-climate interactions increase soybean yields for all the years over the Arkansas Delta. The largest increase was in 2009 with a value of 1.27 ( Effects of (a–b) irrigation-climate interactions and (d–e) irrigation-water supply on soybean yields. (c) and (f) is the percentage of contribution of irrigation-climate interactions and irrigation-water supply to the total irrigation yield gain. The shaded areas in (a) and (c) are two standard deviations.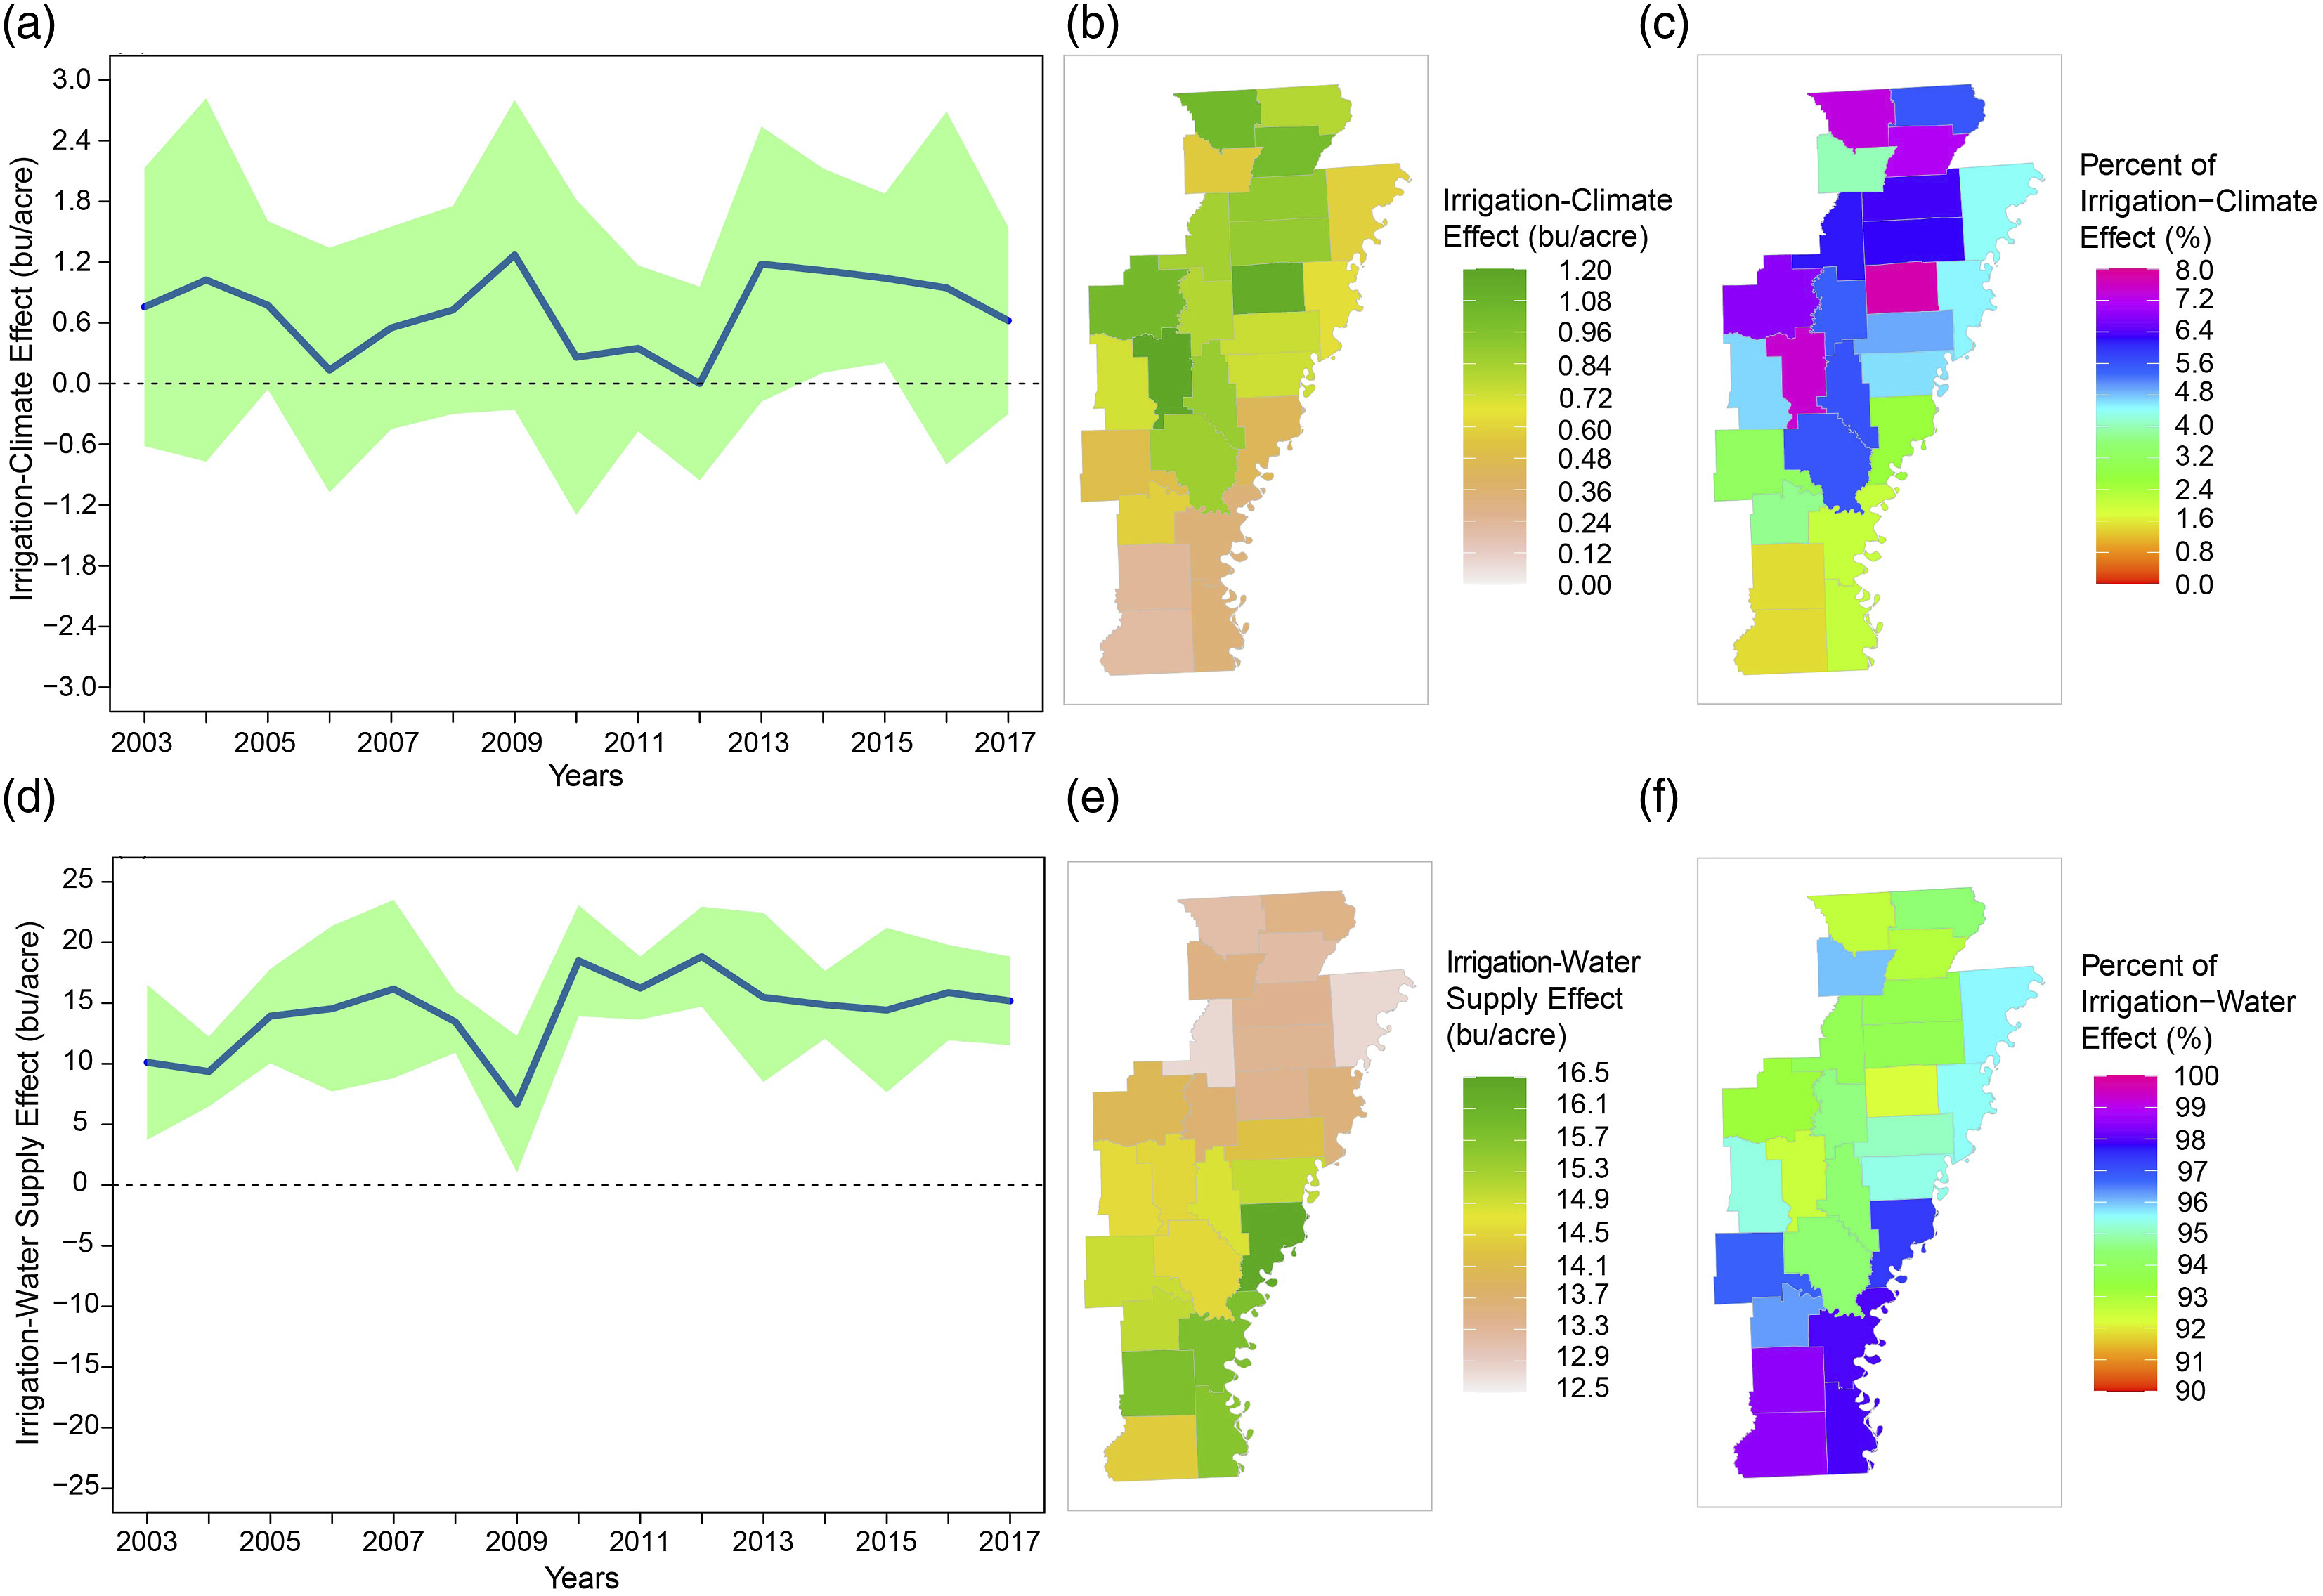
Based on equation (5), we also assessed how irrigation-water supply affected soybean yields from 2003 to 2017 in the Arkansas Delta region. The irrigation water increases soybean yields across all the years with a maximum value of 18.83 (
There are some limitations in our analyses. First, the Daymet precipitation data are from interpolation or extrapolation of meteorological station data, which may mask out the small-scale irrigation-precipitation interactions. This maybe improved when high-resolution satellite-derived or reanalysis data are available. Second, there are some uncertainties in the input data (e.g., inconsistent reporting in USDA-NASS county-level yield data, inconsistency of CDL data between years 2003–2007 and 2008-2017, and relative low accuracy of rainfed data from LANID data). This may lead to uncertainties in the crop yield models, and thus over- or under-estimate the effects of irrigation-climate interactions and irrigation-water supply on soybean yields in the Arkansas Delta. Using training samples from Delta to improve the satellite-based crop types data and irrigated and rainfed data may enhance the data accuracy, thus reducing the uncertainties in yield model.
Conclusion
The Arkansas Delta, ranking third in the nation in terms of irrigated croplands, relies heavily on groundwater irrigation. The irrigated areas continue to increase in Arkansas with two million ha of irrigated croplands recently (Yaeger et al., 2018). Better understanding the irrigation-climate interactions impacts on crop yields is vital to promote sustainable irrigation practices and thereby maintain long-term agricultural profitability in Arkansas. Irrespective of the rapid increase of irrigated lands in the Arkansas Delta, the effects of irrigation and the consequent climate variability on crop yield in this region have not been a research priority relative to other parts of the United States like the Midwest. Such an unsolved issue becomes more important under the future climate change, where both water and heat stresses are expected to become severer (Coffel et al., 2019).
The study applied multiple remote sensing data products, a national inventory, and climate datasets to explore the effects of irrigation-climate interactions on soybean yields in the US Arkansas Delta in the early 21st Century. The results show that the areas for irrigated soybean statistically significantly increase in the eastern Arkansas Delta, while the areas for rainfed soybean show insignificant change from 2003 to 2017. Soybean irrigation has limited impacts on monthly average precipitation, while the cooling effects of irrigation on monthly average daily maximum and minimum temperature are much stronger. By using statistical rainfed and irrigated crop yield models, we further demonstrated that in addition to the direct irrigation-water supply benefits, irrigation-climate interactions could boost soybean yields in the Arkansas Delta region, contributing ∼4.85% of total irrigation yield gain.
Our work serves as another important evidence that irrigation or increased water supplies to crop fields has both direct (i.e., meeting biological water demand) and indirect (i.e., cooling effect to reduce heat stress) contributions to irrigated crop yields gain. Together with previous studies (e.g., Zhu and Burney, 2022), this finding may be applied to other agricultural regions across the globe. Therefore, it could serve as the scientific basis to aid sustainable agricultural practices, thus benefiting local farmers in Arkansas and across the globe. However, continuous monitoring for the future of agriculture is needed. The global water supply crisis has occurred across the globe, including in the US, due to rapid population growth, fast urbanization, and drastic land-cover changes (He et al., 2020). The insignificant impacts of irrigation on local precipitation patterns we identified in this study could not guarantee surface reservoir or aquifer recharge in future, given the continuous warming and more frequent drought (Cook et al., 2020). In addition, groundwater in some regions (e.g., Arkansas Delta) has experienced critical declines (Reba et al., 2017). The limited groundwater may reduce irrigation intensity, as such cooling effects may fade in the future, exposing crops to more harmful heat stress that caused by climate change (Coffel et al., 2022).
Supplemental Material
Supplemental Material - Impacts of irrigation-climate interactions on irrigated soybean yields in the US Arkansas Delta from 2003 to 2017
Supplemental Material for Impacts of irrigation-climate interactions on irrigated soybean yields in the US Arkansas Delta from 2003 to 2017 by Yaqian He, Matthew H. Connolly, Rongting Xu, Xiao Huang, Zhuosen Wang, Marisol Filares Arreguin and Caden Rhodes in Progress in Physical Geography: Earth and Environment
Footnotes
Declaration of conflicting interests
The author(s) declared no potential conflicts of interest with respect to the research, authorship, and/or publication of this article.
Funding
The author(s) disclosed receipt of the following financial support for the research, authorship, and/or publication of this article: This work was supported by the Faculty Development Competitive Grant at the University of Central Arkansas; NASA EPSCoR Research Infrastructure Development (RID21014); University Research Council Grant at University of Central Arkansas.
Supplemental Material
Supplemental material for this article is available online.
References
Supplementary Material
Please find the following supplemental material available below.
For Open Access articles published under a Creative Commons License, all supplemental material carries the same license as the article it is associated with.
For non-Open Access articles published, all supplemental material carries a non-exclusive license, and permission requests for re-use of supplemental material or any part of supplemental material shall be sent directly to the copyright owner as specified in the copyright notice associated with the article.