
Abstract
A consensus has not yet been reached on effects of climate change and driving mechanisms between the Tibetan Plateau (TP) and adjacent monsoonal areas during the Marine Isotope Stage 3 (MIS 3). Loess–paleosol sequences from the TP provide valuable information about the MIS 3 environmental history. Detailed color index and a diffuse reflectance spectral (DRS) analysis of Zhouqu (ZQ) loess from the Western Qinling Mountains were conducted to investigate climate change on the eastern margin of the TP during the MIS 3. Our results show that the variations in color index and iron oxide content in ZQ loess are mainly caused by the pedogenesis and climate conditions. The lightness (L*) value and hematite (Hm) content were used to reconstruct the precipitation history and temperature changes, respectively. The reconstructed records revealed that climate change during the MIS 3 was characterized by high frequency and large amplitude, with millennial-scale changes superimposed on orbital-scale changes. Warm–humid climate occurred in the late MIS 3, while the early climate of MIS 3 was relatively cold–dry. The Indian summer monsoon (ISM) and temperature variations during the MIS 3 mainly occurred due to obliquity and precession. The North Atlantic cooling led to the southward movement of the Intertropical Convergence Zone, and the downstream cooling of the atmosphere by the westerly jet could result in events on a millennial-scale in the eastern margin of the TP. The interhemispheric forcing may play an important role in driving the strong summer monsoon in the late MIS 3.
Introduction
The Tibetan Plateau (TP) is a key part of the Asian monsoon system, and climate change and its driving mechanisms during the Marine Isotope Stage 3 (MIS 3) are highly debated (Dutt et al., 2015; Guan et al., 2012; Han et al., 2010; Pons-Branchu et al., 2010; Shi et al., 1999; Thompson et al., 1997; Voelker, 2002; Zhang et al., 2020). The isotopic records of the Guliya ice core from the western TP indicate that the climate in the late MIS 3 (40−30 ka) was warm–humid with a strong monsoon, and the precipitation and temperature were significantly higher than those at present (Shi et al., 1999; Shi and Zhao, 2009; Thompson et al., 1997). These conditions differed from the cold–dry climate in the Chinese Loess Plateau (CLP) and Europe (Andersen et al., 2004; Antoine et al., 2001; Feng et al., 2007; Guo et al., 2009; Kang et al., 2011; Zeeden et al., 2018). The high lake levels and pollen records of the TP and its surrounding areas as well as the transgressive records of eastern China also corroborate the warm–humid climate in the late MIS 3 (Li et al., 2008; Shi and Yu, 2003; Shi and Zhao, 2009; Wang et al., 2011; Wu et al., 2004). However, the age ranges of the TP ice cores are controversial, influencing the interpretation of the past climatic and environmental conditions at different timescales (Hou et al., 2018, 2021; Thompson et al., 2001; Tian et al., 2019; Zhong et al., 2020). Recent studies have shown that the period of maximum lake expansion may have occurred in the MIS 5 rather than MIS 3 (Lai et al., 2014; Yu et al., 2019; Zhang et al., 2020a). Furthermore, the extremely warm–humid climate in the late MIS 3 is controversial. The climatic evolution, regional differences, formation mechanisms, and the orbital-scale cycles in the TP during the MIS 3 are unclear due to the uncertainties in the age model and the differences among the various proxies and geologic records (Han et al., 2010; Liu et al., 2020; Li et al., 2008; Shi and Yu, 2003; Shi and Zhao, 2009; Hou et al., 2021; Tian et al., 2019; Li et al., 2020; Zhong et al., 2020; Yang et al., 2021a). Early research on loess in the Western Sichuan Plateau and the Northeastern TP (NETP) revealed that the region suffered numerous cold–warm temperature variations during the last glacial period (Fang et al., 1996; Jiang et al., 1997; Lv et al., 2004; Pan and Wang, 1999; Qiao et al., 2006). Research on loess in the Chengdu Basin showed that the Indian summer monsoon (ISM), which originates from the subtropical Mascarene High in the Southern Hemisphere, carries large precession signals from the equatorial and tropic zones, leading to the overall intensification of the MIS 3 climate signals (Han et al., 2010). The variations of the East Asian monsoon intensity largely control the humidity record of NETP loess (Li et al., 2008). A study on loess in southeastern TP stated that the ISM intensity at 38.7, 28.3, 25.9, and 23.5 ka was notably higher than that during the Holocene, including the present day (Feng et al., 2022). According to the Ganzi loess and Maerkang loess in the west Sichuan Plateau, the conditions during MIS 3 were humid due to the intensified ISM (Chen et al., 2022; Li et al., 2023; Yang et al., 2022). The TP loess studies have significantly advanced our understanding of the paleoenvironmental changes. However, more regional and high-resolution data with good age control records are urgently needed to address the above questions.
Loess from the TP are the key for understanding climate change in the region. For the TP, high-resolution loess records, comprising a good terrestrial archive (An et al., 1991; Liu, 1985), are still lacking. Recent investigations about the loess sequences in the TP and its surrounding areas have improved our understanding on the paleoenvironment evolution and paleoclimate changes since the last interglacial (Chen et al., 2022; Han et al., 2010; Liu et al., 2021a; Yang et al., 2021a, 2021b, 2022). Aeolian loess was deposited at a high accumulation rate and was sensitive to climate change in the Western Qinling Mountains (WQM), which is the transitional zone between the CLP and the TP. This provides an opportunity for better understanding climate change during the MIS 3 (Fang et al., 1999a, 1999b; Yang et al., 2021b; Zhang, 1997; Zhang et al., 1997). Therefore, the study of loess in the WQM is crucial for comprehending the evolutionary history of the Asian monsoon and the plateau environment since the Pleistocene.
Color index and diffuse reflectance spectral (DRS) analyses are valuable proxies for reconstructing the paleoenvironment history in loess–paleosol sequences. Soil color is one of the most significant characteristics of loess–paleosol sequences (Sun et al., 2011; Yang and Ding, 2003; Yang et al., 2001). Substances that significantly affect it include organic matter, calcium carbonate, hematite (Hm), and goethite (Gt), which are closely related to pedogenesis (Balsam et al., 2004; Gunal et al., 2008; Ji et al., 2004; Sun et al., 2011; Torrent et al., 1980). The alternating reddish brown and light yellow colors of the loess–paleosol sequence reflect the soil genesis characteristics under warm–humid and cold–dry climatic conditions, respectively (An et al., 1991; Liu, 1985). Thus, soil color effectively reflects climate change of the glacial/interglacial cycle. The soil color index has been proposed to be very sensitive to high-resolution and millennium-scale climate changes (Wang et al., 2016; Yang et al., 2001). Numerous researchers have used soil color to reconstruct the monsoon and paleoenvironment evolutions over various time scales (Sprafke et al., 2020; Thompson et al., 1997; Wang et al., 2016; Yang and Ding, 2003; Yang et al., 2001). The Hm and Gt content and proportion in soil are particularly sensitive to the climate, and Hm presents the potential for temperature reconstruction (Balsam et al., 2004; Cornell and Schwertmann, 2003; Ji et al., 2004; Jia et al., 2018). A DRS analysis can effectively yield the Hm and Gt contents and has been successfully used to reconstruct paleoclimates and paleoenvironments (Balsam et al., 2004; Ji et al., 2004; Jia et al., 2018; Wang et al., 2016).
In this study, using soil color and DRS measurements from the accurately dated Zhouqu (ZQ) loess sequence in the WQM, the sensitivity of the loess color proxies and DRS-derived iron oxides (Hm and Gt) to climate change is examined. Then, these proxy data are used to reconstruct high-resolution records of climate change in the MIS 3, and the forcing mechanism in the eastern TP is investigated.
Materials and methods
Materials
The ZQ section (33°46.74°N, 104°23.94°E, 2047 m) is located on the fifth terrace of the Bailong River in the WQM. The ZQ section is 16.3 m thick and has a gravel layer at the bottom. A 2.8-m-thick dark-brown Holocene soil (S0) layer is located at the top of the ZQ section, and the upper 0.5−1.5 m of soil is affected by agricultural activity. A brown paleosol layer (L1LS1, 8.2−13.6 m) exists in the middle part of the section. The two loess layers (L1LL1 and L1LL2) are pale yellow in color and have a loose texture. An age-depth model (Figure S2) of the ZQ section was constructed based on the published results of quartz optically stimulated luminescence ages and accelerator mass spectrometry 14C ages (Yang et al., 2021b). To obtain high-resolution proxy data, the 16.3-m-thick ZQ section was sampled in 2.5 cm increments for color and DRS analyses.
The climate of the ZQ area is mainly influenced by the ISM, the TP monsoon, and the westerlies (Figure 1(a)). Regional precipitation is mainly transported by the ISM (Fang et al., 1999b; Yang et al., 2010; Zhang et al., 2011). Figure 1(b) and 3S depict the summer circulation situation. The mean annual precipitation (MAP) in ZQ is 420.60 mm, with the majority of precipitation occurring from May to September (Figure 1(d)). The mean annual temperature (MAT) is 13.4°C, and the mean annual evaporation (MAE) is 1972.4 mm. Geographical location of the ZQ section and regional records, topography of TP and its surrounding atmospheric circulation (a), average wind field of 850h Pa from July to September from 1960 to 2010 based on reanalysis data of ERA5 (b), image of ZQ section (c), and meteorological information of ZQ section (d).
Methods
The CIE L*a*b* color, DRS, and magnetic susceptibility analyses were performed at the Key Laboratory of Western China’s Environmental Systems (Ministry of Education), Lanzhou University. A total of 652 samples were measured using a portable spectrophotometer (CM-700d, Minolta, Tokyo, Japan). An agate mortar was used to grind air-dried samples into powder. Subsequently, the spectrophotometer was used to obtain three groups of diffuse reflectance spectra and color values for each sample. The standard deviation of the instrument’s chromaticity value was less than △E*AB within 0.04 *. The reflectances for violet, blue, green, yellow, orange, and red (defined as Violet%, Blue%, Green%, Yellow%, Orange%, and Redness%, respectively) were calculated from the reflectance data (Ji et al., 2001; Ji et al., 2004). The Redness% was used to determine the Hm content (Long et al., 2011). The second-derivative spectrum of the Kubelka–Munk remission function at each wavelength was calculated in accordance with Torrent and Barrón (2003). The relative variations in the mass concentrations of Gt and Hm were determined using the band amplitudes at ∼425 and ∼535 nm, which are proportional to the Gt and Hm contents, respectively (Scheinost et al., 1998). Previous studies employed the Hm/(Hm+Gt) ratio as a climate index (Ji et al., 2004; Jia et al., 2018). Low frequency (470 Hz) susceptibility (χlf) was measured using a Bartington MS2 susceptibility meter (MS2, Bartington Instruments, Witney, UK) (Yang et al., 2021b).
To verify the influence of Earth’s orbital parameters on the climate, an ensemble empirical mode decomposition (EEMD) and power spectrum analysis were conducted for the ZQ loess. EEMD (Huang et al., 1998) directly extracts the energy related to time scales in nonlinear fluctuations and iteratively decomposes the original composite signal with multiple time scales into a series of intrinsic model function components. This avoids the arbitrariness of frequency-band selection in multi-scale research. The EEMD method was employed to separate the various oscillation components in the ZQ loess records. Then, the period of each component was analyzed using the REDFIT spectrum. Power spectrum analyses were performed using Past software (Hammer et al., 2001) and Redfit software (Schulz and Mudelsee, 2002). The rectangular window, one overlapping (50%) segment, and eight oversampling factors with 80% and 90% confidence intervals were used to analyze the data.
Results
Color characteristics
The lightness (L*) and redness (a*) of the ZQ section considerably fluctuated, and obvious differences existed in each stratum (Figure 2(a) and (b)). The L* value in the ZQ section had an average value of 55.11 and a range of 47.70–59.01. The average L* values in S0 and L1LS1 were 54.37 and 54.14, respectively, while the average L* values in L1LL1 and L1LL2 were 55.81 and 56.43, respectively. The L* of the ZQ section had a high amplitude, low value in the paleosol, and high value in the loess layer features. The average a* value in the ZQ section was 6.49, with a range of 5.24–8.62. The a* value was higher in L1LS1 and lower in S0. From L1LS1 to S0, a* gradually decreased from the bottom to the top. Variation in soil color L* (a), a* (b), Redness% (c), Hm (d), Gt (e) and Hm/(Hm+Gt) (f) in the ZQ section. Quartz optical stimulated luminescence ages and AMS 14C ages are from Yang et al. (2021b).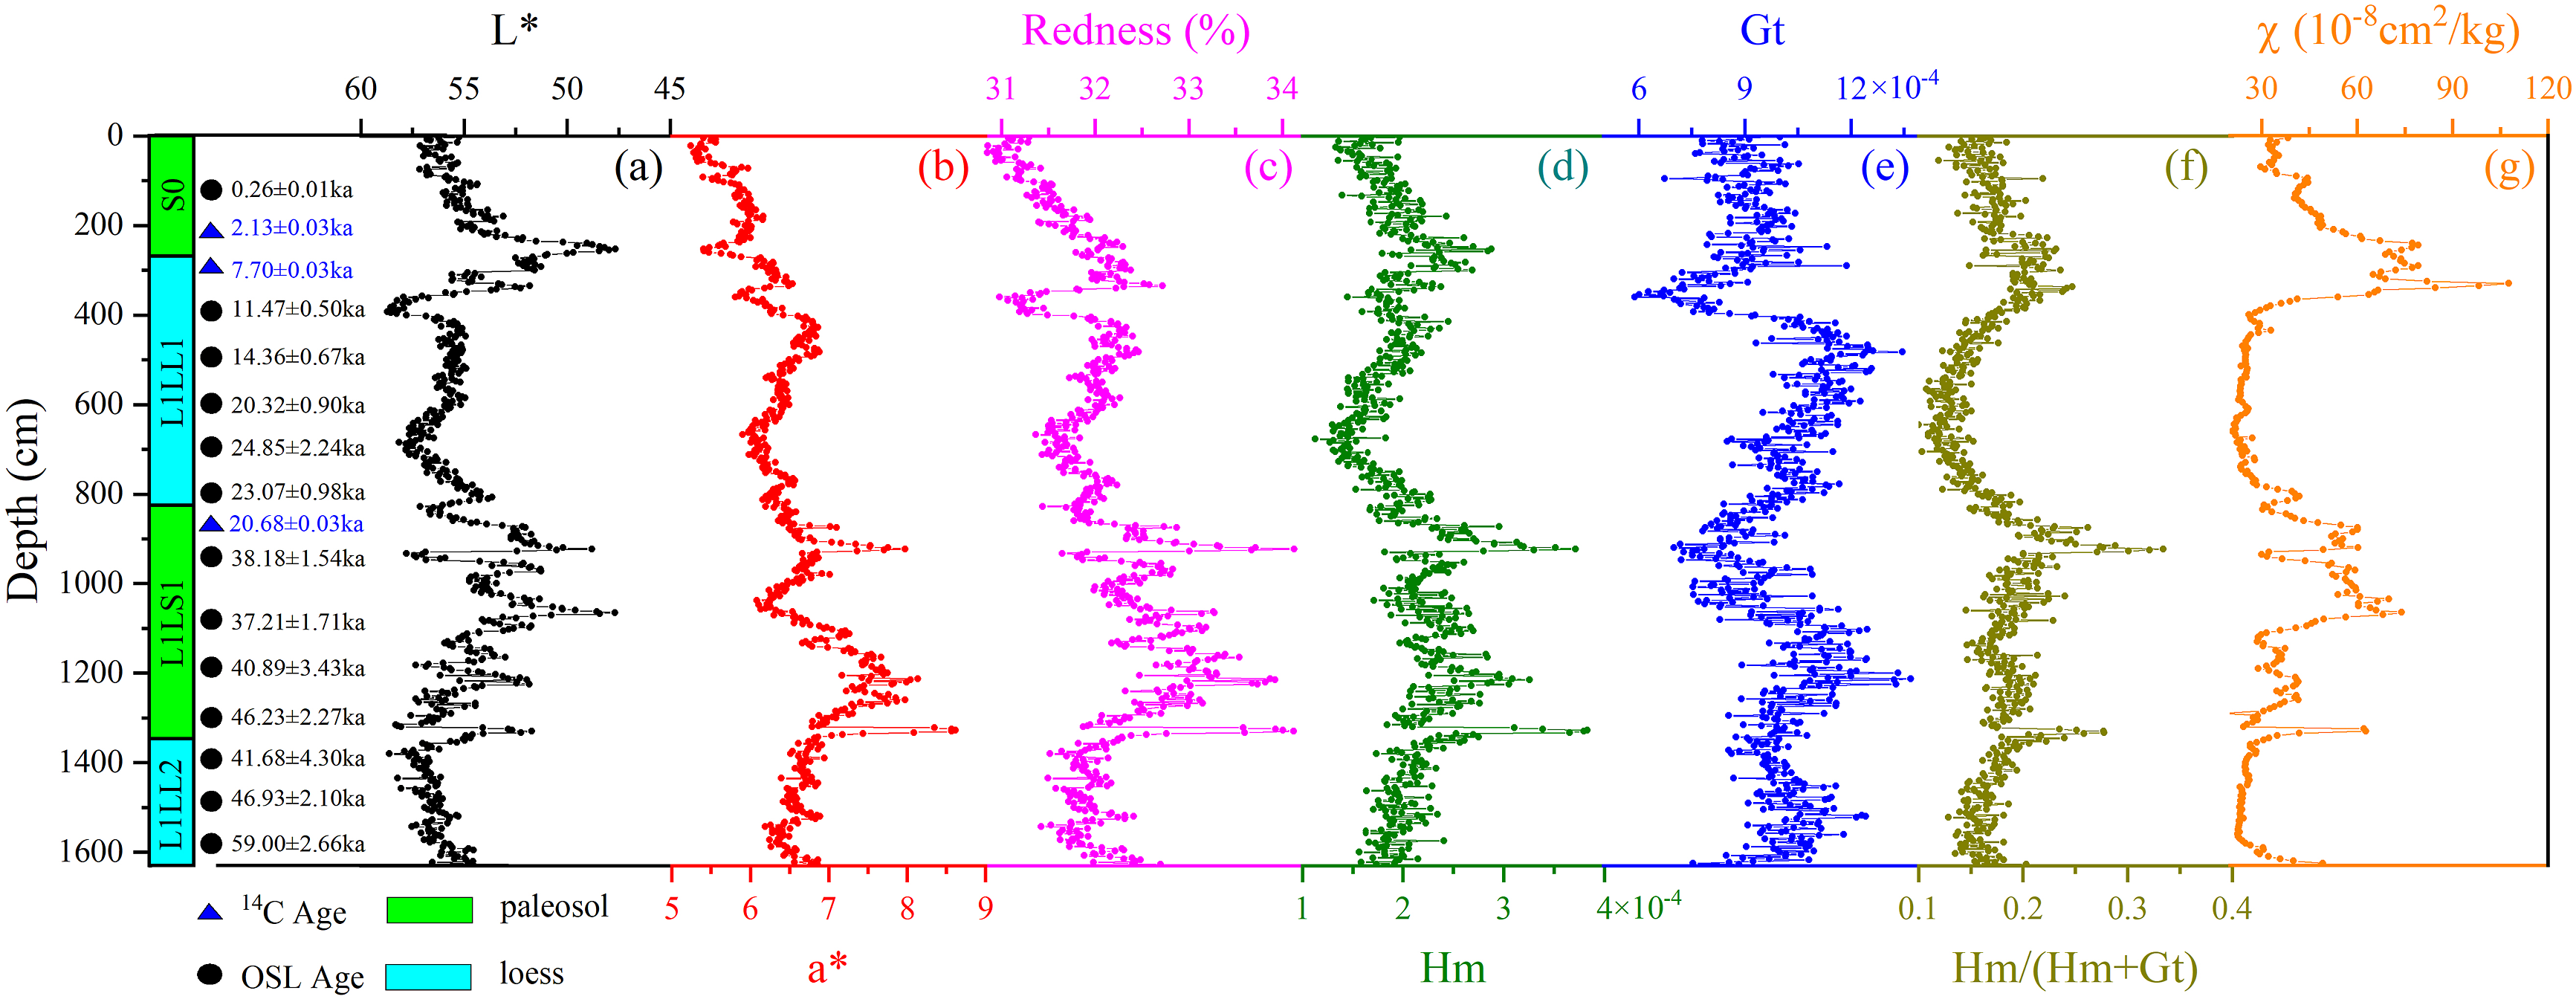
DRS characteristics
The reflectance of each color band was calculated for the different strata. The results showed that each color band’s reflectance substantially varied across the different strata (Figure S1 and Table S1). Compared to L1LL1, L1LL2, and L1LS1, the average Violet%, Blue%, and Green% values of S0 were significantly higher, while the average Yellow%, Orange%, and Redness% values of S0 were significantly lower. The differences in the average reflectance in each color band of L1LL1 and L1LL2 were relatively small. However, the average Violet%, Blue%, Yellow%, and Green% values of L1LS1 were lower than those of L1LL1 and L1LL2. The Orange% value of L1LS1 was higher than that of L1LL1 and slightly lower than of L1LL2. However, the Redness% value of L1LS1 was significantly higher than that of L1LL1, L1LL2, and S0. The reflectances of each color band for L1LS1 significantly differed from those for S0.
The samples from various strata in the ZQ section essentially exhibited the same second-derivative DRS curve shape (Figure 3). The characteristic valleys for Hm and Gt of the second-derivative DRS curve of the ZQ section were situated at ∼525 and ∼410 nm, respectively. However, the band amplitude at ∼525 and ∼410 nm was clearly different in various strata. The band amplitude at ∼410 nm was the strongest in L1LL1 and L1LS1 (Figure 3(b) and (c)), while the band amplitude at ∼525 nm was the strongest in L1LS 1 (Figure 3(c)). Second-derivative curves of DRS in S0 (a), L1LL1 (b), L1LS1 (c), and L1LL2 (d) of ZQ section.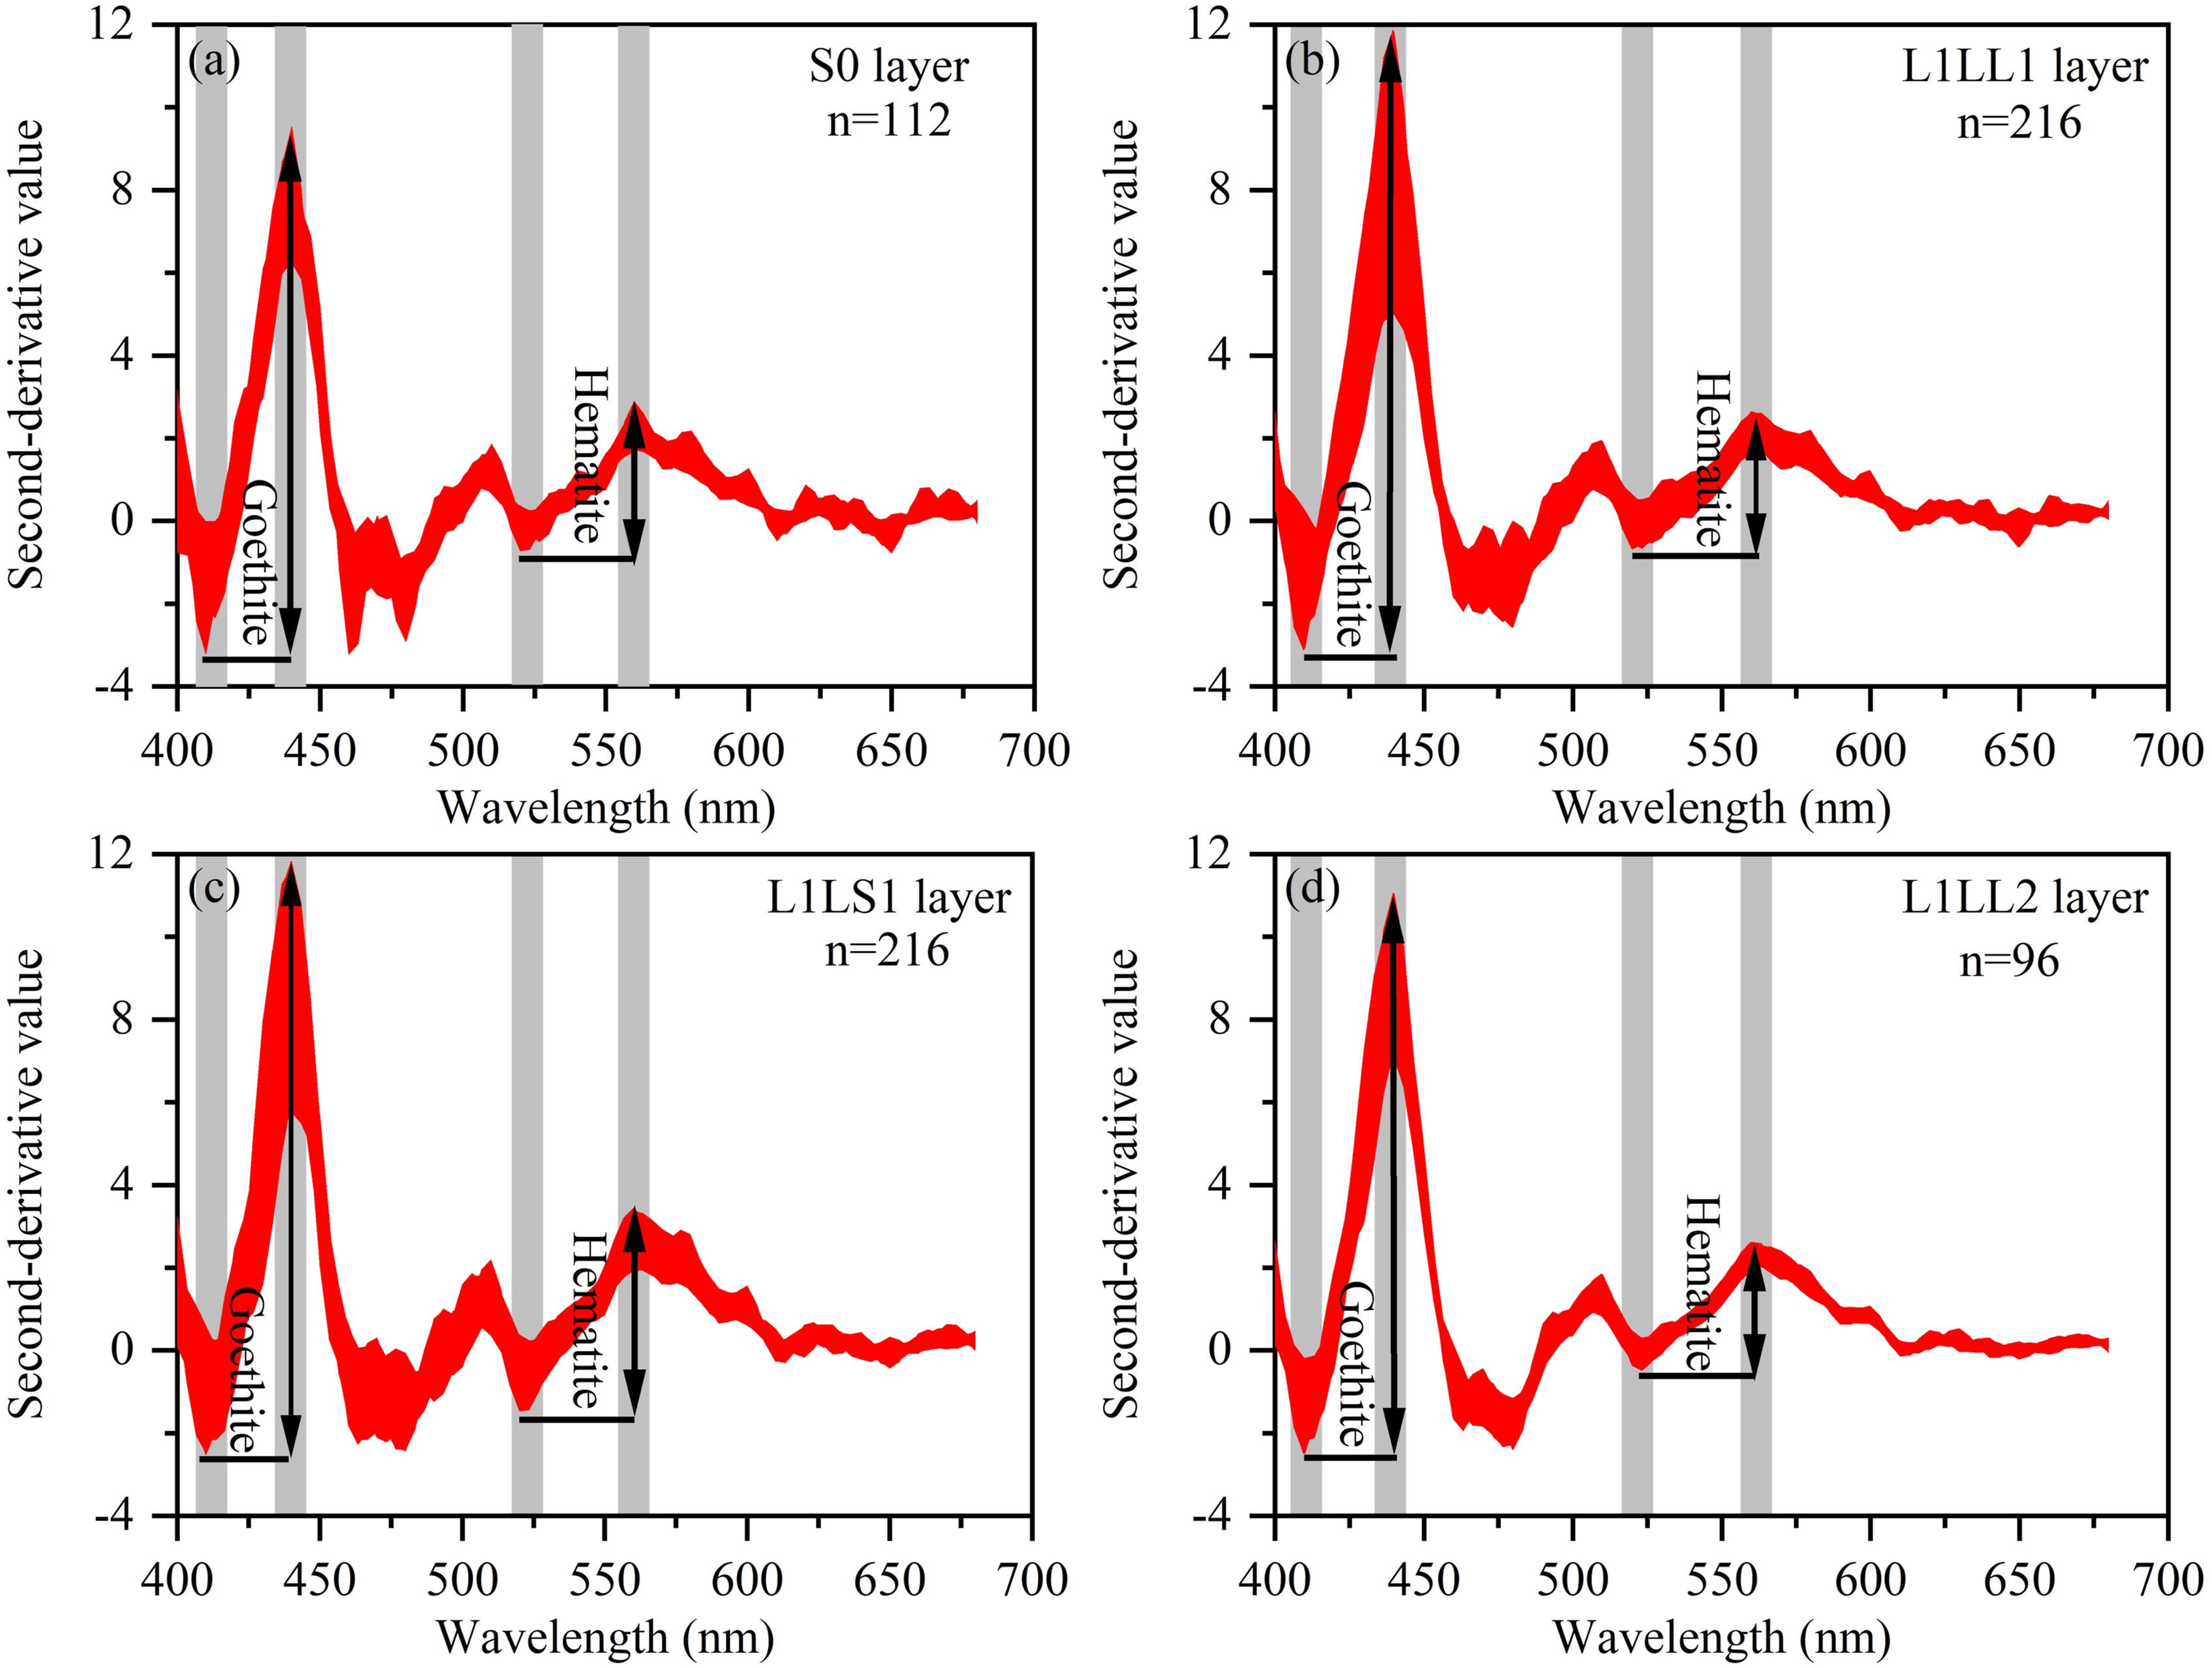
Hm and Gt contents based on DRS
In Figure 2(c), the Redness% value varies from 30.84% to 34.13%, with an average value of 32.07%. The Redness% value exhibits strong fluctuations and high amplitudes throughout the strata. The Redness% value of L1LS1 is high, with an average value of 32.60%, while that of S0 is low. The average value of Hm is 9.85 × 10⁻⁴, with a range of 5.88–13.70 × 10⁻⁴. The Hm content in L1LS1 and S0 is higher than that in L1LL1 and L1LL2, with similar fluctuations and amplitudes to the Redness% value. The average value of Gt is 2.03 × 10⁻⁴, with a range of 1.12–3.84 × 10⁻⁴. The Gt content is relatively high in L1LL1 and L1LS1, and its fluctuations significantly differ from those of the Redness% value and Hm content. The average value of the Hm/(Hm+Gt) ratio is 0.17, and the variation range is 0.10–0.34. The Hm/(Hm+Gt) ratio is relatively high in L1LS1 and S0 and relatively low in L1LL1 and L1LL2, with a significant increase from L1LL2 to L1LS1.
Discussion
Color index and iron oxide, and their environmental significance
The production and transformation of iron oxides, the production and decomposition of organic matter, and the leaching and deposition of carbonates significantly impact the soil color during environmental changes and pedogenesis. The two primary substances believed to affect the L* value of loess–paleosol sequences are carbonate and organic matter, which are closely related to regional precipitation (Balsam et al., 1999; Fernandez et al., 1988; Gunal et al., 2008; He et al., 2010; Sun et al., 2011; Yang and Ding, 2003; Yang et al., 2001). Generally, an increase in the carbonate content significantly increases the L* value, while an increase in the organic matter content significantly darkens the soil (Hammer et al., 2001; Sun et al., 2011; Yang et al., 2001). A strong correlation has been observed between the L* value and precipitation in arid semi-humid areas (Miao et al., 2013; Yang et al., 2001). Furthermore, changes in the L* value in loess–paleosol studies have been widely used to reconstruct the precipitation history, and the L* value is sensitive to millennial scale and orbital climate oscillations (Chen et al., 2002; Wang et al., 2016; Yang et al., 2001). The sedimentary environment and process of WQM loess differ from those of the CLP or Central Asian loess. According to a previous study, the loess in the investigated area is of typical aeolian origin, which is consistent with the main characteristics of loess in the CLP (Zhang et al., 1997; Fang et al., 1999a, 1999b). In terms of material sources, the TP may have provided adequate dust resources for the WQM loess (Fang et al., 1999a, 1999b; Zhang et al., 1997). However, the variation of the L* value in the ZQ section was low in the paleosol layer and high in the loess layer. The low L* value in the paleosol mainly stemmed from the increase in the organic matter content via pedogenesis. The χlf value reflects the pedogenic ferromagnetic mineral content, which is controlled by monsoon precipitation, and it is often used as a proxy for precipitation in loess (An et al., 1991; Kukla and An, 1989; Maher, 2016; Schaetzl et al., 2018). The changes of the L* and χlf values in the strata were compared (Yang et al., 2021b) and were found to be similar (Figure 2(a) and (g)). The paleosol had high χlf and low L* values, and the loess layer had low χlf and high L* values. This suggests that magnetic minerals and organic matter enriched the paleosol due to the well-developed pedogenesis related to abundant monsoon precipitation. These results depict that precipitation and pedogenesis were the main influencing factors of the L* and χlf values in the WQM loess. Previous loess research on the southern foothills of the Qinling Mountains showed that the L* and χlf values well correspond, indicating their similar response to pedogenesis and climate change (Gao et al., 2015; Mao et al., 2017; Yang et al., 2018). The latest research on the soil color of topsoil in the eastern TP showed that the L* value can be utilized to determine the precipitation changes (Chen et al., 2022). Therefore, the changes in the L* value in the ZQ section could be used to determine the changes in the precipitation in the WQM loess. Additionally, the frequency and amplitude of changes in the L* value were more sensitive to precipitation than χlf, as previously reported (Yang et al., 2001).
The primary minerals responsible for the color of iron oxides are Hm and Gt, which are brownish red and bright yellow in color, respectively (Cornell and Schwertmann, 2003; Ji et al., 2004; Sun et al., 2011). Changes in the different color bands reflect the selective absorption and diffuse reflection of different substances in the soil. The a* and Redness% values and Hm content reflect the spectral properties of Hm, while the Gt content reflects the spectral properties of Gt (Cornell and Schwertmann, 2003; Singh and Gilkes, 1992). The results show that the Gt content variation is low in the paleosol and high in the loess (Figure 2(e)), which could be related to the complex production of Gt in the pedogenesis (Balsam et al., 2004; Ji et al., 2004). The variation in the a* and Redness% values and the Hm content in the ZQ section were consistent in the strata (Figure 2(b)–(d)); however, the a* and Redness% values and Hm content of S0 were lower than those of L1LL1 and L1LL2. Additionally, the reflectances of each color band for S0 were significantly different from those for the other layers (Table S1 and Figure S1). Pedogenesis resulted in the weathering of iron-rich silicates, such as chlorite, and the formation of iron oxide minerals in the CLP loess under warm, moist, summer monsoon conditions (Ji et al., 2004; Wang et al., 2016). However, the enrichment of organic matter and the transformation of iron oxides in the soil caused by the human activities (Kanu et al., 2014; Schulze et al., 1993; Zhu et al., 2020) could lead to deviations in the meaning of these indicators. Holocene human activity could have led to uncertainty in the indicative significance of the Hm content with respect to climate (Kanu et al., 2014; Schulze et al., 1993; Guan et al., 2023). The high a* and Redness% values and high Hm content in the L1LS1 paleosol signify that the Hm formation was mainly related to pedogenic and climatic factors.
Hm formation is more sensitive to temperature than precipitation, with high temperature and low-moisture conditions being most favorable (Cornell and Schwertmann, 2003; Schwertmann, 1985). The changes in the a* and Redness% values and Hm content were consistent with the L * and χlf values in L1LL1, but their changes were significantly different from the L * and χlf values in L1LS1. Compared to the 860−1150 cm layer, the 1150−1360 cm layer in L1LS1 exhibited a lower χlf value and higher L*, Redness% value, a* value, and Hm content. These results indicate that the period represented by the 860−1150 cm layer was more favorable for the formation of ferromagnetic minerals and organic matter than the formation of Hm, whereas the period represented by the 1150−1360 cm layer was more favorable for the formation of Hm than the formation of ferromagnetic minerals and organic matter. Previous studies (Ji et al., 2001) have shown that the Luochuan loess in the CLP comprise a low magnetite content and high Hm content during the transition from L2 to S1 (MIS 5e, high-temperature period), followed by a period with a high magnetite content and low Hm content. This reflects an alternation from a dry summer monsoon environment to a warm–humid summer monsoon environment (Ji et al., 2001; Sun et al., 2011), which explains the changes in the Hm and magnetite content in the ZQ section in L1LS1. Hm formation favorably occurs under high temperatures and a limited rainfall with the rapid release of iron under neutral to slightly acidic conditions (Schwertmann, 1985; Schwertmann and Murad, 1983). A short period of highly seasonal precipitation, <350 mm/yr, under high-temperature conditions is sufficient for forming significant quantities of Hm (Maher et al., 1998). The research from Luochuan loess and Lingtai loess also support the fact that climate conditions with large evaporation and low precipitation are conducive to Hm formation (Balsam et al., 2004). Hm formation reaches the maximum when the temperature is high and the period of soil wetting is too short to produce significant magnetite (Balsam et al., 2004). Previous research on topsoil has shown that pedogenic Hm formation is preferentially dependent on MAT (Gao et al., 2018). Contemporary meteorological data shows that the ZQ area (MAP: 420.60 mm, MAT: 13.4°C, MAE: 1972.4 mm) has a semi-arid environment, with low precipitation and high evaporation. This climatic background may have resulted in the response of Hm to temperature changes being greater in the ZQ section than the other areas. The abovementioned discussions show that the Hm content is sensitive to the temperature in the ZQ section.
Previous studies have shown that the Hm and Gt ratio is sensitive to climatic factors (Ji et al., 2004; Jia et al., 2018; Wang et al., 2016). The Hm/(Hm+Gt) ratio is very sensitive to changes in the dry and wet climate (Ji et al., 2001; Wang et al., 2016; Jia et al., 2018). The study results show that the Hm/(Hm+Gt) ratio exhibits relatively good consistency, with changes corresponding to the L* and χlf values, and that a good correlation exists between the changes in precipitation and the Hm/(Hm+Gt) ratio. However, the changes in Gt content and magnetic susceptibility in the ZQ section significantly differ, suggesting that Gt is not simply influenced by variations in precipitation. Furthermore, the difference between Hm and Hm/(Hm+Gt) during the MIS 3 demonstrate the significant contribution of Gt. Hm production is favored by the climatic conditions of high temperatures and low precipitation, while Gt formation is mainly related to low temperatures and high seasonal precipitation (Schwertmann and Taylor, 1989). Therefore, the Gt content could be mainly influenced by a combination of low temperatures and high seasonal precipitation according to Gt variation in the ZQ section. The Hm/(Hm+Gt) ratio is believed to be more susceptible to precipitation in the study area due to the complex response of Gt to the climate and pedogenic environment (Cornell and Schwertmann, 2003; Ji et al., 2004; Wang et al., 2016).
In summary, the L* value of the ZQ loess reflected the organic matter concentration during pedogenesis. The changes in the L* value and Hm/(Hm+Gt) ratio in the ZQ loess mainly reflected the precipitation changes; the L* value was more sensitive to precipitation than the Hm/(Hm+Gt) ratio, with a more significant frequency and amplitude of change (Figure 2(a) and (f)). The a* and Redness% values and Hm content of the ZQ loess primarily indicated that the Hm content was controlled by temperature. Compared to the a* value, the Redness% value and Hm content exhibited more high-frequency and high-amplitude changes with temperature (Figure 2(c) and (d)).
Evolution of the ISM and temperature changes during the MIS 3
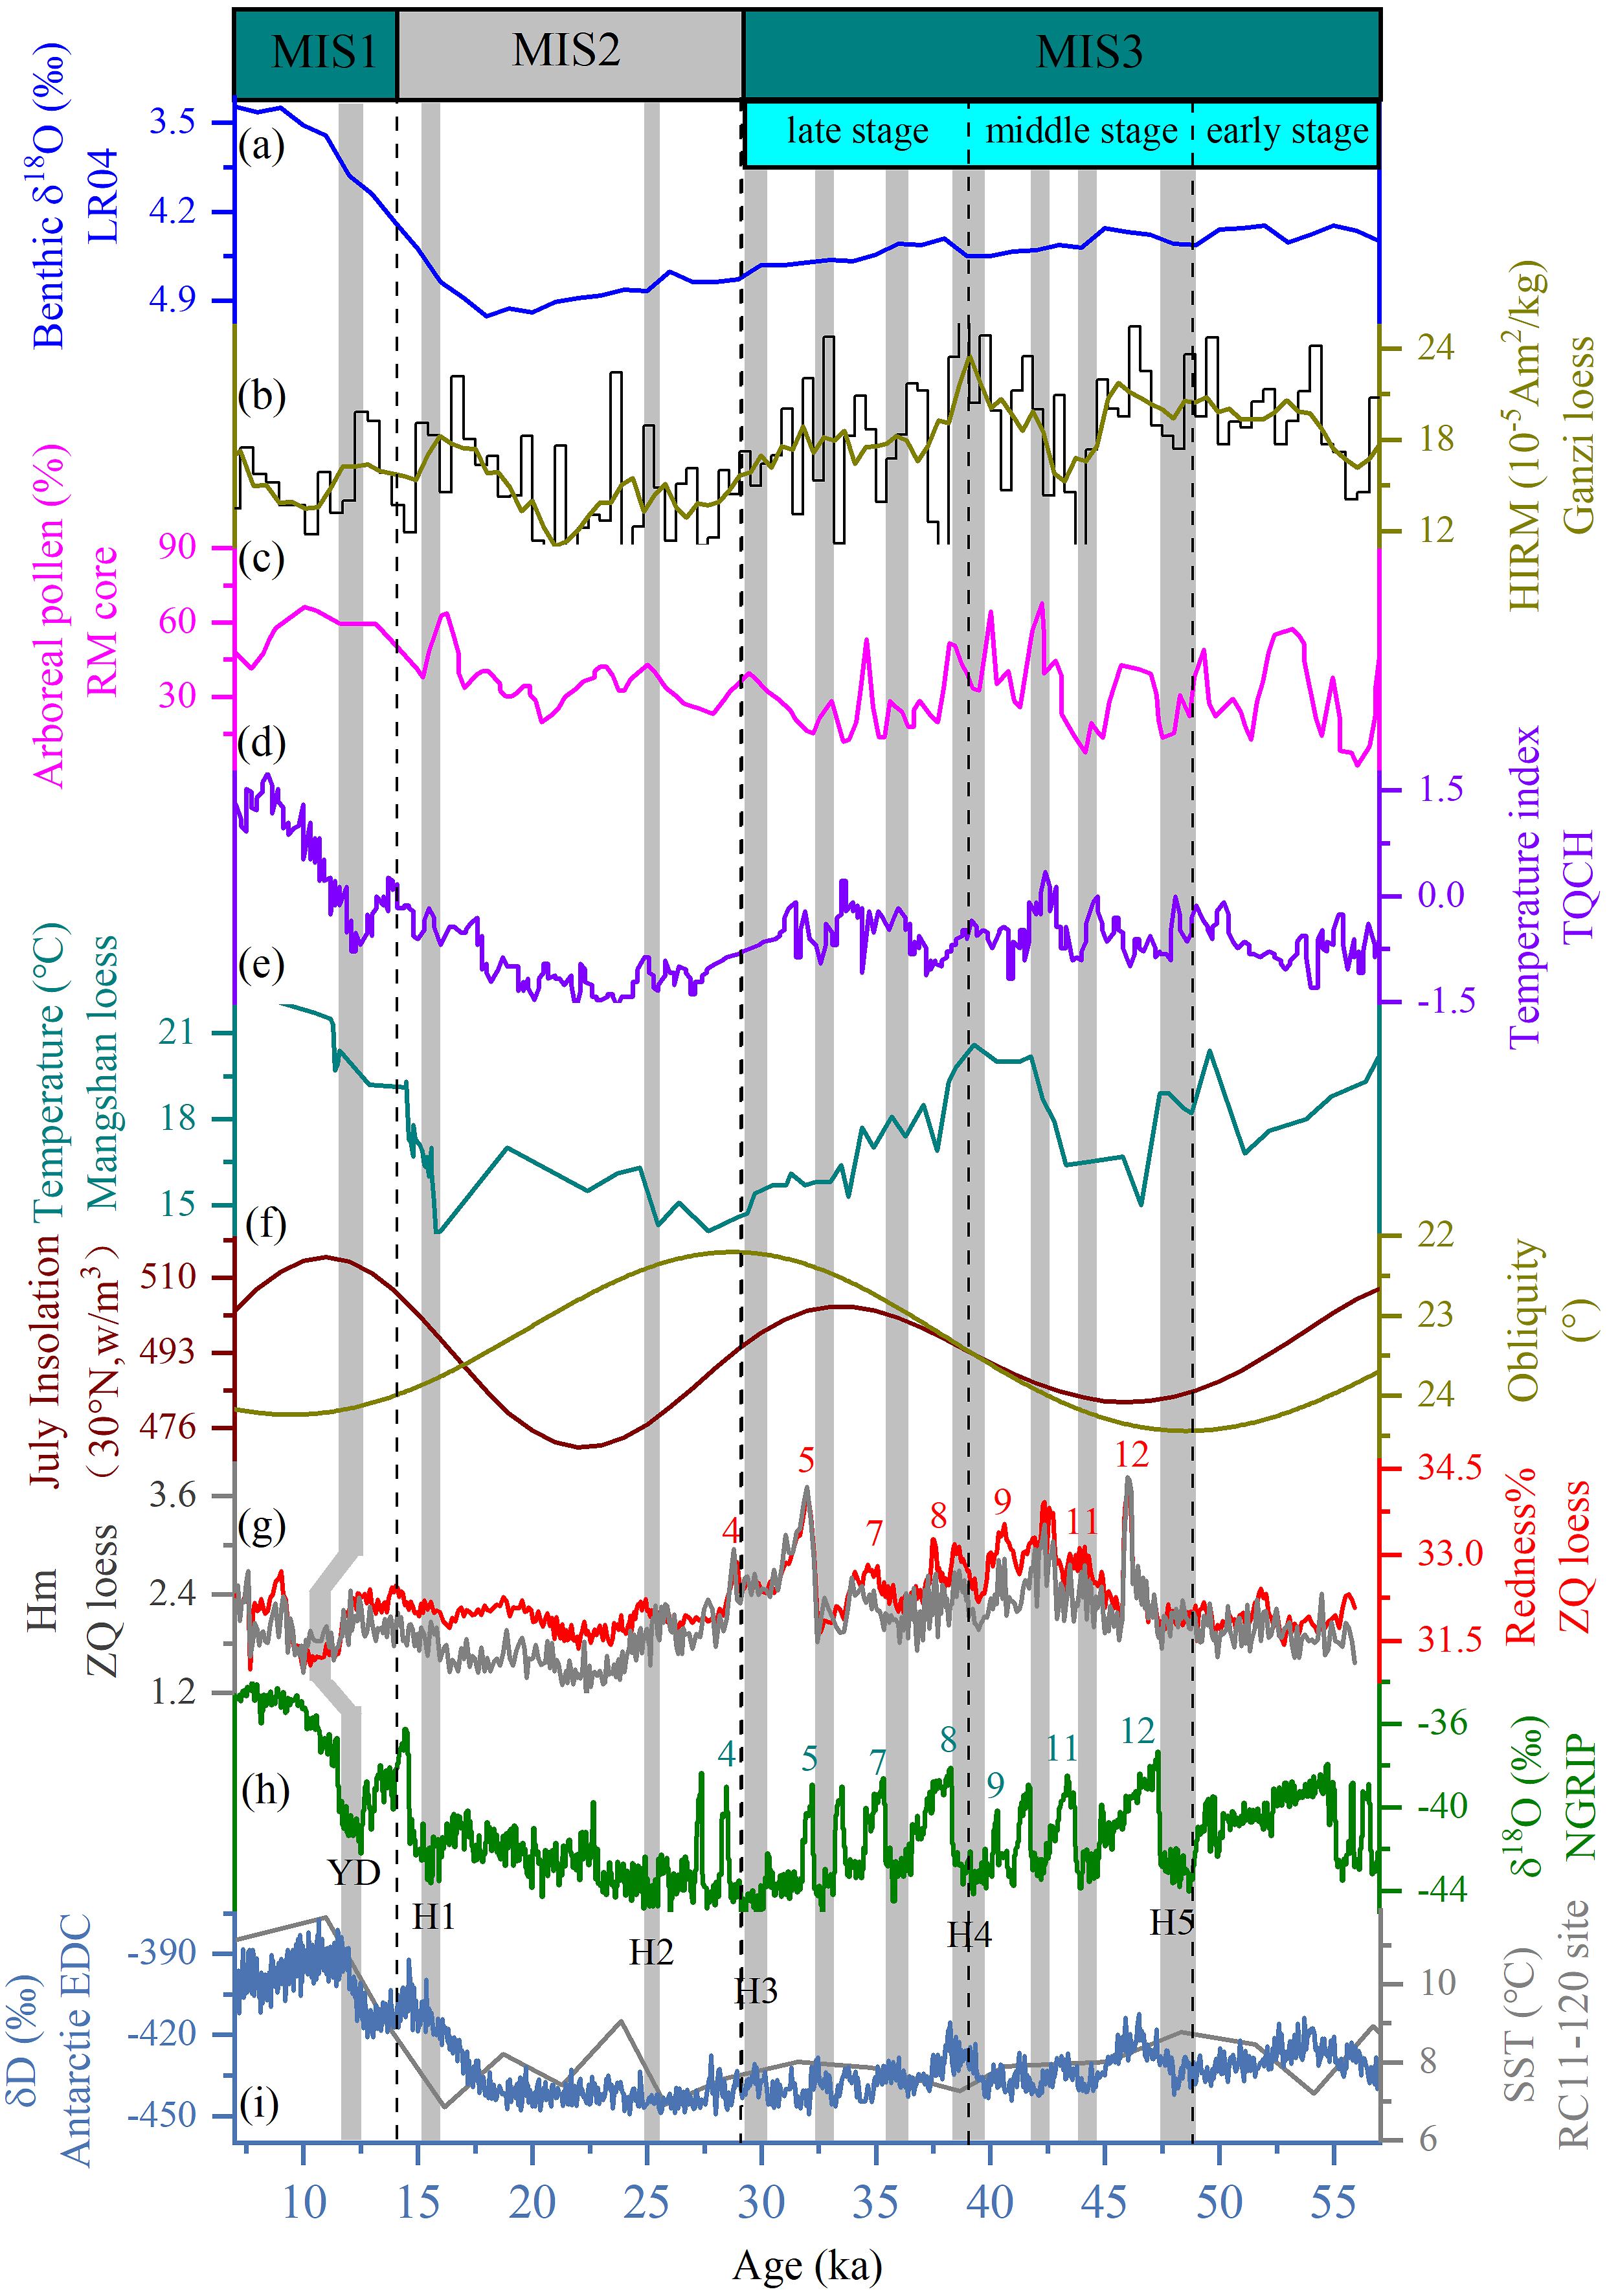
The above described analysis showed that the L* value of the ZQ loess could be used for reconstructing the precipitation and ISM histories, while the a* and Redness% values and Hm content could be used for reconstructing the temperature variation in the WQM. The L* value was used to reconstruct the precipitation and ISM histories (Figure 4). The temperature change in the WQM during the MIS 3 was reconstructed based on the Redness% value and Hm content (Figure 5). Comparison L* of ZQ section to the LR04 benthic δ18O record (Lisiecki and Raymo, 2005) and the atmospheric carbon dioxide records (Bereiter et al., 2015) (a), stalagmite stable δ18O isotope in China (Cheng et al., 2016) (b), stalagmite stable δ18O isotope record in Xiaobailong Cave (Cai et al., 2015) (c), pollen record of sediments in Namco lake, central TP (Wu et al., 2004) (d), annual average precipitation (MAP) reconstructed by magnetic parameters of the Ganzi loess in the ETP (Chen et al., 2022) (e), the July insolation at 30°N in the Northern Hemisphere and Earth’s obliquity (Laskar et al., 2004) (f), NGRIP δ18O record of Greenland Ice (Andersen et al., 2004) (h), EDC δD record of Antarctie (Jouzel et al., 2007) and the mid-latitude southern hemispheric SST (Mashiotta et al., 1999) (i). Comparison Redness%, Hm of ZQ section to the LR04 benthic δ18O record (Lisiecki and Raymo, 2005) (a), high-field isothermal remanence (HIRM) record of Ganzi section (Chen et al., 2022) (b), pollen records of RM core (Shen et al., 2005) (c), temperature index of Tengchong Qinghai (TCQH) core (Zhang et al., 2020b) (d), air temperature record of Mangshan loess (Peterse et al., 2014) (e), the July insolation at 30°N in the Northern Hemisphere and Earth’s obliquity (Laskar et al., 2004) (f), NGRIP δ18O record of Greenland Ice (Andersen et al., 2004) (h), EDC δD record of Antarctie (Jouzel et al., 2007) and the mid-latitude southern hemispheric SST (Mashiotta et al., 1999) (i).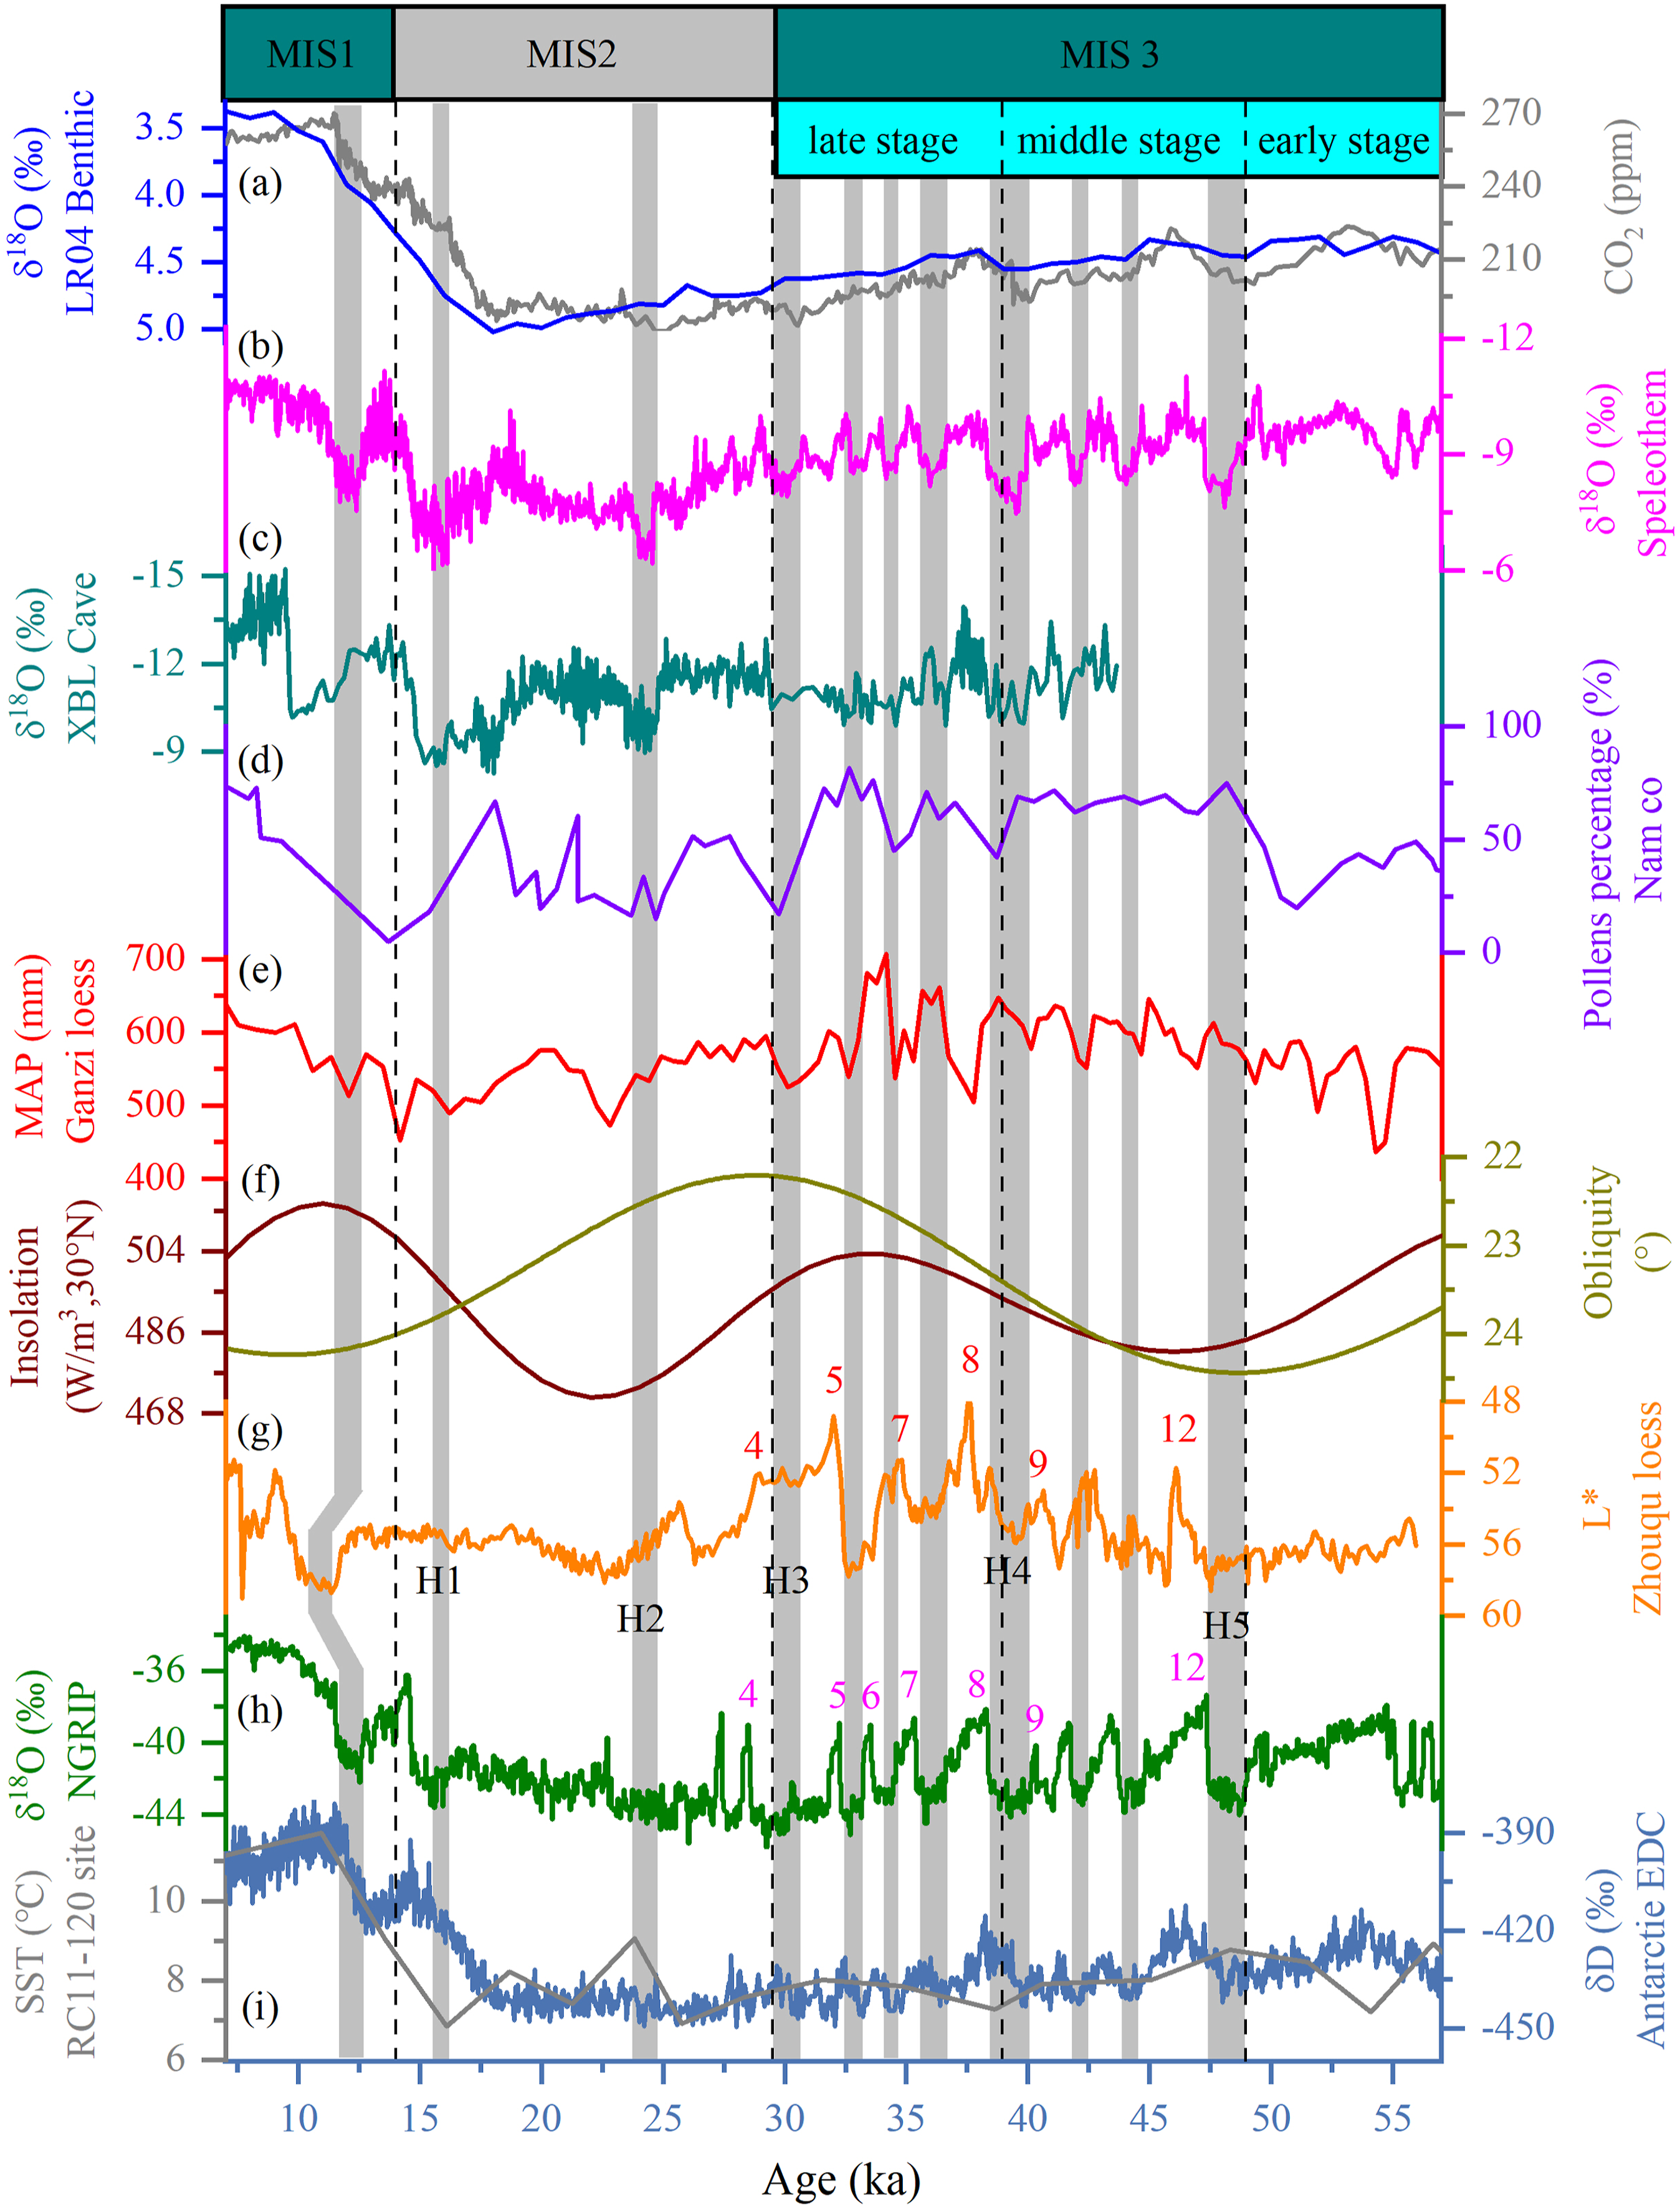
The ISM gradually strengthened from the early to late MIS 3, as revealed by the ZQ loess data, with abundant precipitation in the late MIS 3. During MIS 3 (57–29 ka), the L* value gradually increased, with low precipitation in the early MIS 3 (57–49 ka), moderate precipitation in the middle MIS 3 (49−39 ka), and high precipitation in the late MIS 3 (39–29 ka) (Figure 4(g)). This differs from the composited speleothem δ18O record from eastern China by Cheng et al. (2016) (Figure 4(b)). The high precipitation in the late MIS 3 in the WQM is similar to that reported in previous studies using the Guliya ice core (Shi et al., 1999; Shi and Yao, 2002; Shi and Yu, 2003). The ISM history recorded by stalagmites in the Xiaobailong Cave in southwest China signified relatively high rainfall in the middle to late MIS 3 (Cai et al., 2015) (Figure 4(c)). An investigation of the Namco Lake sediment revealed that the early MIS 3 was relatively dry and the late MIS 3 was warm–humid in the central TP (Wu et al., 2004) (Figure 4(d)). Moreover, the high lake levels recorded by the lake sediments of the TP indicated an abnormally warm–humid climate during the late MIS 3 (Li et al., 2008; Shi et al., 2001; Zheng and Xiang, 1989). Previous studies have also recorded high lake levels for the arid lakes of northwest China in the late MIS 3 (Pachur et al., 1995; Rhodes et al., 1996; Wang et al., 2011; Zhang et al., 2002). Recently, the characteristics of the lake-level elevation and lake-surface expansion in the late MIS 3 in the western regions of China were determined using an integrated analysis of 76 lake-level records in China (Zhang et al., 2019a). According to the Tengchong Qinghai (TCQH) lake sediment record in the southeast TP, the climate during the early and middle MIS 3 was relatively cold and semi-humid and that in the late MIS 3 there was cool–humid (Zhang et al., 2019b). In the mid-MIS 3, the TP and its surrounding areas experienced a significant ice advance, possibly due to the rise in abundant summer monsoon precipitation (Cui et al., 2018; Gillespie and Molnar, 1995; Owen et al., 2002; Phillips et al., 2000; Shi and Yao, 2002). A reconstructed precipitation history from the Ganzi loess showed that precipitation in the MIS 3 was relatively low in the early stage but relatively high in the late stage in the eastern TP (Yang et al., 2022) (Figure 4(e)). A comprehensive comparison and analysis of the geological records of the TP indicated a dry climate in the early MIS 3 and high precipitation in the late MIS 3, which was recorded by the ZQ loess sequence. Additionally, studies of the loess–paleosol sequence in the Hanjiang River Basin (Mao et al., 2017; Pang et al., 2017) and the loess–paleosol sequence in the Sichuan Basin (Han et al., 2010) have shown that the climate in the late MIS 3 was unusually warm and humid. The geological records of the East Asian monsoon region revealed an increase in precipitation and forest cover as well as a rise in and transgression of the sea levels during the MIS 3 (Qiu et al., 2012; Shi et al., 2001; Tang, 1992; Yang et al., 2004). These records verify the humid climate of the MIS 3 recorded by the ZQ loess in the WQM.
The temperature of the MIS 3 in the WQM experienced significant changes at different stages. The Redness% value and Hm content of the ZQ section indicated a mild temperature in the early MIS 3 and a high temperature in the middle and late MIS 3 (Figure 5(g)). The temperature changes reflected by the Redness% value and Hm content of the ZQ section were basically consistent with the temperature changes of the MIS 3 based on the pollen record of the TCQH sediment and the RM core (Shen et al., 2005; Zhang et al., 2020b) (Figure 5(c) and (d)). The temperature reconstructed by the Mangshan loess (Peterse et al., 2014) also revealed a relatively high temperature in the middle MIS 3 (Figure 5(e)). The temperature change recorded by the high field isothermal remanence in the Ganzi loess in the eastern TP also indicated a relatively high temperature in the middle and late MIS 3 (Chen et al., 2022) (Figure 5(b)). These results support the climate characteristics of the MIS 3 recorded by the ZQ section.
The climate of the WQM in the late MIS 3 was relatively warm–humid. Compared to the MIS 2 (29–14 ka), the climate of the middle and late MIS 3 was warm and wet. The L* and Redness% values and Hm content showed a significant decrease and weak fluctuation during the MIS 2 (Figures 4 and 5), indicating a weakened ISM with a dry–cold climate during the MIS 2. The early climate of MIS 3 in the WQM recorded by the ZQ loess was relatively cold–dry, similar to MIS 2. During the Holocene, the reduced L* value signified increased precipitation and pedogenesis caused by the enhanced ISM (Figures 4 and 5), and the late MIS 3 precipitation level was similar to that of the Holocene. The reconstructed precipitation of the Ganzi loess in the MIS 1 was close to that in the late MIS 3 (Yang et al., 2022). The pollen record from the RM core suggested that the climate of the late MIS 3 was relatively warm–humid (Shen et al., 2005). The degree of warm–humid conditions in the late MIS 3 recorded by the loess–paleosol sequence in the Sichuan Basin was higher than that of the MIS 1 and similar to that of the MIS 5, but the S0 soil could have been disturbed by agricultural activities (Han et al., 2010). Climate change revealed by the ZQ section during the MIS 3 is largely consistent with the records of the TP and its surrounding areas; however, the relatively warm–wet climate in the MIS 3 recorded by the ZQ loess significantly differs from that of the CLP loess records (Guo et al., 2009; Kang et al., 2011) and European loess records (Antoine et al., 2009; Rousseau et al., 2007; Schirmer, 2000; Zeeden et al., 2018). The European region and the CLP had a relatively dry–cold climate during the MIS 3, reflecting the synchronous cooling in middle- and high-latitude areas with an increased global ice volume (Antoine et al., 2009; Guo et al., 2009; Kang et al., 2011; Rousseau et al., 2007; Zeeden et al., 2018). The differences in the climate evolution during the MIS 3 between the TP and European regions and the CLP region may be attributed to the control exerted by the different regional climate systems.
Furthermore, the ZQ loess revealed the millennial-scale changes during the MIS 3. Previous studies have shown that the climate in the MIS 3 was characterized by high instability and rapid fluctuations (Andersen et al., 2004; Bond et al., 1993; Cheng et al., 2016; Dansgaard et al., 1993; Heinrich, 1988; Sun et al., 2021). Moreover, significant worldwide differences existed in climate change amplitude during the MIS 3 (Han et al., 2010; Wetterich et al., 2014; Yu et al., 2007). The frequency and amplitude of the L*and Redness% values and Hm content recorded by the ZQ loess from the middle to late MIS 3 were very high (Figures 4 and 5), indicating that the climate rapidly fluctuated and exhibited unstable characteristics. A comparative study was performed between the L* and Redness% values and Hm content of the ZQ loess with the North Greenland Ice Core Project (NGRIP) oxygen isotope record (Andersen et al., 2004). The precipitation and temperature changes denoted by the ZQ loess were comparable with those denoted by the Heinrich and Dansgarrd–Oeschger (D–O) events (Bond et al., 1993; Dansgaard et al., 1993; Heinrich, 1988) in the NGRIP record (Figures 4 and 5). The rapid decrease in precipitation and temperature during the MIS 3 at ∼29, ∼39.5, and ∼47.5 ka well correspond to the H3, H4, and H5 Heinrich layers, respectively. Additionally, a series of rapid increases in precipitation and temperature coincided with the D–O events (Figures 4 and 5). This indicates that the WQM loess also recorded millennial-scale changes in the North Atlantic, which is consistent with the records from the TP and its surrounding areas (Feng et al., 2022; Lv et al., 2004; Zhao et al., 2020).
In summary, the results showed that the changes in the ISM dominated the precipitation history in the eastern TP. The early MIS 3 had low precipitation and temperature, and the mid-MIS 3 had high temperature and moderate precipitation, with a relatively warm–dry summer monsoon environment (Ji et al., 2001; Sun et al., 2011). A peak in precipitation occurred in the late MIS 3, with the relatively high temperature resulting in a warm–humid environment. The climate in the WQM comprised three stages from the early to late MIS3: cold–dry, warm–dry, and warm–humid. The ZQ loess clearly revealed that millennial-scale oscillations were present in the precipitation and temperature of the MIS 3.
Factors controlling climate change during the MIS 3
The changes in the ISM and temperature in the WQM were mainly driven by the combined effects of obliquity and precession. According the EEMD results and L* spectrum, the C7 component contributed 25.83% to the total variance (Figure 6(g)), and its power spectrum reflected the ∼40 ka cycle. This indicates that the obliquity cycle significantly impacted the ISM and precipitation changes. Additionally, the C5 component accounted for 20.24% of the total variance, and the power spectrum displayed a half-precession cycle (∼11.5 ka), precession (∼20 ka), and an ∼8.3 ka cycle. The ∼8.3 ka cycle could be related to the half-precession cycle (Becker, 2005; Berger and Loutre, 1997; Jian et al., 2020; Nascimento et al., 2021; Ulfers et al., 2022). Many records have demonstrated that the occurrence of half-precession is an important feature in tropical regions in terms of the amplification response of interhemispheric low-latitude insolation (Beaufort et al., 2003; Berger and Loutre, 1997; Ferretti et al., 2015; Jian et al., 2022). These results suggested that the ISM was controlled by obliquity and precession. This was also supported by the comparison of the L* values with the obliquity and precession changes (Figure 4(f) and (g)). However, the obliquity signals were stronger than the precession signals in the precipitation recorded by the ZQ loess. This is similar to the records of Asian summer monsoon precipitation (Clemens et al., 2021; Yang et al., 2022). However, it is different from the dominant ∼19–23 ka cycles recorded by the stalagmite δ18O in the Asian summer monsoon region (Cheng et al., 2016, 2021; Wang, et al., 2008), which may have stemmed from the sensitivity of different carriers and indicators (Cheng et al., 2021; Sun et al., 2021). EEMD component of L*, Hm and corresponding power spectrum in the ZQ section. The blue and red dashed lines indicate 80% and 90% levels of significance, respectively.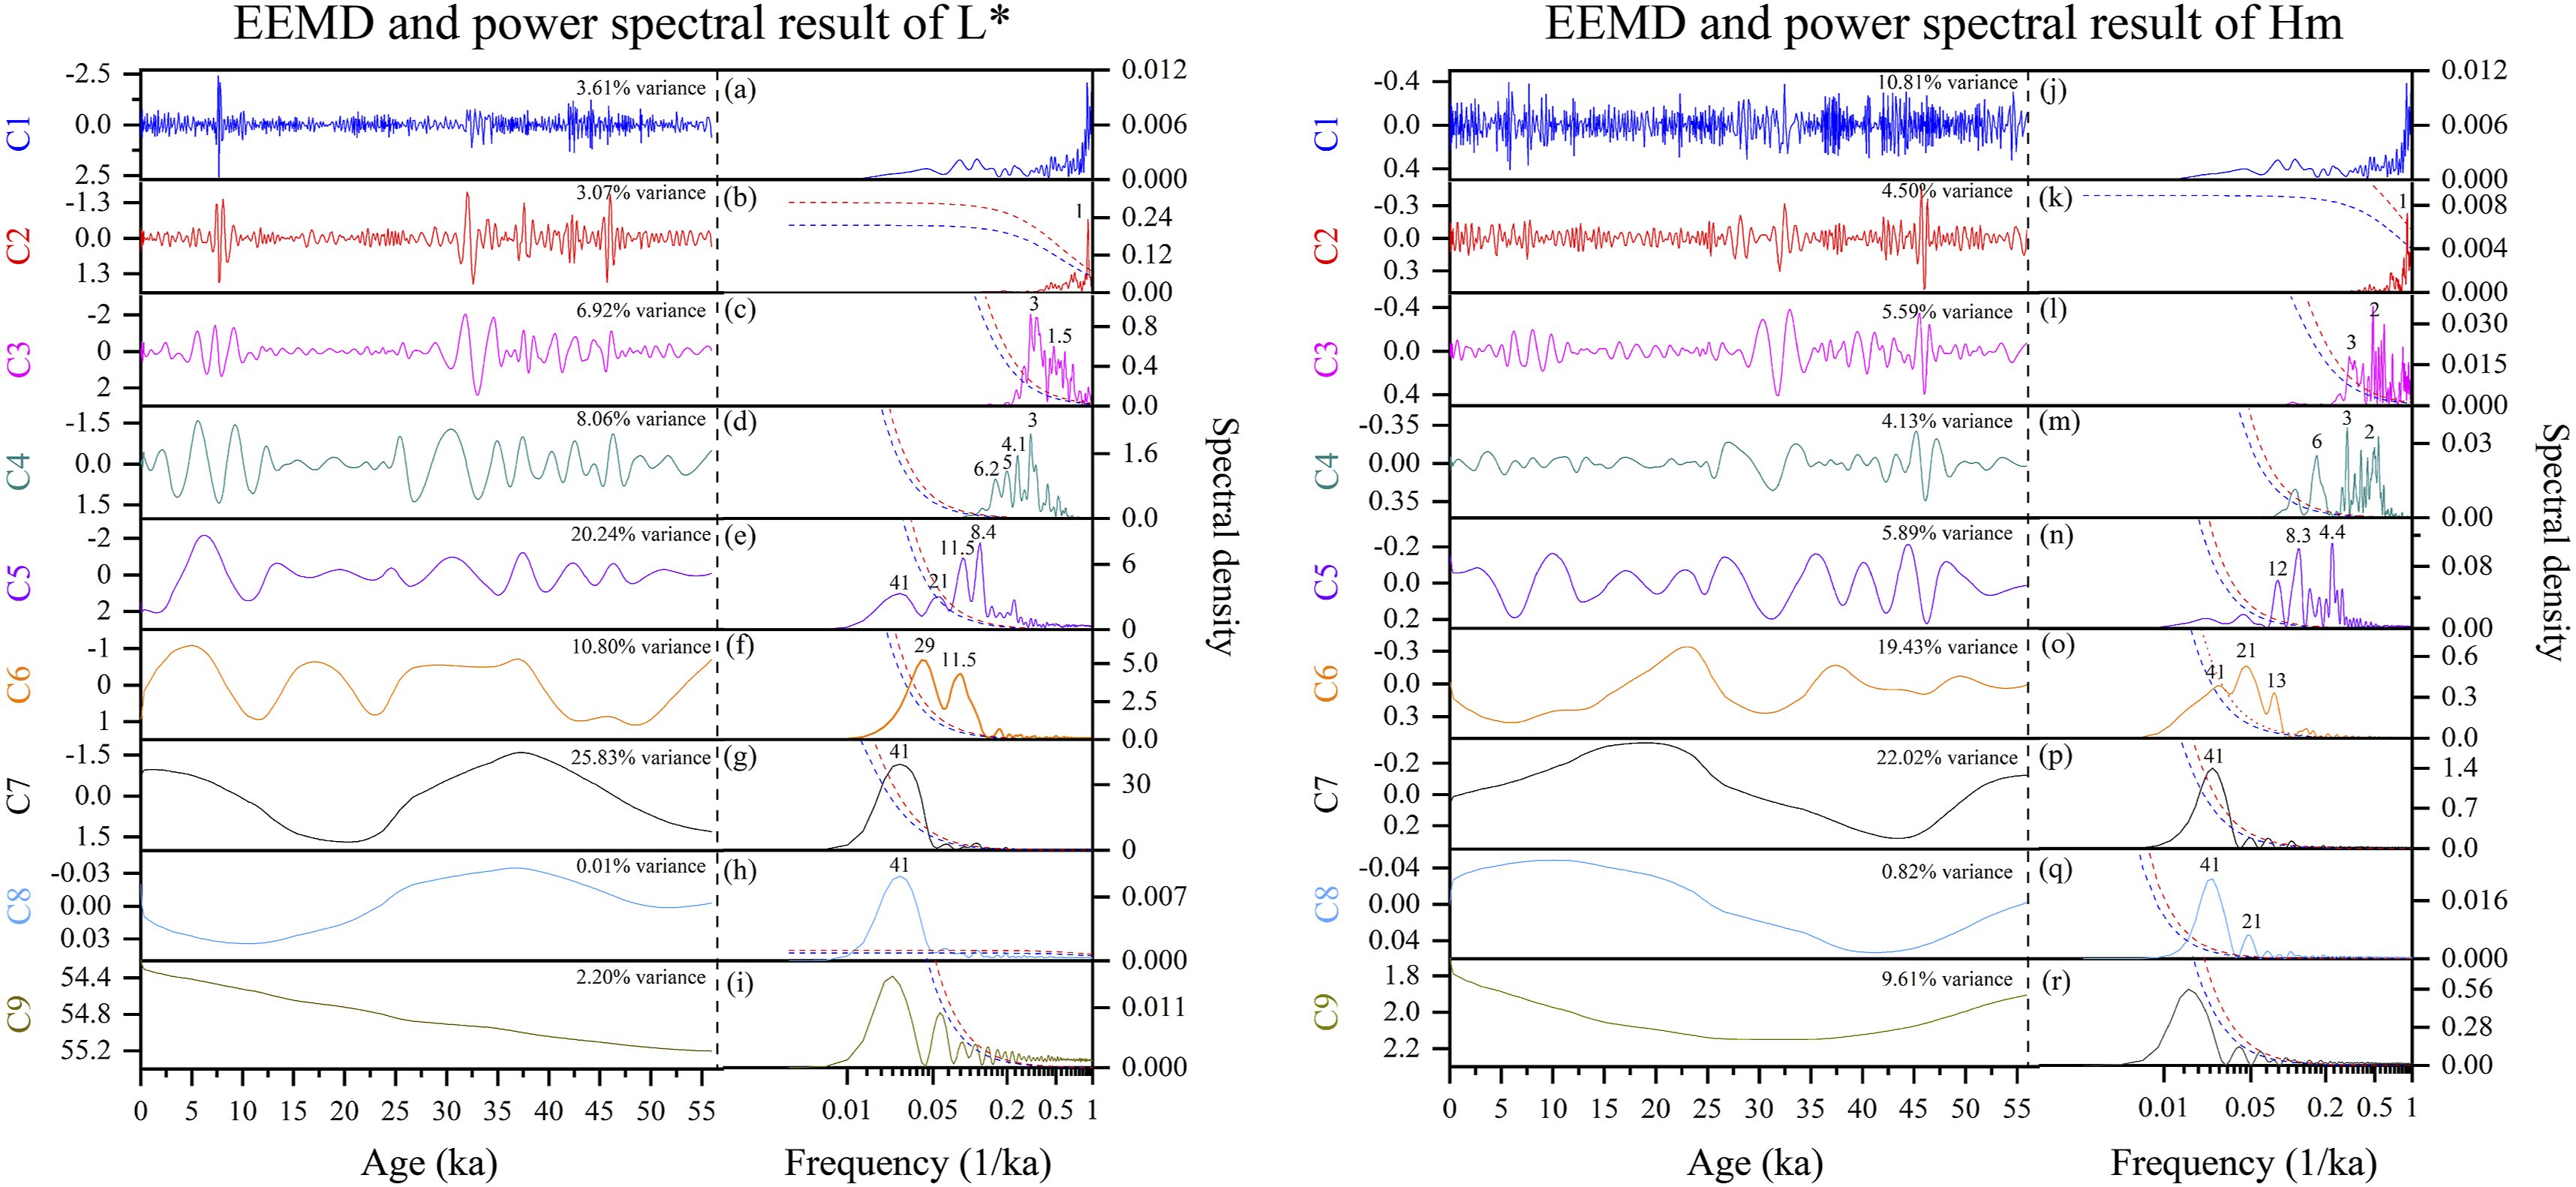
The EEMD results and corresponding power spectrum also showed that the temperature was affected by obliquity and precession (Figure 6(p) and (o)). The C7 component (Figure 6(p); 22.02% variance contribution) primarily reflected an obliquity cycle (∼41 ka). Figure 5(e) and (g) shows that the recorded temperature is highly consistent with the obliquity changes during the glacial stage. A recent study on the TCQH sediment stated that warm periods were probably dependent on the local annual mean insolation, controlled by Earth’s ∼41 ka obliquity cycles (Zhao et al., 2021). Obliquity may have influenced the temperature change in the WQM via changes in the local annual average insolation during the glacier stage. However, the C6 component (Figure 6(o); 19.43% variance contribution) had a strong precession cycle (∼21 ka). These findings confirm that the temperature in the WQM was influenced by insolation changes that were regulated by the obliquity and precession.
The correlation period of the millennium-scale oscillation of the North Atlantic was recorded by the ZQ loess. The power spectrum results showed that the C3 and C4 components of L* (Figure 6(c) and (d); 14.98% variance contribution) and Hm (Figure 6(l) and m; 9.72% variance contribution) support the existence of millennium-scale events. The cycles from the C3 and C4 components could be divided into two main groups: ∼7–4 ka (such as 7.5, 5.7, and 4.1 ka) and ∼3–1 ka (such as 3 and 1.5 ka) from the power spectrum. These results may correspond to the Heinrich (∼6 ka) and D–O (∼1.5 ka) cycles recorded in the North Atlantic sediments and Greenland ice core (Bond et al., 1993; Dansgaard et al., 1993; Heinrich, 1988), which correspond to the CLP loess and speleothem records (Li et al., 2015; Sun et al., 2021). The driving force of cold events on the millennial scale was associated with the weakening of the Atlantic meridional overturning circulation (AMOC), which was caused by an abrupt freshwater outflow into the North Atlantic from the Laurentide Ice Sheet (Carlson et al., 2007; McManus et al., 2004). Cold events on a millennial scale have also been recorded in the Indian Ocean sediments (Liu et al., 2021b; Mohtadi et al., 2014; Rashid et al., 2011). Furthermore, the cooling of the North Atlantic weakens the ISM by pushing the thermal equator (ITCZ) southwards through an atmospheric tele-connection and the AMOC (Arbuszewski et al., 2013; Liu et al., 2021b; Mohtadi et al., 2014; Panmei et al., 2017; Wen et al., 2016). The North Atlantic climate signal may be transmitted to East Asia through the westerlies (Song et al., 2018). A recent study suggested that the cooling of the North Atlantic led to the downstream cooling of the atmosphere by the westerly jets, which subsequently influenced the climate in the Qaidam Basin (Meng and Liu, 2018). These results suggest that cold events on a millennial scale in the WQM could have been driven by the North Atlantic cooling through the southward movement of the ITCZ and the downstream cooling of the atmosphere by the westerlies.
The results confirm that the warm–humid climate in the late MIS 3 was similar to that of the interglacial period. This could be related to the integrated response of the ISM changes due to the Earth’s orbital parameters and internal climate forcing (Clemens et al., 1991, 2021; Clemens and Prell, 2003; Kim and Wang, 2011; McGrath et al., 2021). The ISM index from the Heqing core in the southeast TP revealed that cooling in the high latitudes in the Southern Hemisphere (SH) increased the cross-equatorial pressure gradient and the ISM, which was manifested as the enhancement of the ISM with decreasing Antarctic temperatures and increasing ice volume after reaching a particular stage of the glacial period (An et al., 2011). A comparison of the LR04 Benthic δ18O record and atmospheric carbon dioxide (CO2) record with the L* values of the ZQ loess (Figure 4(a) and (g)) revealed that the ISM gradually increased with increasing global ice volume and decreasing atmospheric CO2 concentration during the MIS 3. A comparison of the Antarctic EPICA Dome C (EDC) δD record and the mid-latitude southern hemispheric sea surface temperature (SST) with the L* values of the ZQ loess also revealed that the ISM gradually increased with increasing Antarctic ice volume (Figure 4(i); blue) and decreasing SH SST (Figure 4(i); gray) during the MIS 3. This is similar to the findings of An et al. (2011). Additionally, the power spectrum of L* in the C6 component (Figure 6(f)) showed a ∼29 ka cycle. The ∼29 ka cycle was also present in the drill records of the Heqing Basin, where it was considered to arise from the combined influence of the Northern Hemisphere (NH) ice volume and SH temperature change (An et al., 2011). The interhemispheric forcing played an important role in driving the ISM enhancement during the MIS 3 in the WQM region. Hence, from the early to late MIS 3, the enhancement of the Mascarene high in the SH could have been caused by the decrease in the atmospheric CO2 concentration and temperature in the SH as well as the increase in the ice volume of the Antarctic, resulting in a synchronous enhancement of the cross-equatorial pressure gradient and the ISM. Furthermore, the high insolation in the middle and late MIS 3 promoted the strengthening of the Indian low and ocean evaporation remained relatively strong. Subsequently, more warm–humid water vapor was transported to the land in South Asia, further strengthening the ISM and leading to the warm–humid climate in the late MIS 3.
In summary, the ISM and temperature in the WQM were driven by Earth’s obliquity and precession. The changes in the ISM and temperature exhibited millennial-scale climate variability during the MIS 3 in the WQM, indicating a profound impact of the high-latitude climate system of the NH. The warm–humid climate in the late MIS 3 may have jointly stemmed from obliquity, precession, and interhemispheric forcing.
Conclusion
This study analyzed the color index and DRS-derived iron oxides of the ZQ loess sequence in the eastern margin of the TP and their paleoenvironmental significance. The following conclusions were reached. 1. The soil color and iron oxide variations of the ZQ loess revealed that climate change in the MIS 3 was characterized by high frequency and large amplitude of variations as well as millennial-scale changes superimposed on orbital-scale changes in the eastern TP. The early climate of MIS 3 was relatively cold–dry, similar to the glacial time. From the early to late MIS 3, the climate in the eastern margin of the TP experienced three stages: cold–dry, warm–dry, and warm–humid. 2. The change in the ISM and temperature in the WQM was dominantly influenced by obliquity and precession. The millennial-scale changes of precipitation and temperature were mainly affected by the high-latitude climate system of the NH, the southward movement of the ITCZ, and the downstream cooling of the atmosphere by the westerlies driven by the North Atlantic cooling. The joint influence of obliquity, precession, and interhemispheric forcing may have resulted in a warm–humid climate in the late MIS 3.
Supplemental Material
Supplemental Material - High-resolution climate change during the Marine Isotope Stage 3 revealed by Zhouqu loess in the eastern margin of the Tibetan Plateau
Supplemental Material for High-resolution climate change during the MIS 3 revealed by Zhouqu loess in the eastern margin of the Tibetan Plateau by Zixuan Chen, Qiong Li, Pushuang Li, Jiantao Zhou, Yating Su, Weiming Liu, Yuanlong Luo, Chen Wen, Xuechao Xu and Shengli Yang in Progress in Physical Geography: Earth and Environment
Footnotes
Declaration of conflicting interests
The author(s) declared no potential conflicts of interest with respect to the research, authorship, and/or publication of this article.
Funding
The author(s) disclosed receipt of the following financial support for the research, authorship, and/or publication of this article: This work was supported by the Second Tibetan Plateau Scientific Expedition and Research Program (STEP) (2019QZKK0602); National Natural Science Foundation of China (42271159, 41877447), and Strategic Priority Research Program of the Chinese Academy of Sciences (XDA20090000).
Supplemental Material
Supplemental material for this article is available online.
References
Supplementary Material
Please find the following supplemental material available below.
For Open Access articles published under a Creative Commons License, all supplemental material carries the same license as the article it is associated with.
For non-Open Access articles published, all supplemental material carries a non-exclusive license, and permission requests for re-use of supplemental material or any part of supplemental material shall be sent directly to the copyright owner as specified in the copyright notice associated with the article.