
Abstract
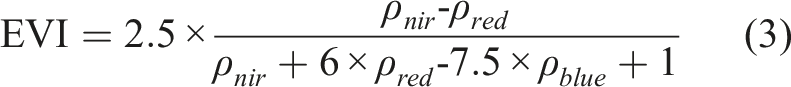
Wetlands in the Yellow River Basin face the composite pressures of climate change and human disturbances. However, analyzes of the major riverine wetlands remain far less than those of the headwater and estuarine regions in the Yellow River Basin. Based on the Google Earth Engine platform, we combined a sample migration strategy and Random Forest classification to produce an annual 30 m riverine wetland dataset (1986–2022) for the Yellow River Basin (excluding the headwater and estuarine regions). We then analyzed the spatiotemporal change and driving factors of water bodies, mudflats, and marshes. Results show that long-term wetland maps exhibit high reliability, with overall accuracy above 90%, and an average Kappa coefficient exceeding 0.88. The expansion of water bodies and mudflats failed to offset marsh degradation, leading to a net riverine wetland loss of 1326.30 km2, with the total wetland area in 2022 decreasing to 95% of its 1986 level. Increasing temperature and runoff at the Lanzhou station are associated with marsh core loss and fragmentation, accompanied by partial conversion to water bodies and mudflats, thereby threatening wetland biodiversity and carbon sequestration capacity. Water body expansion and increased connectivity are primarily associated with runoff at the Lanzhou station, average temperature, and precipitation. Landscape change of mudflats in the midstream and downstream is associated with average temperature, sediment discharge at the Huayuankou station, runoff at the Toudaoguai station, and regional human activities. This study provides critical data support and spatiotemporal evidence for riverine wetland conservation and restoration in the Yellow River Basin.
Introduction
Wetlands are among the most critical ecosystems on Earth. Despite occupying only 2.6% of the terrestrial surface, wetlands account for more than 20% of global organic carbon storage and provide indispensable ecological functions, including flood regulation, water purification, and biodiversity conservation (Bao et al., 2023; Bar-On et al., 2018; Osland et al., 2022). However, wetlands are highly sensitive and vulnerable to environmental changes. Under escalating climate change and intensifying human disturbance, wetlands face growing risks of degradation and loss driven by hydrological extremes, sediment accumulation, and agricultural and pastoral expansion (Sandi et al., 2020; Schuerch et al., 2018), which directly or indirectly constrain progress toward 75 Sustainable Development Goal targets (Wetlands, 2021). Although a series of conservation and restoration efforts have been undertaken, including the Everglades restoration, mangrove rehabilitation in Indonesia, and large-scale wetland restoration programs in China (Liu et al., 2024; Schneider et al., 2024; Suhardi et al., 2024), global wetlands have continued to decrease since 2000, particularly in China, Europe, and the United States (Ai et al., 2023; Fluet-Chouinard et al., 2023). Considering the large geographical differences among the world’s big rivers, there is a clear practical requirement to map the spatiotemporal changes of wetland area and landscape patterns, and to identify their regional dominant driving factors based on the specific geographic condition of the target river.
Accurately identifying the wetland types and spatial locations is fundamental to dynamic wetland monitoring. However, spectral similarity between wetland and terrestrial vegetation, as well as among wetland subtypes, substantially complicates accurate classification (Adam et al., 2010; Taddeo et al., 2019). Meanwhile, regional heterogeneity driven by topography and hydrology constrains the spatial transferability of sample points and classification models (Wijesingha et al., 2024). Although various optimization strategies have been proposed, including multi-temporal classification models incorporating vegetation phenology (Sun et al., 2023), zonal mapping approaches (Mao et al., 2020), and automated sample extraction based on multi-source data (Wang et al., 2023), long-term annual wetland mapping remains constrained by the limited availability of sufficient and reliable historical training samples. Recent advances have used the Google Earth Engine (GEE) to automate training sample migration across time, under the assumption that spectrally similar pixels represent unchanged land cover (Fekri et al., 2021; Huang et al., 2020). However, thresholds derived solely for optimal classification accuracy do not guarantee temporal consistency of land-cover types, leading to decreased robustness when applied over extended time periods. Therefore, developing sample migration strategies tailored to the unique ecological characteristics and spatiotemporal heterogeneity of different wetland types remains particularly important for long-term mapping.
The Yellow River Basin encompasses 3.91 million hectares of wetlands, which play a vital role in maintaining the regional water supply, supporting human livelihoods, and conserving rare and endangered species (Yun et al., 2022). Nevertheless, the Yellow River Basin is located in a high human pressure area, where wetland degradation is widespread, and exhibits pronounced spatial heterogeneity (Wang et al., 2025). In the headwater region, the Ruoergai wetlands experienced severe degradation, with 38.9% of the wetland area degraded by the late twentieth century (Gao et al., 2016), primarily driven by grazing activities, warm-season temperature, and annual precipitation variability (Mao et al., 2022). In the estuarine region, wetland dynamics are primarily driven by human activities, including reclamation projects, agricultural expansion, and urbanization, which intensify landscape fragmentation and disrupt hydrological connectivity (Zhang et al., 2015). However, compared with the extensive attention given to the headwater and estuarine regions (Bai et al., 2013; Xiao et al., 2010; Zhang et al., 2021), the major riverine wetlands of the Yellow River basin (excluding the headwater and estuarine regions) remain insufficiently studied. In addition, the lack of long-term and consistent wetland datasets hinders a comprehensive understanding of the relative contributions of hydraulic engineering, climate variability, and human activities to the major riverine wetland landscape change in the Yellow River Basin.
To reveal the spatiotemporal change and dominant drivers of riverine wetland of the Yellow River Basin, we conducted the following analyses: (1) Constructed a 30 m resolution riverine wetland classification dataset for the Yellow River Basin from 1986 to 2022; (2) Analyzed the spatiotemporal change in the areas and landscape patterns for three riverine wetland types, including water bodies, mudflats, and marshes; (3) Quantitatively assessed the relative contributions of natural and anthropogenic drivers to changes in wetland area and landscape patterns. Collectively, these analyses provide spatiotemporal evidence to support riverine wetland landscape conservation and adaptive management strategies in the Yellow River Basin.
Materials and methods
Study area
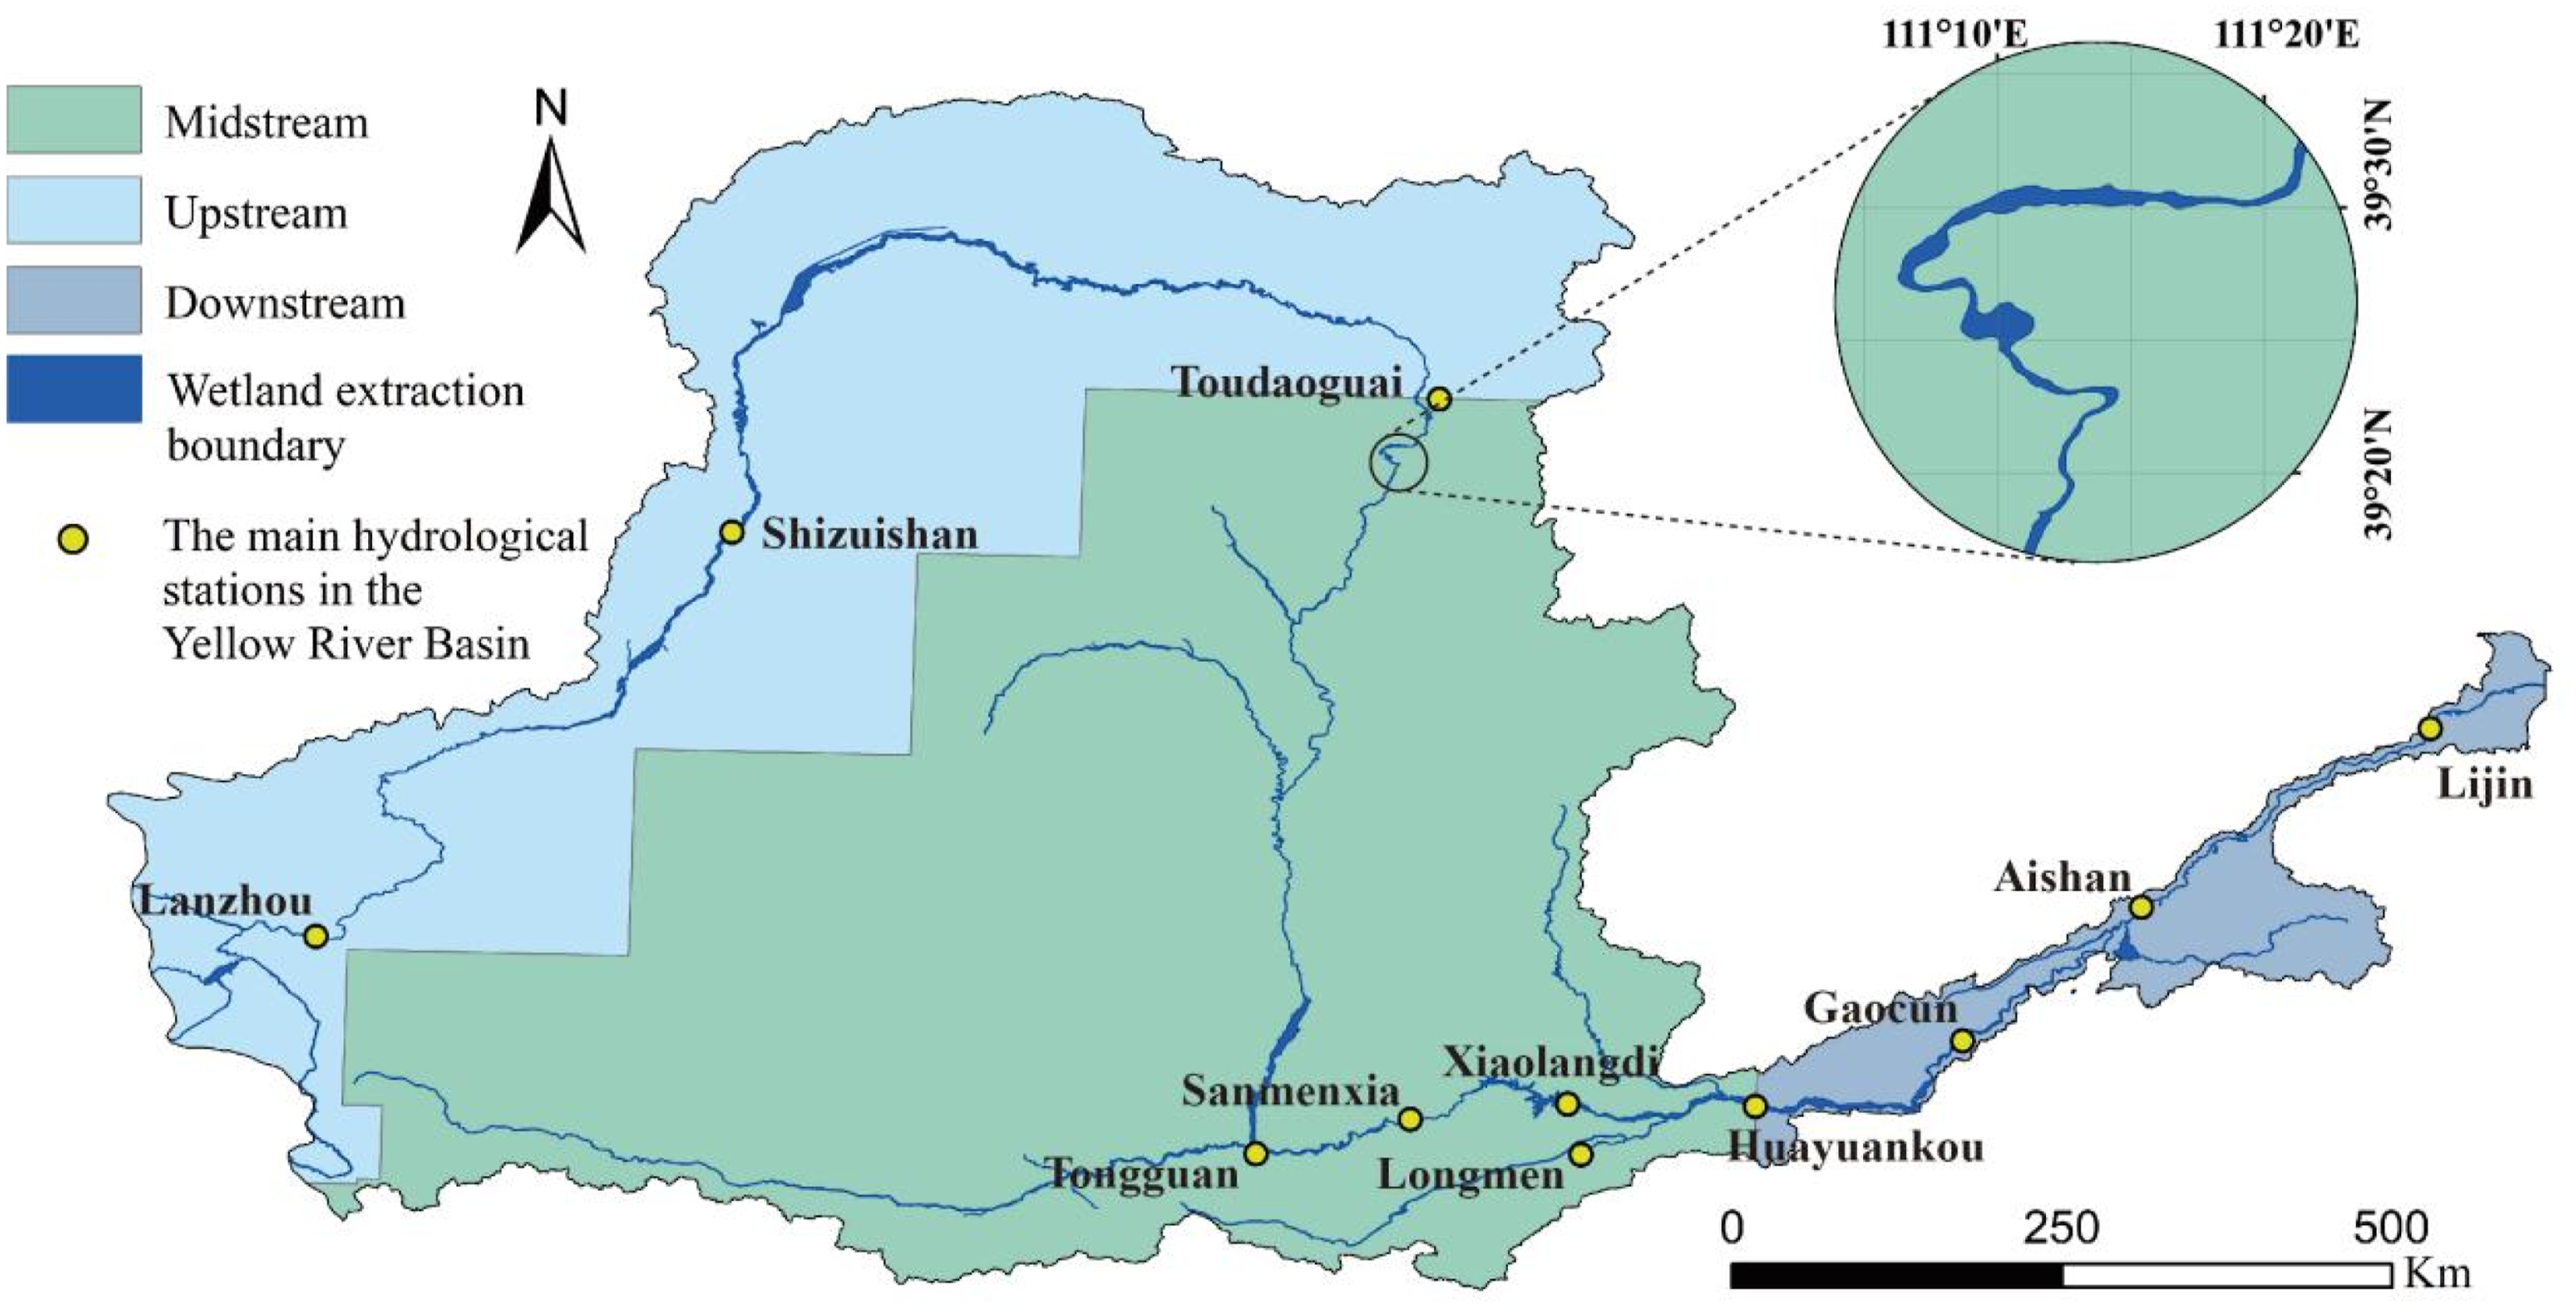
We focused on the riverine wetlands of the Yellow River Basin, excluding alpine peatlands in the headwater region and delta wetlands in the estuarine region, since the wetland types in the headwater and estuarine regions differ and have already been mapped. The study area spans from 102°42′ to 119°09′ E and from 31°20′ to 40°48′ N (Figure 1(a)), covering elevations from −8 to 3805 m, with an average annual temperature of 9°C and annual precipitation ranging from 300 to 600 mm. Based on the locations of the Toudaoguai and Huayuankou hydrological stations, the study area was subdivided into the upper, middle, and lower reaches of the Yellow River Basin (Figure 2). Situation of the study area. (a) Location and elevation of study area; (b) Number of remote sensing image pixels and images distribution in the Yellow River Basin (excluding the headwater and estuarine regions). Maximum boundaries for riverine wetland extraction in the Yellow River Basin (excluding the headwater and estuarine regions). The boundaries were used only to separate riverine wetland sections associated with different hydrological stations and do not represent formal hydrological or administrative boundaries of the basin.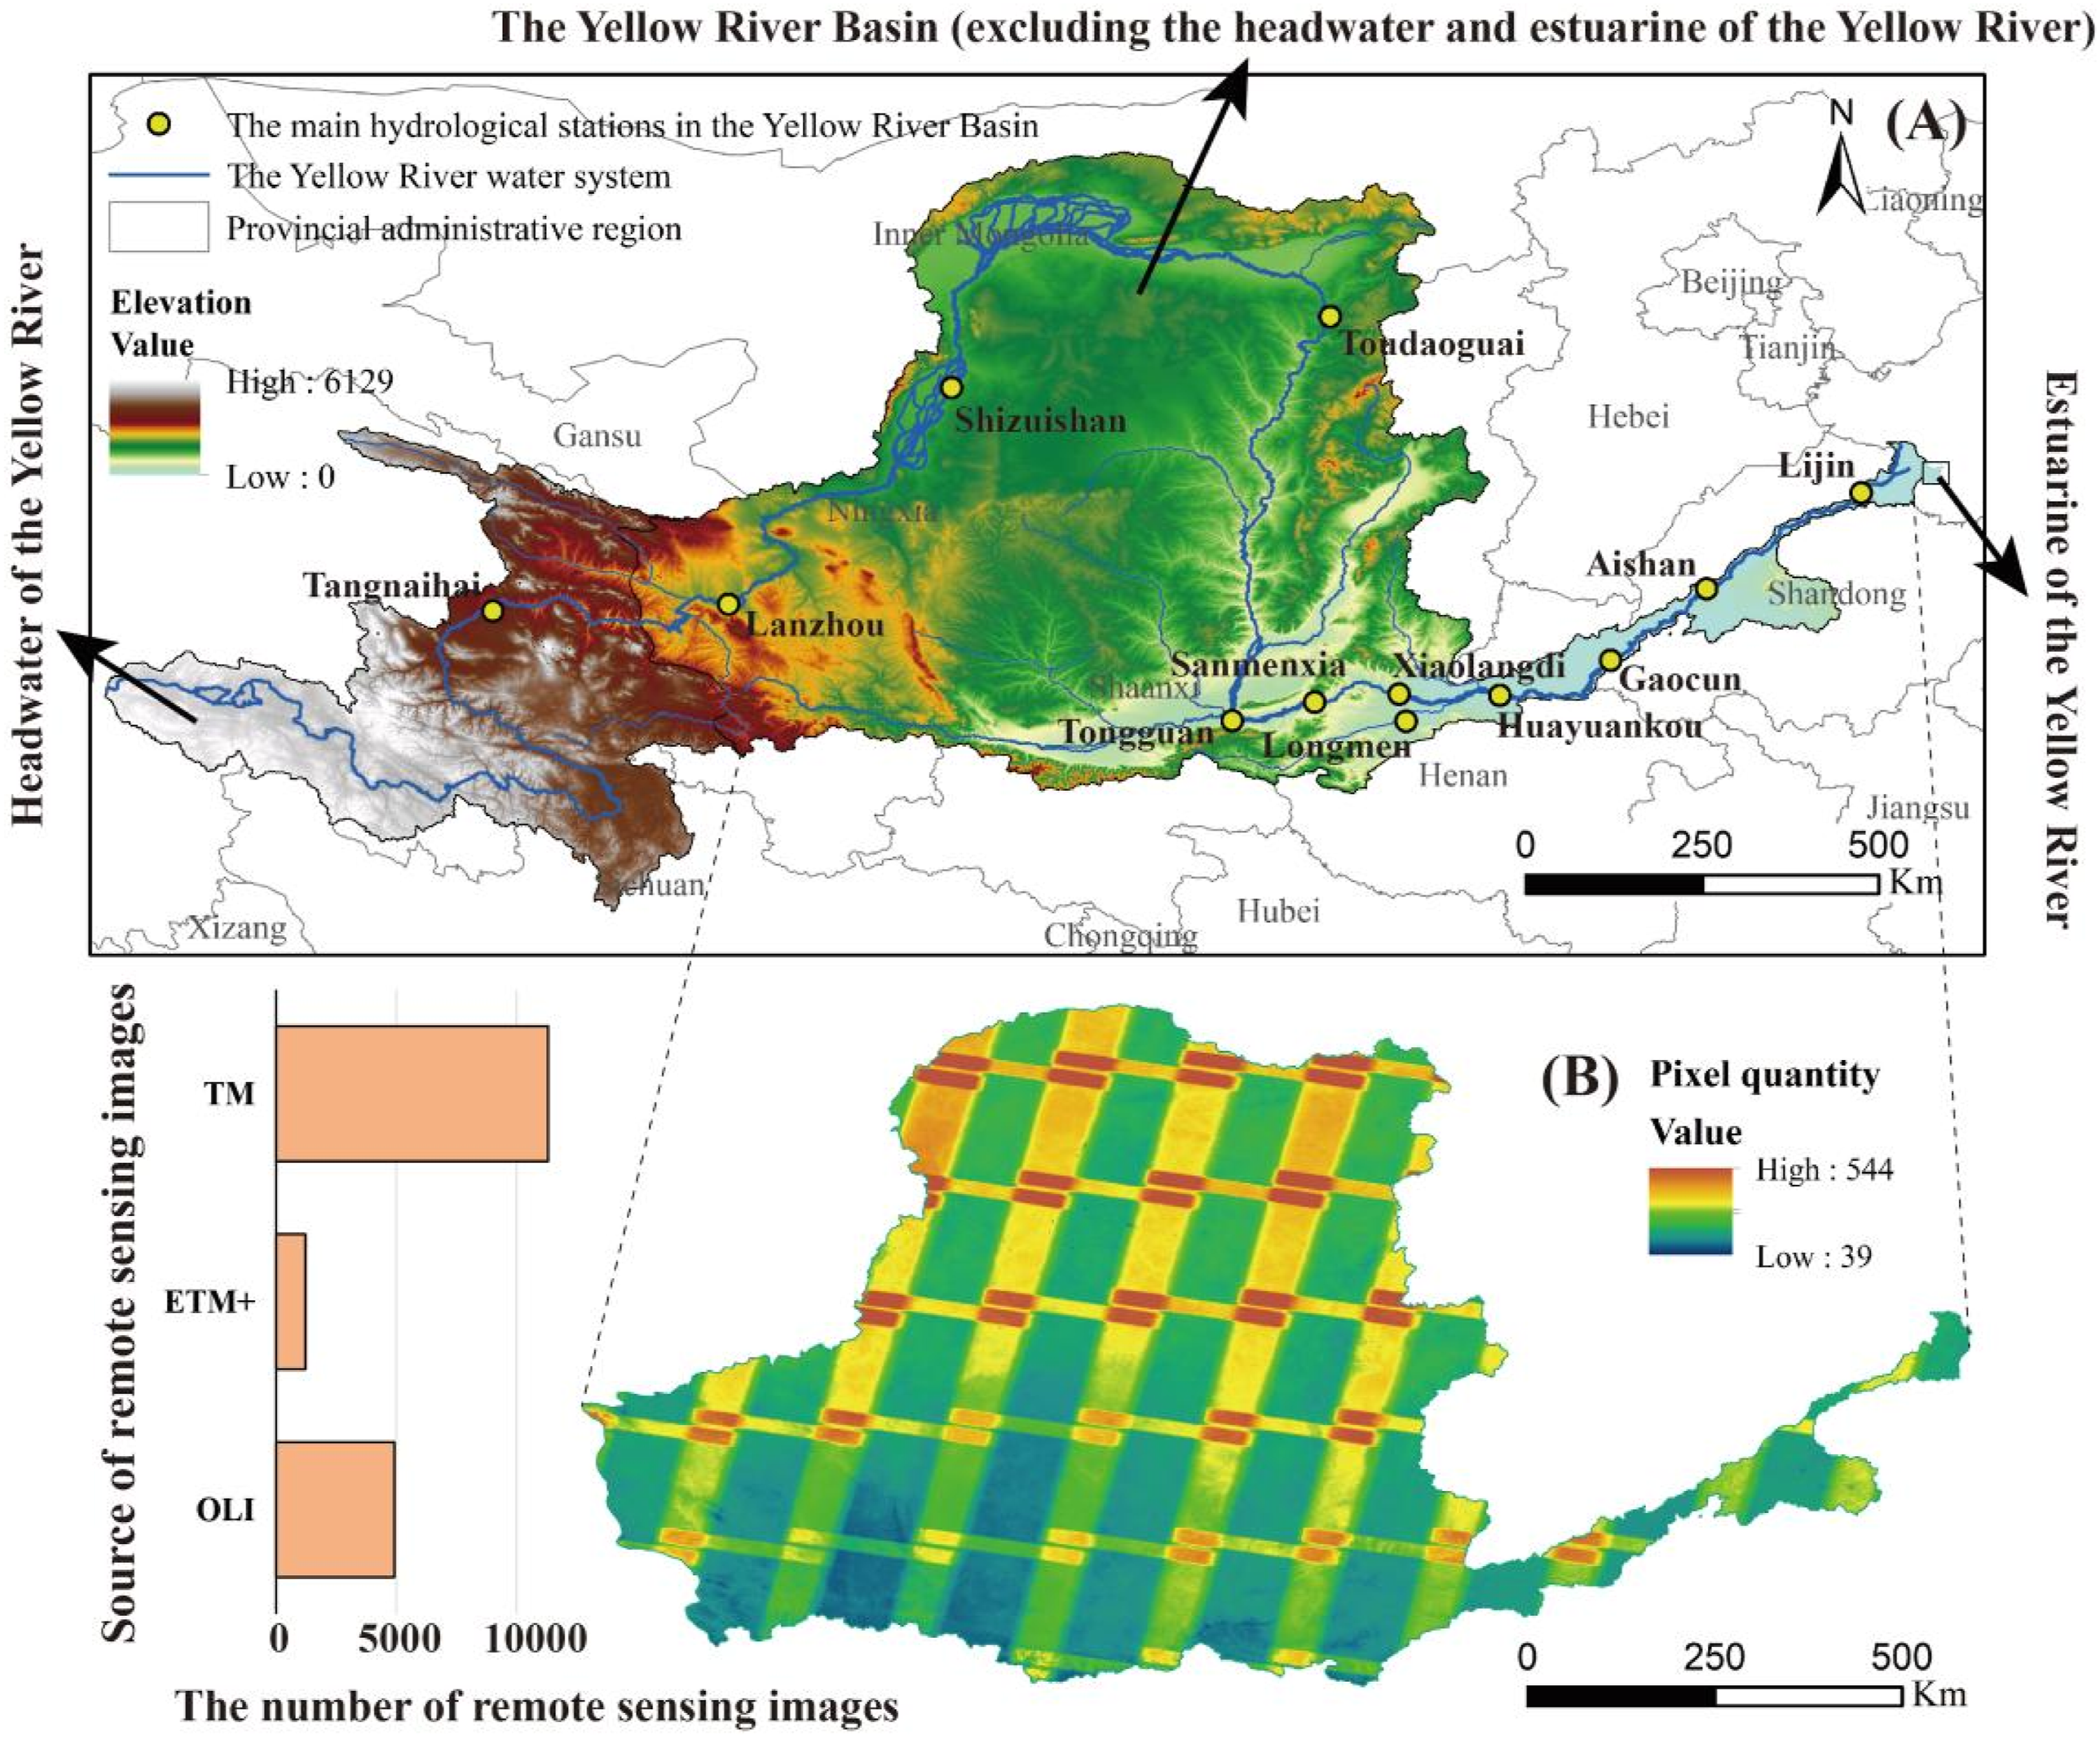
Riverine wetlands in the Yellow River Basin (excluding the headwater and estuarine regions) are primarily composed of water bodies, mudflats, and marshes (Cherry, 2011). Water bodies are defined as natural or artificial areas characterized by permanent or seasonal inundation. Mudflats are flat or gently inclined surfaces formed by the deposition of fine-grained sediments under low-energy hydrological conditions and are alternately exposed and submerged, contributing to flow regulation, wave attenuation, bank stabilization, and the filtration of suspended sediments. Marshes are typical low-elevation wetlands occurring along riverbanks and provide essential ecosystem services, such as habitat provision, water regulation, carbon sequestration, and soil conservation. These three wetland types were identified as the primary targets for riverine wetland mapping in the Yellow River Basin (excluding the headwater and estuarine regions).
Data source and preprocess
Remote sensing images for the Yellow River Basin were obtained from the Landsat-5 TM, Landsat-7 ETM+, and Landsat-8 OLI sensors at a spatial resolution of 30 m and are freely available through the GEE platform. We used the Level-2 Collection 2 Tier 1 products, which have undergone radiometric and geometric corrections by the United States Geological Survey (USGS) and can be directly used for supervised wetland classification following cloud removal and spatial clipping. In total, 16,762 remote sensing images acquired during the growing season (May–October) from 1986 to 2022 were selected for the study area. Specifically, 10,620 images were obtained from Landsat-5 TM (1986–2010), 1219 from Landsat-7 ETM+ (2011–2013), and 4923 from Landsat-8 OLI (2014–2022) (Figure 1(b)). Given the relatively low cloud cover and high image quality, we performed median compositing using images from adjacent years during the growing season. Because the Landsat image acquired in May 2011 exhibited pronounced striping, only median composites generated from June to October were used for that year.
Additional statistical datasets were used to analyze the drivers of riverine wetland area and landscape change. Climatic variables include the monthly average temperature and precipitation datasets at 1 km resolution from the National Earth System Science Data Center (geodata.cn), which were clipped to the study area for the period 1986–2022 using Python 3.10. Hydrological variables include the runoff and sediment discharge data from the Lanzhou, Toudaoguai, and Huayuankou gauging stations (1986–2022), which were obtained from the Yellow River Conservancy Commission.
Extraction of the maximum riverine wetland boundary
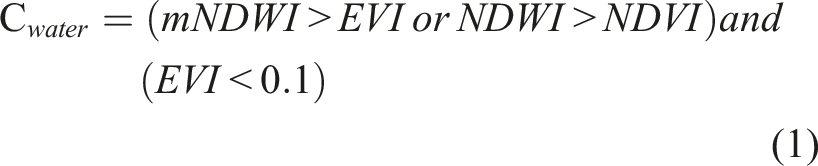
We selected the maximum riverine wetlands boundary from 1986 to 2022 in the Yellow River Basin (excluding the headwater and estuarine regions) as the spatial extent for wetland classification. We first extracted the annual water boundary (

Riverine wetland mapping of the Yellow River Basin
Reference-year wetland mapping provides the baseline for long-term mapping and critically influences the dataset accuracy. First, Landsat images were preprocessed in GEE through cloud masking removal, temporal median compositing, and spatial clipping. Visual interpretation was conducted using false-color composite images and selected riverine wetland sample points. A Random Forest classification model was then trained using spectral bands, spectral indices, texture features, elevation, and phenological metrics derived from these samples. We used 70% of the sample points to train the classification model, with the remaining 30% used for accuracy assessment. Through visual interpretation, we constructed a reference-year sample database for water bodies, mudflats, and marshes. The sampling process is shown in Supplemental Figure 1. In false-color composite images, marshes appear dark red, mudflats yellow-brown, and water bodies blue. In total, we selected 300 water body samples, 100 mudflat samples, and 130 marsh samples. Samples and model parameters were then iteratively refined using Google Maps and Sentinel-2 images at 10 m resolution to generate the optimal reference-year riverine wetland map.
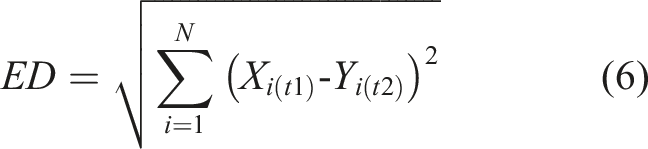
We employed an approach combining training sample migration with Random Forest classification for long-term riverine wetland mapping. The sample migration strategy is one of the most effective approaches for long-term remote sensing mapping (Huang et al., 2020), based on evaluating spectral similarity between samples in the target year and the reference year to assess whether land-cover change has occurred. If no significant change is detected, samples can be directly migrated to the target year. Euclidean distance (ED) is widely used as an effective measure of spectral similarity. It represents the overall difference between spectral vectors, with an ED value of 0 indicating identical spectra (Fekri et al., 2021). The ED is calculated as follows:
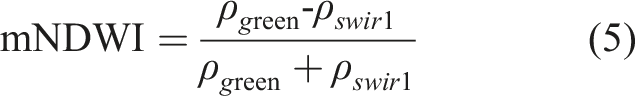
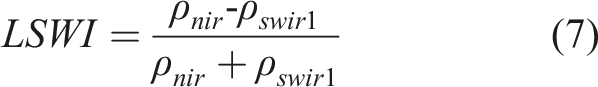
To ensure classification accuracy, we first supplemented samples for target years through visual interpretation and established a reference sample database at 10-year intervals in areas exhibiting pronounced spectral variability. Following the optimal ED threshold determination strategy proposed in our previous work (Qiu et al., 2024a), we set the sample migration threshold for water bodies and mudflats as ED < 0.02. As marsh samples were not rational in the given threshold interval, the Land Surface Water Index (LSWI), which reflected the moisture content of vegetation soil, was selected as the screening condition. When LSWI < 0, it was considered that the land cover of the marsh sample had changed. The LSWI is calculated as follows:
However, mudflats exhibited pronounced interannual variability, and sample migration caused substantial sample loss. Therefore, additional sample points must be supplemented to meet classification demands. We added 332 sample points during 1989, 1995, 2006–2008, and 2011–2015, thereby establishing a complete sample database for riverine wetland classification in the Yellow River Basin (excluding the headwater and estuarine regions) from 1986 to 2022. Finally, we input the migrated samples into a Random Forest classification model to generate annual riverine wetland maps from 1986 to 2022 and evaluated classification performance using overall accuracy, the Kappa coefficient, user’s accuracy, and producer’s accuracy.
Changes of riverine wetland landscape patterns
To characterize long-term changes in riverine wetland spatial patterns, we quantified landscape pattern indices at both the landscape and class levels using FRAGSTATS. The combined use of these two categories of indices allows us to capture not only changes in total wetland extent, but also shifts in fragmentation, aggregation, connectivity, and shape complexity of wetland patches (Riitters et al., 1995). Because multiple landscape pattern indices may reflect similar aspects of spatial configuration, we selected a set of complementary indices rather than relying on a large number of highly correlated indices.
At the landscape level, we employed patch density (PD), contagion index (CONTAG), and splitting index (SPLIT) to characterize riverine wetland landscape patterns. PD measures the number of patches per unit area and reflects overall landscape fragmentation. CONTAG measures the degree of spatial aggregation and contagion among riverine wetland patches, with higher values indicating stronger landscape dominance and continuity. SPLIT measures landscape fragmentation by integrating patch area and number.
At the class level, we quantified riverine wetland landscape patterns using class percentage of landscape (CPLAND), largest patch index (LPI), connectivity index (CONNECT), aggregation index (AI), patch density (PD), and landscape shape index (LSI), covering dimensions of area characteristics, spatial structure, and landscape shape. LPI and CPLAND characterize the quantitative features of riverine wetland areas and indicate the stability of core patches. CONNECT, AI, and PD assess functional connectivity, spatial clustering, and patch density of riverine wetland patches from a spatial structure perspective. LSI captures landscape shape complexity and reflects the extent to which riverine wetland edges are affected by natural or human disturbances. The calculation methods for the above landscape pattern indices are presented in Supplemental Table 1.
We employed single linear regression to analyze temporal trends in riverine wetland area. Given the complex change of riverine wetland landscape patterns, a single linear model fails to accurately describe their temporal trends. Accordingly, we employed multivariate nonlinear regression to capture nonlinear dynamics in riverine wetland landscape change.
The driving factor of riverine wetland landscape change
Previous research indicates that the spatiotemporal distribution of precipitation has a strong influence on the ecosystem dynamics of the Yellow River Basin (Zhang et al., 2024; Zhou et al., 2025). Therefore, we focused on analyzing the relationships between riverine wetland area and hydrological variables, including precipitation and runoff, while integrating temperature and other climatic variables to explain the change in spatiotemporal landscape patterns. We initially employed Pearson correlation coefficients to quantify the relationships between changes in the riverine wetland area and potential driving factors, and evaluated statistical significance using T-tests (Carreiras et al., 2006; Legendre et al., 2002).
To further elucidate the effects of various drivers on riverine wetland change, we developed stepwise multiple linear regression models to quantify their relative contributions to changes in riverine wetland area and landscape patterns. First, we identified drivers significantly associated with riverine wetland changes based on correlation analysis results. Second, we applied stepwise regression to iteratively include or exclude variables, thereby optimizing model structure and minimizing multicollinearity. We constructed the regression model using the ordinary least squares method, expressed as

Results
The accuracy of riverine wetland mapping
Riverine wetland mapping for the Yellow River Basin (excluding the headwater and estuarine regions) in 2020 achieved an overall accuracy of 98.73% and a Kappa coefficient of 0.98, indicating high reliability of the classification result (Supplemental Table 2). Meanwhile, user’s and producer’s accuracies for water bodies, mudflats, and marshes all exceeded 90%. For long-term riverine wetland mapping, overall accuracy ranged from 90.00% (1992) to 99.28% (2021) (Figure 3(a)), with an average of 92.98%, and the Kappa coefficients ranged from 0.83 (2012) to 0.99 (2021), with an average of 0.88, indicating that the sample migration strategy and classification model consistently demonstrate strong performance across the time series. Riverine wetland mapping in the Yellow River Basin (excluding the headwater and estuarine regions). (a) Number of training samples and classification accuracy for riverine wetlands from 1986 to 2022; (b) Spatial distribution of riverine wetlands in the Yellow River Basin in 2020 (reference year); (c). Distribution of wetland area across the upstream, midstream, and downstream of the Yellow River in 2020.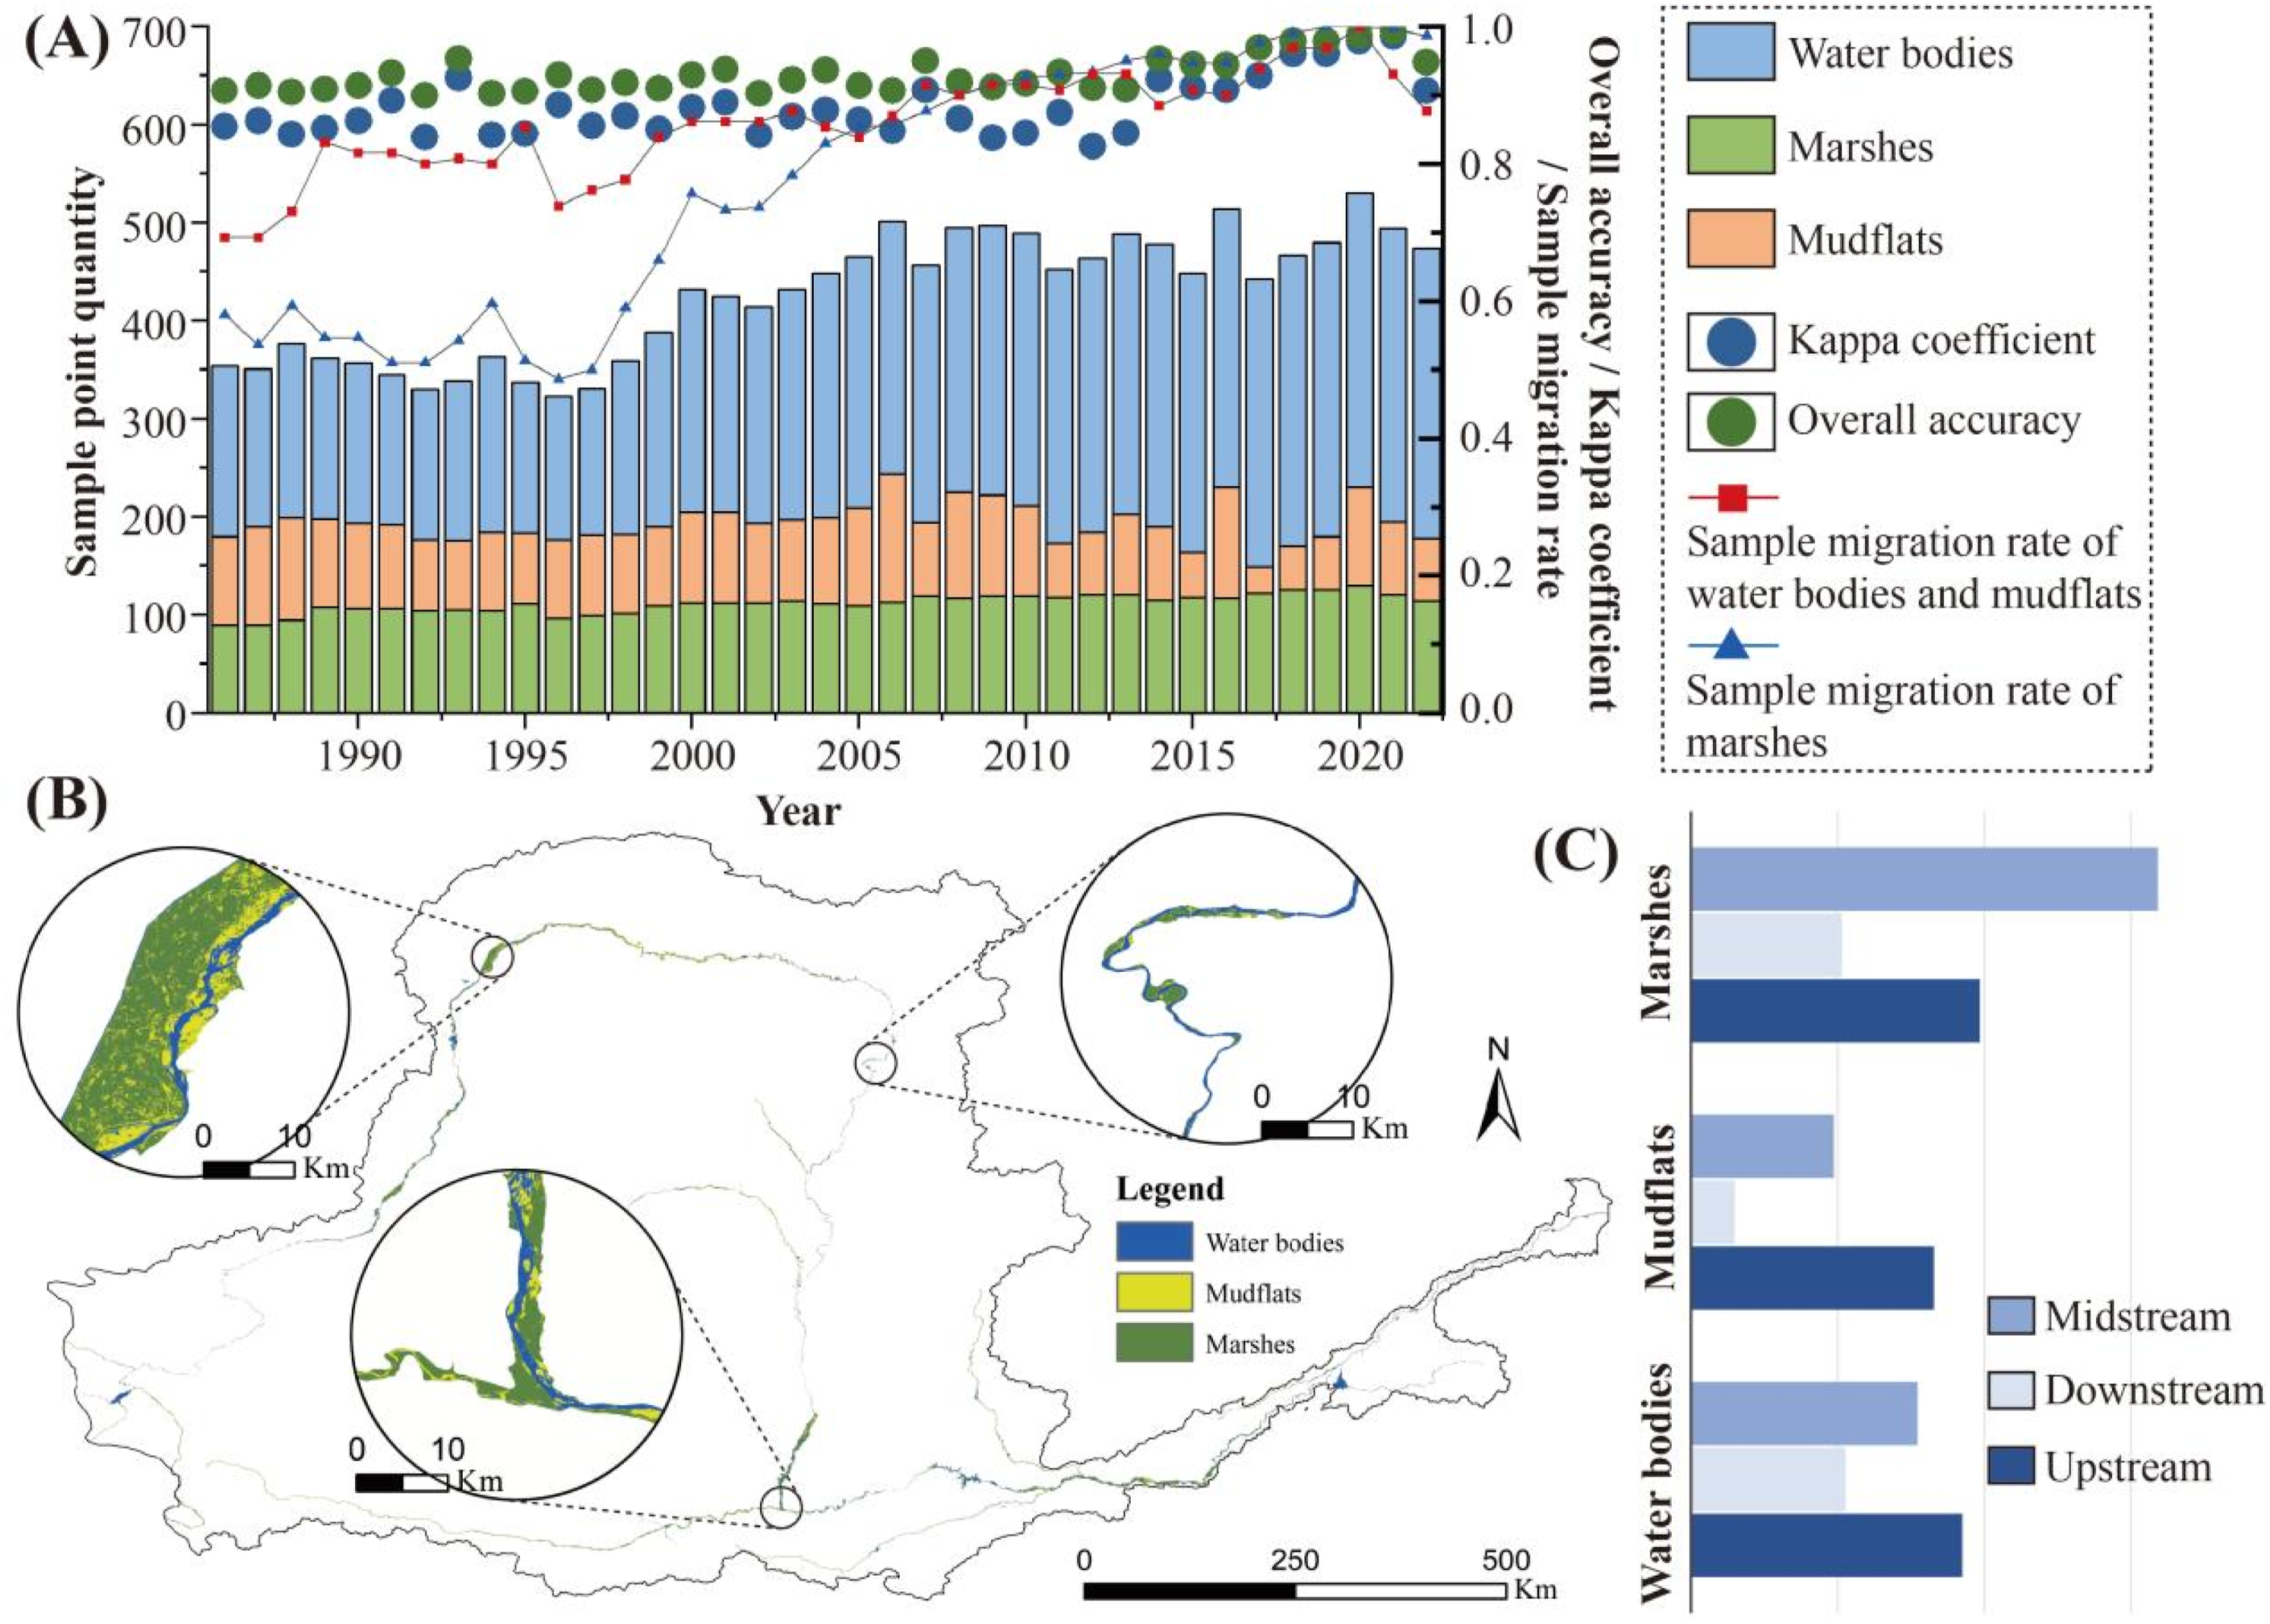
Results showed that riverine wetlands within the Yellow River Basin (excluding the headwater and estuarine regions) covered an area of 6778.61 km2 in 2020 (Figure 3(b)). Marshes constituted the dominant wetland type, accounting for nearly half of the total wetland area (3090.84 km2, 45.25%). Water bodies constituted the second largest wetland type, covering nearly one-third of the total wetland area (2224.00 km2, 32.88%), whereas mudflats accounted for the smallest share (1463.78 km2, 21.87%). Spatially, water bodies and mudflats were mainly concentrated in the upstream, exhibiting a gradual decline in area from the upstream to the downstream. Water bodies covered an area of 924.59 km2 in the upstream. The upstream, midstream, and downstream accounted for 41.57%, 34.71%, and 23.72% of the total water body area, respectively. In contrast, marshes were mainly concentrated in the middle reaches, covering 1591.66 km2 and accounting for 51.50% of the total marsh area.
The spatiotemporal distribution of riverine wetlands
From 1986 to 2022, the area of water bodies within riverine wetlands exhibited a significant increasing trend (R2 = 0.47). Relative to 1986, the water body area increased by 950.35 km2, of which the midstream accounted for 52.85% (Figure 4(b)). In contrast, changes in mudflat area were relatively modest (R2 = 0.0037), with a net increase of 379.33 km2, primarily driven by an increase in the upstream, which accounted for 86.08% of this increase (Figure 4(c)). Despite these increases, the total riverine wetland area in the Yellow River Basin (excluding the headwater and estuarine regions) decreased by 1284.98 km2 over the past 36 years (Figure 4(a)), primarily driven by a significant decrease in marsh coverage (R2 = 0.74). By 2022, the marsh area had decreased by nearly 30.76% compared with 1986, with an average annual decrease of 36.94 km2 (Figure 4(d)), and the upstream and midstream accounted for 82.15% of this decrease. Expansion of water bodies in the midstream and mudflats in the upstream and downstream replaced former marsh wetlands (Supplemental Figure 2). Changes in riverine wetland area in the Yellow River Basin (excluding the headwater and estuarine regions) from 1986 to 2022. (a) Riverine wetland area changes in the upstream, midstream and downstream; (b) Riverine wetland area changes in the midstream; (c) Riverine wetland area changes in the upstream; (d) Riverine wetland area changes in the downstream.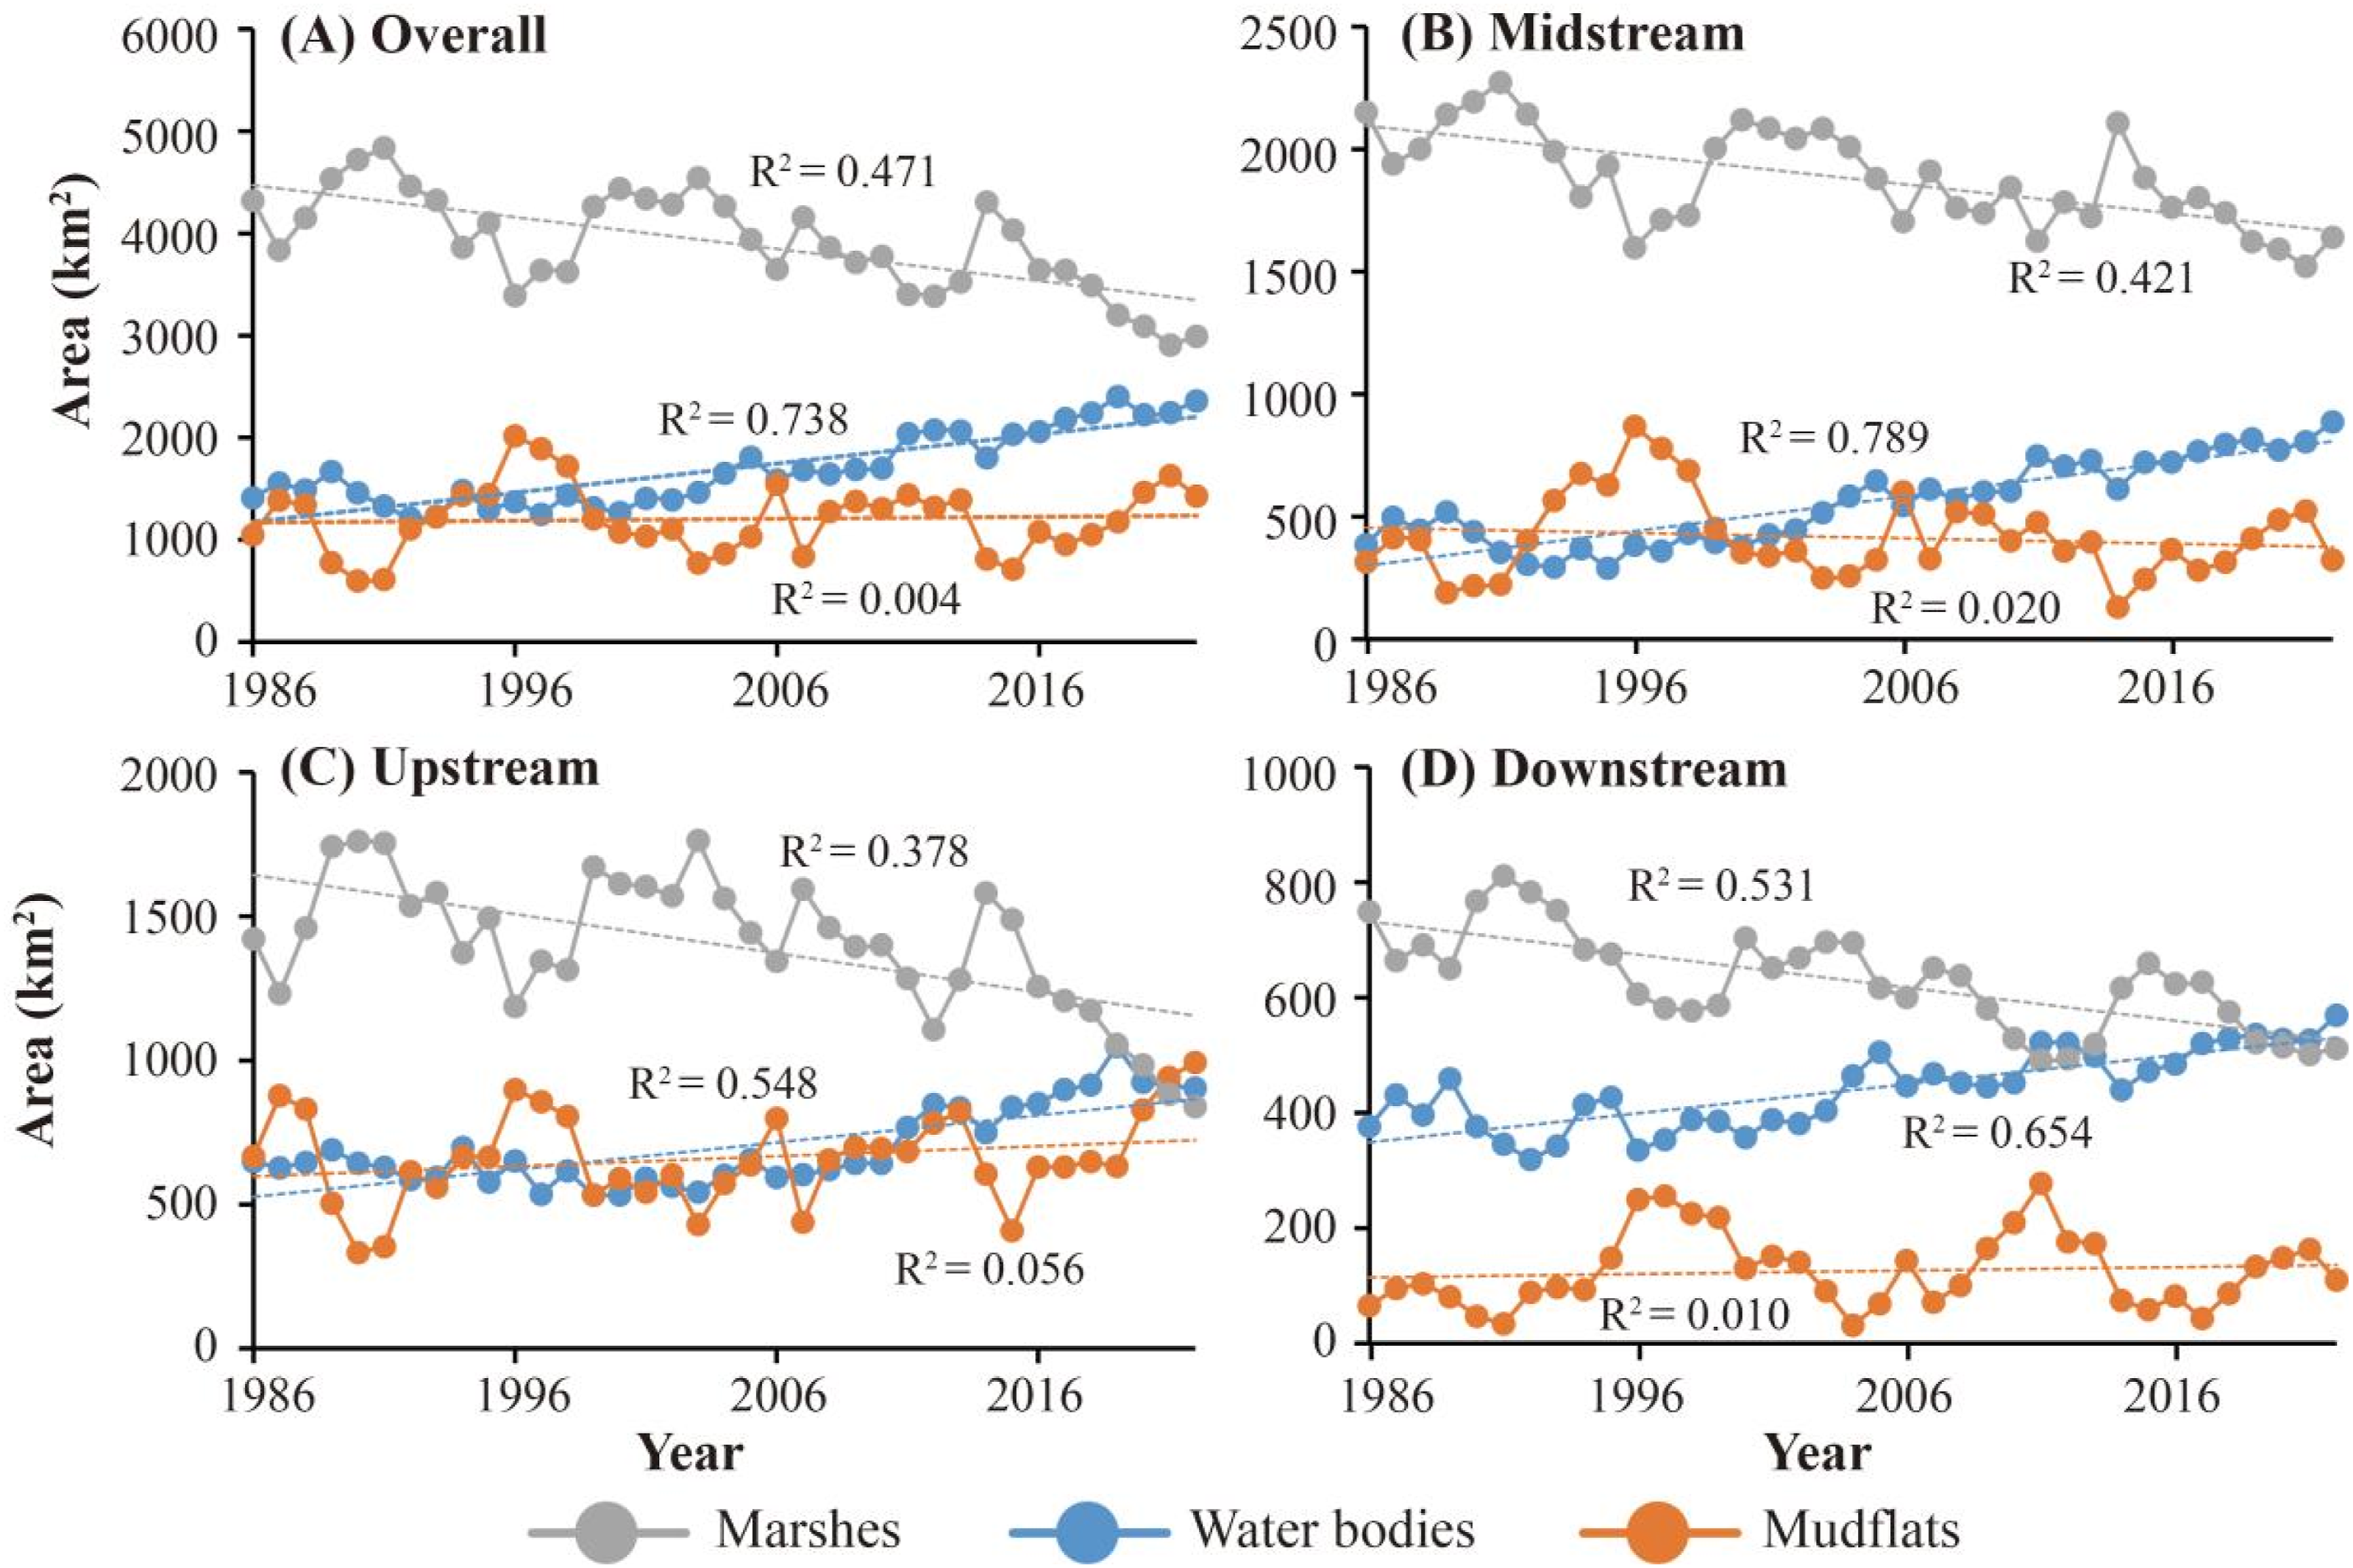
Riverine wetland landscape patterns exhibited an increase in fragmentation between 1986 and 2022 (Figure 5). Marshes exhibited substantial landscape degradation, as evidenced by decreases in LPI, CPLAND, CONNECT, and AI (Figure 5). These trends indicate decreased connectivity and aggregation among marsh patches. In contrast, LPI, CPLAND, CONNECT, and AI for water bodies exhibited a fluctuating increase trend (Figure 5), indicating increased dominance of core water body patches and enhanced connectivity and aggregation. Concurrent decreases in PD and LSI suggest increasing spatial stability and concentration of water body landscapes. Although the landscape pattern indices of mudflats fluctuated considerably, LPI, CPLAND, CONNECT, and AI increased after 2019 or 2021 (Figure 5). Moreover, PD and LSI generally showed increasing trends but declined sharply in 2022. Changes in landscape indices of riverine wetlands in the Yellow River Basin (excluding the headwater and estuarine regions) from 1986 to 2022.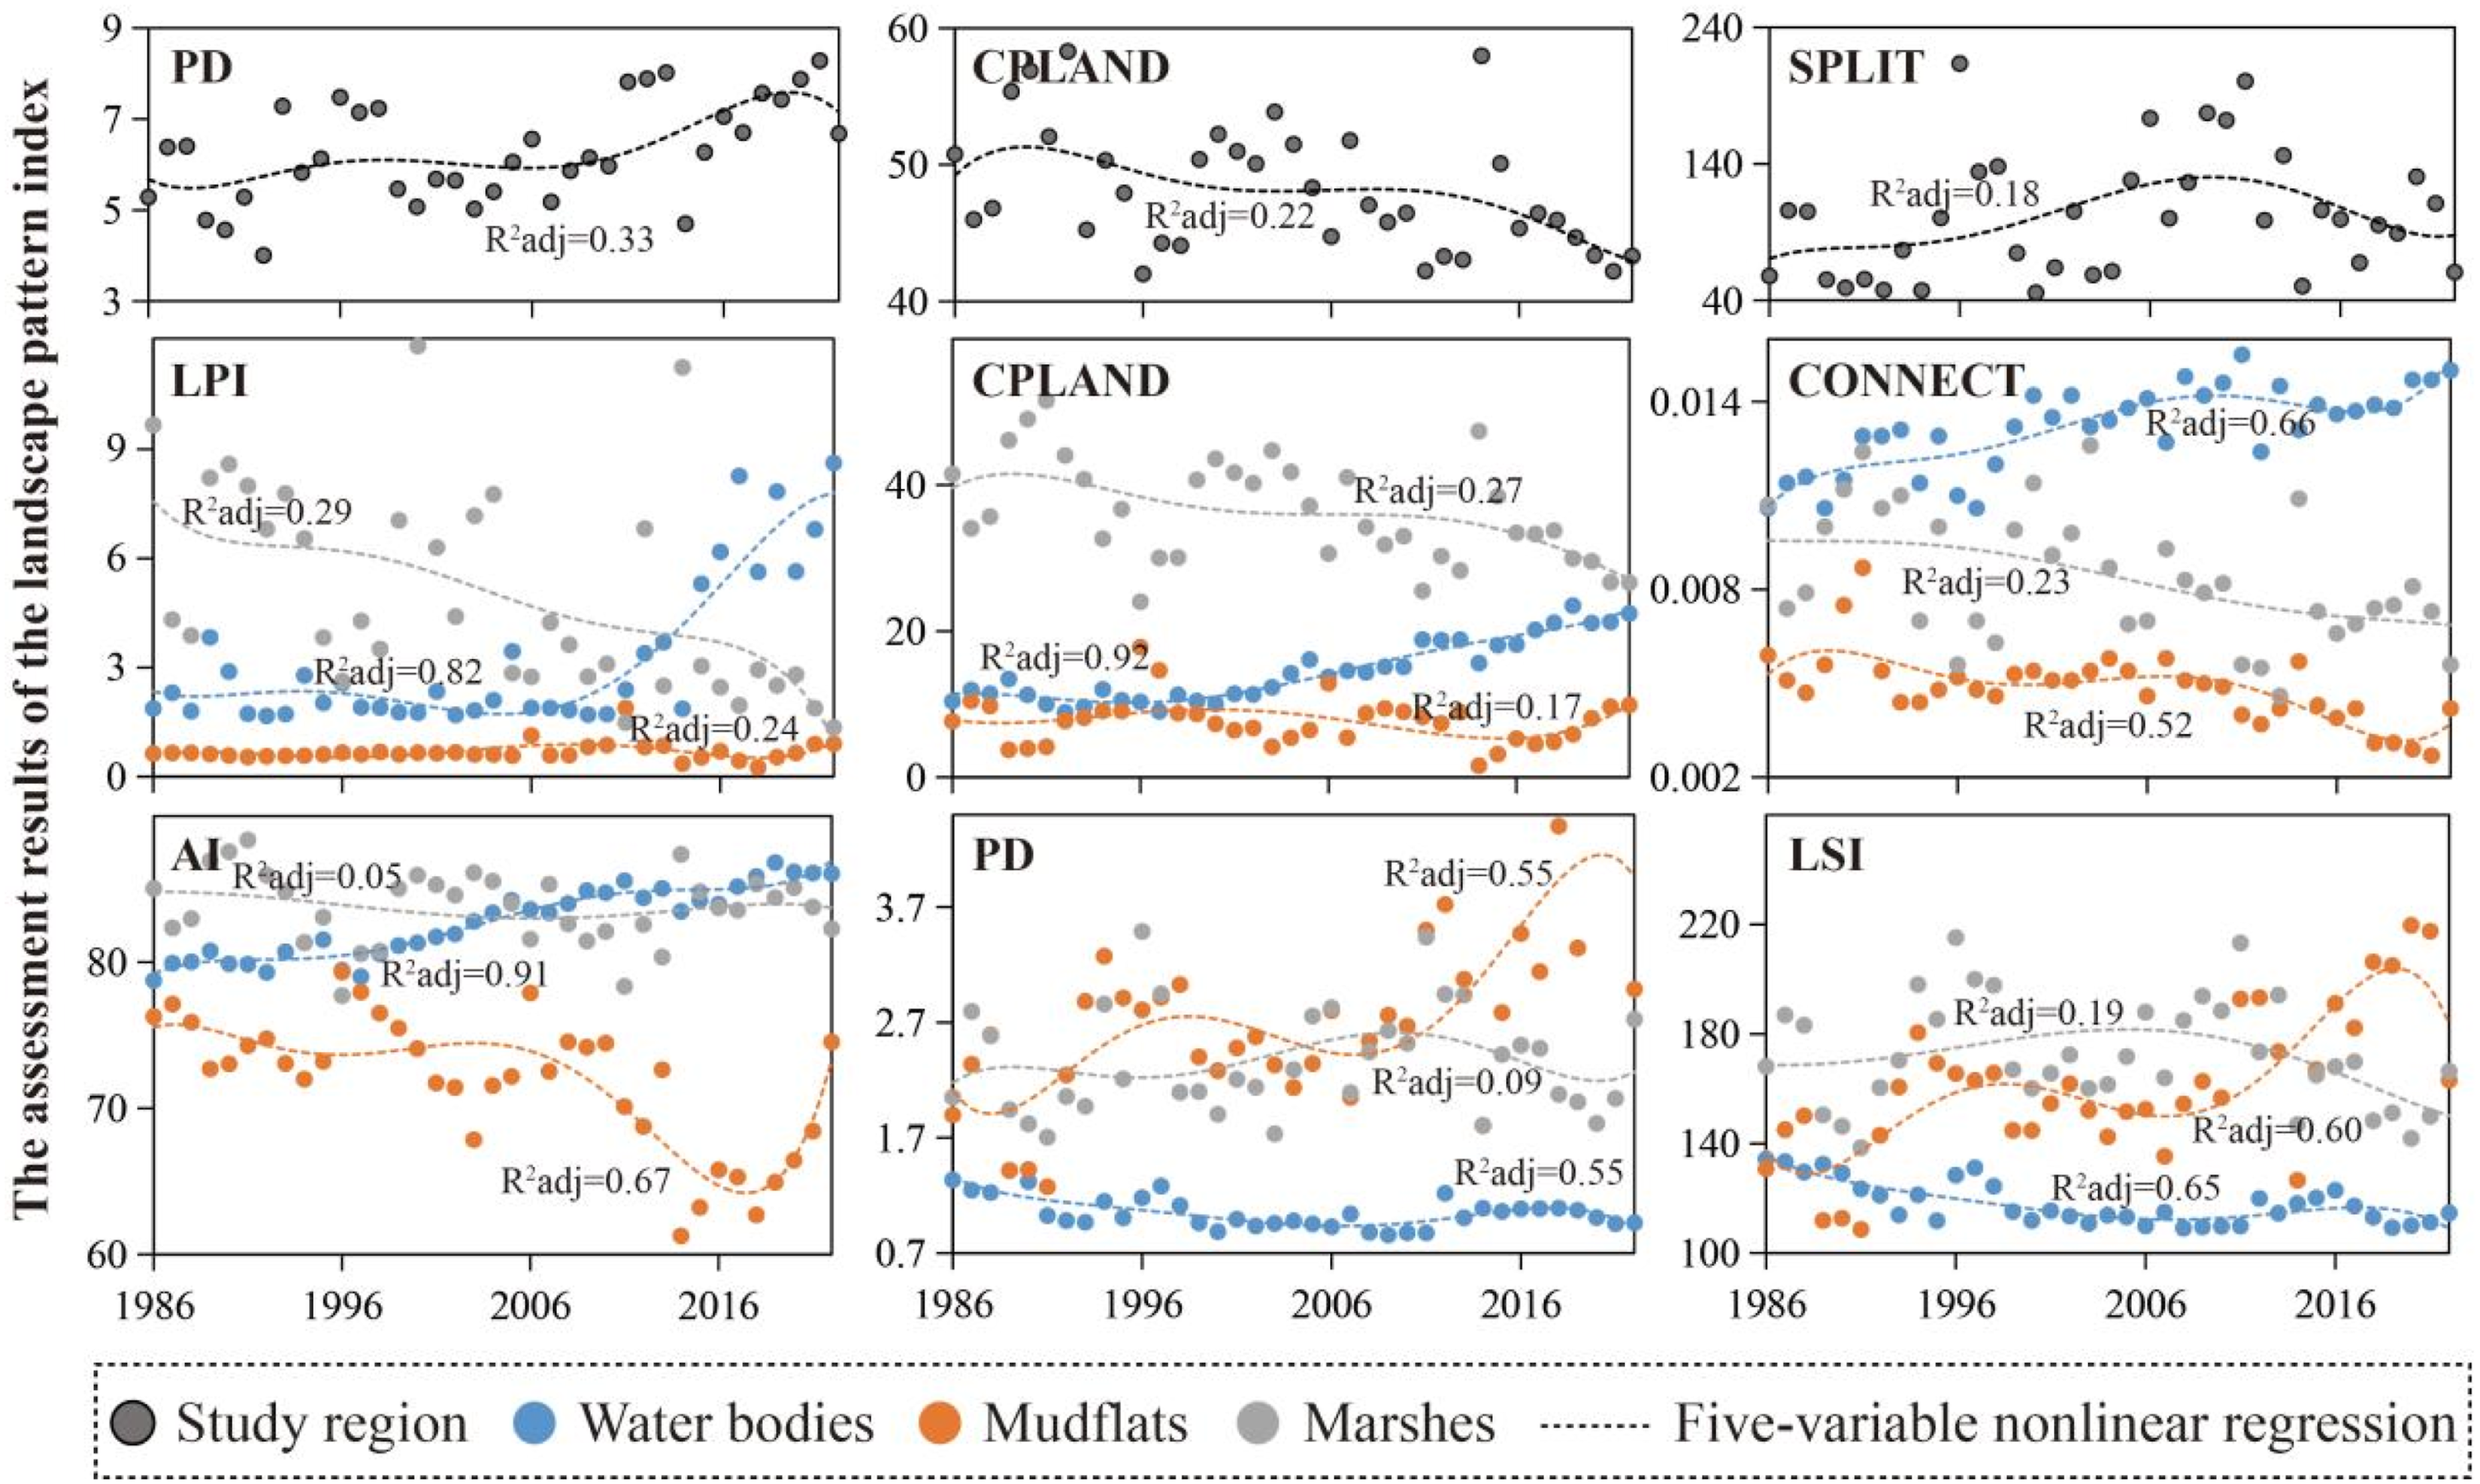
Driving factors for riverine wetland area and landscape pattern change
Driving factors of area changes in water bodies, marshes, and mudflats in the Yellow River Basin (excluding the headwater and estuarine regions).
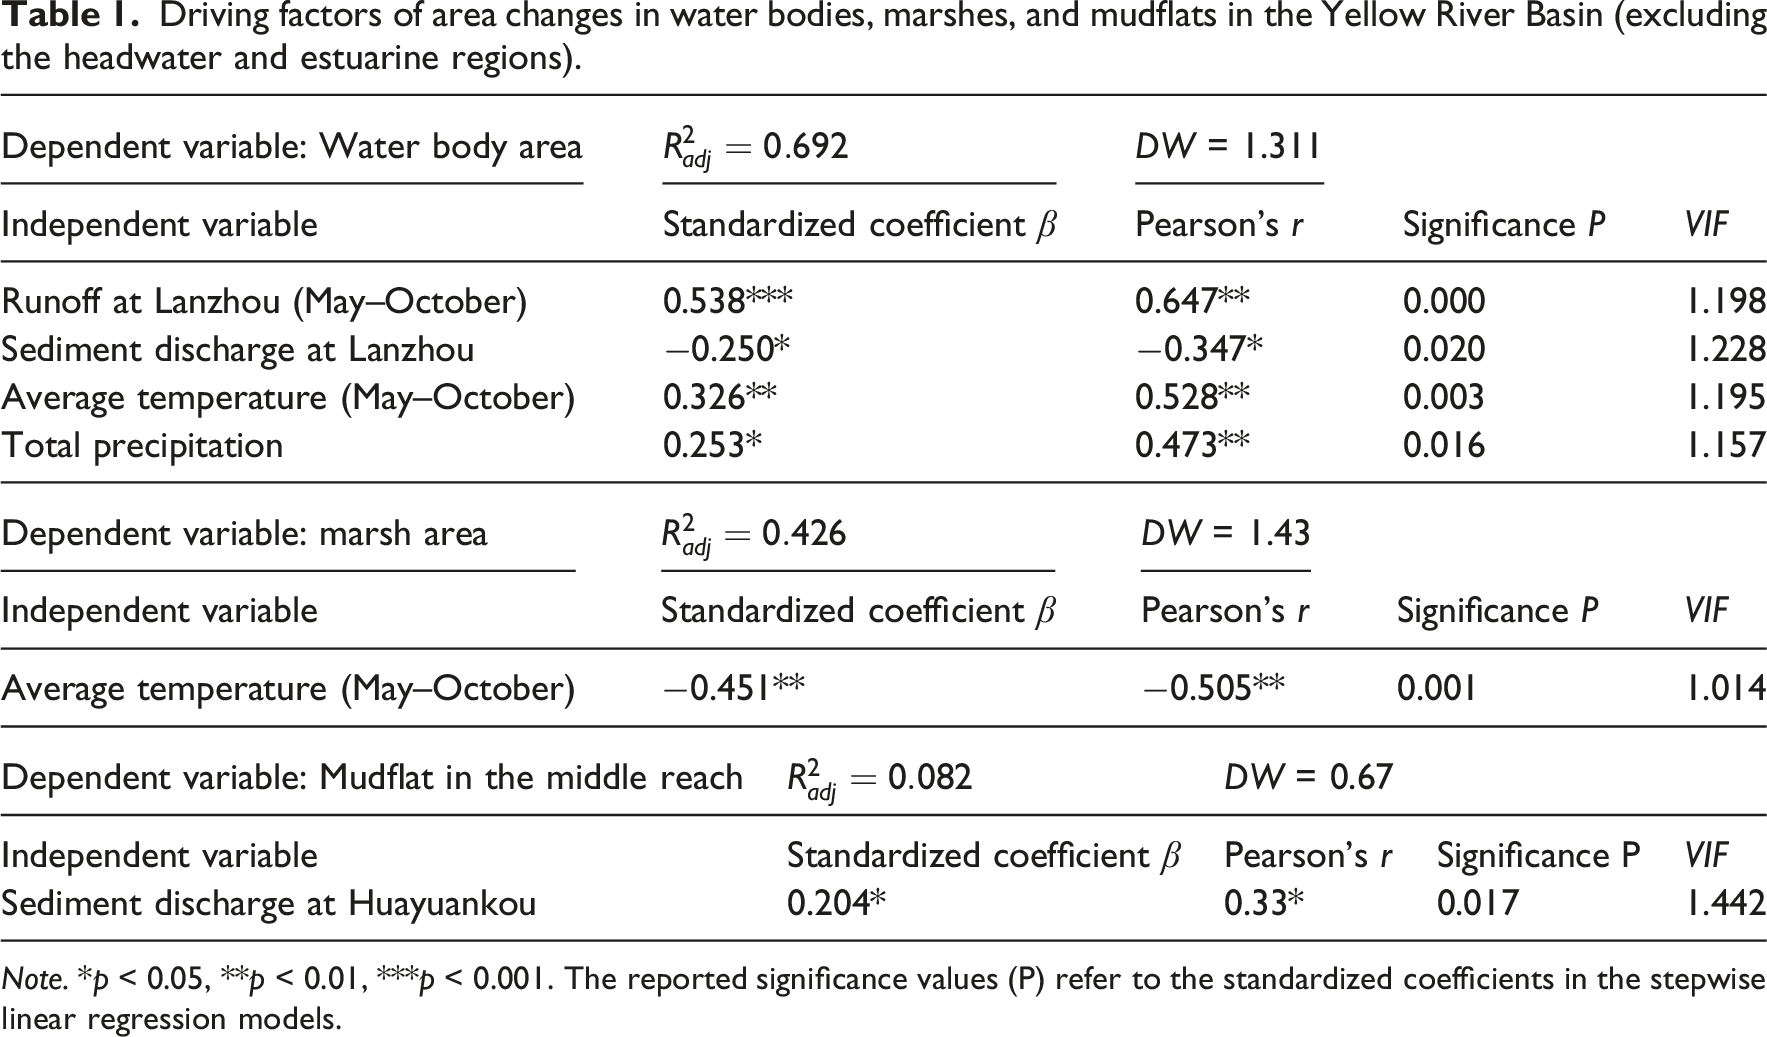
Note. *p < 0.05, **p < 0.01, ***p < 0.001. The reported significance values (P) refer to the standardized coefficients in the stepwise linear regression models.
Precipitation and sediment delivery at the Huayuankou station were the primary drivers of changes in CONNECT for water bodies (Figure 6). Precipitation showed a significant positive effect on CONNECT. In contrast, sediment discharge showed a negative effect on CONNECT and positive effects on PD and LSI, indicating that sediment accumulation causes increased water body fragmentation and increased patch shape complexity, especially in the downstream. Mudflat landscape patterns were mainly associated with average temperature, precipitation, runoff, and sediment discharge (Figure 6). Average temperature showed a negative effect on CONNECT and a positive effect on PD and LSI. In addition, sediment discharge at the Huayuankou station positively affected AI, whereas precipitation and runoff at the Toudaoguai station showed a negative effect. Marsh connectivity and patch shape complexity are mainly affected by the average temperature and runoff at the Lanzhou station (Figure 6), indicating that increasing temperature and runoff decreased marsh connectivity and were accompanied by lower shape complexity. Driving factors of changes in landscape indices of water bodies, marshes, and mudflats in the Yellow River Basin (excluding the headwater and estuarine regions).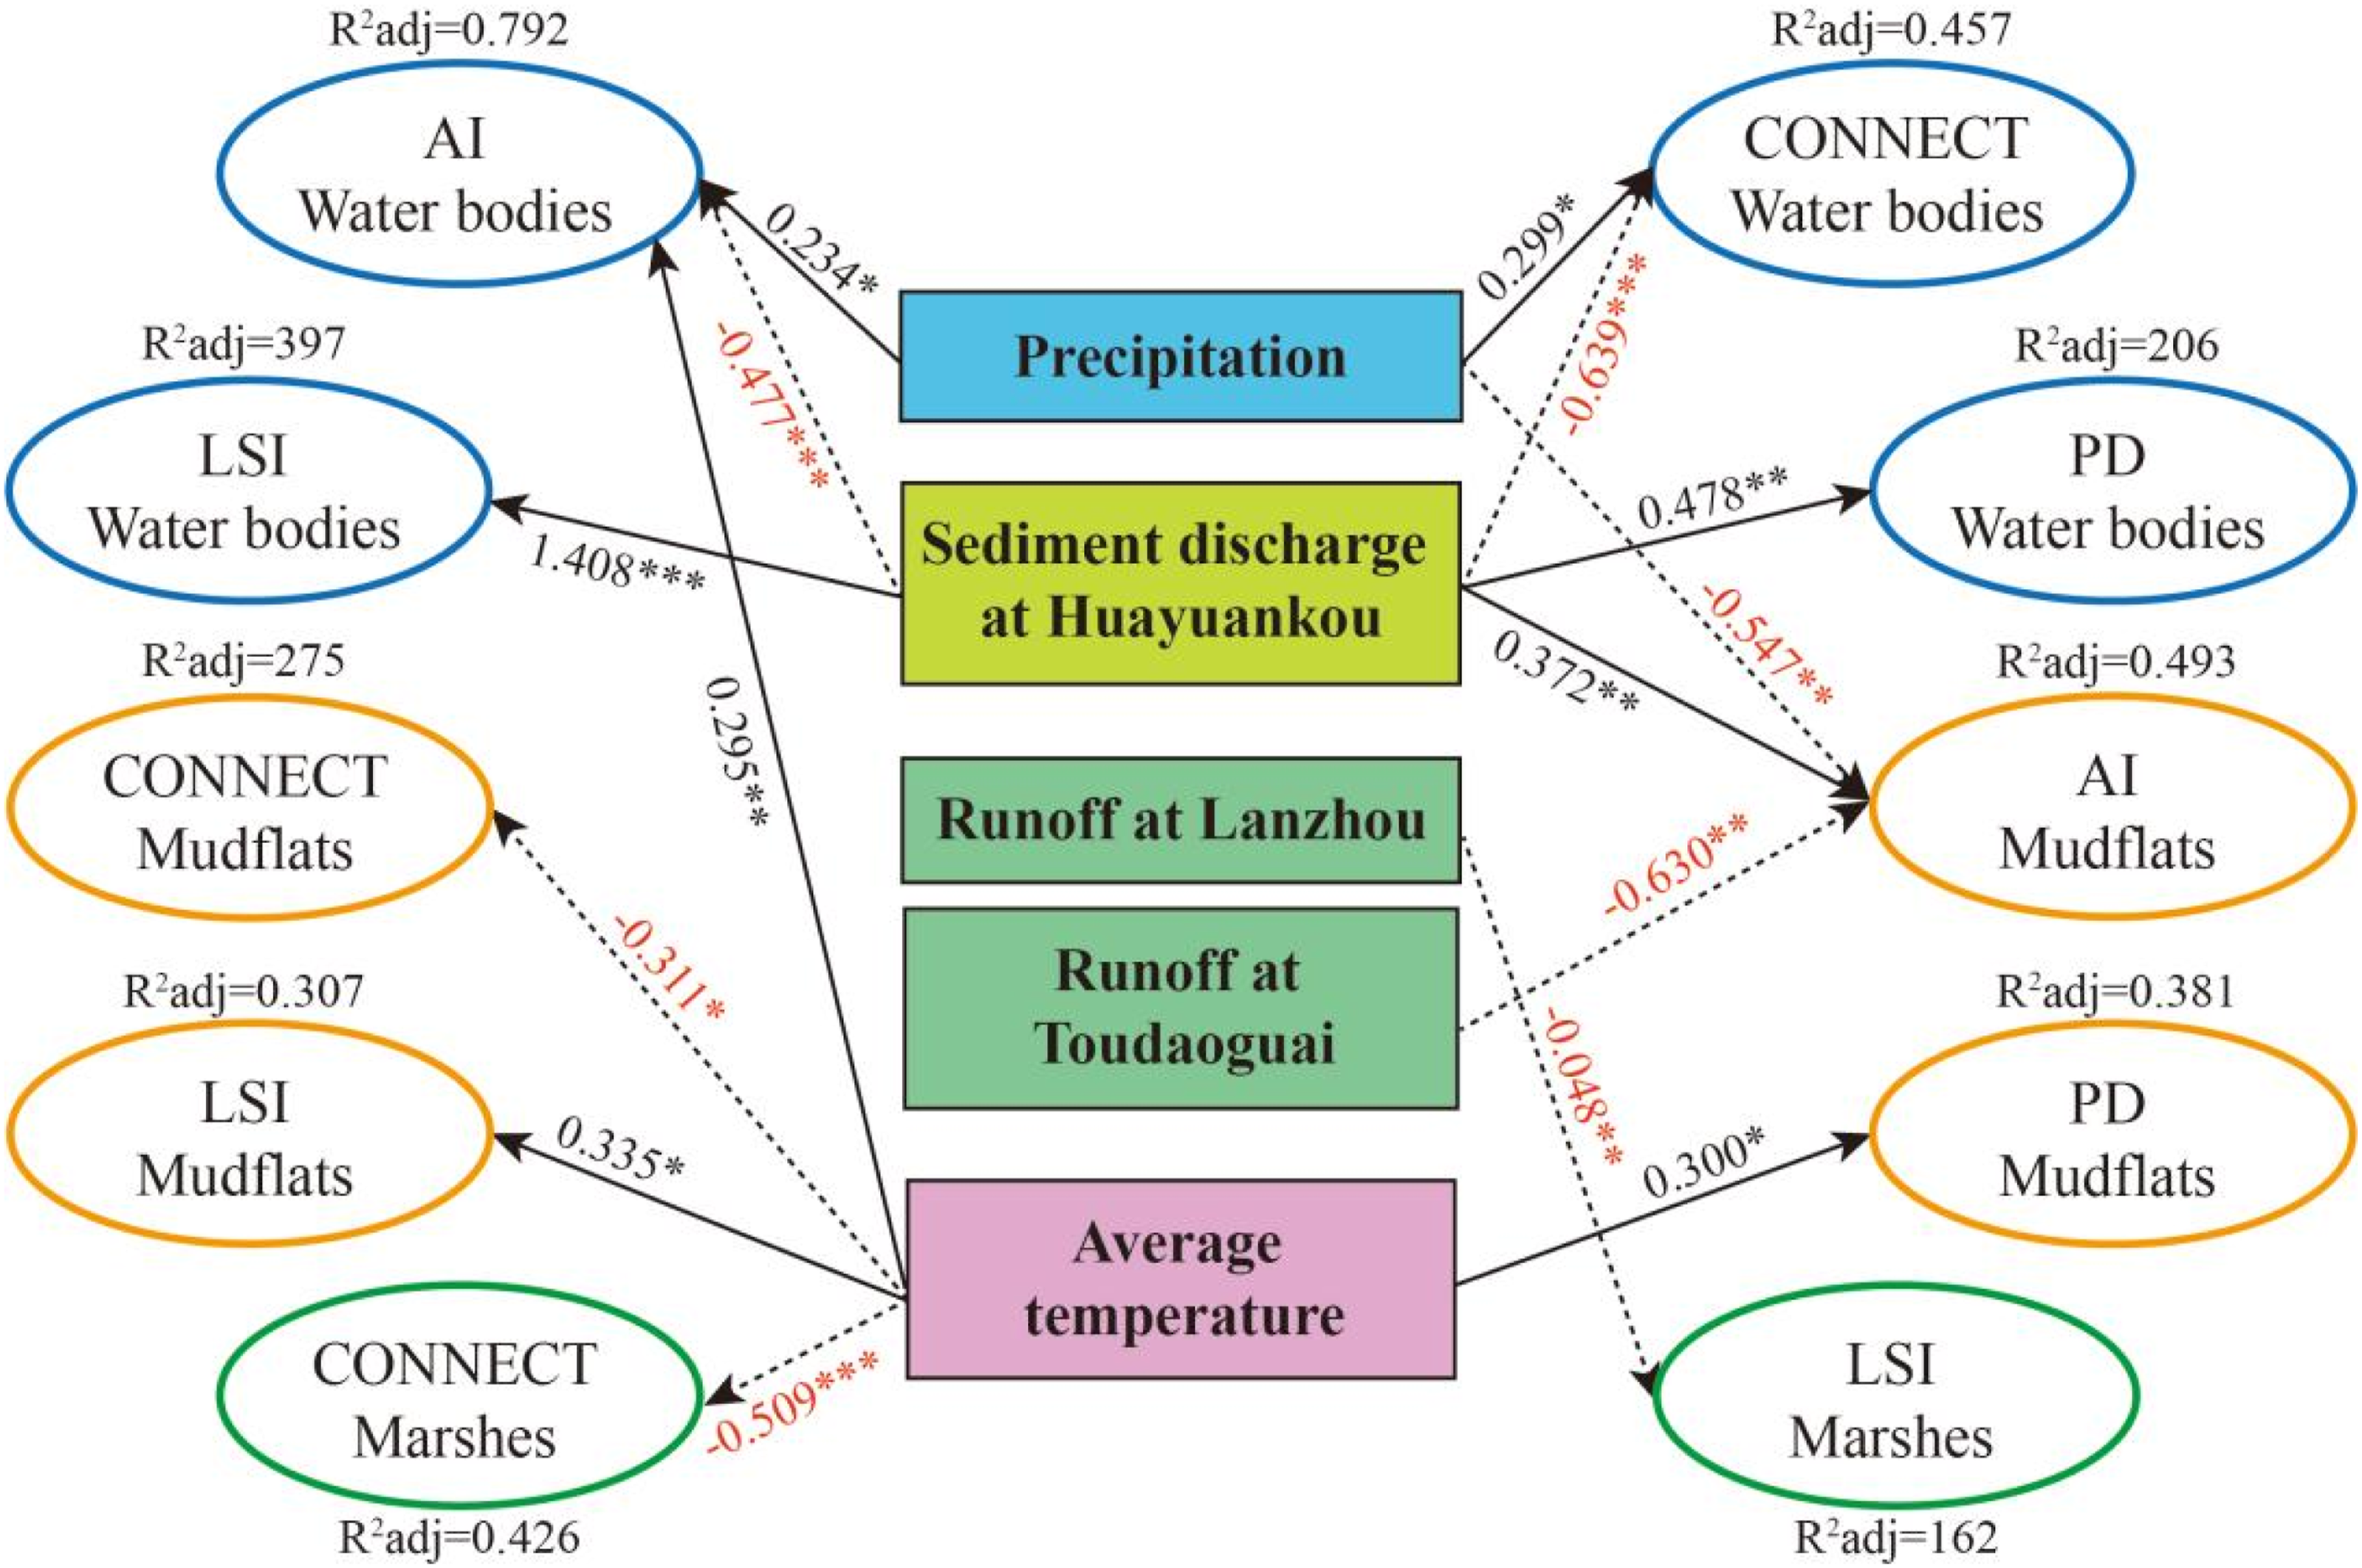
Discussion
Imbalance of riverine wetland protection and restoration
In this study, we employed a previously improved sample migration strategy to map long-term riverine wetland in the Yellow River Basin (excluding the headwater and estuarine regions). The resulting wetland maps exhibited high classification accuracy and consistency (Kappamin = 0.83, Kappaaverage = 0.88). These results indicate that the improved sample migration strategy performs robustly across highly heterogeneous regions, characterized by complex climatic gradients, variable human disturbance, and diverse ecological functions. The method therefore provides a reliable framework for fine-resolution, long-term wetland mapping in large river basins.
The mapping results reveal a complex trend of mixed blessings in riverine wetland area changes across the Yellow River Basin (excluding the headwater and estuarine regions). Since the early 2000s, wetland conservation and restoration programs, including cropland-to-wetland conversion, ecological water replenishment, wetland reserve establishment, and riverine restoration projects (Fu et al., 2025; Mao et al., 2018; Wang et al., 2021), have promoted the expansion of water bodies and the recovery of mudflats, thereby enhancing hydrological connectivity in parts of the basin. However, a concerning pattern emerges for marshes, which represent a core component of riverine wetlands in the Yellow River Basin, as their area is experiencing a significant decrease, particularly pronounced over the past decade (1314.02 km2). Unlike water bodies that primarily enhance connectivity or mudflats that support wave attenuation and food production, marshes constitute the dominant carbon pool of riverine wetlands (Tang et al., 2024; Zhang et al., 2025). Previous research demonstrates that marshes store more carbon than water bodies or mudflats, especially in temperate arid and semi-arid regions, where average biomass density reaches 300.5 ± 73.2 g C m−2 (Shen et al., 2021). Therefore, the extensive degradation of marshes and their conversion to water bodies and mudflats (1092.35 km2) in the midstream and upstream indicate a rapid loss of carbon stocks, thereby intensifying the regional carbon imbalance.
Landscape pattern analysis further reveals the changing characteristics among the three riverine wetland types. Results show that the landscape connectivity of water bodies has increased significantly. Although mudflats experienced complex fluctuations, their landscape patterns have recently exhibited increased aggregation and reduced fragmentation. In contrast, marshes, which support basin biodiversity, exhibit increasing patch density and fragmentation, accompanied by decreasing core areas. Marshes in the upstream and downstream provide critical habitats for endangered birds, including the black stork, white-tailed eagle, and great bustard, supporting migration, breeding, and foraging, and sustaining intact regional food-web networks (Li et al., 2025). Increasing marsh fragmentation may result in habitat loss and disrupt genetic exchange at the basin scale (Liu et al., 2025a; Sounapoglou et al., 2025). Collectively, these results highlight the lack of targeted wetland management across the entire basin, where current measures remain insufficient to curb the marsh degradation.
The different driving factors for changes in three riverine wetland types
Wetland area dynamics and landscape pattern change across the Yellow River Basin are strongly regulated by hydrological and climatic drivers. Runoff at the Lanzhou station acts as a critical hydrological gate, regulating water body area and landscape patterns by directly controlling water availability and providing fundamental habitat conditions for multiple riverine wetland types. This regulation effect is particularly evident in the arid and semi-arid upstream and midstream of the Yellow River Basin, where limited water resources make runoff a primary constraint on the water body expansion (Gao et al., 2025; Wang et al., 2025; Yu et al., 2021). Temperature and precipitation further enhance water body connectivity and aggregation by regulating basin-scale hydrological cycles and seasonal water redistribution. In contrast, increased sediment discharge at the Huayuankou station increases the spatial complexity of water bodies through sediment accumulation while undermining hydrological continuity (Zhang et al., 2023).
Unlike water bodies, marsh degradation and fragmentation are significantly associated with rising temperature and increasing runoff at the Lanzhou station, indicating a distinct response mechanism to hydroclimatic forcing. One possible explanation is that marshes are highly dependent on soil moisture, and climate warming exacerbates soil water stress by increasing evapotranspiration rates (Hu et al., 2025; Li et al., 2024; Liu et al., 2025b). These processes may cause the loss of edge habitats and shift amphibious and benthic organisms toward patch cores, leading to reduced connectivity and simplified patch shapes. On the other hand, increased runoff at Lanzhou station may cause intensified reservoir releases driven by concentrated precipitation events in the upstream. These changes disrupt the seasonal shallow inundation regimes to which marshes are adapted, altering inundation patterns and constraining marsh habitat availability (Fluet-Chouinard et al., 2023; Mei et al., 2023). This response further reflects the high sensitivity of marshes to climate warming.
Mudflat area shows a significant positive association with sediment discharge at Huayuankou station, indicating that sediment accumulation is the primary driver of mudflat formation. In terms of landscape patterns, sediment discharge causes aggregation of scattered mudflat patches, whereas warming and changes in runoff inhibit mudflat aggregation and increase the shape complexity. Importantly, water-sediment processes explain only 8.2% of the changes in mudflat landscape patterns. Therefore, mudflat landscape change might be primarily influenced by human disturbance. River regulation projects, mudflat reclamation, and other human activities may regulate mudflat area and landscape patterns through sediment redistribution (Dou et al., 2023; Qiu et al., 2024b; Wei et al., 2021), helping to explain the strong interannual fluctuations observed over the past 36 years.
Limitations and prospects
Due to the lack of field-based observations, the 30 m resolution wetland maps derived from limited training samples could not be independently validated. In addition, cloud contamination and sensor heterogeneity in Landsat time-series data may introduce uncertainty, leading to fluctuations in classification accuracy and potential error propagation. Although this study examined the effects of climate change and hydrological processes on wetland area and landscape pattern change, several important driving factors remain unaccounted for. In particular, discrete flood events and short-term high-magnitude hydrological pulses were not explicitly incorporated in this study. While interannual hydrological variability is partially represented through precipitation- and runoff-related indicators, such proxies may not fully capture the rapid geomorphological reshaping effects induced by extreme flooding events. Therefore, future studies should incorporate key natural and anthropogenic drivers, including event-scale flood records, groundwater dynamics, ecological restoration initiatives, hydraulic engineering, and agricultural irrigation. Furthermore, the use of annual-scale data limits the ability to resolve seasonal wetland dynamics. Multi-scale temporal analyses should be employed in future work to resolve seasonal dynamics and regional lag effects, thereby providing scientific support for targeted wetland conservation, ecological restoration, and coordinated management in the Yellow River Basin.
Conclusions
Wetlands play a critical role in maintaining hydrological balance, biodiversity, and carbon cycling in the Yellow River Basin, which is threatened by climate change and human disturbances. However, the long-term change patterns and driving factors of riverine wetland in the Yellow River Basin (excluding the headwater and estuarine regions) remain understudied. By combining a sample migration strategy and Random Forest classification on the GEE platform, we produced the first annual 30 m riverine wetland dataset (1986–2022) for the Yellow River Basin (excluding the headwater and estuarine regions), achieving an average Kappa coefficient of 0.88 and overall accuracy above 90%. We found that riverine wetlands in the Yellow River Basin (excluding the headwater and estuarine regions) have undergone pronounced spatial reorganization under combined climate and anthropogenic pressures, showing an overall pattern of degradation accompanied by localized expansion. Over the past 36 years, water bodies and mudflats increased, whereas marshes, the dominant carbon pool and an important habitat for endangered species, declined markedly and became more fragmented. These contrasting trends were driven by distinct factors: runoff at the Lanzhou station dominates water body expansion, climate warming and increased runoff promote marsh degradation. Mudflats in the midstream are mainly affected by sediment discharge at Huayuankou station and human activities. Management should therefore shift from basin-wide uniform measures toward differentiated, reach-specific strategies, with priority given to marsh conservation and restoration through protection of core patches and maintenance of hydrological connectivity. This study advances long-term riverine wetland landscape research, provides methodological support for long-term and high-resolution mapping, and highlights the necessity of differentiated management strategies across wetland types.
Supplemental material
Supplemental material - Long-term mapping and landscape dynamics of major riverine wetlands in the Yellow River Basin from 1986 to 2022
Supplemental material for Long-term mapping and landscape dynamics of major riverine wetlands in the Yellow River Basin from 1986 to 2022 by Chenxu Wang, Mengqi Qiu, and Yanxu Liu, Suai Wang in Progress in Physical Geography: Earth and Environment
Footnotes
Funding
The authors disclosed receipt of the following financial support for the research, authorship, and/or publication of this article: This research was supported by the National Natural Science Foundation of China (No. 42522105), Ordos Key Science and Technology Program Project (No. YF20250267), the Fundamental Research Funds for the Central Universities of China, and the Ordos Desertification Control and Sustainable Development Academician Expert Workstation.
Declaration of conflicting interests
The authors declared no potential conflicts of interest with respect to the research, authorship, and/or publication of this article.
Supplemental material
Supplemental material for this article is available online.
References
Supplementary Material
Please find the following supplemental material available below.
For Open Access articles published under a Creative Commons License, all supplemental material carries the same license as the article it is associated with.
For non-Open Access articles published, all supplemental material carries a non-exclusive license, and permission requests for re-use of supplemental material or any part of supplemental material shall be sent directly to the copyright owner as specified in the copyright notice associated with the article.