






Abstract
Rainfall-induced landslides are among the main geodynamic processes reshaping the Earth’s surface and causing human and material losses worldwide. In Chile, their spatial analysis remains constrained by the scarcity of systematic inventories, particularly in the Andean Cordillera. In this context, this study presents a novel inventory of rainfall-induced landslides in the Biobío Region during 2023 and 2024, based on the analysis of changes in SAR backscatter from Sentinel-1 imagery processed in Google Earth Engine (GEE), complemented by visual interpretation of Sentinel-2 optical images, GIS-based mapping, and selective field validation. Four intense rainfall events were identified; however, only two of them (June and August 2023) triggered detectable landslides, totaling 55 processes dominated by debris flows and debris avalanches. In contrast, no landslides were detected in association with the 2024 event, which was characterized by lower rainfall intensity in the study area. The strong contrast in landslide occurrence between events provides clear evidence of differences in rainfall magnitude and impact, highlighting the role of rainfall intensity and temporal structure in controlling slope instability. In this sense, landslide occurrence can be interpreted as a direct geomorphic response to rainfall forcing, reflecting the effectiveness of precipitation in triggering slope failure. The results demonstrate the high capability of a multitemporal SAR-based approach to detect rainfall-induced landslides in mountainous environments characterized by dense vegetation cover and complex climatic conditions, validating its applicability in Andean territories. The resulting inventory provides a fundamental baseline for calibrating precipitation thresholds, improving susceptibility, hazard, and risk models, and strengthening monitoring systems under scenarios of intensifying hydroclimatic extremes associated with climate change. It also offers a valuable dataset for the development and training of machine learning models aimed at automated landslide detection and regional-scale hazard assessment.
Keywords
Introduction
Landslide inventories are essential for natural hazard assessment and risk management (Guzzetti et al., 2012). However, in the Chilean Andes the availability of such data remains limited compared to other mountainous regions, such as Europe and Asia (Morales et al., 2022). The National Geology and Mining Service of Chile (SERNAGEOMIN) maintains a national landslide database (Servicio Nacional De Geología y Minería, 2024), although it is mainly concentrated in the Metropolitan Region and in sectors of Patagonia. This lack of detailed information constrains the development of advanced methodologies for landslide identification and susceptibility modeling using Machine Learning and Deep Learning approaches (Maragaño-Carmona et al., 2023; Morales et al., 2022).
Landslides in mountainous environments can generate catastrophic impacts, particularly through the formation of natural dams (Evans et al., 2011). A well-known historical example occurred in 1960, when landslides triggered by the Mw 9.5 earthquake blocked the outlet of Lake Riñihue in the Los Lagos Region, a situation that, in the absence of emergency interventions, could have led to large-scale flooding (Haefele et al., 2003; Universidad De Chile, 2023). In the Biobío Region, ancient landslide-dammed lakes associated with volcanic activity have been documented, as well as subsequent high-energy outburst floods propagating up to 200 km downstream (Abele, 1984; Romero et al., 2022). These antecedents highlight the need to improve the understanding and monitoring of landslide processes in the Andean Cordillera.
Although landslide inventories are indispensable for susceptibility, hazard, and risk studies (Guzzetti et al., 2012), in the Biobío Region records of rainfall-induced landslides have been concentrated almost exclusively in coastal areas (Fustos et al., 2017, 2020; López et al., 2022; López Filun, 2015; Mardones, 1978; Mardones et al., 2004; Servicio Nacional De Geología y Minería, 2024). This spatial focus represents a significant limitation in the context of climate change, as increases in the duration and intensity of extreme precipitation events are projected, which would in turn raise the frequency and magnitude of floods and landslides (IPCC, 2023; Muller, 2024; Pei et al., 2023; Ralph et al., 2020; Zscheischler et al., 2020).
At a macro-regional scale, in the western Andes between 30° and 38° S, wet-season precipitation under warm conditions is expected to occur more frequently, implying a higher future recurrence of landslides and floods (Mardones and Garreaud, 2020).
This study addresses a critical knowledge gap in the Andean Cordillera of the Biobío Region, where a systematic, recent, and spatially consistent inventory of rainfall-induced landslides is currently lacking. The absence of such information has so far hindered the characterization of their spatiotemporal patterns, the assessment of their recurrence and typology, and the proper integration of these processes into susceptibility models and hazard assessments.
The main objective of this study is to conduct the first systematic analysis of rainfall-induced landslides in the Andean sector of the Biobío Region by producing an inventory for the winters of 2023 and 2024 using Synthetic Aperture Radar (SAR)–based techniques. SAR approaches offer clear advantages over optical sensors, as they enable image acquisition regardless of cloud cover and illumination conditions (Jung and Yun, 2020) and provide continuous global time series, improving the temporal and spatial characterization of events (Handwerger et al., 2022). A previous study developed a Google Earth Engine (GEE)–based tool to detect landslides from changes in backscatter intensity through the stacking of multitemporal Sentinel-1 data, avoiding the need to download large data volumes or specialized SAR software and facilitating large-scale landslide detection (Handwerger et al., 2022).
After more than a decade of hydrological drought in Chile (Garreaud, 2023b), the winters of 2023 and 2024 exhibited contrasting meteorological conditions. While 2023 was characterized by extreme rainfall events that triggered landslides from Valparaíso to the Biobío Region (Agouborde and Dote, 2023; Garreaud, 2023a, 2024), the winter of 2024 did not produce significant landslides within the study area. This temporal variability provides an opportunity to evaluate the sensitivity of the multitemporal approach under years with and without geomorphic activity.
In this context, the study explores the potential of multitemporal SAR backscatter analysis using Sentinel-1 imagery to identify rainfall-induced landslides and to analyze the spatial recurrence of these processes in the Andean Cordillera of the Biobío Region. The approach is based on detecting changes in the SAR signal associated with recent events, constructing a geomorphological inventory for the 2023 episode, and performing a temporal comparison of the results in order to assess the stability or persistence of the affected areas.
The generation of this inventory constitutes a key input for advancing the understanding of the recent geomorphological dynamics of the Andean Cordillera of the Biobío Region and is particularly relevant in the context of global warming, which, as noted above, has direct implications for landslide risk and territorial planning.
Study area
The study area corresponds to the mountainous system of the Andean Cordillera in the Biobío Region, Chile, located between 36°59′ and 38°19′ S and 70°58′ and 71°45′ W, in the eastern sector of the region (Figure 1). It covers an approximate area of 6,387 km2, equivalent to nearly one quarter of the Biobío River basin, and is characterized by a low population density (0.3% of the regional population according to the 2017 census). Study area; (a), (b) location; (c) Geological Map (adapted from Servicio Nacional De Geología y Minería (2019)). The main geological units are Q1 – Pleistocene–Holocene, continental sedimentary deposits (alluvial, colluvial, landslide); Q1g – Pleistocene–Holocene, continental sedimentary moraine, fluvioglacial and glaciolacustrine deposits; Q3av – Quaternary, continental volcano-sedimentary volcanic avalanche deposits; Q3i – Quaternary, volcanic strata and volcanic complexes; Pl3 – Pleistocene, volcanic lava sequences and basic to intermediate volcanic centers; Pl3t – Pleistocene, volcanic rhyolitic pyroclastic deposits; PPl3 – Pliocene–Pleistocene, continental volcano-sedimentary sequences and partially eroded volcanic centers; M3i – Lower–Middle Miocene, volcanic complexes and erosional volcanic sequences; Mg – Miocene (18–6 Ma), plutonic granodiorites, diorites and tonalites; Mimg – Lower–Middle Miocene (22–16 Ma), plutonic granodiorites, monzogranites, monzodiorites, monzonites and biotite–hornblende diorites; OM2c – Oligocene–Miocene, volcano-sedimentary sequences; KT2 – Upper Cretaceous–Lower Tertiary, volcano-sedimentary sequences. For interpretation of the references to colours in this figure legend, refer to the online version of this article.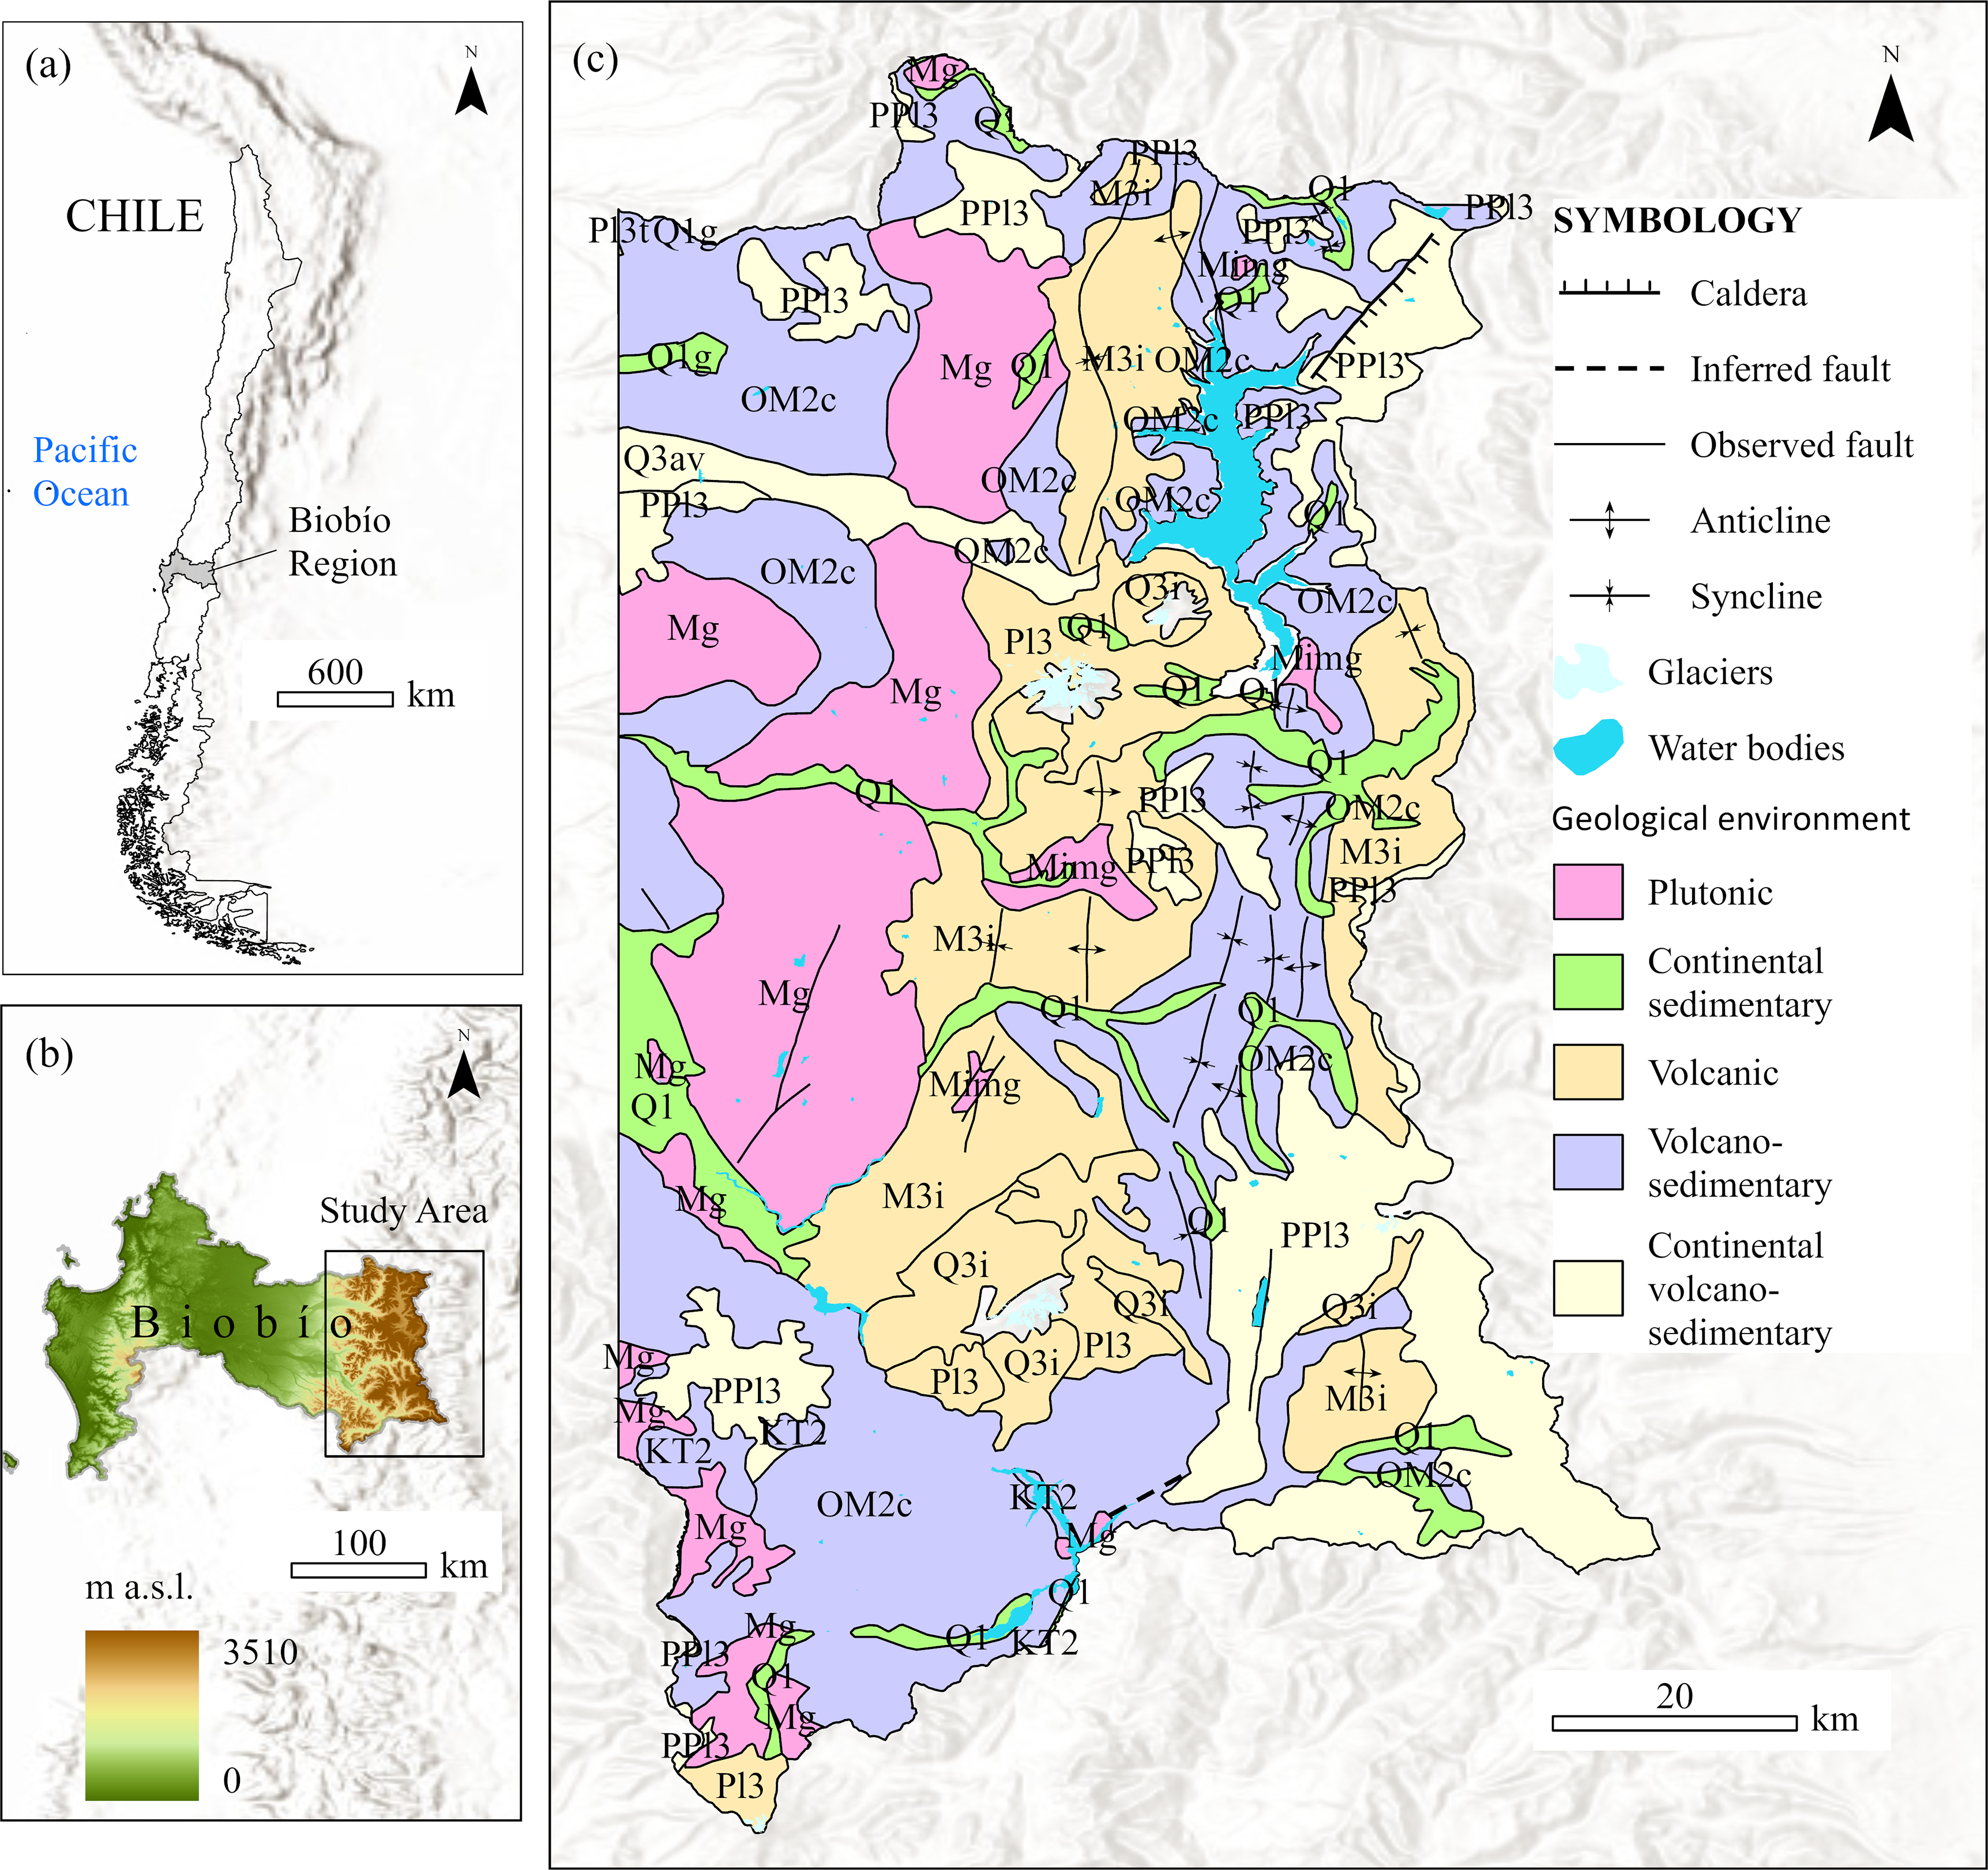
The topography is dominated by intermediate and high elevations: 73% of the territory lies between 1,000 and 2,000 m a.s.l., followed by 19% between 300 and 1,000 m a.s.l. Areas above 2,000 m a.s.l. Account for approximately 8% of the total, where major volcanic edifices such as Antuco, Sierra Velluda, Copahue, and Callaqui are present, many of them with glacier cover.
Geologically, the study area is part of the Andean domain and is dominated by Neogene to Quaternary volcano-sedimentary sequences associated with the evolution of the Andean volcanic arc in south-central Chile (Servicio Nacional De Geología y Minería, 2019). Structurally, it belongs to the Andean fold-and-thrust belt along the western margin of South America (Folguera et al., 2018), where compressional deformation has generated regional-scale folds and thrust systems that influence relief development and drainage patterns.
The most extensive units correspond to Miocene to Pleistocene volcano-sedimentary sequences (M3i, OM2c, and PPl3), composed of basaltic to dacitic lavas, pyroclastic deposits, and volcaniclastic materials, reflecting a complex volcanic evolution with partially eroded centers. These units coexist with Miocene intrusive bodies (Mg and Mimg), represented by granodiorites, diorites, tonalites, and monzogranites, which have a more limited spatial distribution.
The Quaternary volcanic record includes pyroclastic deposits (Pl3, Pl3t), lavas of variable composition ranging from basaltic to rhyolitic (Q3i), and deposits associated with volcanic avalanches (Q3av), indicating relatively recent volcanic activity. Overlying these units are Quaternary surficial deposits (Q1 and Q1g), including colluvial, alluvial, fluvioglacial, and morainic sediments that occupy valley bottoms and lower slope sectors.
From a geomorphological perspective, this geological configuration—characterized by contrasting lithological competence, widespread weathering, and the presence of unconsolidated Quaternary deposits—interacts with a deeply incised glacial–fluvial landscape, resulting in steep slopes and abundant loose material. The area includes glacio-volcanic valleys, lahar deposits, talus slopes, and zones of seasonal snow accumulation, where heterometric and poorly consolidated materials are widespread (Börgel O., 1965; Thiele et al., 1998). Glacial processes have generated steep topography with abundant debris, which has subsequently been reworked by fluvial dynamics, further enhancing slope instability and susceptibility to gravitational processes (Hauser Yung, 2000).
These lithological contrasts have important implications for slope stability. Volcanic and volcano-sedimentary units, composed of interbedded lavas, pyroclastic deposits, and volcaniclastic materials, are characterized by strong internal heterogeneity and the presence of weak or poorly consolidated layers, which favor the development of preferential failure planes. These lithologies have been widely associated with high landslide occurrence in the Andes, particularly under seismic triggering conditions (Serey et al., 2019). In contrast, intrusive rocks such as granodiorites, diorites, tonalites, and monzogranites commonly develop thick weathered mantles and residual soils with plastic behavior, which can significantly reduce shear strength on slopes exceeding ∼20° (Guajardo, 1980; Mardones, 1978; Mardones et al., 2004; Mardones and Vidal, 2001).
The climate is of a temperate Andean type, dominated by the seasonal influence of the South Pacific Anticyclone (Barria et al., 2019). Precipitation is concentrated between May and September, with annual totals ranging from 700 to 2,100 mm, while mean temperatures vary between 3 and 11°C depending on elevation (Sarricolea et al., 2017). Interannual climate variability is primarily controlled by ENSO and the Southern Annular Mode (SAM), whereas interdecadal variability is associated with the Pacific Decadal Oscillation (PDO). Between 1958 and 2018, an increase of approximately 114 ± 21 m in the equilibrium-line altitude was recorded, evidencing the influence of climate change on the Andean cryosphere (Mardones and Garreaud, 2020).
Materials
Intense rainfall events (2023–2024)
Intense rainfall events were identified using hourly precipitation records from six gauging stations located within or immediately adjacent to the study area in the Biobío Andes. These stations belong to the Chilean General Water Directorate (DGA) and the Chilean Meteorological Directorate (DMC), and include Río Diguillín en San Lorenzo, Bío Bío en Llanquén, Embalse Ralco, Embalse Pangue, Puente Nitrao, and Termas de Chillán. Data were obtained from the Vismet platform of the Center for Climate and Resilience Science (CR2), which provides quality-controlled hourly precipitation series (Center for Climate and RR, 2024).
For each station, 72-h accumulated precipitation and hourly intensity metrics were computed for all rainfall events between 2023 and 2024, including total precipitation, maximum hourly intensity, and rainfall duration. This approach allows the identification of both long-duration and short-duration high-intensity events, which are known to exert a strong control on landslide triggering (Bogaard and Greco, 2018; Brunetti et al., 2010; Segoni et al., 2018). On this basis, four events were selected for detailed analysis considering total precipitation, peak hourly intensity, spatial consistency among stations, and documented impacts (e.g., reported landslides) (Agouborde and Dote, 2023; Garreaud, 2023a, 2024). These events were subsequently used as input for the Sentinel-1 SAR change detection workflow. To facilitate the management and processing of Sentinel-1 imagery across the 6,387 km2 study area, the territory was subdivided into 16 subareas according to the 1:50,000-scale Grid G of the Military Geographic Institute (Instituto Geográfico Militar, 2025). The location of the meteorological stations and the resulting spatial framework are shown in Figure 2. Subdivision of the study area (6,387 km2) into 16 subareas based on the 1:50,000-scale Grid G of the Instituto Geográfico Militar (IGM). The grid provides a spatial framework for organizing the analysis and aggregating results across the Biobío Andes. Each grid cell is identified by its alphanumeric code and corresponding official topographic sheet name: G009 (Colonia Santa Lucía), G010 (Puntilla Chillán), G011 (Cuatro Juntas), G020 (Antuco), G021 (Laguna de la Laja), G022 (Rincón Pichicoyahue), G031 (Cordillera Tricauco), G032 (Queuco), G033 (Trapa-Trapa), G042 (Biobío), G043 (Volcán Callaqui), G044 (Volcán Copahue), G052 (Cordillera de Pemehue), G053 (Lolco), G054 (Ranquil), and G064 (Malalcahuello). For interpretation of the references to colours in this figure legend, refer to the online version of this article.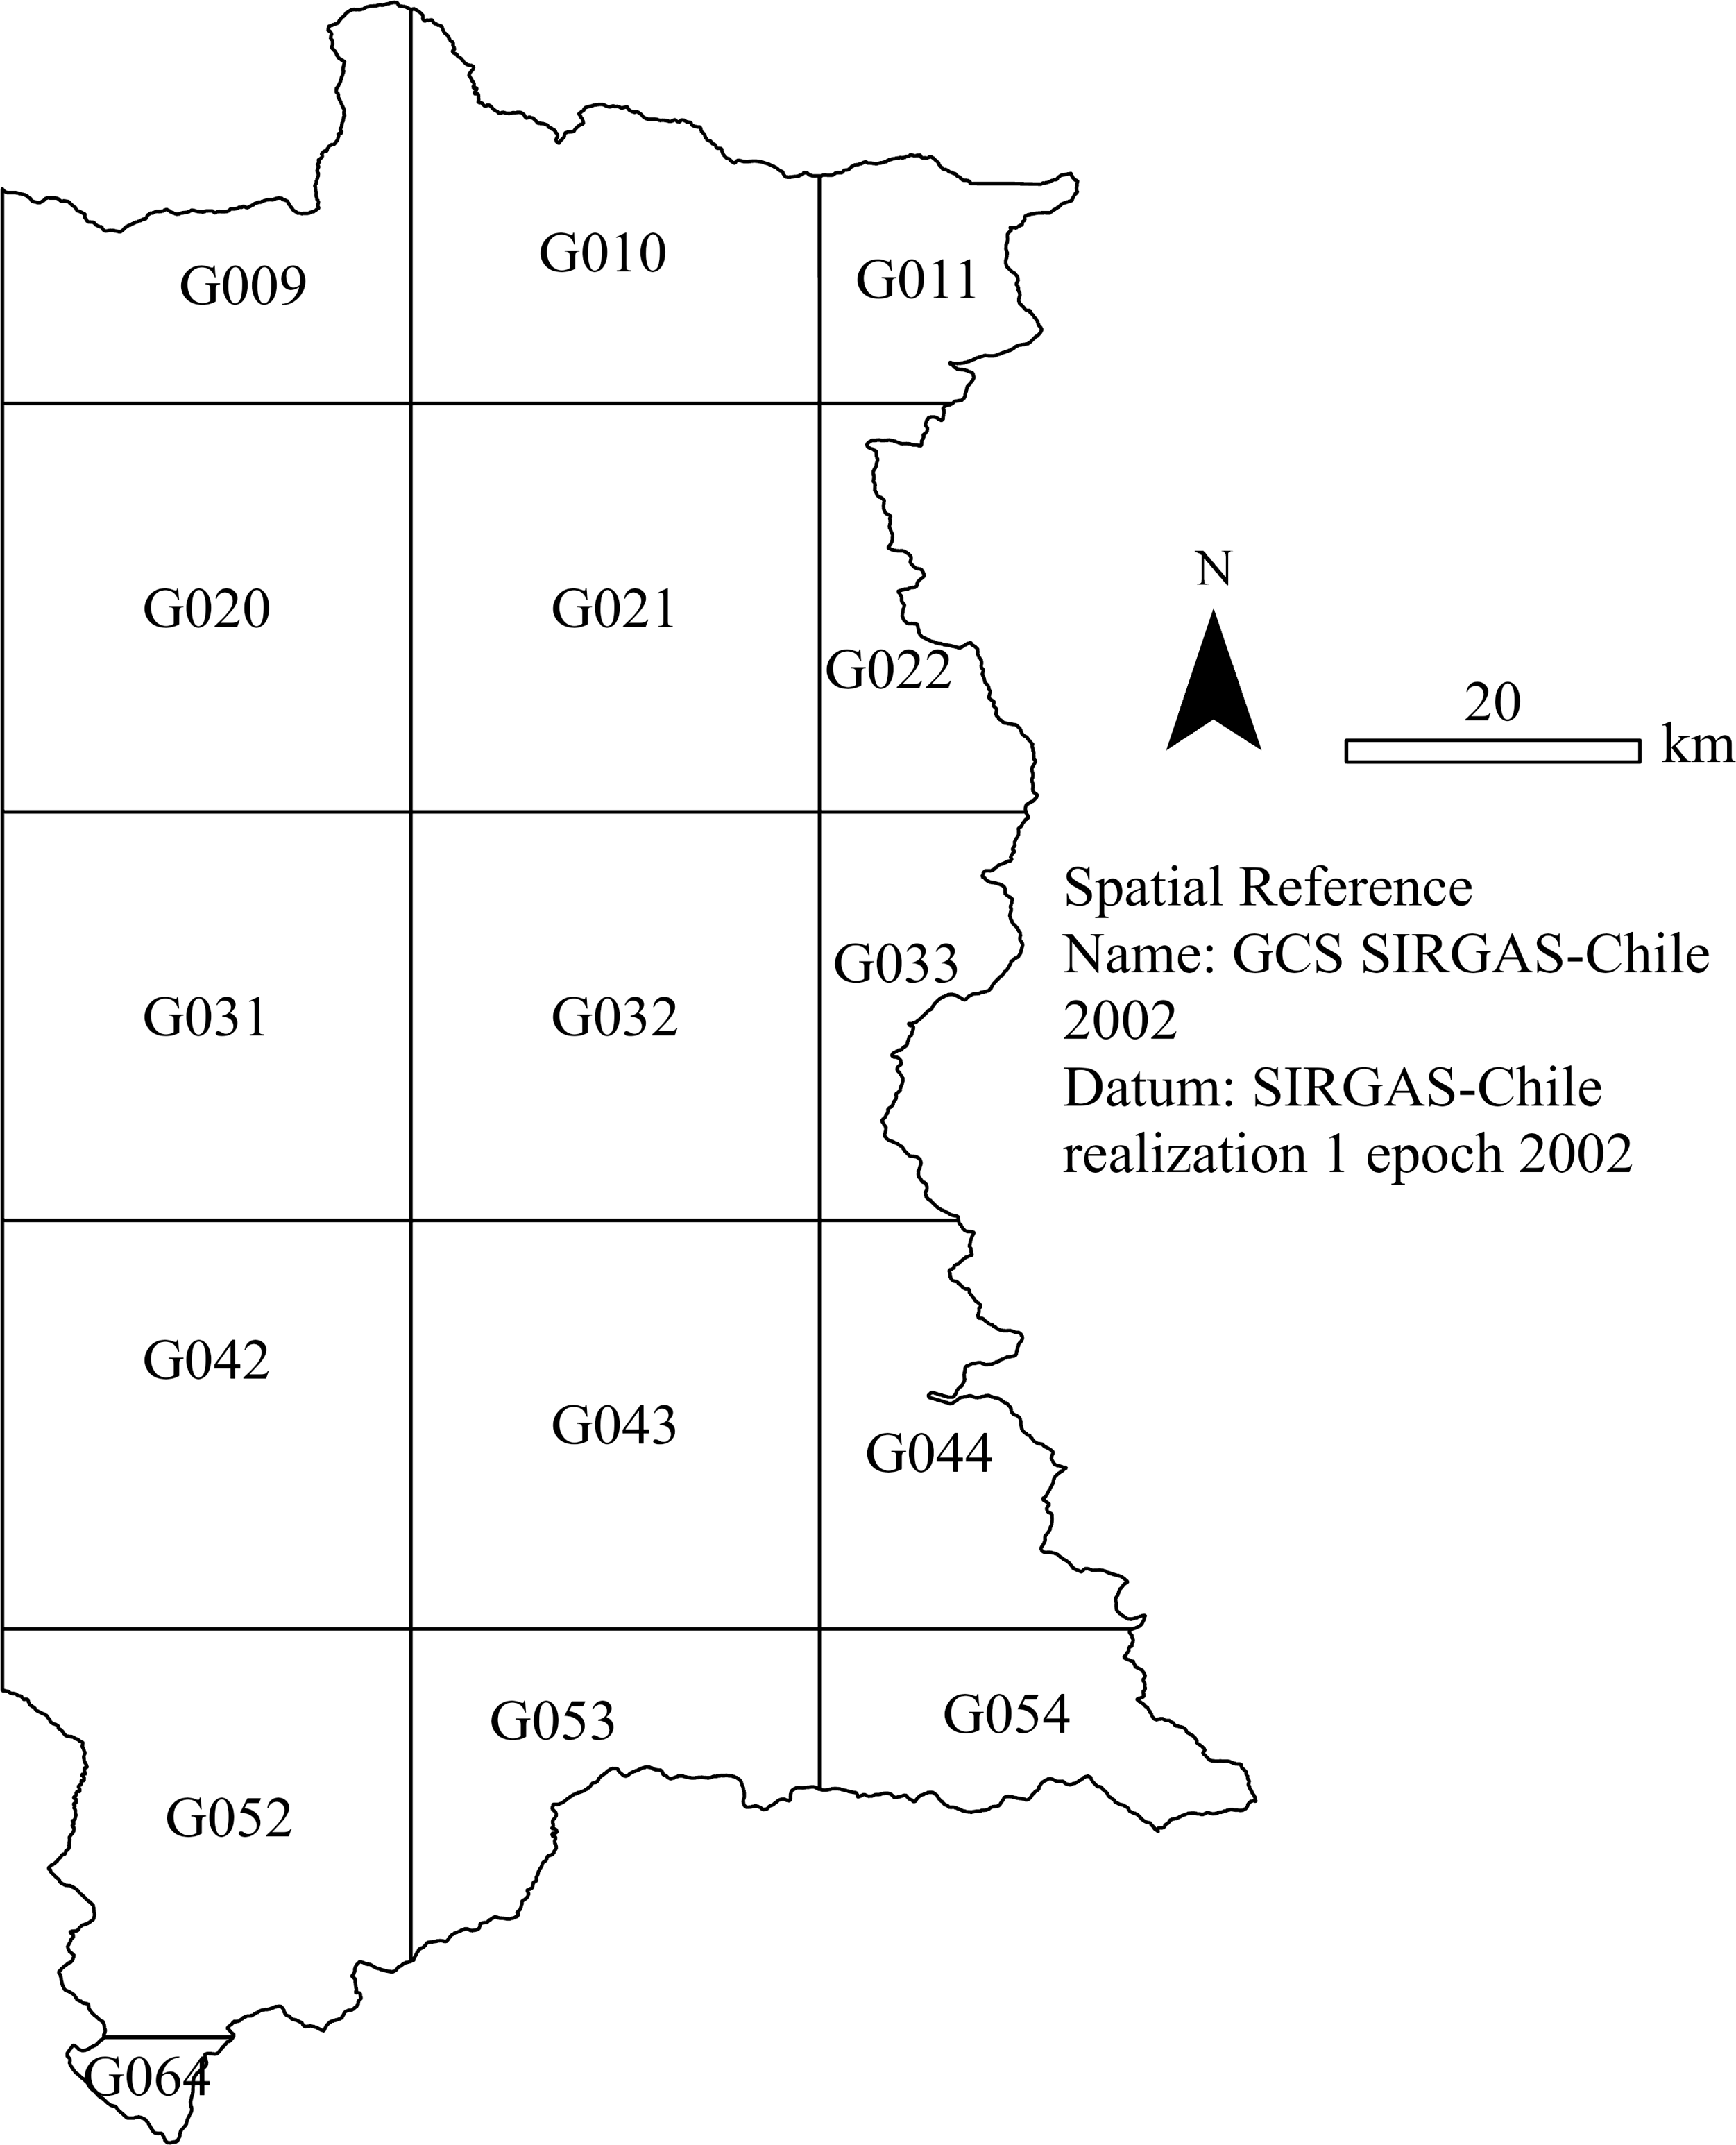
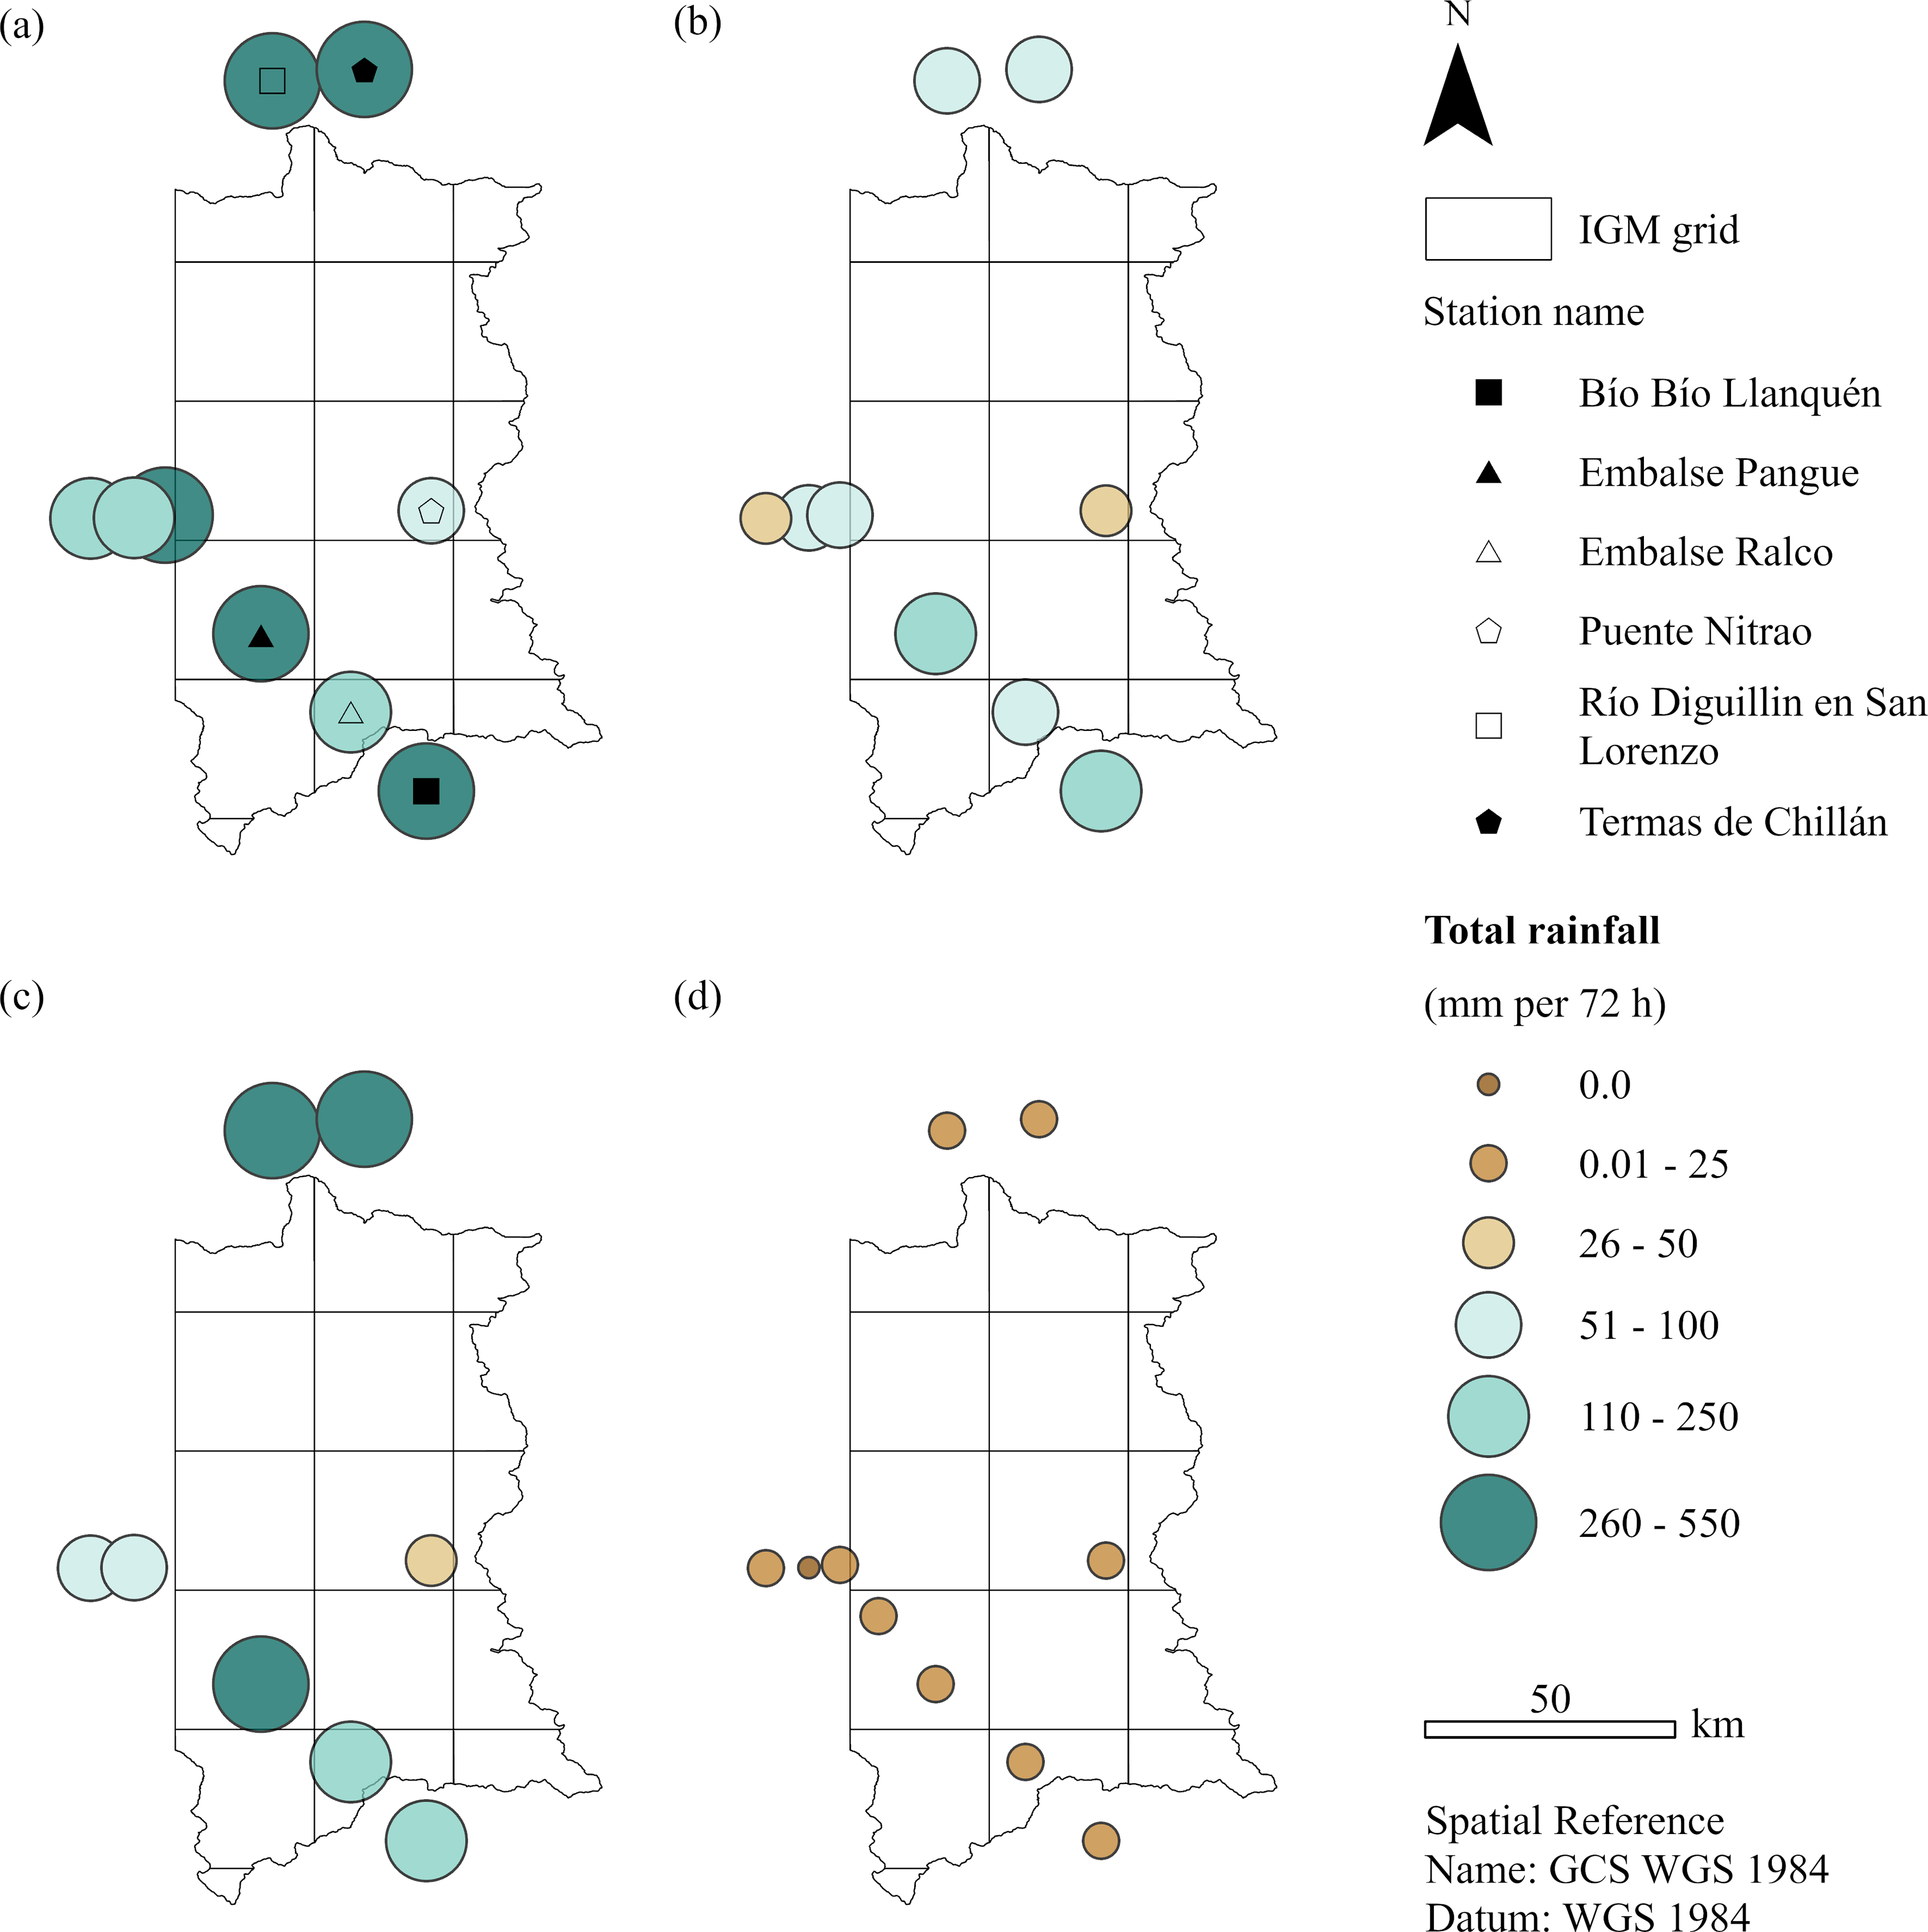
The selected events were characterized according to their temporal evolution, spatial distribution, and rainfall intensity metrics, as shown in Figures 3–5 and summarized in Table 1. Hourly rainfall intensity at Embalse Pangue station for the four analyzed events (2023–2024). Events 1 and 3 show higher intensity peaks compared to Events 2 and 4. The black line represents a 3-h moving average. For interpretation of the references to colours in this figure legend, refer to the online version of this article. Spatial distribution of 72-h accumulated precipitation for the four rainfall events in the Biobío Andes. Colors range from brown (dry) to blue (wet), and station symbols are scaled by precipitation amount. Events 1 and 3 show higher and more spatially consistent precipitation compared to Events 2 and 4. The 72-h accumulation periods were defined retrospectively from the peak of each event, corresponding to 25 June 2023 (Event 1), 21 July 2023 (Event 2), 21 August 2023 (Event 3), and 20 June 2024 (Event 4), all at 23:00 local time. For interpretation of the references to colours in this figure legend, refer to the online version of this article. Multi-station hourly rainfall intensity for the four analyzed events (2023–2024). Events 1 and 3 show consistently higher intensity peaks across stations, whereas Events 2 and 4 are characterized by lower and more diffuse intensity patterns. Peak values reach 16.5 mm h−1 and 16.0 mm h−1 during Events 1 and 3, respectively. See Figure 6 for station locations. For interpretation of the references to colours in this figure legend, refer to the online version of this article. Summary of rainfall characteristics for the four analyzed events, including duration, total precipitation, and intensity metrics derived from multi-station hourly records.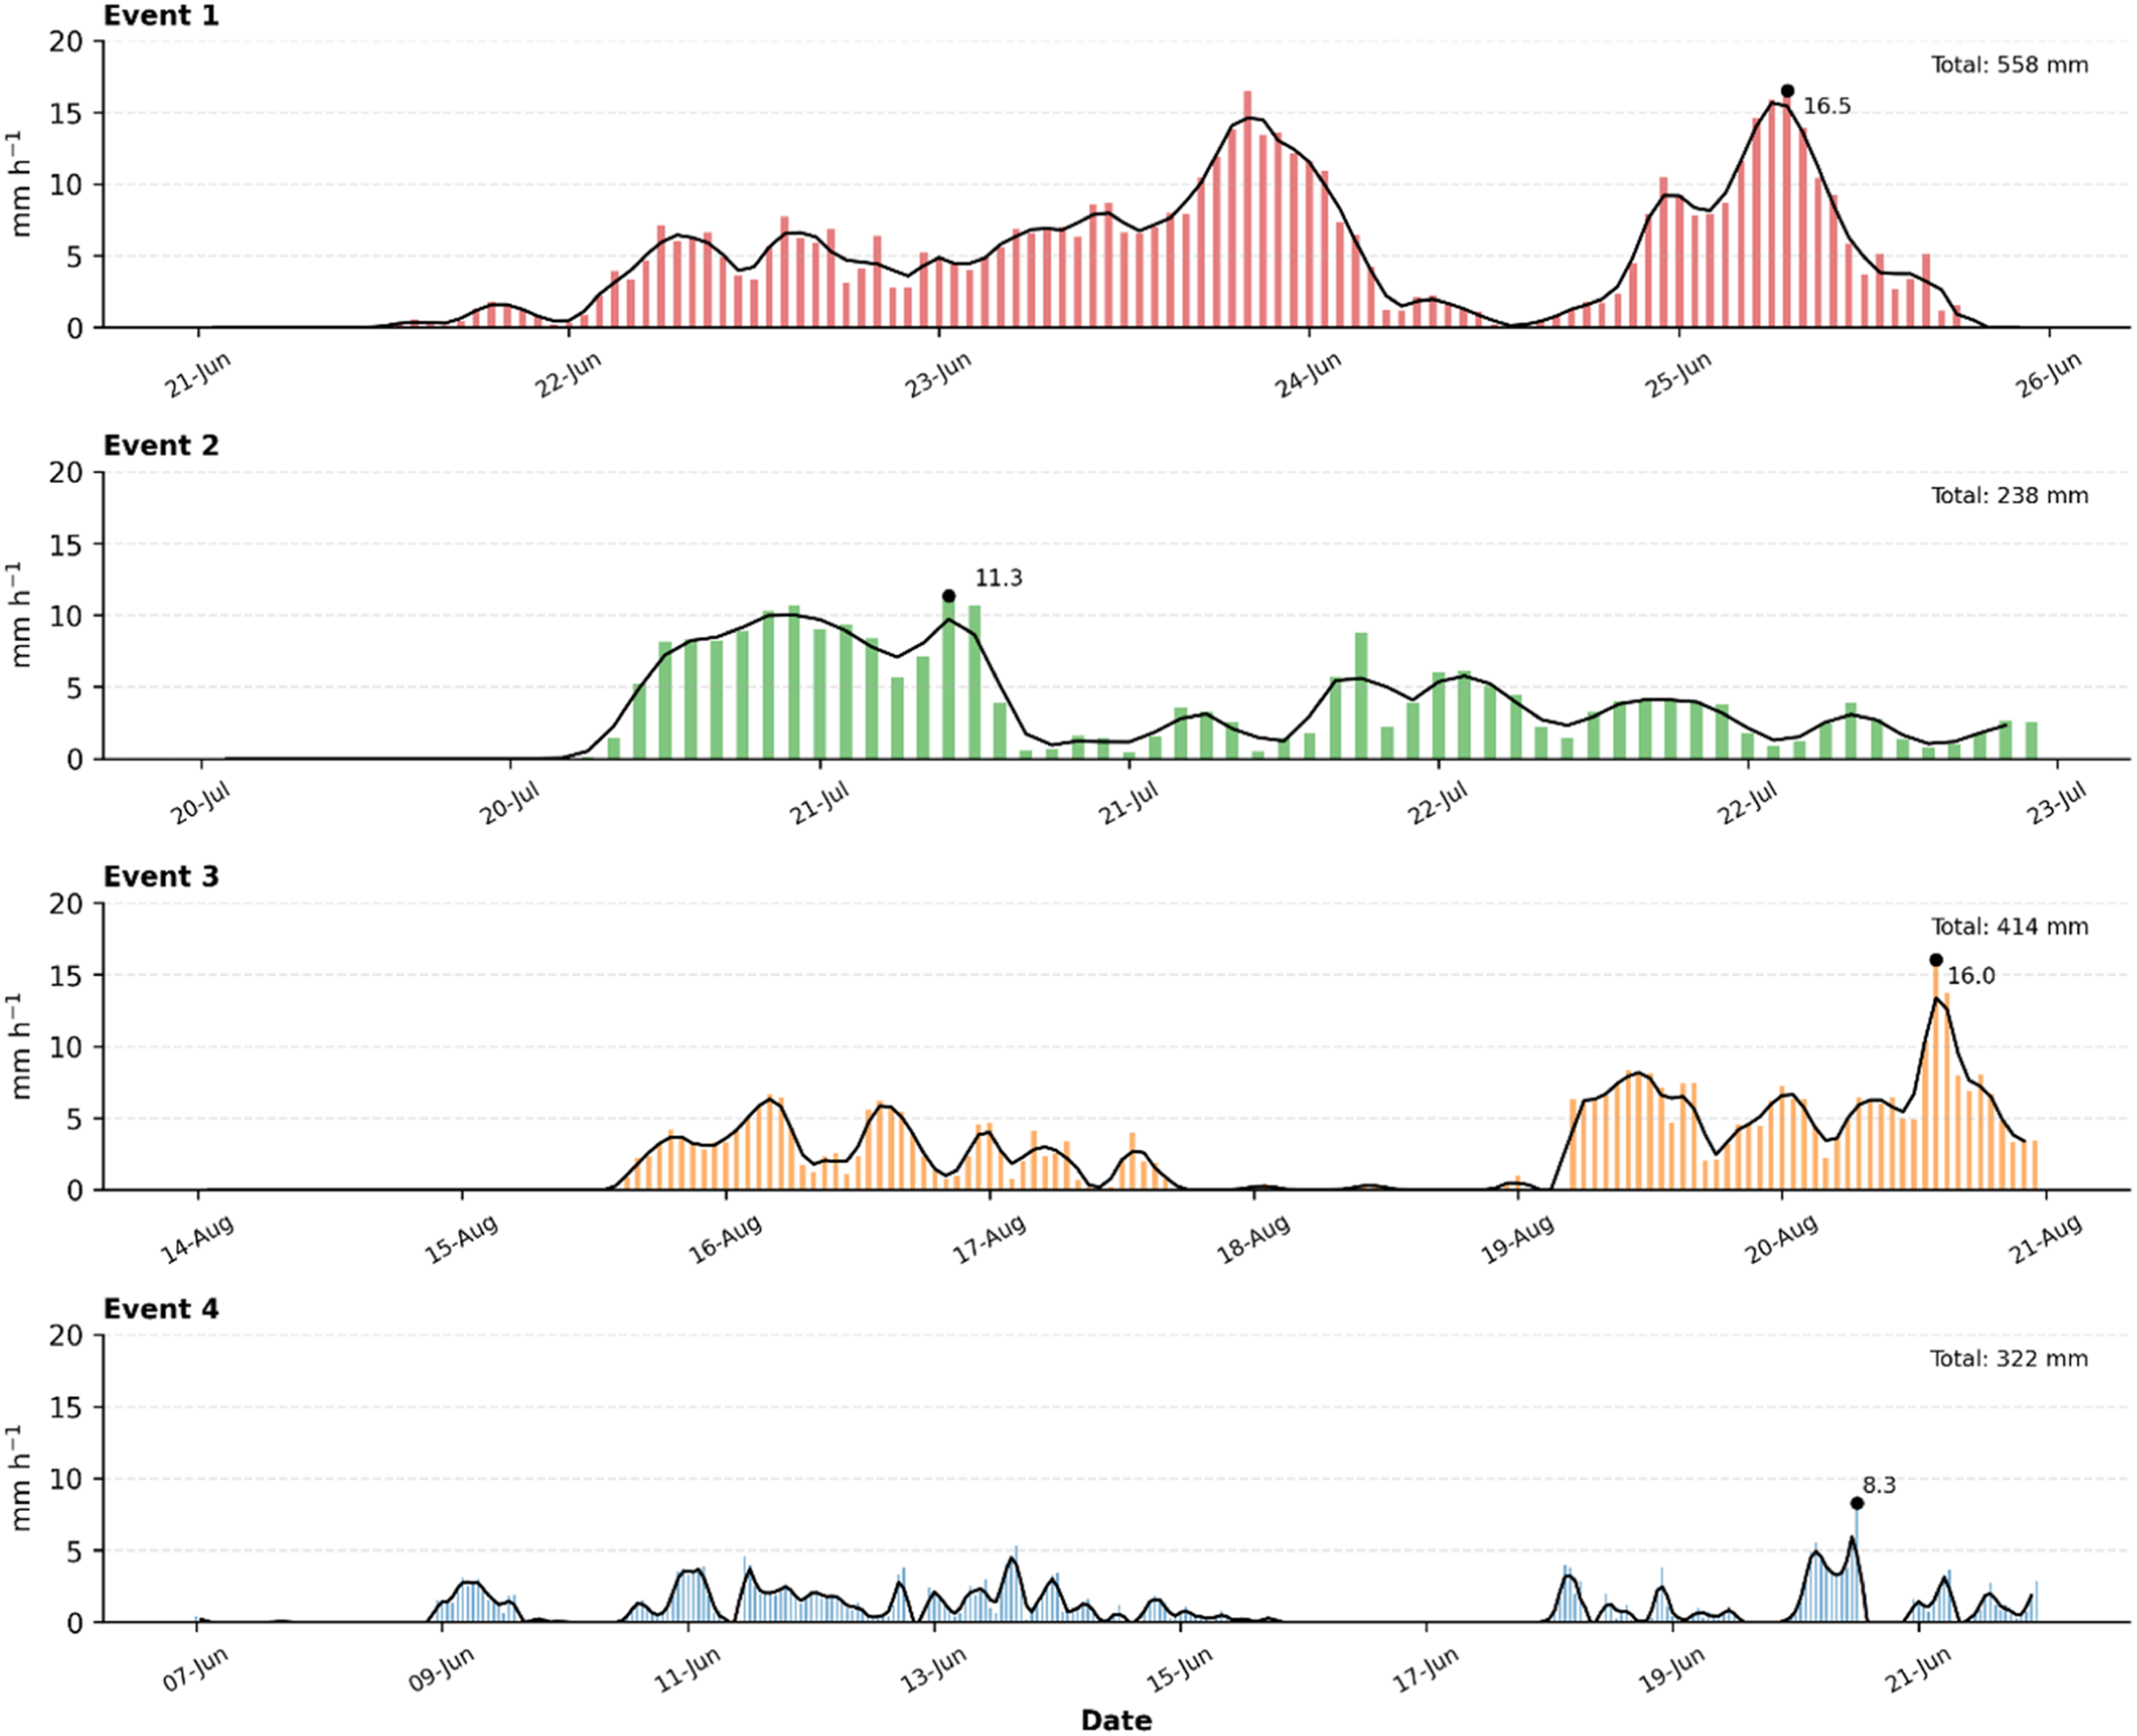
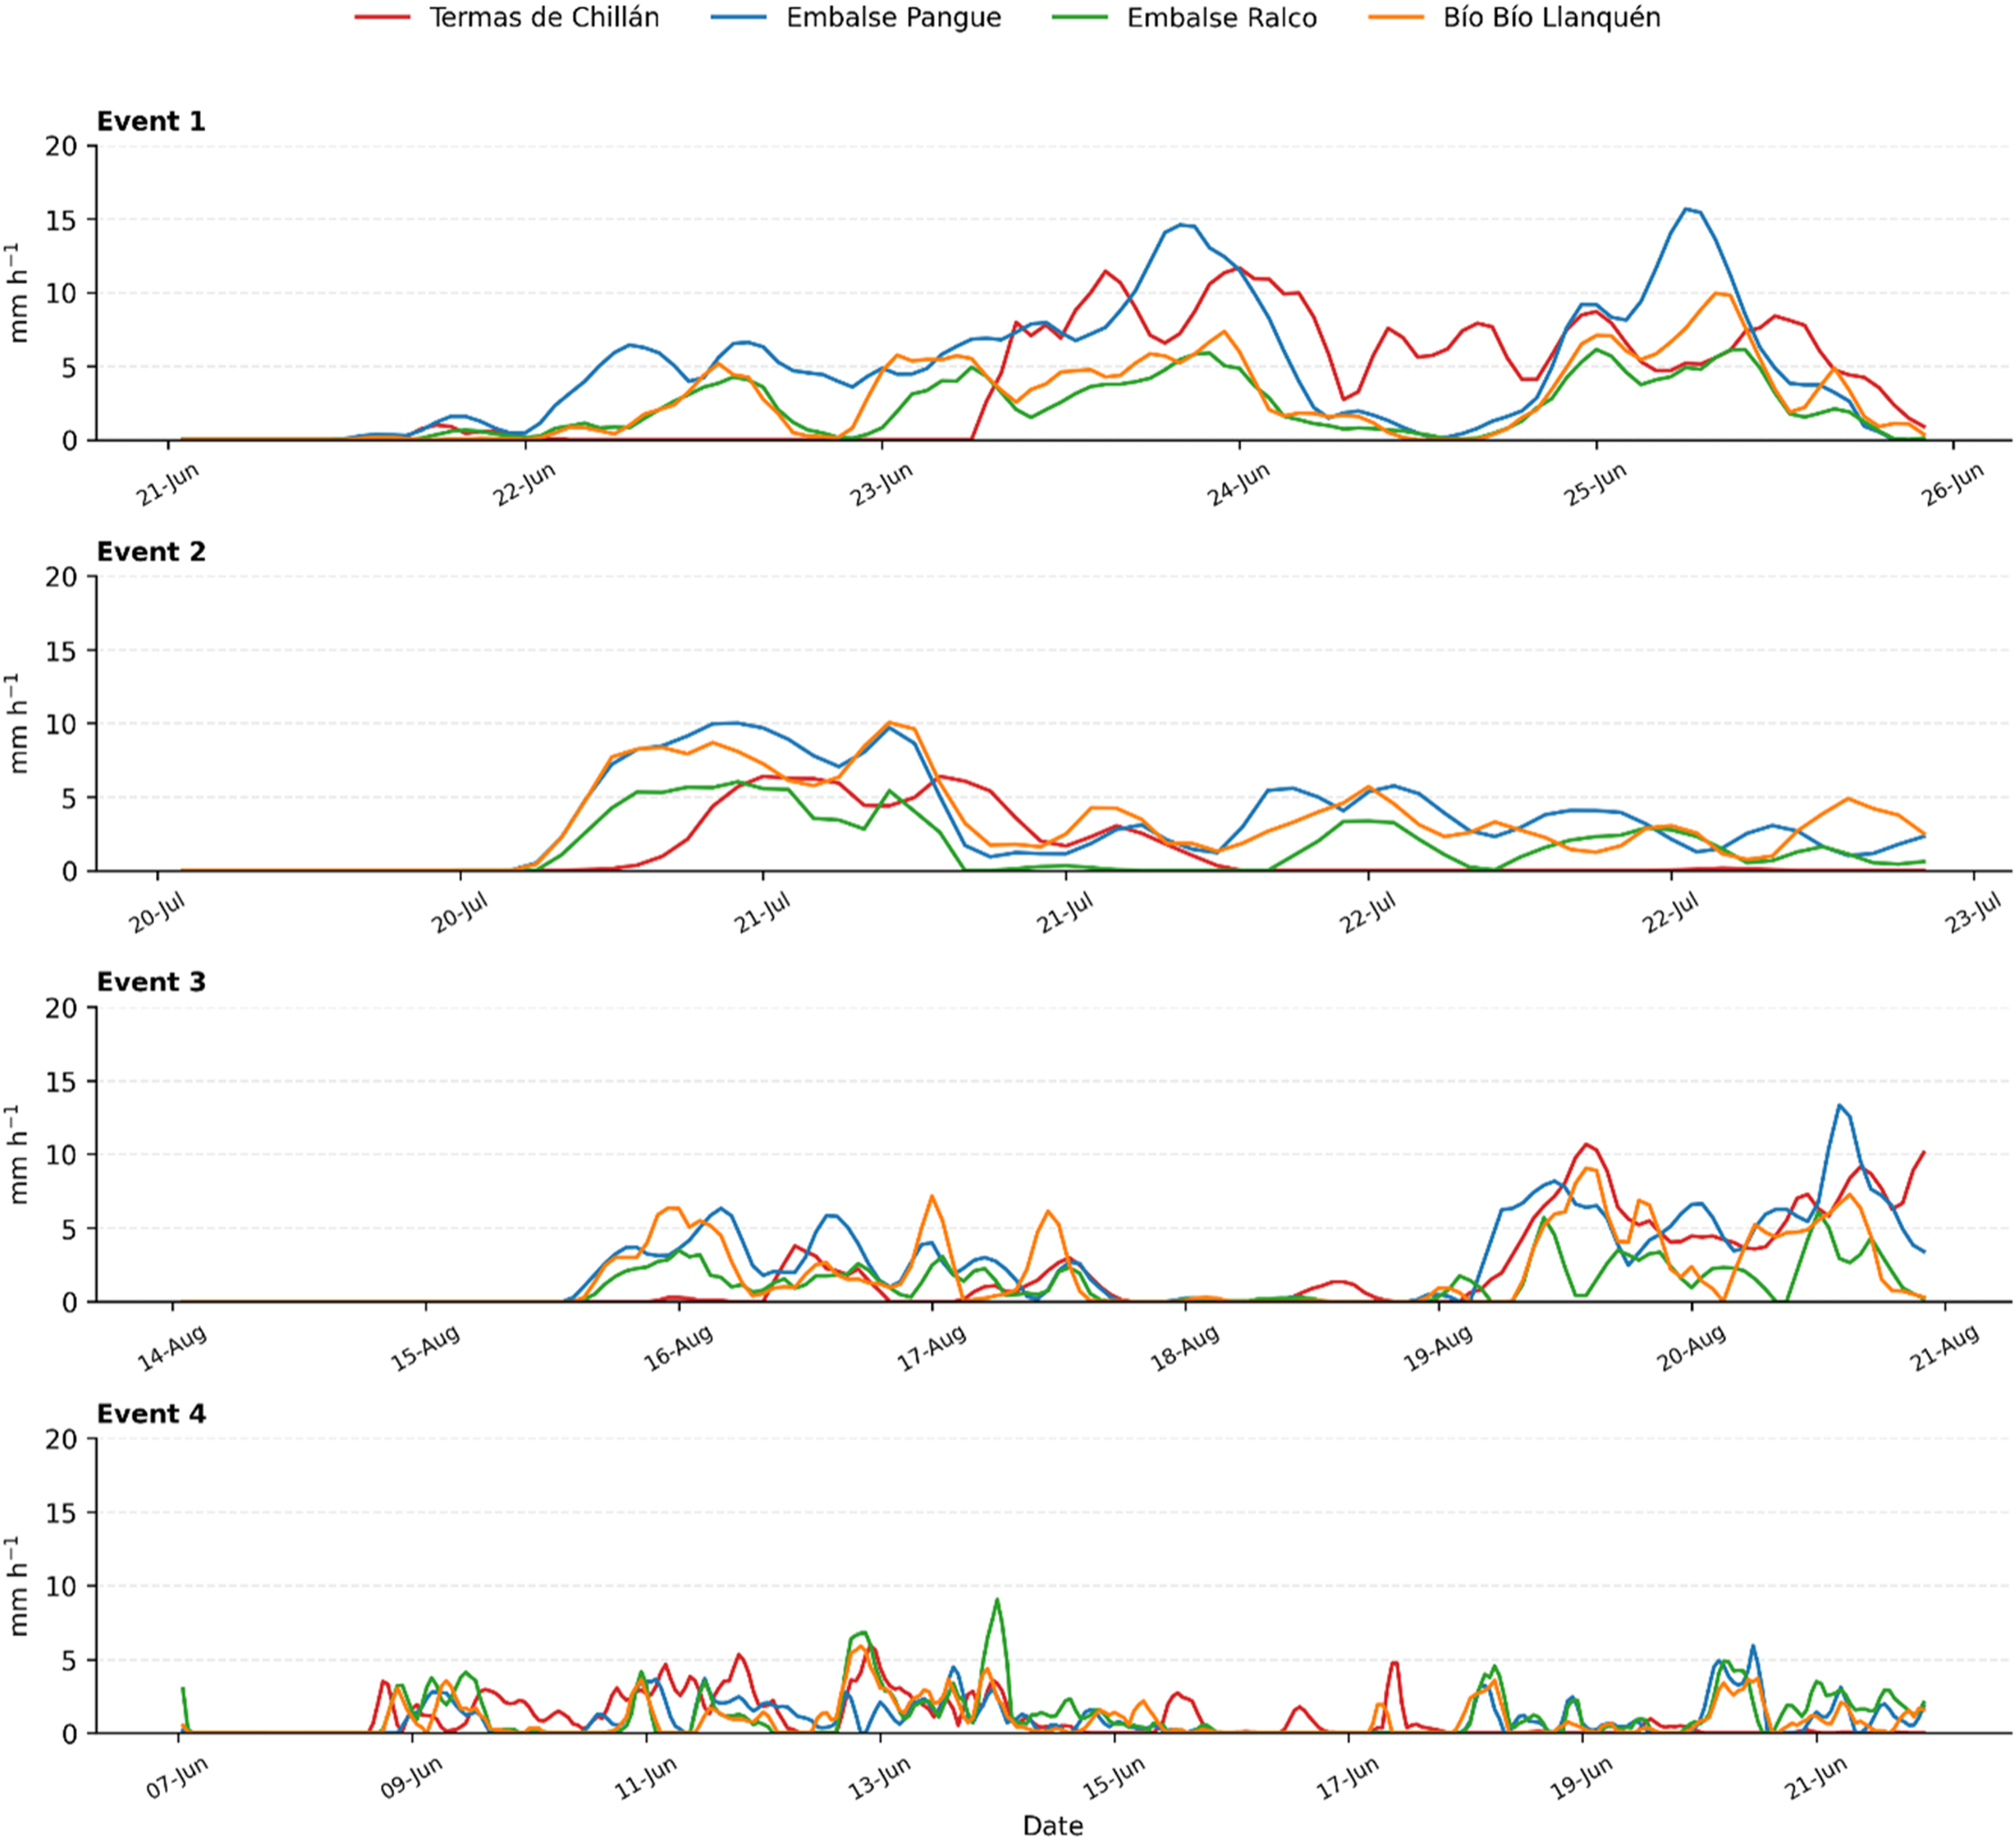
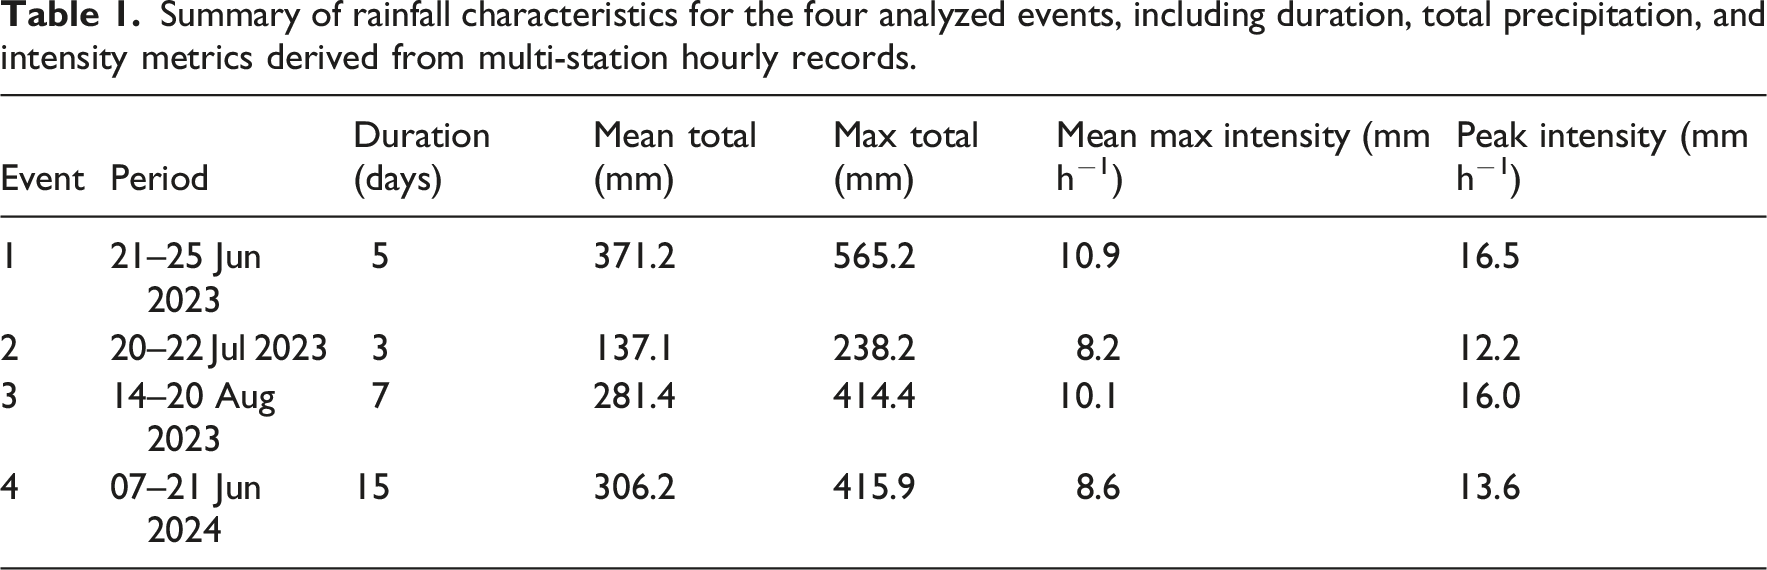
Clear differences in rainfall structure were observed among the events, particularly in terms of intensity and duration. Events 1 and 3 were characterized by higher rainfall intensities, with peak values exceeding 16 mm h−1 and sustained precipitation over extended periods. Event 3 additionally exhibited multiple intensity peaks, indicating a prolonged and dynamic rainfall regime. In contrast, Event 2 was shorter and less intense, whereas Event 4 was dominated by a long-duration, low-intensity regime, lacking pronounced intensity peaks despite relatively high cumulative precipitation.
These contrasts are consistently observed across all datasets. Temporal patterns (Figure 3) show sharper and more concentrated intensity peaks for Events 1 and 3, while spatial distributions, as shown in Figure 4, indicate more homogeneous and widespread precipitation across the Andean sector during these events. The multi-station comparison (Figure 5) and summary statistics (Table 1) further confirm that Events 1 and 3 exhibit the highest peak and mean intensity values, whereas Events 2 and 4 are characterized by lower intensities despite comparable total precipitation in some cases.
Overall, the selected rainfall events exhibit contrasting combinations of total precipitation, rainfall intensity, and temporal structure. This variability provides a suitable framework for evaluating the relationship between rainfall characteristics and the occurrence of rainfall-induced landslides in the Biobío Andes.
Sentinel-1 SAR imagery and temporal analysis periods
Number of SAR images per event and period.
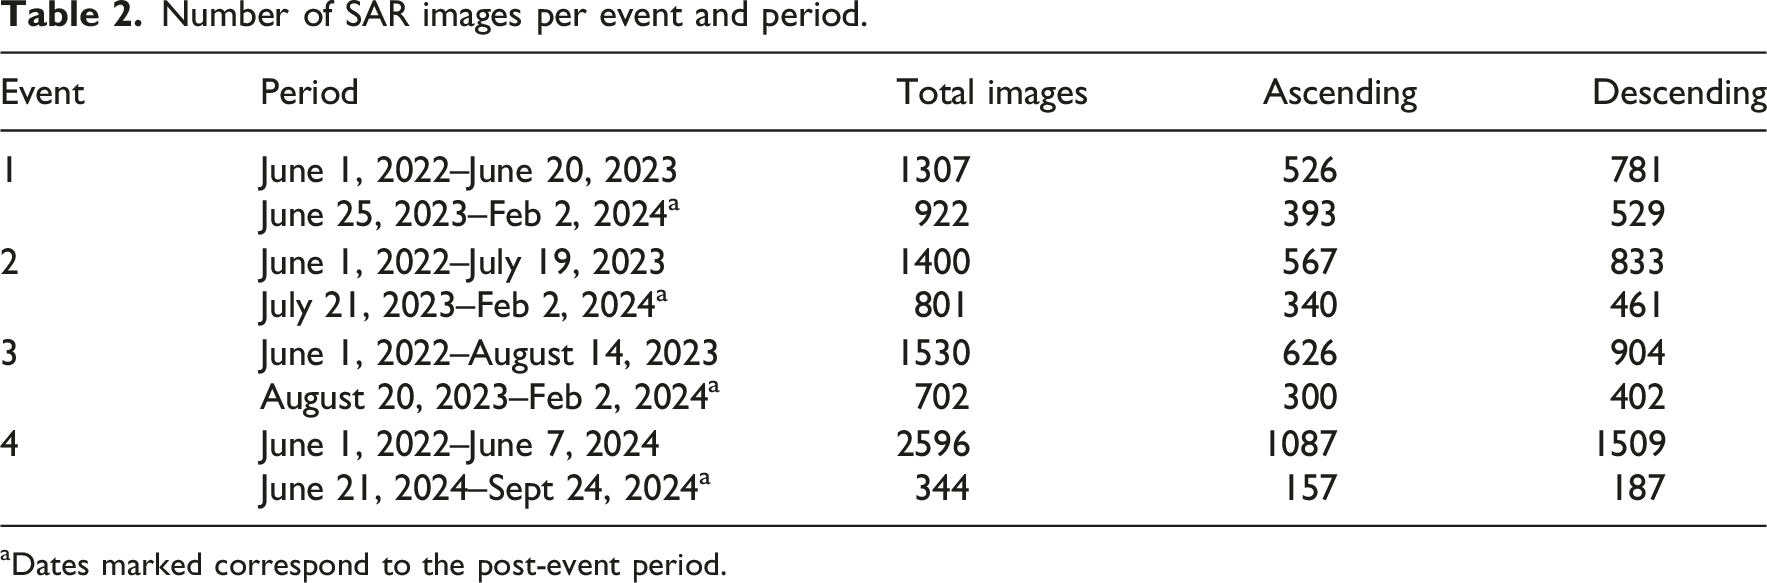
aDates marked correspond to the post-event period.
The multitemporal analysis was based on stacking a large volume of Sentinel-1 SAR images acquired in both ascending and descending orbits. In all cases, the number of images was sufficient to construct robust temporal medians, enhancing the signal-to-noise ratio and improving the sensitivity of the
The combined use of ascending and descending orbits further helped to reduce geometric distortions related to SAR acquisition in mountainous terrain, thereby increasing the reliability of the results.
Method
Rainfall-induced landslides were characterized through a multitemporal geomorphological inventory aimed at identifying morphological changes, associating them with precipitation events, and assessing their spatial recurrence. The methodology integrates automated detection of SAR backscatter variations using Sentinel-1 imagery processed in Google Earth Engine, visual interpretation based on Sentinel-2 optical imagery and high-resolution data sources, and validation through field-based geomorphological mapping (Figure 6). Flowchart; (a) Detection of landslides; (b) Development of the geomorphological inventory; (c) Analysis of the data obtained. For interpretation of the references to colours in this figure legend, refer to the online version of this article.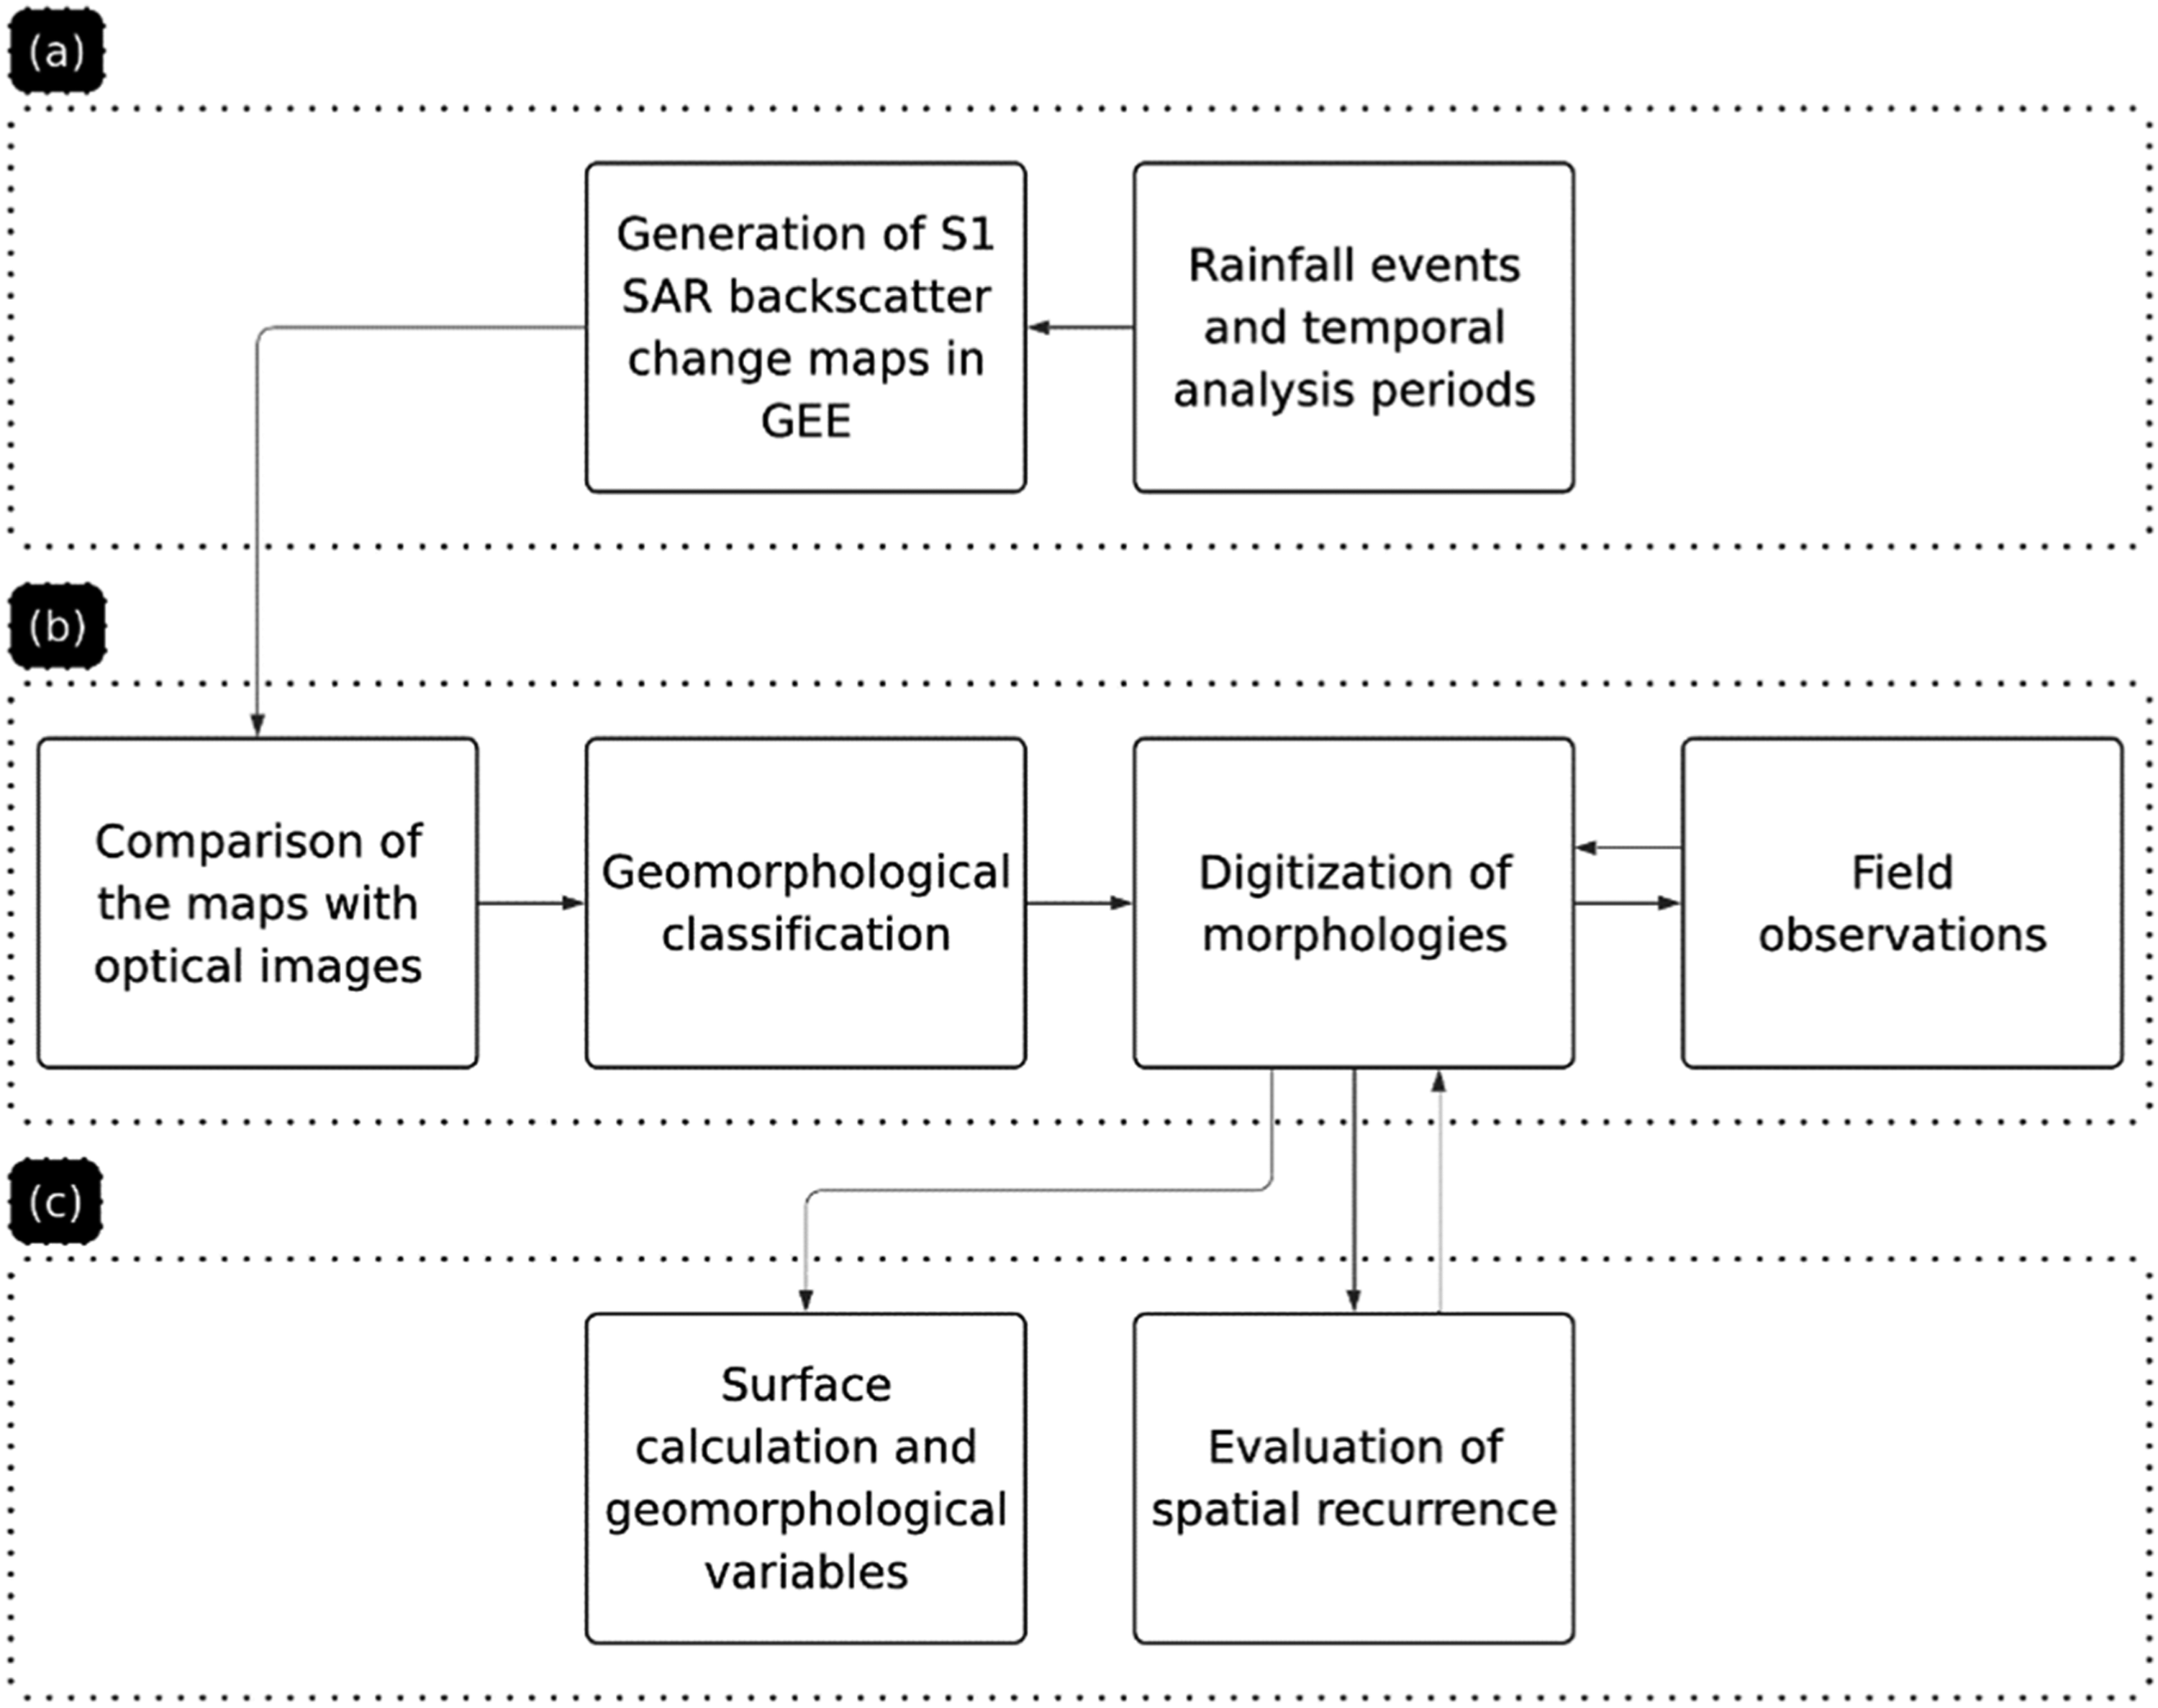
Detection of landslides
Synthetic Aperture Radar (SAR) is an active remote sensing system that transmits microwave pulses and records the signal backscattered by the Earth’s surface, enabling observations independent of cloud cover and illumination conditions (NASA Applied Remote Sensing Training Program (ARSET), 2017; Strahler, 2013). Unlike real-aperture radar, SAR exploits the motion of the sensor platform to enhance spatial resolution through Doppler frequency analysis, allowing the generation of high-resolution imagery without the need for large physical antennas (Van Zyl and Kim, 2010).
The radar signal provides information in terms of amplitude and phase. Amplitude is expressed as the backscatter coefficient, whereas phase can be used in interferometric techniques such as InSAR and DInSAR, which are applied to monitor slow ground deformations (Fustos et al., 2017; García-Davalillo et al., 2014; NASA Applied Remote Sensing Training Program (ARSET), 2017). However, these techniques present limitations for detecting small- and medium-sized landslides due to geometric, resolution, and processing constraints (Guzzetti et al., 2012).
In recent years, an alternative approach has been developed based on the detection of changes in SAR backscatter through multitemporal analysis, using stacks of pre- and post-event images (Handwerger et al., 2022; Nugroho et al., 2021; Peters et al., 2024). This method offers key advantages: (i) it enables the detection of landslides in densely vegetated mountainous regions, where optical methods are less effective (Handwerger et al., 2022; Jung and Yun, 2020), and (ii) it relies on freely available data accessed through Google Earth Engine (GEE), facilitating large-scale processing (Nugroho et al., 2021).
Backscatter depends on both sensor characteristics (frequency, incidence angle, polarization) and surface properties, including dielectric constant, roughness, and object structure (NASA Applied Remote Sensing Training Program (ARSET), 2017; Ungvarsky, 2023). In this study, Sentinel-1 GRD images were used, radiometrically calibrated and orthorectified, with a spatial resolution of 10 m and values expressed in decibels (dB). Cross-polarized VH data were prioritized due to their sensitivity to changes in vegetation cover and surface structure, which enhances landslide detection in forested environments (Handwerger et al., 2022).
This approach has been validated in mountainous regions of Japan, Vietnam, New Zealand, Indonesia, and Norway (Handwerger et al., 2022; Lindsay et al., 2022; Nugroho et al., 2021; Peters et al., 2024). Nevertheless, it presents several relevant limitations: (i) detection accuracy improves with the temporal accumulation of post-event images, which limits its applicability for near-real-time detection; (ii) spatial resolution constrains the detection of landslides smaller than ∼20 m; (iii) Google Earth Engine (GEE) imposes computational constraints when applied to large areas; and (iv) seasonality may introduce biases (Handwerger et al., 2022).
To mitigate some of these limitations, Sentinel-1 processing was conducted independently within the 16 Grid G subareas previously defined for the study area (Figure 2). This spatial subdivision facilitated the handling of large image collections and reduced computational constraints within Google Earth Engine. Although seasonality may influence backscatter responses, all available images were retained because larger image stacks have been shown to improve inventory accuracy and reduce seasonal biases (Handwerger et al., 2022).
Generation of Sentinel-1 backscatter change maps in GEE
Landslide detection was performed using a Google Earth Engine (GEE) script previously developed for multitemporal Sentinel-1 backscatter analysis (Handwerger et al., 2022). The procedure considers both ascending and descending Sentinel-1 acquisitions in VH polarization, removes values below −30 dB, and constructs pre-event (
To improve detection performance, three additional strategies were implemented: (i) the application of topographic masks to exclude slopes lower than 10° and curvatures higher than −0.005 m m−2, as these correspond to surfaces where landslides do not occur, such as hilltops and plains (Handwerger et al., 2022); (ii) selection of the 99th percentile of Inventory Preparation; (a) 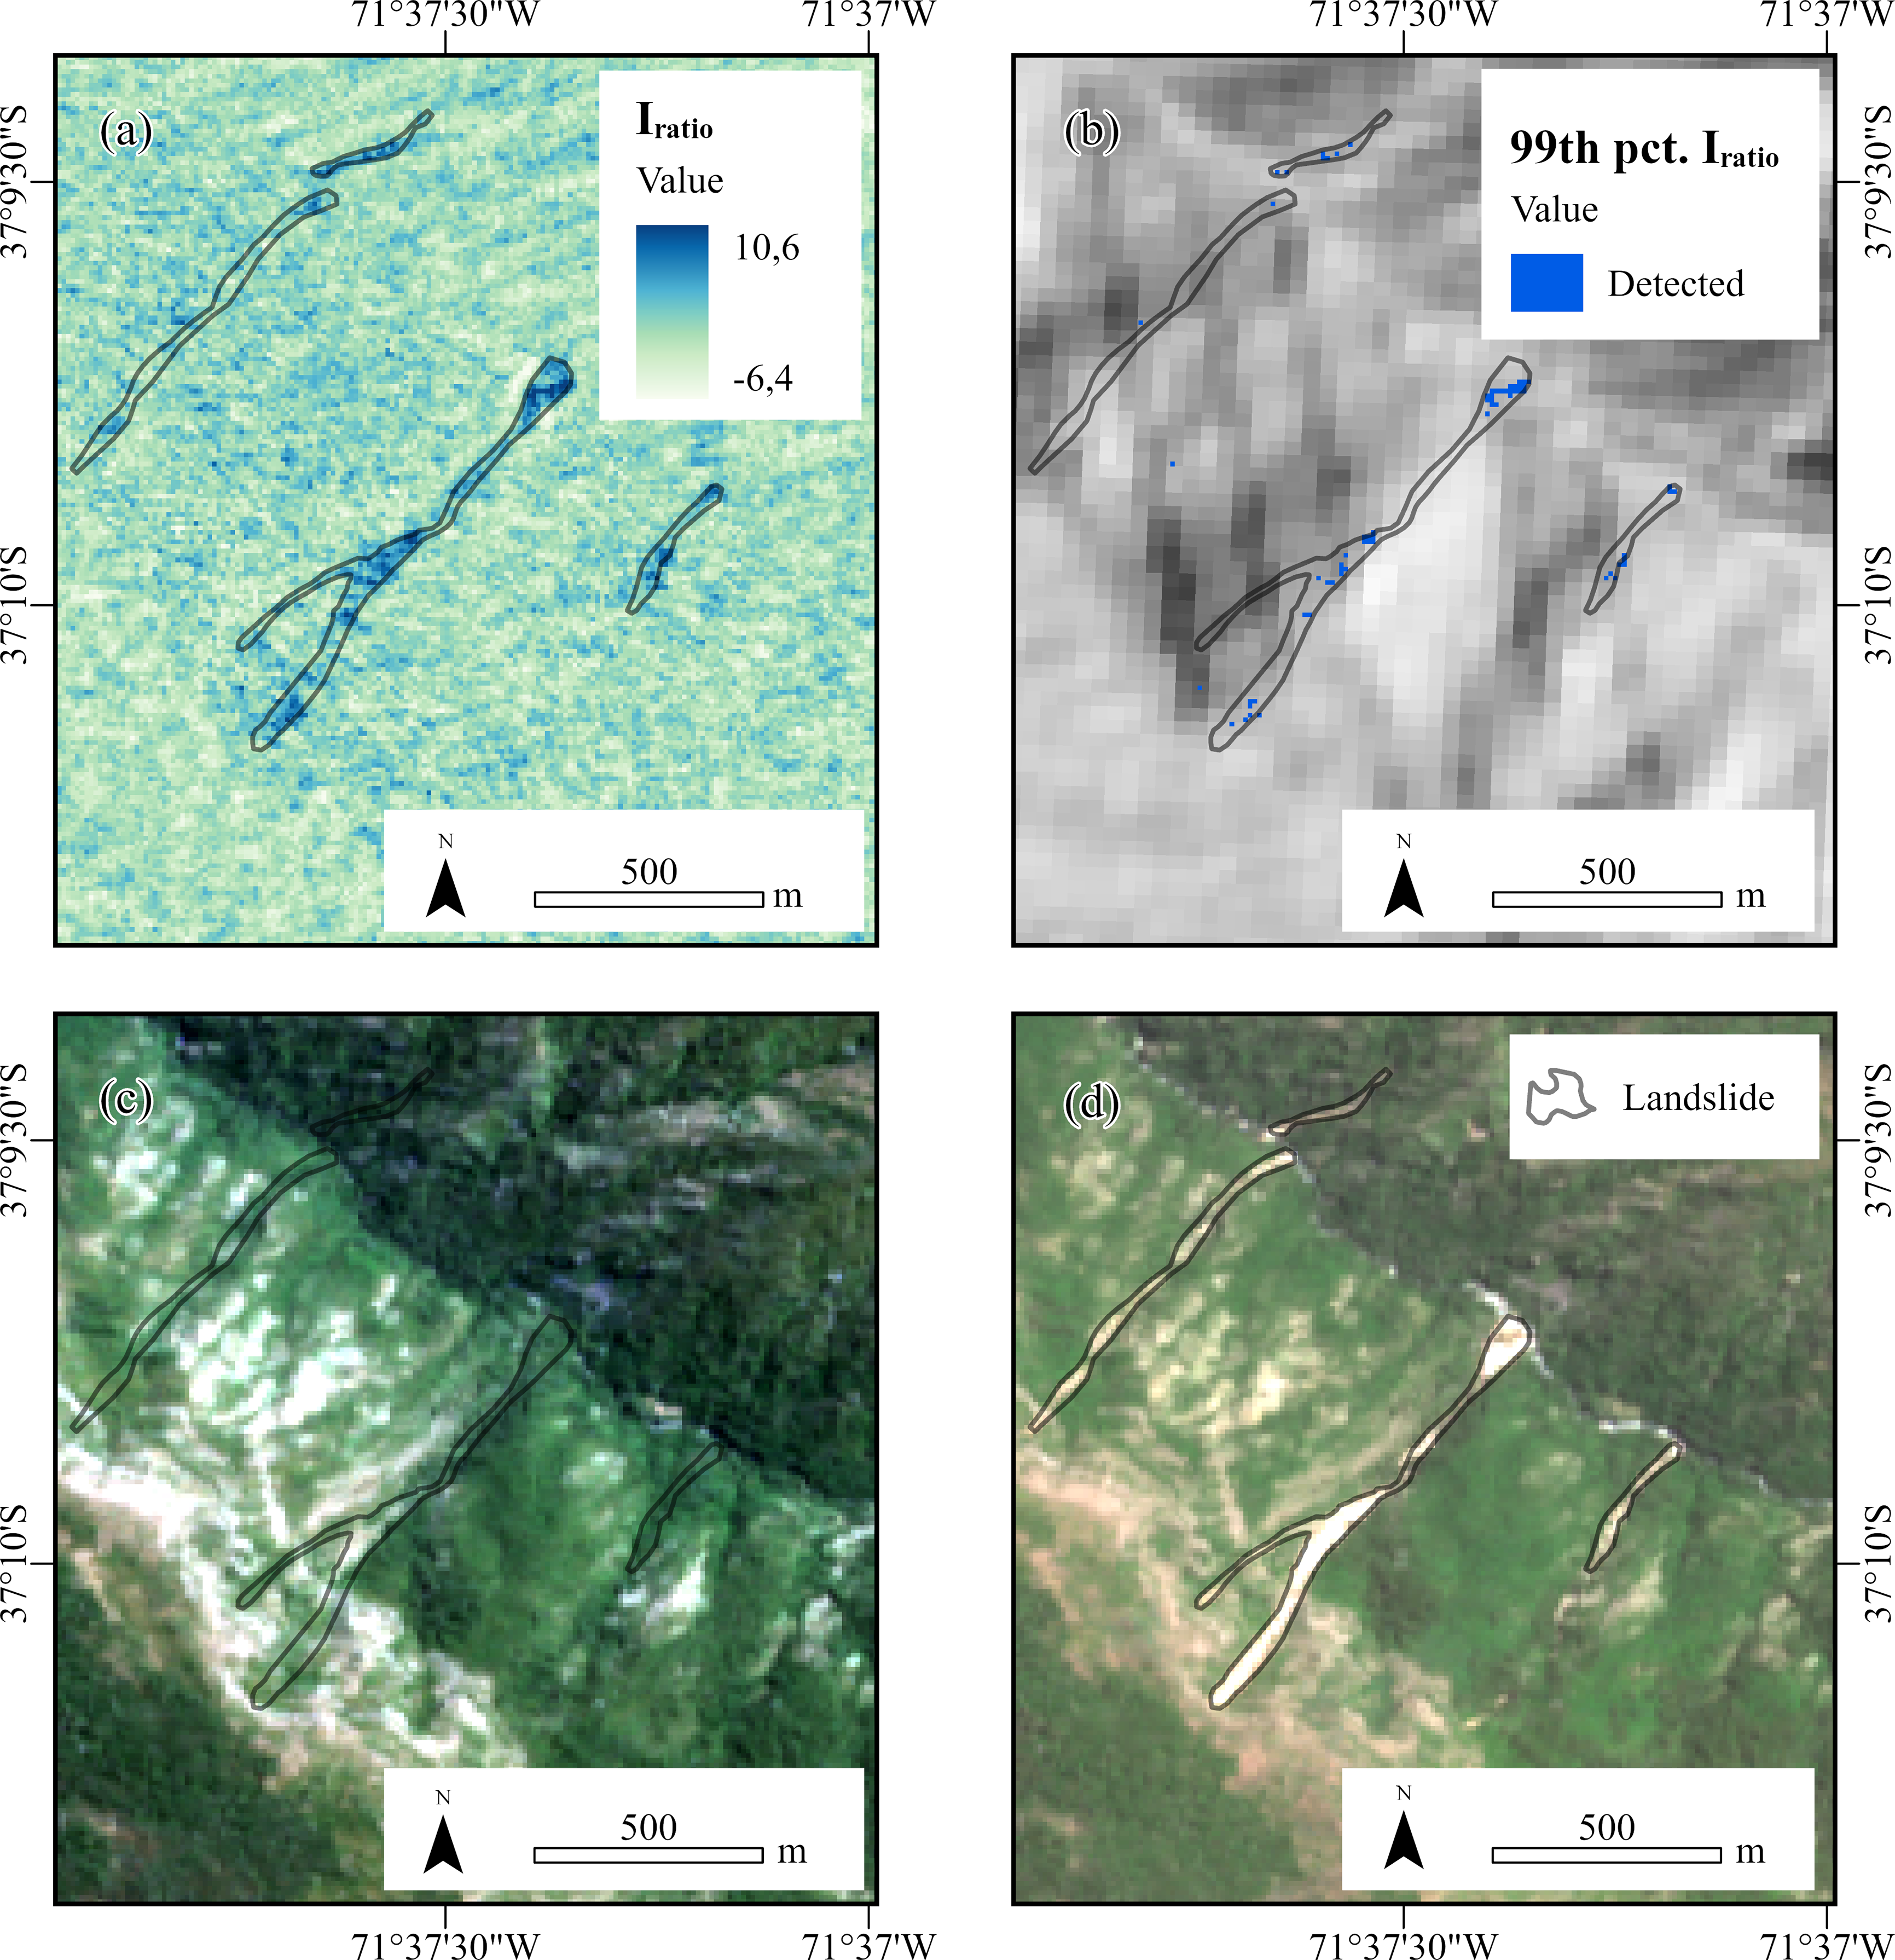
Development of the geomorphological inventory
The geomorphological inventory was developed through a structured workflow integrating SAR-based change detection, optical image interpretation, geomorphological mapping, and field validation. This approach combines automated processing with expert-based interpretation to ensure both detection sensitivity and geomorphological reliability.
First, SAR-derived products (
Landslide morphologies were subsequently digitized in ArcGIS Pro by delineating polygons representing the full spatial extent of each feature. The resulting geodatabase includes attributes describing landslide type and subtype, involved materials, event date, elevation metrics (minimum, maximum, and mean), validation status, event identifier, affected area, and IGM grid code.
Geomorphological classification was based on the updated Varnes landslide classification proposed by Hungr et al. (2014), widely adopted in landslide inventory studies (Reichenbach et al., 2018). Classification was based on mapped morphology, material characteristics, and geomorphological context, ensuring consistency with established inventory standards. Involved materials were assigned through visual interpretation of landslide morphology and surface characteristics using Sentinel-2 imagery, high-resolution aerial imagery, and field observations where available. Material type was recorded as an additional inventory attribute and was not used as a primary classification criterion.
Finally, field validation was conducted through targeted geomorphological surveys covering approximately 7% of the inventory, a proportion constrained by accessibility limitations and logistical challenges in steep, high-mountain environments. Field observations included lithology, mobilized materials, landslide morphology, active processes, and slope stability conditions. In areas with limited access, drone-acquired imagery was used to support interpretation. This validation step provided ground-based confirmation of the remotely mapped features and contributed to refining the geomorphological interpretation.
Data analysis
To investigate the geomorphological controls on landslide occurrence and size, as well as their spatial distribution and potential recurrence, a set of morphometric, environmental, and lithological variables was derived for each inventoried landslide. These variables were used to characterize the physical conditions of slope instability and to explore their relationship with landslide area.
Landslide area (m2) was calculated for each polygon. Topographic attributes (minimum, maximum, and mean elevations) were derived from a 30 m resolution SRTM Digital Elevation Model. Relief was computed as the difference between maximum and minimum elevation (ELEVMAX – ELEVMIN), and mean slope (°) was extracted from the same DEM.
To characterize pre-event vegetation conditions, the mean NDVI (Normalized Difference Vegetation Index) was calculated for each landslide polygon using a Sentinel-2 surface reflectance composite acquired prior to the first major rainfall event (May 2023). NDVI was computed from near-infrared and red bands and processed in Google Earth Engine (GEE).
Lithological information was assigned to each landslide by extracting the geological unit at the crown of the landslide, ensuring that the detachment zone was represented. This was achieved by overlaying point features derived from each polygon onto the geological map of Chile and performing a spatial join in ArcGIS Pro. The final dataset included landslide area (m2), mean slope (°), relief (m), mean NDVI, and lithological unit.
Statistical analyses were performed in Python. Relationships between continuous variables (slope, relief, NDVI) and landslide area (log10-transformed) were evaluated using Spearman’s rank correlation coefficient (ρ). Non-linear trends were explored using LOWESS smoothing. Differences in landslide area across lithological units were assessed using the Kruskal–Wallis test.
In addition, frequency distributions of slope, relief, NDVI, and lithological units were analyzed to characterize the dominant geomorphological conditions associated with landslide occurrence. Histograms and categorical frequency plots were used to identify prevalent ranges and patterns within the dataset, providing a descriptive basis for interpreting the spatial distribution of landslides.
To further evaluate the temporal stability of landslide occurrence patterns, a spatial recurrence assessment was conducted between consecutive years. Spatial recurrence was analyzed through visual overlay of the landslides identified in 2023 with the detection layers generated for 2024. Although no new landslides were identified in 2024, this approach allowed assessment of the geomorphological stability of previously affected areas, as well as the identification of potential signs of partial reactivation, scar persistence, or changes in activity level. Future implementations could incorporate automated spatial recurrence metrics based on the calculation of intersected areas between landslide polygons from successive inventories, providing a more objective assessment of reactivation and persistence patterns.
Results
Landslide inventory
The landslide inventory generated for this study is publicly available through the Zenodo repository (DOI: 10.5281/zenodo.18046852) and includes a total of 55 mapped processes, with a clear predominance of debris flows and debris avalanches over translational and undifferentiated slides. The landslide inventory generated for this study is publicly available in an open-access repository and includes a total of 55 mapped processes, with a clear predominance of debris flows and debris avalanches over translational and undifferentiated slides. Landslide occurrence was strongly concentrated during the first rainfall event, which accounted for approximately 85% of the total inventory, highlighting the dominant role of specific high-impact rainfall episodes in controlling slope instability. This pattern is also reflected in the affected area, where flow-type processes represent the largest contribution, confirming their geomorphic importance relative to more localized slope failures.
The total area affected by landslides reached 784,708 m2, representing a very small fraction of the study area (0.012%). Landslide size shows high variability, ranging from small translational slides to large debris flows exceeding 80,000 m2. On average, flow-type processes exhibit significantly larger areas than slide-type failures, indicating a greater capacity for sediment mobilization and downslope propagation.
Field validation was conducted for a subset of the inventory (∼7%), constrained by accessibility limitations, complex terrain, and operational restrictions in high-mountain environments. Verified sites include debris-flow scarps in tributary valleys of the Cholguán River (Santa Lucía Alto sector) and a translational debris slide along route Q-689 on the flank of Callaqui Volcano. These observations support the geomorphological interpretation derived from satellite imagery.
For instance, field observations along route Q-689, near the Las Carpas stream, allowed detailed characterization of a translational debris slide, where scarps are composed of colluvial deposits of angular blocks within a residual soil matrix. The overall slope configuration—defined by coarse blocky material embedded in a fine-grained matrix—indicates inherently unstable conditions conducive to landslide activity (Figure 8). Field observations and mapped landslide; (a) UAV image showing debris materials exposed on the roadcut; (b) UAV image of the translational debris slide; (c) High-resolution satellite imagery (Google) with the mapped landslide polygon. For interpretation of the references to colours in this figure legend, refer to the online version of this article.
Landslides are distributed across a broad elevational range, with substantial overlap between landslide types, suggesting that elevation alone does not exert a primary control on landslide typology (Figure 9(a)). Instead, it likely interacts with other geomorphological factors such as slope, lithology, and drainage conditions. Elevation patterns and spatial occurrence of landslide subtypes in the study region; (a) Distribution of maximum elevation across landslide subtypes; (b) Frequency of landslides per IGM grid cell, differentiated by subtype. For interpretation of the references to colours in this figure legend, refer to the online version of this article.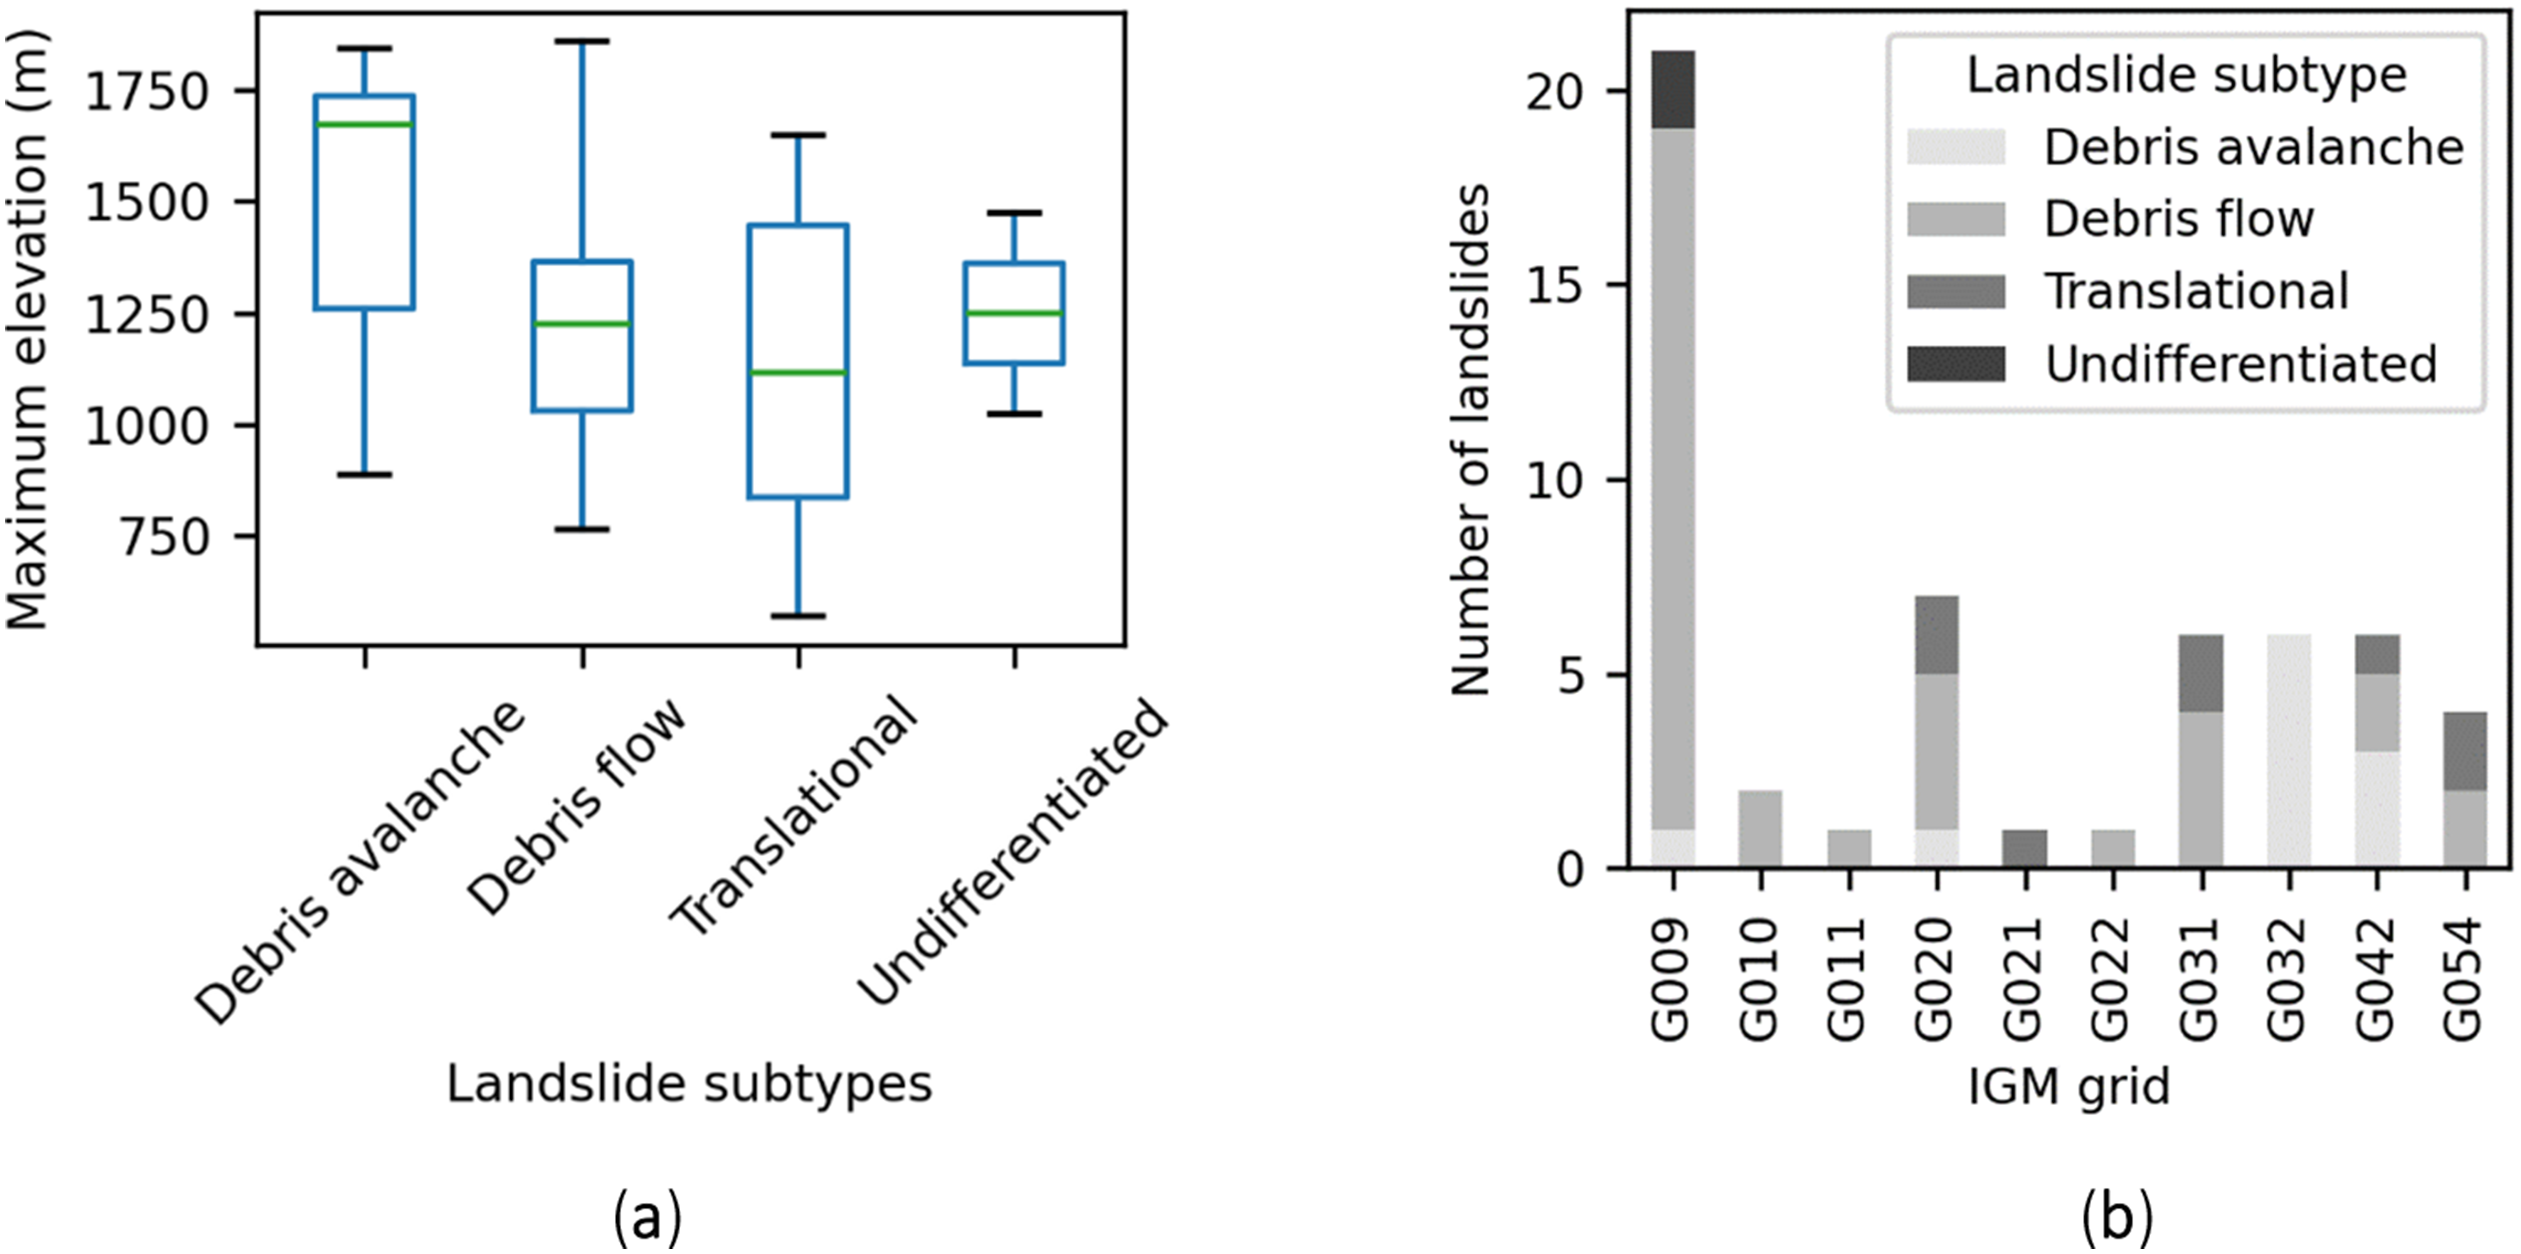
Spatially, landslides are unevenly distributed, with a strong concentration in specific sectors such as the G009 Colonia de Santa Lucía grid, which accounts for the largest proportion of both landslide frequency and affected area (Figures 9b and 10). These concentrations are primarily associated with tributary valleys and drainage networks, highlighting the role of localized geomorphological conditions in controlling landslide occurrence. Landslide Heat Map. Landslide heatmap draped over the IGM grid. For interpretation of the references to colours in this figure legend, refer to the online version of this article.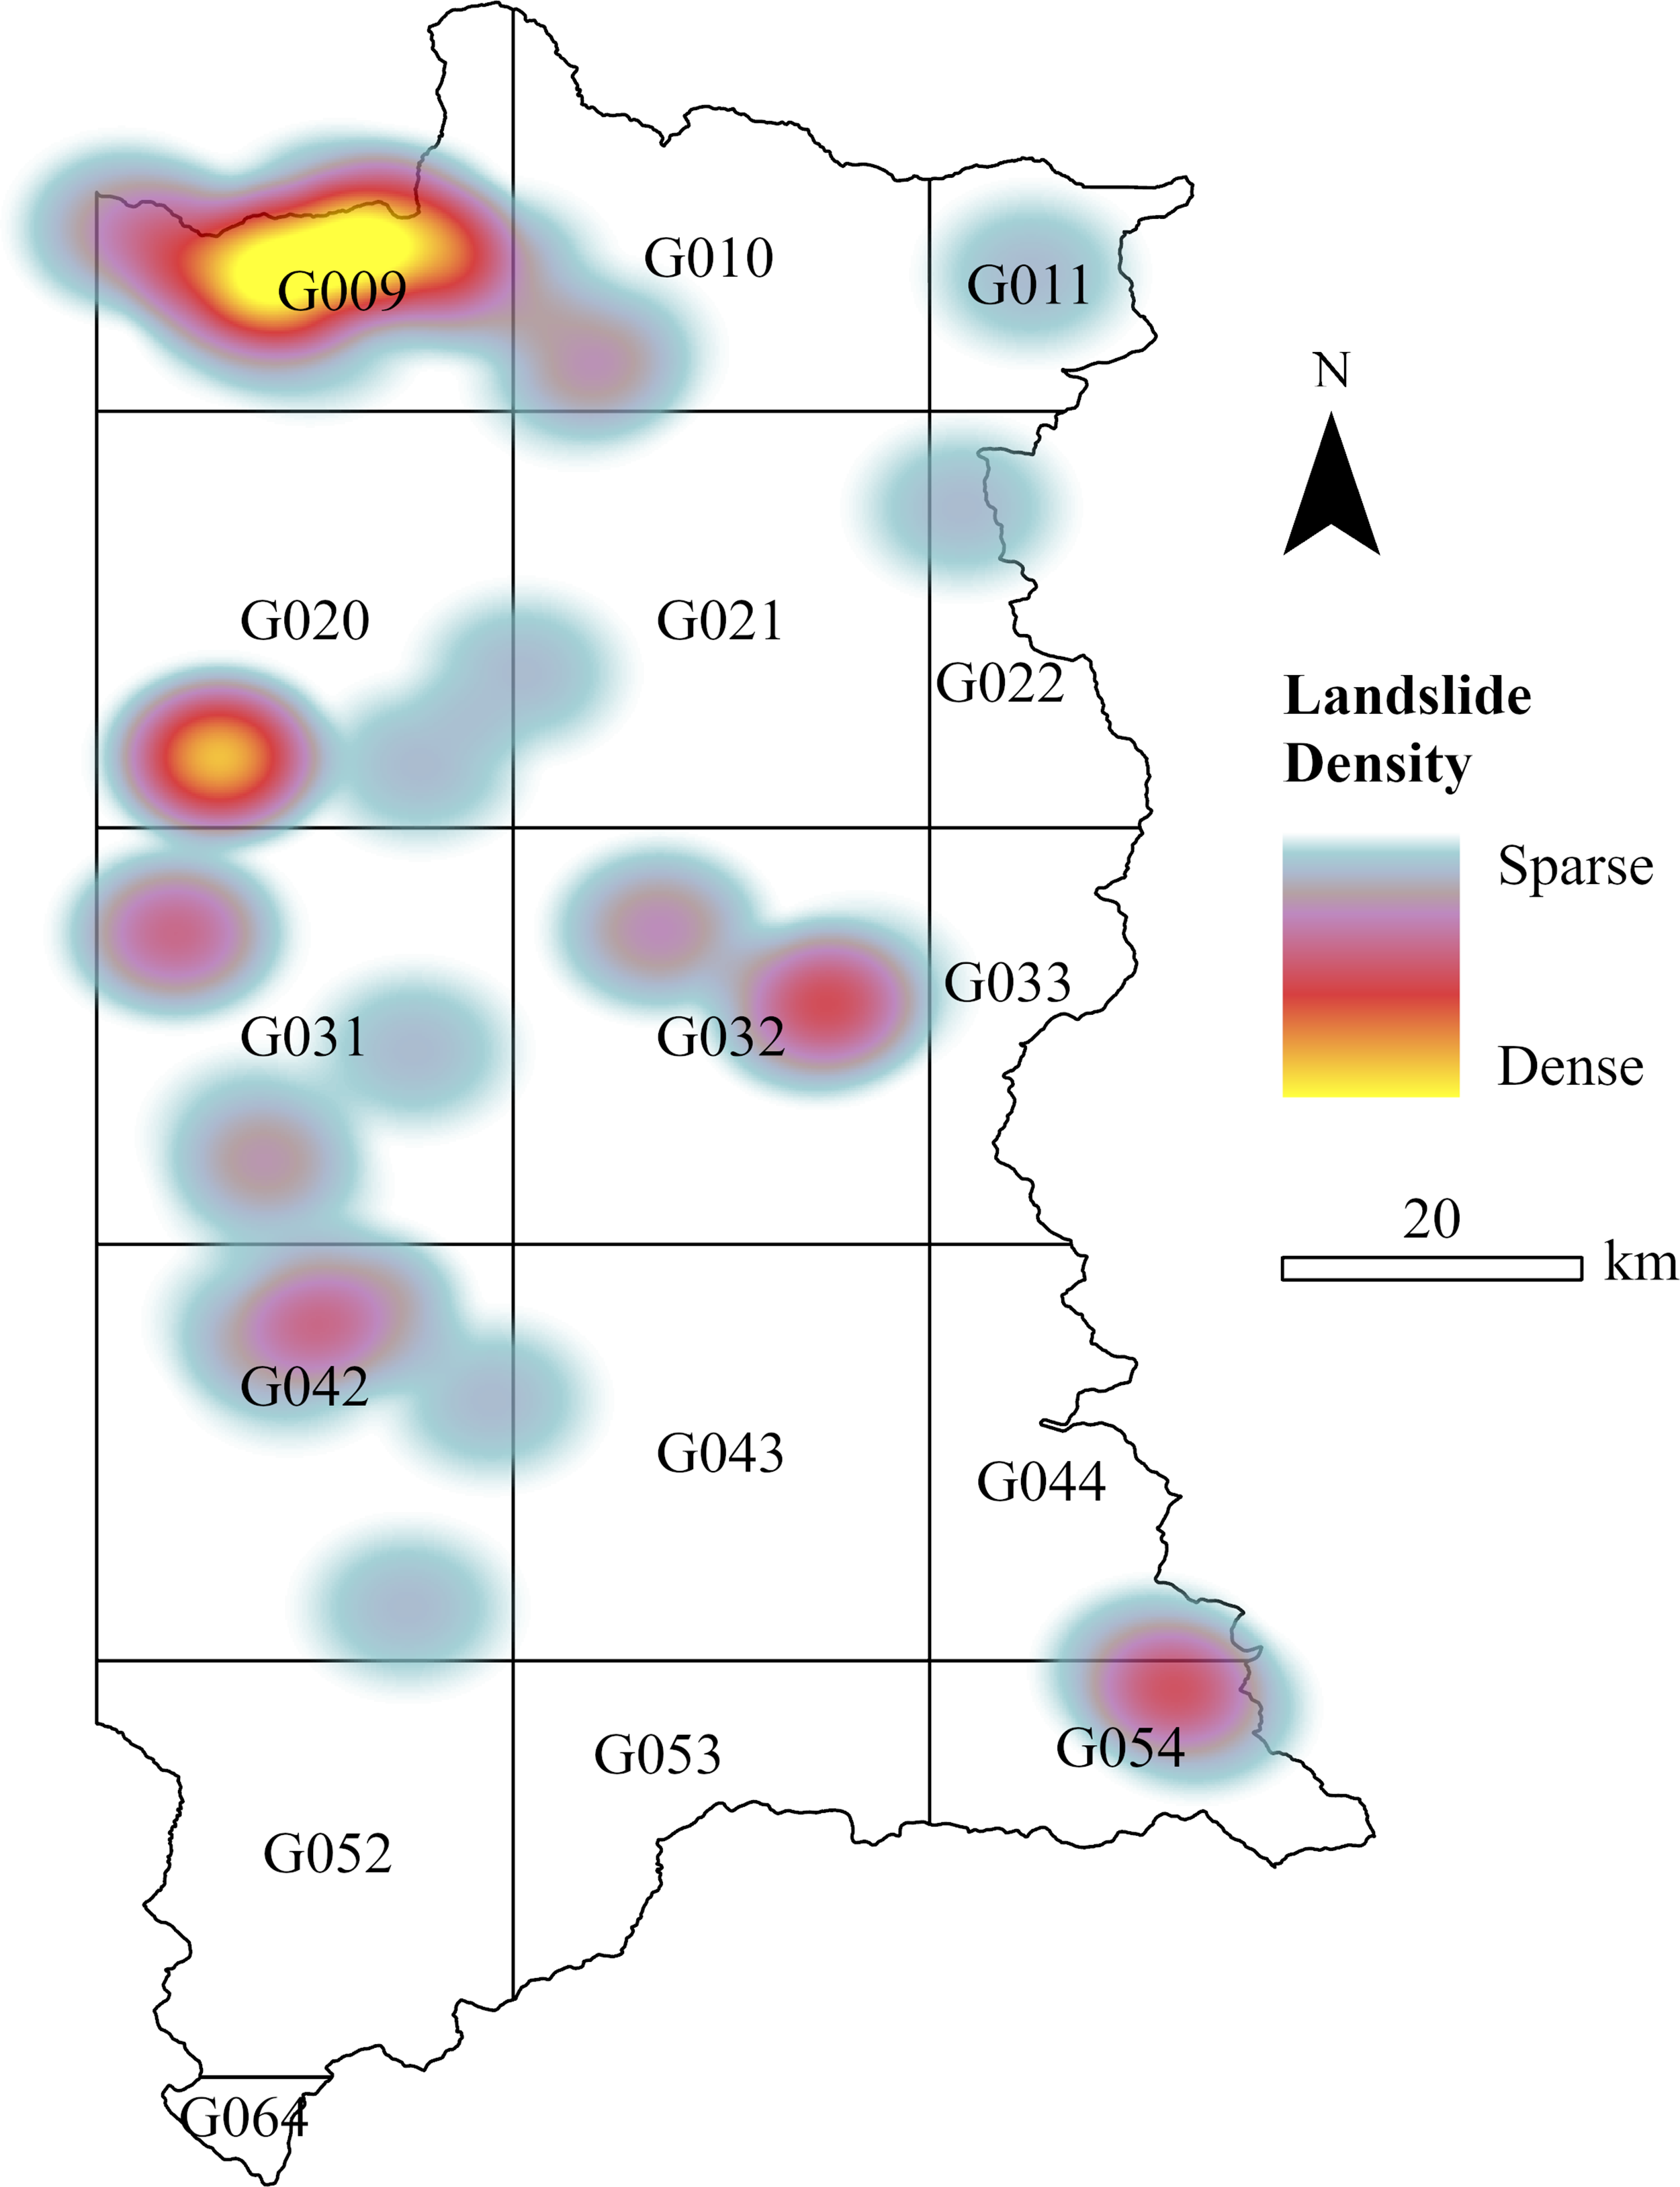
Following the characterization of the landslide inventory, the relationships between landslide occurrence, geomorphological conditions, and landslide magnitude were examined using the derived morphometric, environmental, and lithological variables. This analysis aims to identify both the conditions favoring slope failure and the factors controlling landslide size.
The distribution of landslides across slope classes shows a clear concentration within a relatively narrow range of terrain gradients (Figure 11). Most events occurred on slopes between 22° and 34°, accounting for approximately 76% of the dataset, with a peak in the 26–30° class. Both gentle (<18°) and very steep slopes (>38°) are uncommon, and no landslides were recorded above 42°. This pattern suggests a well-defined instability window, where slope angle exerts a threshold control on landslide occurrence rather than a continuous influence. Frequency distributions of geomorphological variables associated with landslide occurrence: (a) mean slope (°), (b) relief (m), (c) mean NDVI, and (d) lithological units. The distributions highlight the dominant ranges of slope, relief, and vegetation conditions, as well as the concentration of landslides within specific geological units. For interpretation of the references to colours in this figure legend, refer to the online version of this article.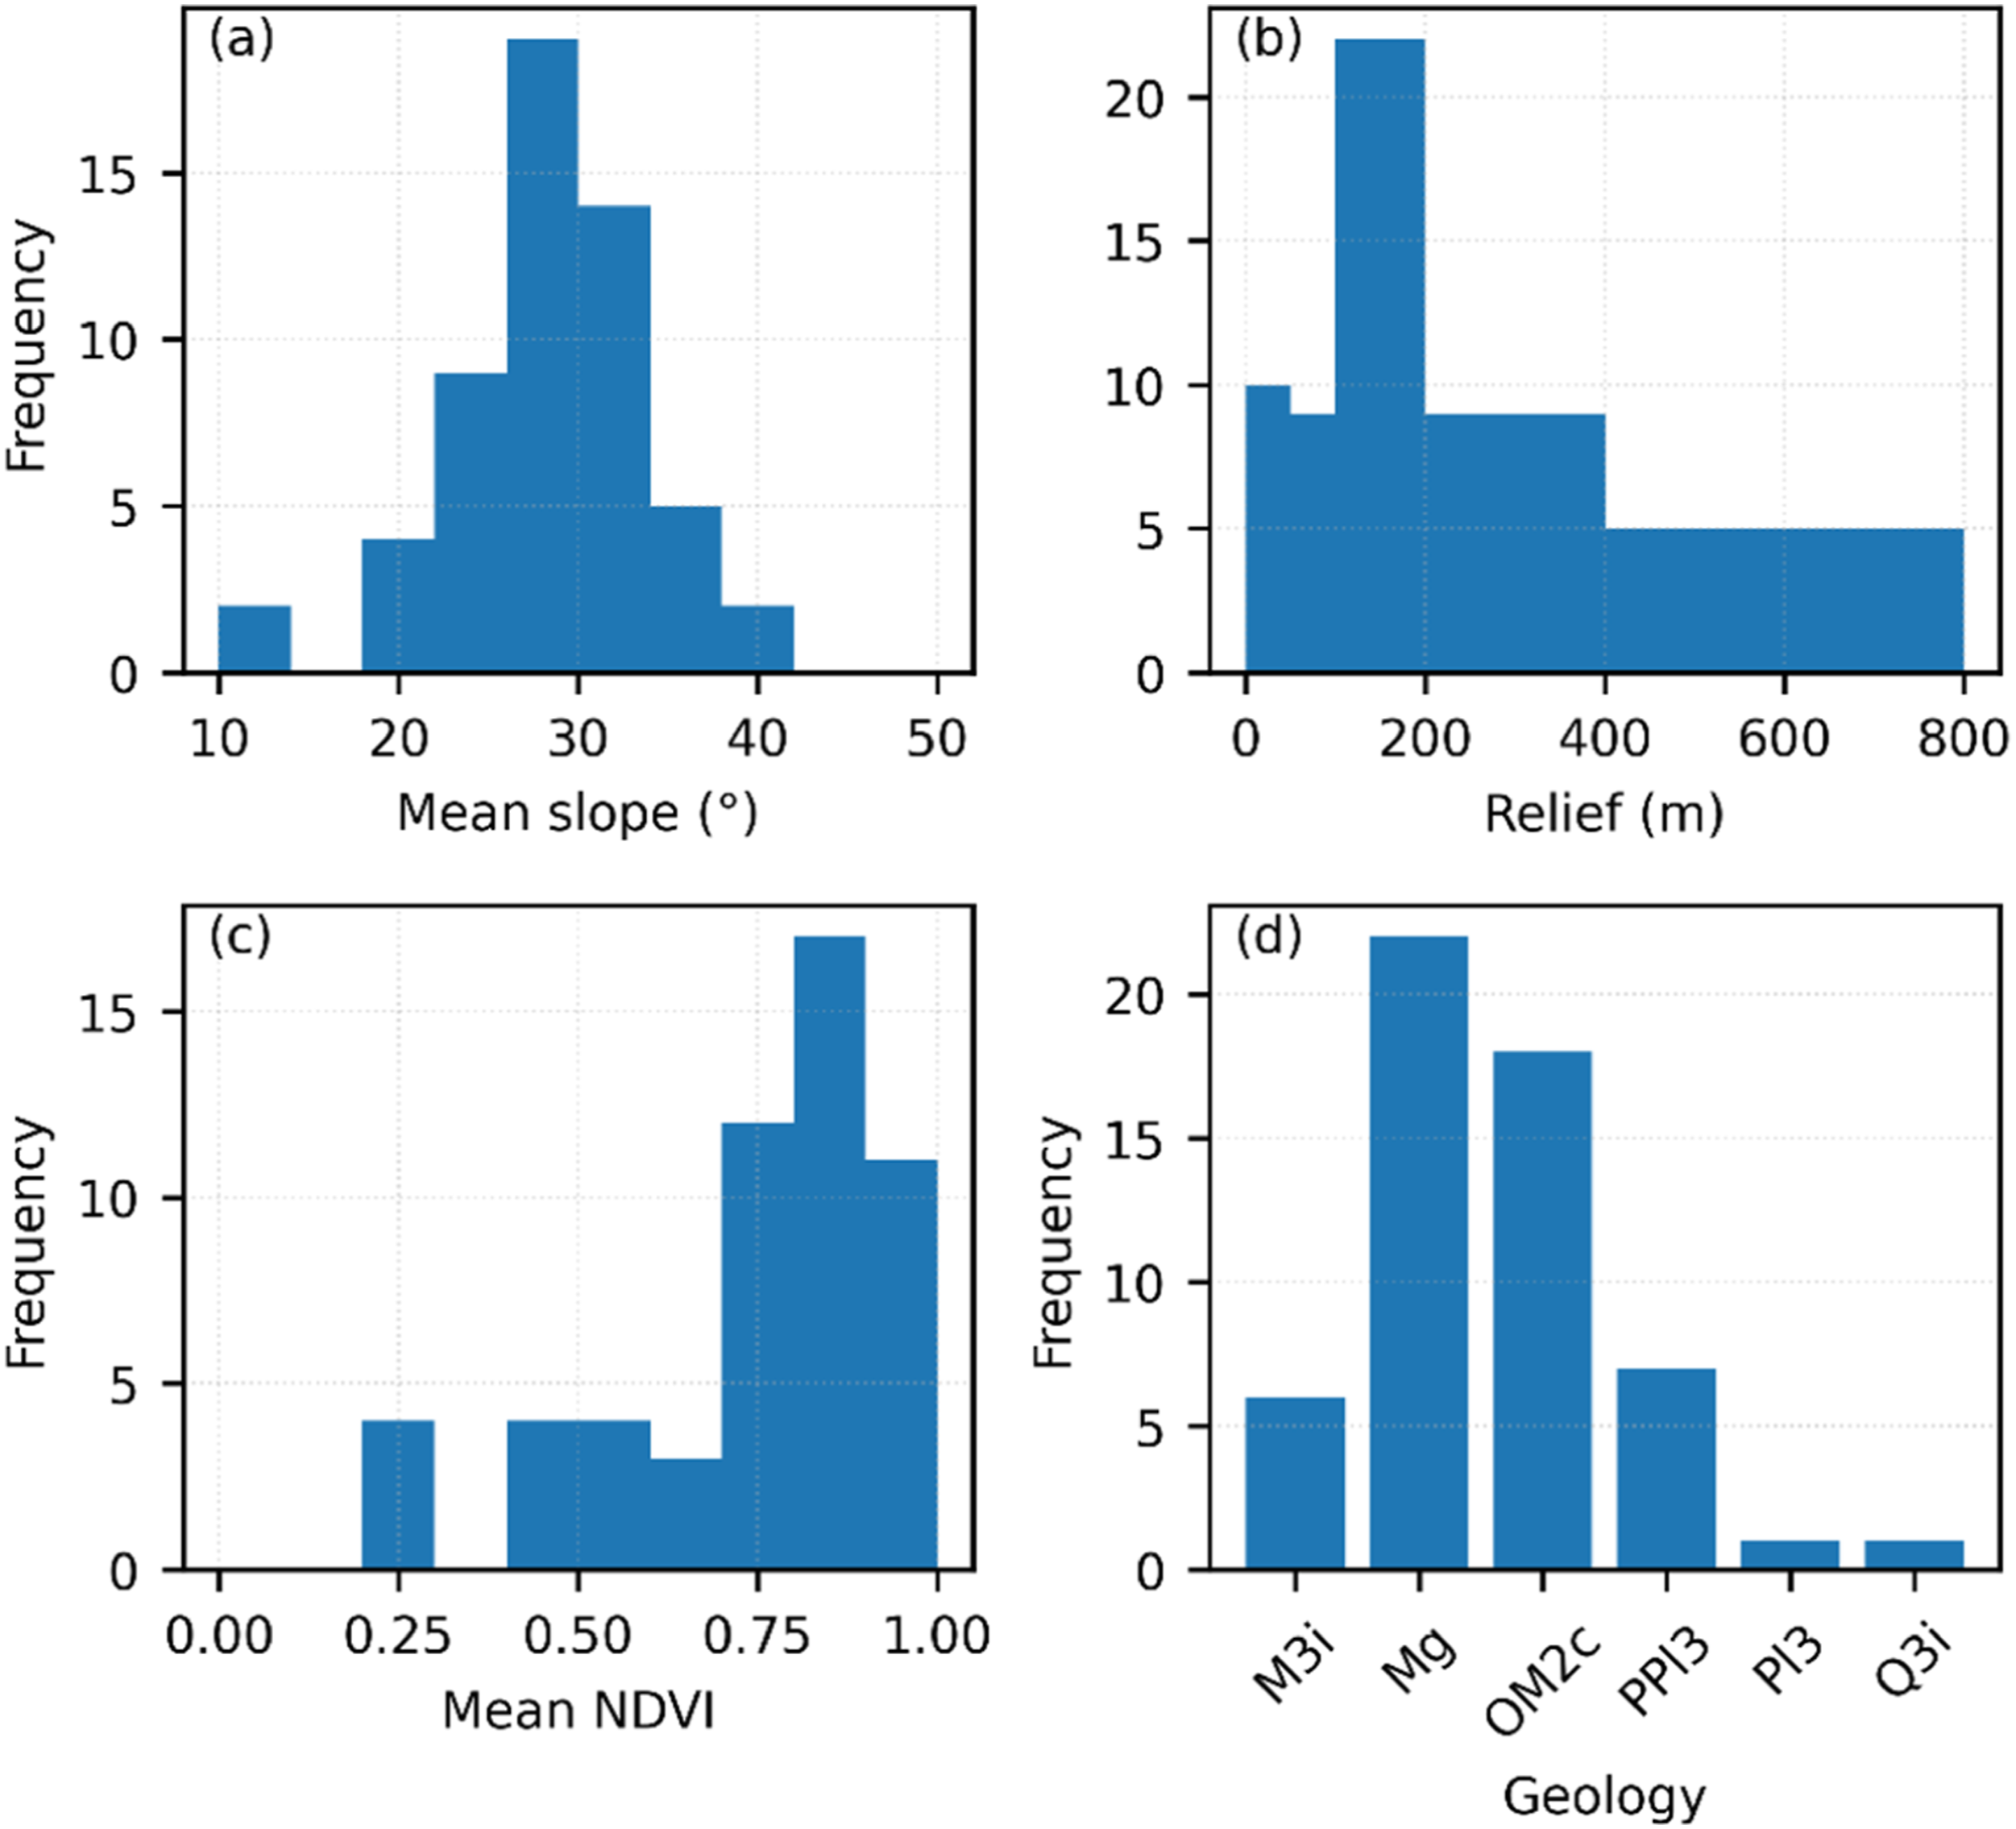
A similarly structured distribution is observed for relief, although with a more pronounced dominance of intermediate conditions. The 100–200 m class accounts for approximately 40% of all landslides, forming a clear modal peak. However, low-relief areas (<50 m) still represent a notable proportion (∼18%), indicating that slope instability is not restricted to highly dissected terrain. In contrast, high-relief conditions (>400 m) are comparatively rare. The overall distribution is unimodal and right-skewed, indicating a preferential occurrence under moderate topographic dissection.
Pre-event vegetation conditions, represented by NDVI, show a strong concentration toward high values. Approximately 73% of landslides occurred in areas with NDVI ≥0.7, with the most frequent classes being 0.8–0.9 and 0.9–1.0. Low NDVI values (<0.3) account for only a small fraction of cases (7.3%), and values below 0.2 are absent. These results indicate that most detected landslides occurred in areas characterized by high vegetation vigor prior to failure.
Lithological distribution highlights the role of substrate properties in conditioning landslide occurrence. Two geological units (Mg and OM2c) together account for approximately 73% of all mapped landslides, indicating a strong concentration of failures within specific geological environments.
The Mg unit corresponds to Miocene plutonic rocks (granodiorites, diorites, and tonalites), which are mechanically competent at depth but commonly develop weathered mantles and fracture networks near the surface. These conditions may promote shallow to intermediate-depth failures, particularly where weathering reduces rock mass strength.
In contrast, the OM2c unit represents Oligocene–Miocene volcano-sedimentary sequences composed of basaltic to dacitic lavas interbedded with pyroclastic and epiclastic deposits. These lithologies are inherently heterogeneous and include weak or poorly consolidated layers that can act as preferential failure planes.
Other units provide additional insight into landslide magnitude. The M3i unit, composed of Miocene volcanic complexes including lavas, breccias, domes, and pyroclastic rocks, is associated with larger median landslide areas, likely due to the presence of fractured and brecciated materials. Similarly, PPl3 units exhibit mixed mechanical behavior, while Quaternary volcanic units (Q3i) are only marginally represented in the inventory.
Beyond occurrence patterns, the relationship between geomorphological variables and landslide area reveals more complex and non-linear behavior (Figure 12). Relief shows a non-monotonic association with landslide size, with area increasing up to approximately 500–600 m and decreasing thereafter. The largest landslides are restricted to intermediate relief values (200–400 m), while both low and very high relief settings tend to host smaller events. This non-monotonic pattern is not captured by linear correlation (ρ = −0.03), highlighting the importance of non-linear controls on landslide size. Relationships between landslide area and geomorphological variables: (a) mean slope, (b) relief, (c) mean NDVI, and (d) lithological units. Continuous variables include LOWESS smoothing curves illustrating non-linear trends. Landslide area is log10-transformed. The plots highlight the contrasting influence of geomorphological factors on landslide magnitude. For interpretation of the references to colours in this figure legend, refer to the online version of this article.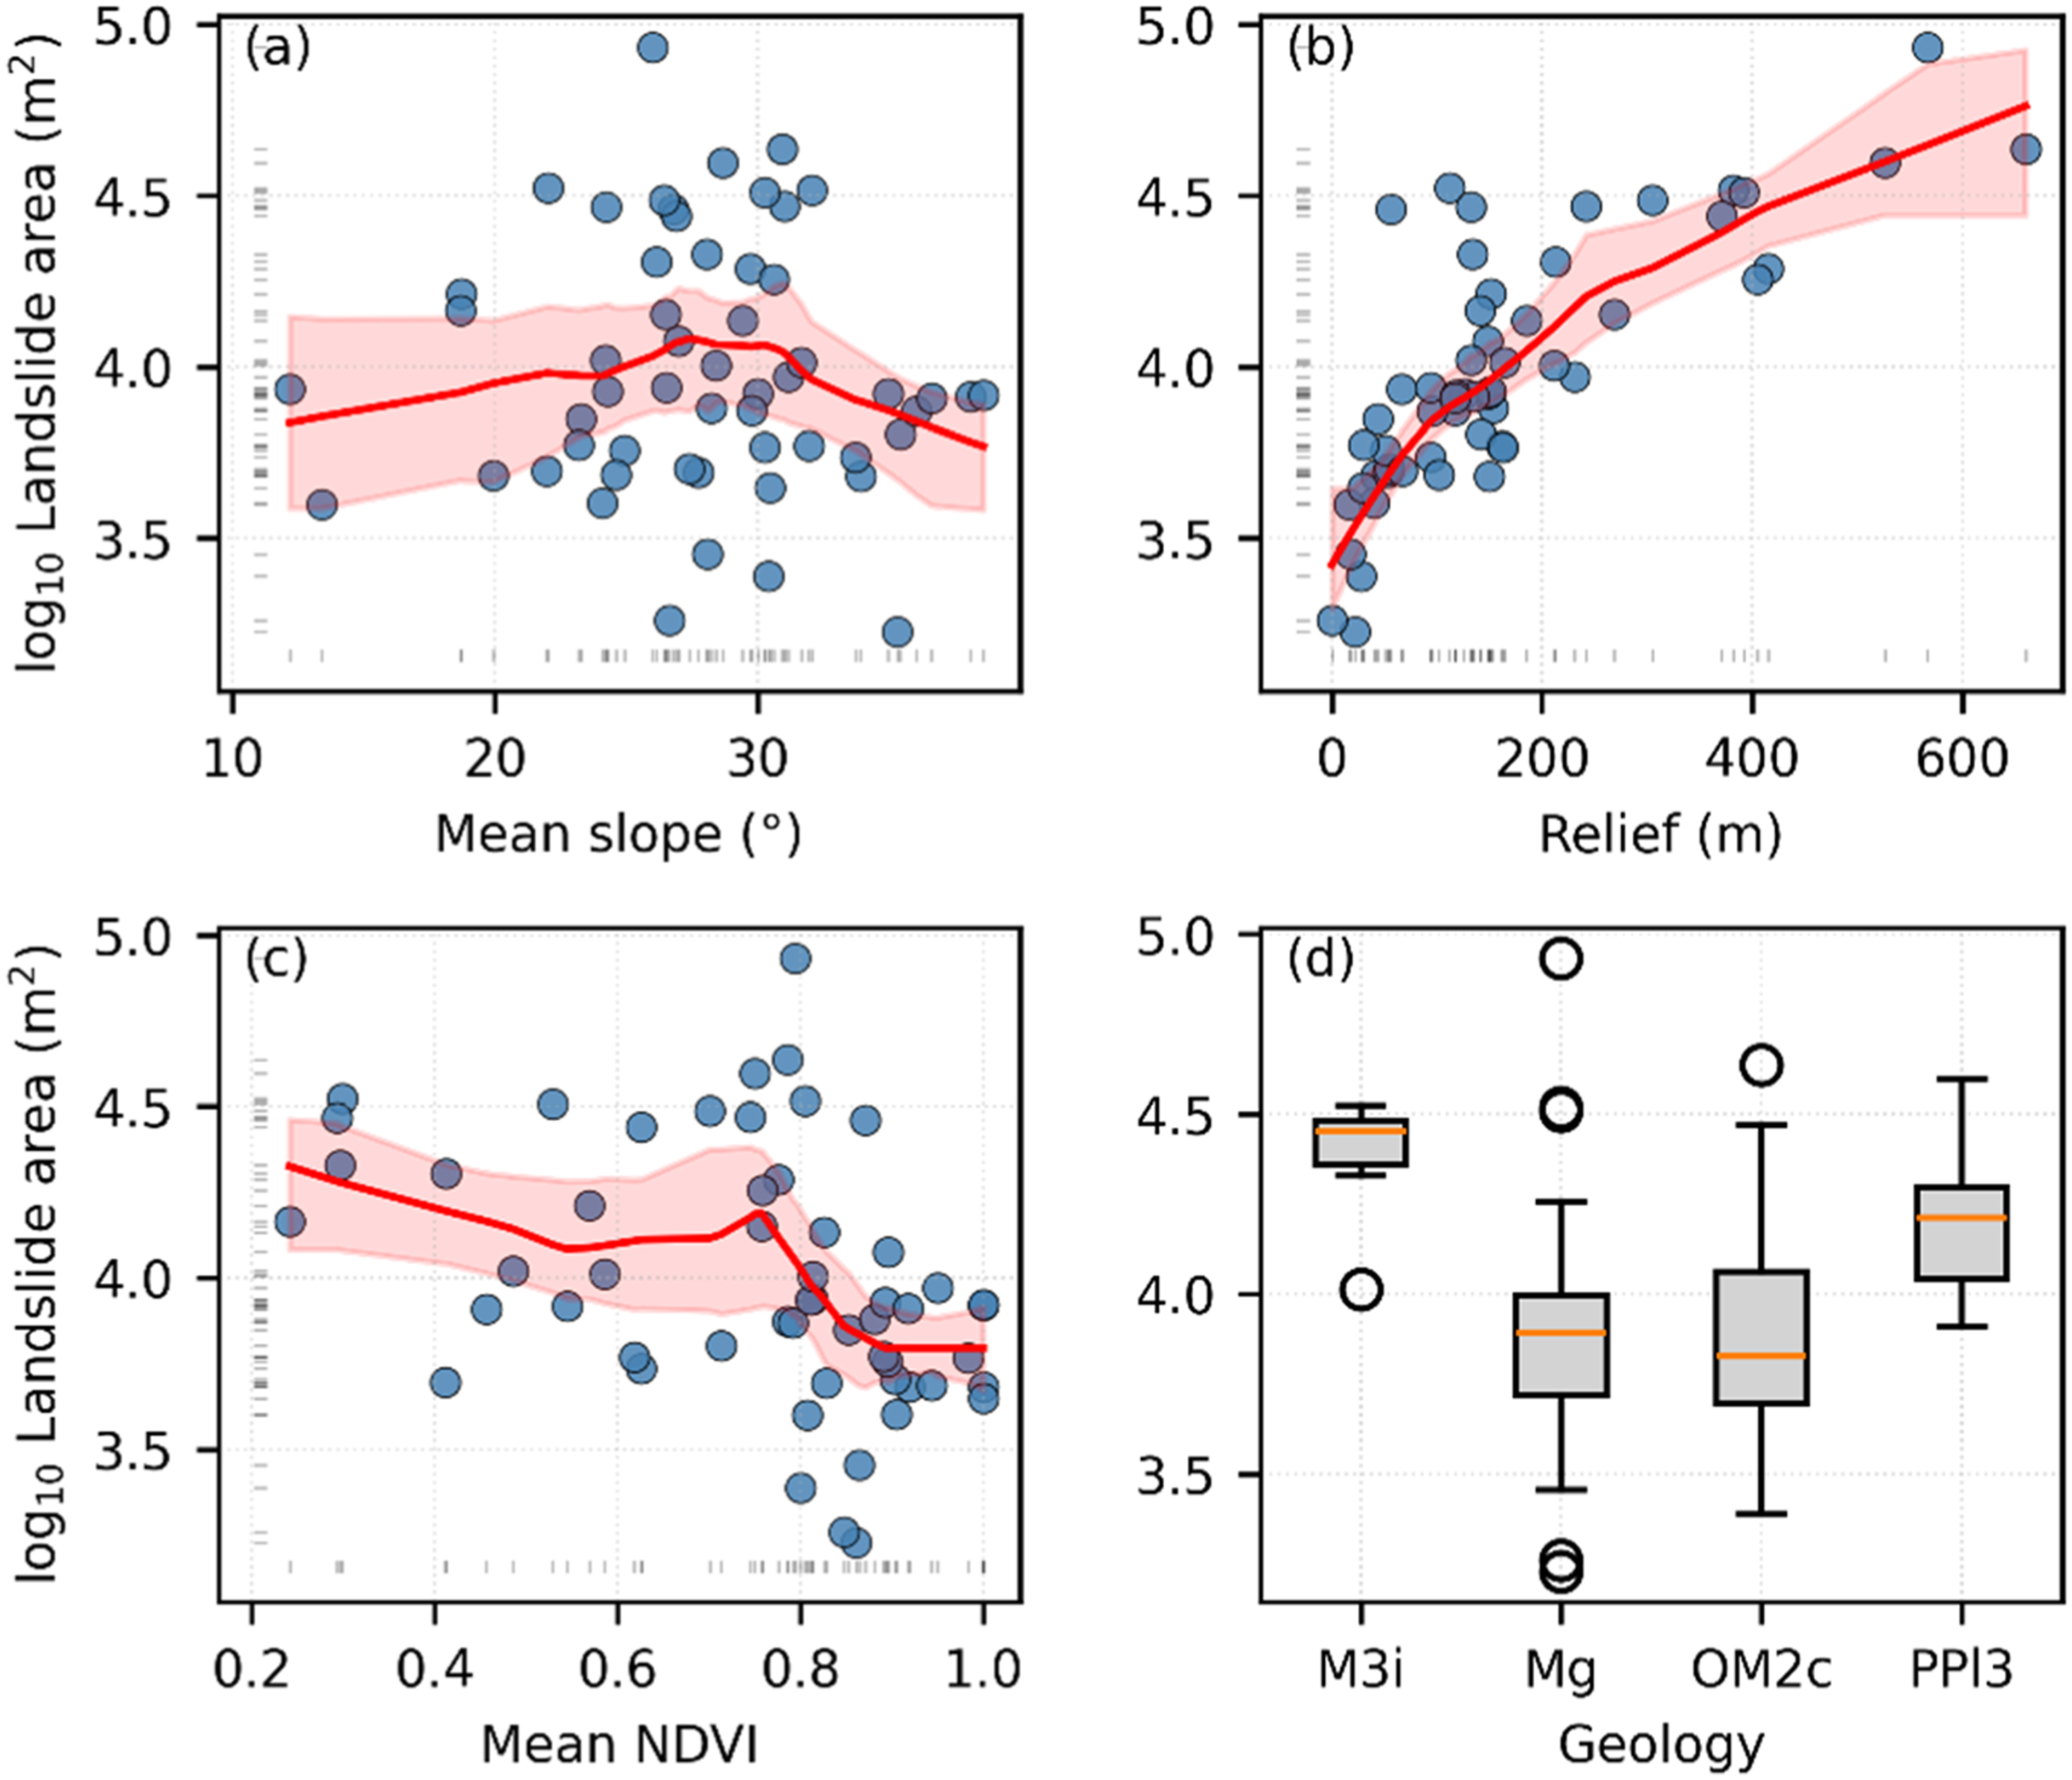
Pre-event NDVI also shows a statistical association with landslide area. Landslide area decreases with increasing NDVI, with the largest events consistently associated with low NDVI values (<0.3), while smaller landslides dominate at higher NDVI (>0.6). The moderate negative correlation (ρ = −0.41, p < 0.01) indicates that larger landslides tended to occur in areas characterized by lower pre-event NDVI values. However, because NDVI does not provide direct information on vegetation type, structure, or root reinforcement, its interpretation in terms of slope stabilization processes remains limited.
By contrast, slope does not show a significant relationship with landslide area (ρ = 0.09), despite its strong control on landslide occurrence. Within the dominant slope range (22°–34°), landslide sizes vary widely, indicating that slope angle alone is not a reliable predictor of landslide magnitude once failure conditions are met.
Lithological differences in landslide size further support the role of substrate properties. The Kruskal–Wallis test indicates significant variability in landslide area across geological units (H = 12.4, p = 0.03), with larger median areas associated with units such as M3i and smaller ones with OM2c. Notably, the most frequent units are not necessarily those associated with the largest failures.
Taken together, these results reveal a clear contrast between the factors controlling landslide occurrence and those influencing landslide magnitude. While landslides are most frequent under moderate slopes, intermediate relief, and high pre-event NDVI values, the largest events tend to occur under more restricted combinations of intermediate relief and lower pre-event NDVI values. This highlights the non-linear and multi-factor nature of geomorphological controls, where the conditions favoring failure initiation do not necessarily coincide with those governing failure size.
Discussion
Performance of the SAR backscatter change–based method
The detection of rainfall-induced landslides through the analysis of Sentinel-1 SAR backscatter changes processed in Google Earth Engine (GEE) showed highly satisfactory performance in the study area, particularly for processes with areal extents greater than 1,000 m2 and under dense forest cover. This result is fully consistent with previous applications of the method in forested mountainous environments (Handwerger et al., 2022; Nugroho et al., 2021; Peters et al., 2024). Positive values of the
Although vegetation density has been a key factor influencing sensor response in VH polarization, this study also demonstrated the ability of the method to detect landslides in areas with sparse vegetation or exposed soil. In these settings, post-event reductions in surface roughness and changes in moisture content were sufficiently pronounced to be captured in the SAR imagery. This finding broadens the potential applicability of the approach to high-mountain, periglacial, and volcanic environments, extending its use beyond the forested contexts that have been traditionally investigated.
During the analyzed period, four intense rainfall events were identified (three in 2023 and one in 2024); however, only Events 1 and 3 generated detectable landslides, with 85% of the records concentrated in Event 1. The interpretation of these differences in relation to rainfall characteristics and atmospheric forcing is discussed in the following section.
Climatic forcing and atmospheric controls on landslide occurrence
The differences observed between rainfall events that triggered landslides (Events 1 and 3) and those that did not (Events 2 and 4) can be interpreted in the context of large-scale moisture transport and orographic forcing in the southern Andes. Extreme precipitation events in this region are frequently associated with atmospheric rivers, which act as efficient conveyors of moisture from the Pacific Ocean toward the continent (Viale et al., 2025). As these moisture-laden air masses encounter the Andean topography, strong orographic uplift enhances condensation and precipitation, often leading to high-intensity and spatially coherent rainfall.
In this framework, Events 1 and 3 are consistent with more intense or well-organized moisture transport episodes, characterized by higher rainfall intensity and sustained precipitation—key factors for landslide triggering. In contrast, Events 2 and 4, despite in some cases exhibiting comparable cumulative precipitation, were dominated by lower intensity and longer-duration rainfall, conditions that appear less effective in initiating slope failure within the study area. This supports the notion that rainfall intensity and temporal structure, rather than total accumulation alone, are primary controls on landslide triggering in mountain environments (Bogaard and Greco, 2018; Guzzetti et al., 2007).
A fundamental difference between the winters of 2023 and 2024 is related to the phase of the El Niño–Southern Oscillation (ENSO). While 2023 developed under El Niño conditions, 2024 corresponded to a neutral phase (National Oceanic and Atmospheric Administration, 2025). ENSO variability influences the frequency, duration, and moisture content of atmospheric rivers (ARs), which are the primary mechanisms responsible for transporting water vapor into central–southern Chile (Campos and Rondanelli, 2023; Saavedra et al., 2020). This relationship between ENSO and landslide occurrence has been documented elsewhere in the Andes, where warm phases (El Niño) increase landslide activity through enhanced precipitation (Hermanns et al., 2012).
Atmospheric rivers are long, narrow corridors of intense water vapor transport (Ralph et al., 2018), whose interaction with Andean topography governs the spatial distribution of precipitation. The June 2023 event was associated with a zonal atmospheric river (ZAR), which impacted the Andes nearly perpendicularly, enhancing orographic precipitation (Garreaud, 2024; Viale et al., 2025). This event reached Category 4 according to the integrated water vapor transport (IVT)–based classification (Ralph et al., 2018), producing extreme accumulations in the central Andes and raising the 0°C isotherm to approximately 3,300 m a.s.l. (Garreaud, 2023a).
These warm conditions favored accelerated snowmelt processes and rain-on-snow (ROS) events, which are widely recognized for their capacity to intensify runoff and trigger landslides and floods (McCabe et al., 2007; Ocampo Melgar and Meza, 2020; Pall et al., 2019). In August 2023, a second Category 3 ZAR was recorded, with the 0°C isotherm located at approximately 2,500 m a.s.l. (Garreaud, 2023b), which also generated landslides.
In contrast, the July 2023 event was classified as a synoptically dry month (Garreaud, 2023b), explaining the absence of landslides associated with Event 2. The June 2024 event, in turn, was controlled by a tilted atmospheric river (TAR), a characteristic feature of winters in central Chile (Garreaud, 2024; Viale et al., 2025), which concentrated precipitation primarily over the Coastal Range. In the Andes, a large proportion of the precipitation fell as snow above 2,000 m a.s.l., exerting a stabilizing effect on hillslopes and explaining the absence of landslides during Event 4.
The strong contrast in landslide occurrence between events provides clear evidence of differences in rainfall magnitude and impact. The high number of landslides associated with Events 1 and 3, compared to the absence of detectable failures during Events 2 and 4, indicates that these events differed fundamentally in their hydroclimatic characteristics. In this sense, landslide occurrence represents a direct geomorphic response to rainfall forcing, effectively reflecting the intensity and effectiveness of precipitation in generating slope instability. This reinforces the interpretation derived from precipitation data and highlights the value of landslide inventories as indicators of event impact in mountain environments.
Landslide typologies and geomorphological controls
Debris flows constituted the dominant landslide type, followed by debris avalanches, whereas translational slides represented a smaller fraction. This distribution is consistent with observations from mountainous regions dominated by extreme rainfall (Hungr et al., 2014) and with the greater sensitivity of the SAR-based approach for detecting channelized processes (Handwerger et al., 2022).
Debris avalanches commonly initiate as soil slides and may evolve into debris flows as they entrain additional material and water downslope (Hungr et al., 2014). The largest event inventoried in this study (85,747 m2), located in the G010 Puntilla Chillán grid, clearly followed this evolutionary sequence. In the G032 Queuco grid, debris avalanches represent a limited number of cases, although they are spatially clustered within this sector. These events occur within the M3i unit, composed of Miocene volcanic complexes including lavas, breccias, domes, and pyroclastic rocks. Across the study area, debris avalanches mapped in this unit show a relatively restricted size range (∼10,000–30,000 m2), suggesting a consistent expression of this landslide type under similar geological conditions.
The predominance of debris flows further highlights the importance of colluvial channels and drainage pathways as key conditioning factors for landslide occurrence. These channelized environments favor the concentration of runoff and sediment, enhancing the potential for mobilization and downslope propagation of material during intense rainfall. As a result, landslide susceptibility in the study area is not only controlled by hillslope properties but also by the spatial organization of the drainage network, which acts as an efficient conduit for sediment transfer. This finding underscores the need to explicitly incorporate colluvial channels and channel–hillslope connectivity into susceptibility assessments, particularly in volcanic Andean settings where abundant unconsolidated material is available.
From an areal perspective, debris flows (15,039 m2 on average) and debris avalanches (11,880 m2) exhibited significantly larger surface areas than translational landslides (5,707 m2) and undifferentiated landslides (4,528 m2). All landslides were located below the winter 0°C isotherm (∼2,000 m a.s.l. (Mardones and Garreaud, 2020; Vásquez Yáñez, 2020)), which suggests a stabilizing role of seasonal snow cover. The highest elevation (1,858 m a.s.l.) corresponded to a debris flow in the G009 Colonia de Santa Lucía grid, in areas affected by periglacial processes. This same area concentrated 34% of the total area affected by landslides, which is consistent with the main storm impact trajectory reported for the 2023 events (Garreaud, 2023a, 2024).
Landslide occurrence is strongly concentrated within a relatively narrow slope range (∼22°–34°), while also showing a clear preference for intermediate relief conditions. These patterns indicate a threshold behavior, where slope angle controls the initiation of failure rather than its magnitude, and where moderate topographic dissection provides favorable conditions for slope instability. Under these geomorphological conditions, landslides do not necessarily occur in the steepest or most dissected terrain, but rather in sectors where sufficient material accumulation and slope continuity allow failure to develop.
The concentration of landslides within the Mg and OM2c lithological units further highlights the importance of substrate properties in conditioning slope failure. Miocene plutonic rocks (Mg) commonly exhibit fractured and deeply weathered mantles, whereas the volcano-sedimentary sequences of the OM2c unit are characterized by interbedded lavas, pyroclastic deposits, and weak volcaniclastic layers. The internal heterogeneity and reduced mechanical cohesion of these materials favor rapid saturation and the development of preferential failure surfaces, helping to explain the high frequency of landslides observed within these geological settings.
The contrasting behavior of slope and relief indicates that the controls on landslide magnitude differ from those governing failure initiation. While slope acts as a threshold factor for instability, it does not constrain landslide size once failure conditions are reached. In contrast, relief exerts a non-linear control, suggesting that landslide magnitude is influenced by the interaction between slope length, material availability, and hydrological connectivity. Within the framework of Carson and Kirkby (2009), this reflects the balance between driving forces and limiting factors, where increasing topographic energy alone is insufficient to generate larger landslides without adequate material supply and favorable slope-scale conditions. A similar pattern is observed for NDVI, with larger landslides tending to occur in areas characterized by lower pre-event NDVI values. However, because NDVI does not provide direct information on vegetation type, structure, or root reinforcement, the mechanisms underlying this relationship cannot be determined from the available data.
Spatial recurrence and temporal limitations
No spatial recurrence of landslides was observed between the morphologies mapped during two consecutive years (2023 and 2024), suggesting a strong interannual control on landslide occurrence linked to ENSO-related climate variability. Under the observed conditions, this lack of recurrence indicates that landslide patterns in the study area are primarily driven by climate forcing. Consequently, assessing path-dependent landslide recurrence would require a more extensive rainfall-induced landslide inventory, ideally spanning at least 5 to 10 years, consistent with recommendations for recurrence analysis based on multi-year inventories and biennial temporal partitions (Roberts et al., 2021).
In this context, future work should aim to expand the existing inventory by incorporating intense rainfall events from previous years and by exploring complementary mapping approaches to those applied in this study. For example, a total of 1,226 landslides triggered by the 2010 Maule earthquake were mapped between latitudes 32.5° S and 38.5° S in Chile, with affected areas ranging from 1,000 to 250,000 m2, based on visual interpretation of Landsat imagery (Serey et al., 2019).
Inventory quality and validation
The quality of a landslide inventory depends on its completeness, temporal accuracy, and geomorphological consistency (Guzzetti et al., 2012). The compiled inventory can be considered areally complete for landslides larger than 1,000 m2 and exhibits a temporal resolution constrained to 5–6-day windows. Typological classification was based on the updated Varnes system (Hungr et al., 2014), thereby reducing the ambiguities commonly encountered in susceptibility studies (Reichenbach et al., 2018).
Field validation was limited to four landslides (7% of the inventory), primarily due to accessibility constraints and logistical challenges in steep, high-mountain environments. Nevertheless, the reliability of the inventory is supported by the clear geomorphological expression of landslides in satellite imagery, which enables consistent identification and classification of failure types. In this context, field observations provide complementary, site-specific information that supports the interpretation of remotely sensed data, rather than serving as the sole basis for validation (Guzzetti et al., 2012).
This approach is consistent with most landslide inventories used for susceptibility modeling, which are commonly derived from the interpretation of aerial photographs and satellite imagery rather than from exhaustive field surveys (Reichenbach et al., 2018). In remote mountainous regions, extensive field validation is often constrained by limited accessibility and high logistical costs, further supporting the use of remote sensing–based methods as the primary basis for inventory development.
Methodological transferability and future perspectives
Unlike previous studies primarily focused on detection performance metrics (Handwerger et al., 2022; Lindsay et al., 2022; Nugroho et al., 2021; Peters et al., 2024), this study prioritized the generation of a baseline inventory of rainfall-induced landslides in an Andean sector lacking previous records.
The study area, dominated by glaciated volcanic complexes, glaciofluvial valleys, and Quaternary lahar deposits (Thiele et al., 1998), constitutes a highly complex geomorphological laboratory for assessing the transferability of the SAR-based approach to Andean environments. The VH polarization exhibited robust performance in both forested areas and sectors with sparse vegetation cover. Evaluating the VV polarization emerges as a relevant avenue for future research, particularly in periglacial environments where surface roughness exerts a dominant control on the radar response (Lindsay et al., 2022).
Conclusions
The main findings of this study indicate that the landslides triggered during the extreme meteorological events of June and August 2023 in the Andean Cordillera of the Biobío Region were associated with intense precipitation under warm atmospheric conditions. These conditions coincided with the warm phase of ENSO (El Niño) and the occurrence of zonal atmospheric rivers. The dominant landslide types—debris flows and debris avalanches—are characteristic of mountainous environments and represent a significant hazard due to their capacity to form natural dams and generate downstream flooding.
Importantly, the marked contrast in landslide occurrence between events highlights that not all rainfall episodes produce comparable geomorphic impacts. The concentration of landslides during the June and August 2023 events, compared to their absence during other analyzed events, reflects differences in rainfall intensity and effectiveness in triggering slope instability. In this sense, landslide occurrence can be understood as a direct geomorphic response to rainfall forcing, providing evidence of the magnitude and impact of precipitation events in mountainous environments.
From a methodological perspective, the approach based on changes in Sentinel-1 SAR backscatter intensity processed in Google Earth Engine proved effective for focusing landslide detection in areas characterized by high
It is important to emphasize that the generated inventory does not allow the definition of general rules or universal thresholds for landslide occurrence. Instead, it documents specific activation conditions associated with intense rainfall events within a particular climatic and interannual context. Accordingly, the results should be interpreted as context-dependent evidence, tied to a specific spatial and temporal setting, which is useful for understanding occurrence patterns but should not be extrapolated as general rules to other environments.
A limitation of this study is the field validation restricted to 7% of the inventory, primarily due to accessibility constraints and logistical challenges in steep, high-mountain environments. Despite this, landslides exhibit clear geomorphological signatures in satellite imagery, allowing consistent identification and classification of failure types. This limitation highlights the need for future field validation campaigns focused on representative areas and sectors with higher uncertainty in satellite-based detection.
Finally, as this represents the first inventory of rainfall-induced landslides in the study area, its future updating and expansion are essential under a climate change scenario that projects an increase in the frequency of extreme events. This inventory provides a baseline for the development of landslide susceptibility, hazard, and risk maps, as well as for future research on rain-on-snow processes and the characterization of natural dams generated by landslides. Moreover, it offers a robust dataset for training and validating machine learning approaches for automated landslide detection, contributing to the advancement of scalable and transferable methods for regional landslide mapping.
Footnotes

Funding
The authors received no financial support for the research, authorship, and/or publication of this article.
Declaration of conflicting interests
The authors declared no potential conflicts of interest with respect to the research, authorship, and/or publication of this article.
Data Availability Statement
The landslide inventory generated for this study is publicly available through the Zenodo repository (https://doi.org/10.5281/zenodo.18046852) (Gajardo and Jaque, 2025).