
Abstract
Urban Heat Islands (UHIs) pose growing challenges to urban sustainability, affecting health, energy use, and climate resilience. While urban vegetation cools cities, planners lack tools to prioritize interventions that combine current cooling performance with long-term vegetation health trends. This study develops a novel dual-criteria spatial prioritization framework that integrates modeled current cooling performance from the InVEST Urban Cooling Model (2024) with long-term NDVI trends (MODIS, 2003–2024) to identify priority classes for heat mitigation in Kraków, Poland. Results show a moderate positive association between NDVI and the Heat Mitigation Index (HMI; r = 0.566), with tree cover providing the greatest cooling (HMI: 0.57–0.71). Importantly, 9.37% of vegetated areas showed statistically significant declines in NDVI (p ≤ 0.05), mainly in urban cores. Spatial integration of these layers identified five priority classes for heat mitigation. Highest-priority zones covered 1627.18 ha (4.99%) of the study area, while high-priority zones accounted for 6107.14 ha (18.72%). This spatial prioritization approach enables cities to optimize greening strategies by addressing current deficits and areas of ongoing vegetation decline, supporting proactive, evidence-based urban climate resilience.
Keywords
Introduction
Urban Heat Islands (UHIs) are a well-documented phenomenon in which urban areas experience higher temperatures than their rural surroundings, primarily because of anthropogenic activities and the replacement of natural surfaces with impervious materials (Firozjaei et al., 2025; Ramachandra et al., 2025; Rendana et al., 2023; Shi et al., 2023; Matthews, 2018; Stewart and Oke, 2012). This temperature differential intensifies heat stress, increases cooling energy demand, and adversely affects public health and thermal comfort (Li et al., 2024; Yavuz and Ünlütürk, 2025). In response, nature-based solutions (NBS) have become an important strategy for urban climate adaptation, with vegetation playing a central role through shading and evapotranspiration (Eyni et al., 2025; Li et al., 2024; Yavuz and Ünlütürk, 2025).
The cooling effect of urban vegetation, however, is not uniform and depends on vegetation type, density, and spatial configuration; thus, assessing cooling performance is a critical issue in urban climate research (Fan et al., 2015; Liu et al., 2025; Ma et al., 2025). The need to quantify vegetation-mediated cooling is further reinforced by climate change and rapid urbanization, both of which are increasing the frequency and severity of urban heat exposure (Sánchez-Cordero et al., 2025; Y. Li et al., 2024; Huang et al., 2020). Effective urban planning, therefore, requires spatially explicit evidence of which vegetation types provide the greatest cooling benefits and where intervention is most urgently needed (Moncada-Morales et al., 2025; Gallay et al., 2023). Without such information, greening strategies may be allocated inefficiently and less effectively to reduce thermal risk and improve urban climate resilience (Gallay et al., 2023; Yu and Piao, 2025).
Although urban greening is increasingly applied as a heat-mitigation strategy, a significant gap remains between static assessments of cooling and a dynamic understanding of vegetation change over time. Most existing studies evaluate urban cooling at a single time point, either by correlating greenness indices with land surface temperature or by modeling cooling potential based on current land-cover conditions (Bowler et al., 2010; Gomaa et al., 2025; Halder et al., 2025; Liu et al., 2025). These methods offer valuable insights into present conditions, yet they do not determine whether vegetation in a specific location is stable, improving, or declining over extended periods. Consequently, the relationship between long-term vegetation trajectories and current cooling performance remains unclear, as does the identification of areas at heightened risk of future heat-mitigation loss. This knowledge gap constrains planners from shifting toward proactive, spatially targeted greening strategies (Jonescu et al., 2024; Moncada-Morales et al., 2025).
This study addresses that gap by developing a dual-criteria spatial prioritization framework for urban heat mitigation. The framework integrates modeled current cooling performance, represented by the Heat Mitigation Index (HMI) derived from the InVEST Urban Cooling Model, with long-term vegetation trends based on Normalized Difference Vegetation Index (NDVI) data from 2003 to 2024. Applied to Kraków, Poland, the study has three objectives: (1) to assess the relationship between vegetation condition (NDVI) and modeled cooling performance (HMI); (2) to identify areas that have experienced significant long-term vegetation decline; and (3) to delineate priority heat mitigation classes by integrating current cooling performance with long-term vegetation trends. By linking current cooling deficits to vegetation trajectories, the study provides a practical framework for identifying where greening interventions are most urgently needed and offers a transferable approach to evidence-based urban climate adaptation.
Materials and methods
Study area
Kraków, located in the Małopolska Province, is the second-largest city in Poland, covering approximately 327 km2 and inhabited by more than 800,000 residents (Hajto et al., 2025; Kurek and Wójtowicz, 2018). The city lies within the Vistula River valley at an elevation of about 200 m and is surrounded by hills exceeding 400 m in altitude. Meteorological conditions during 2003–2024 indicate marked seasonal variability, with dry-bulb temperatures ranging from winter lows below 0°C to summer highs of 24–30°C, and relative humidity frequently exceeding 80–90%, particularly at night. Low wind speeds further intensify the urban heat island effect, highlighting the importance of urban vegetation in moderating thermal stress. The city’s diverse land-cover structure provides a suitable setting for examining vegetation’s cooling performance and spatial priorities for heat mitigation (Figure 1). The geographical location of Kraków is shown with the administrative division and urban vegetation cover.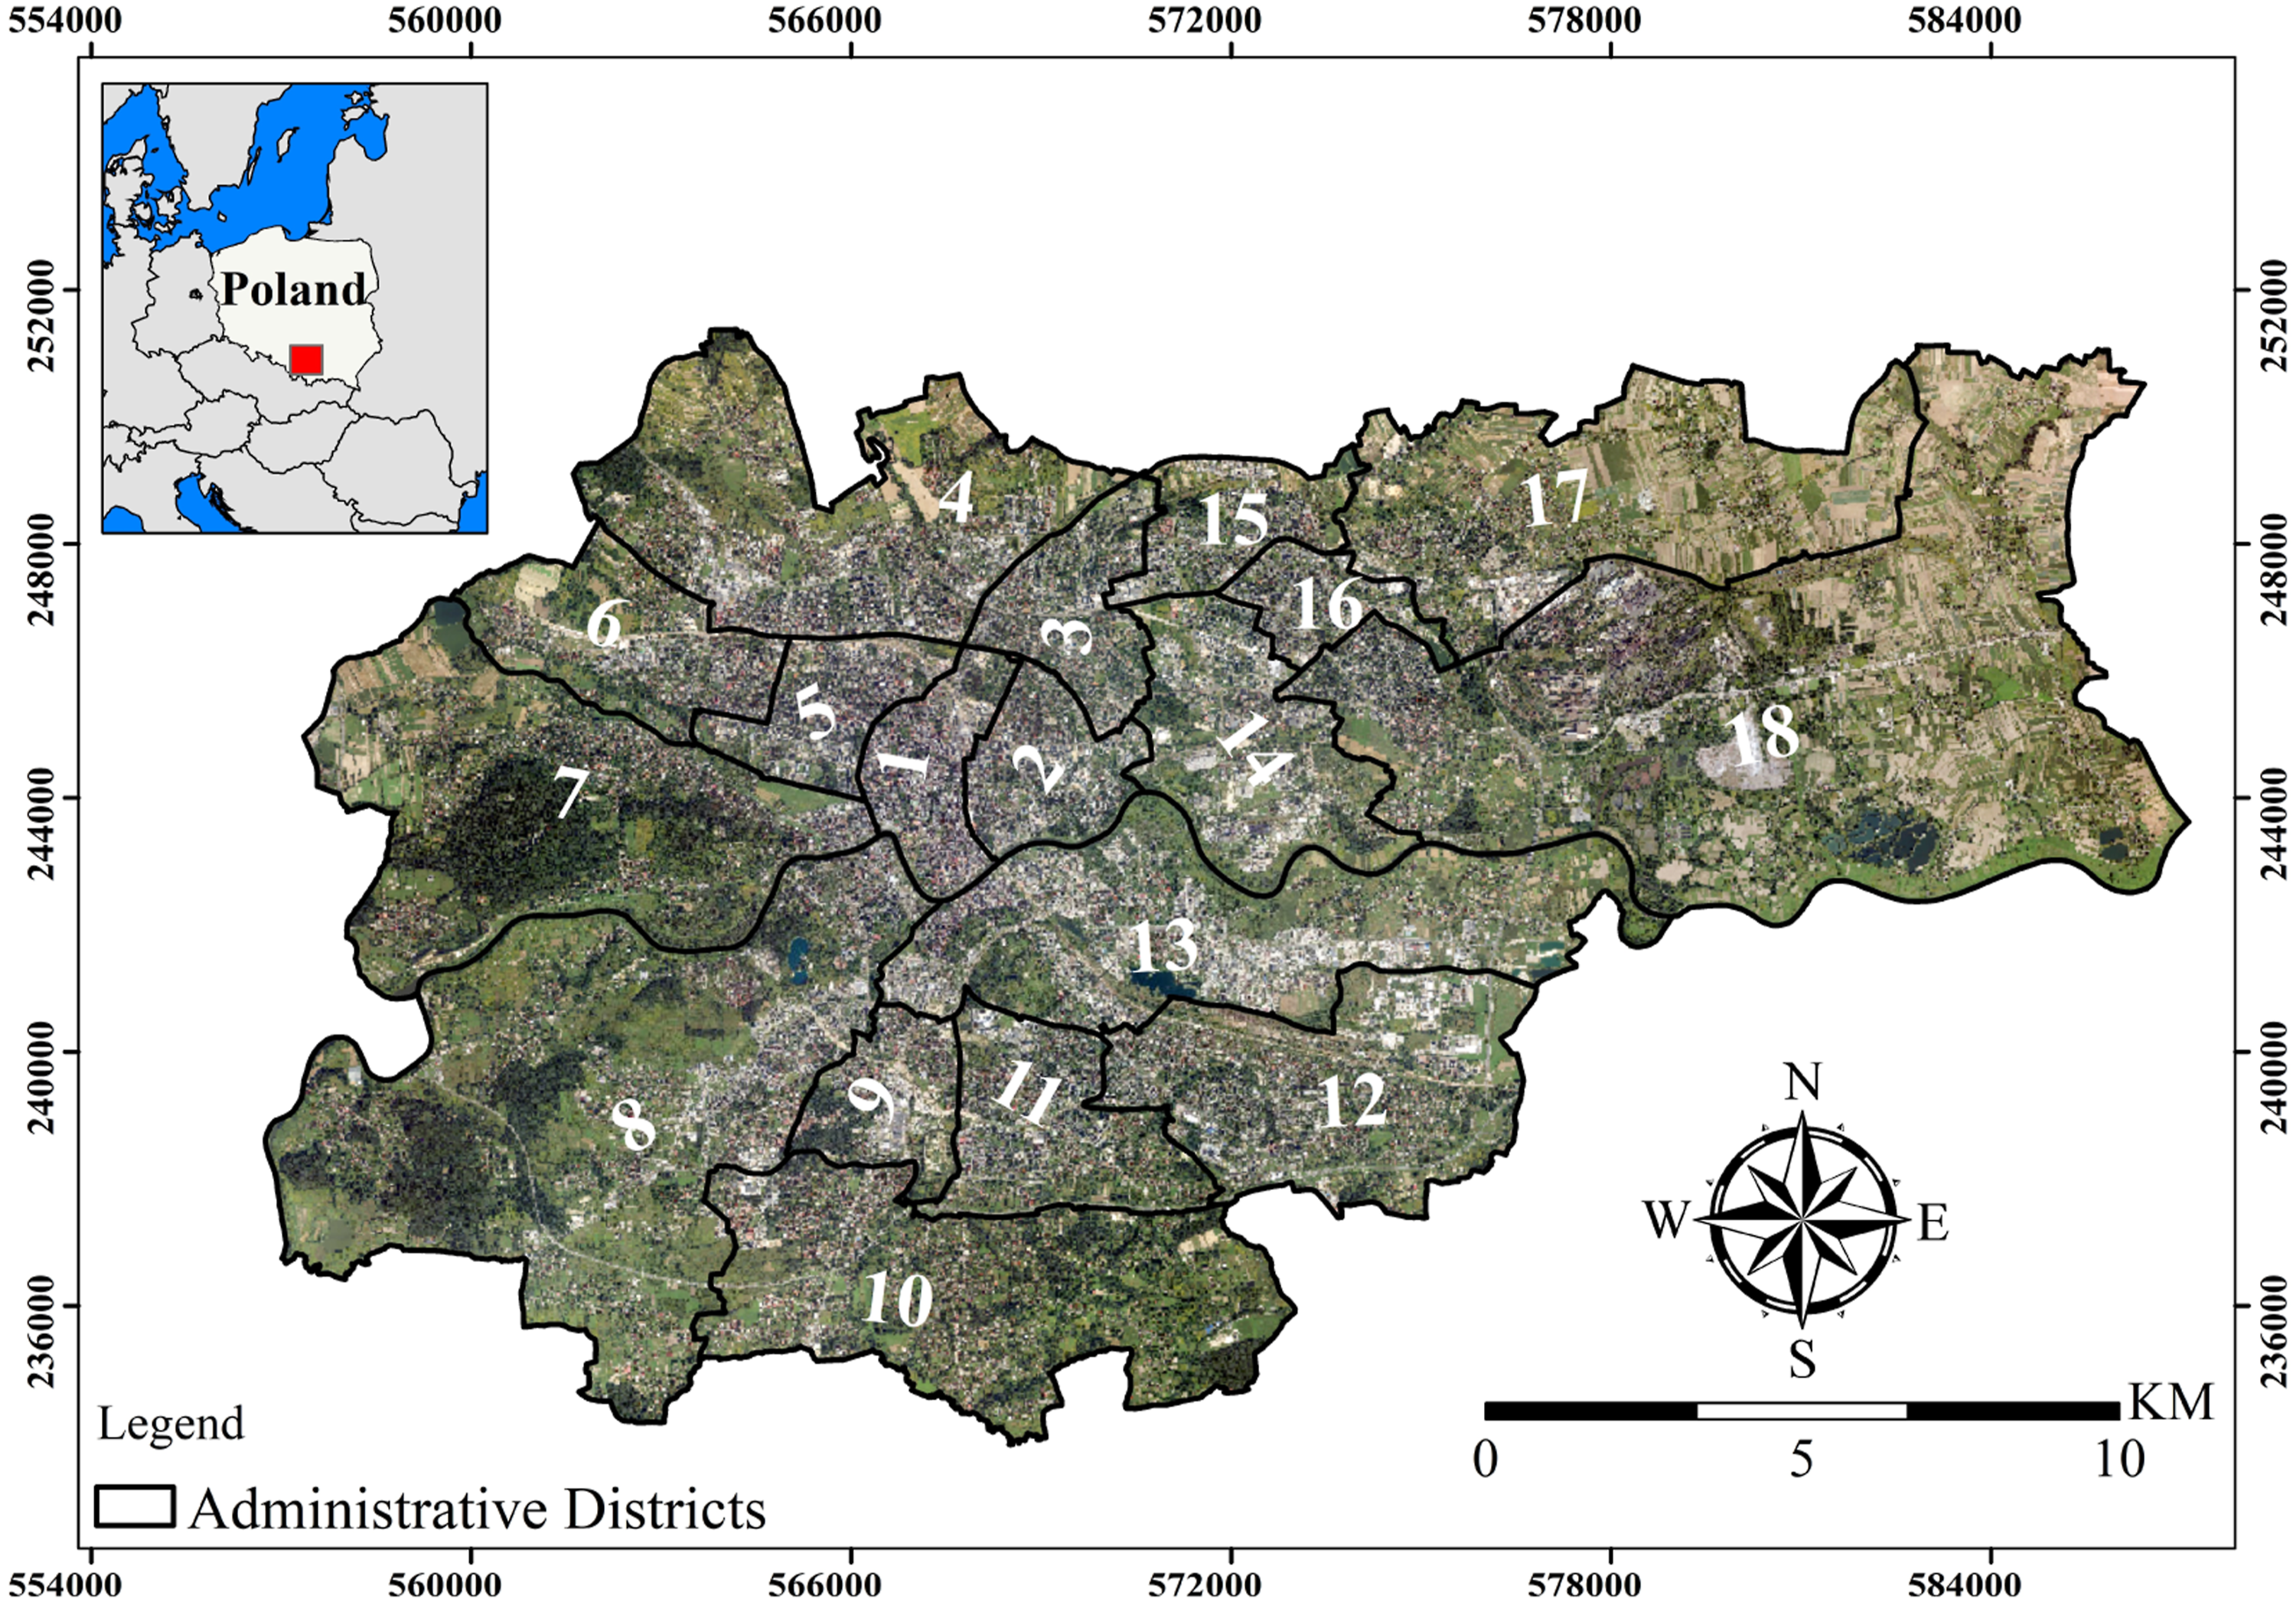
Data sources and processing
Land cover for baseline cooling assessment
To accurately represent the urban landscape in the baseline cooling model, we used the 2024 Sentinel-2 10-meter Land Use/Land Cover map from the Esri Land Cover Time Series. This high-resolution, contemporary map provides a detailed snapshot of land cover classes critical to cooling modeling: Tree Cover, Grassland, Cropland, Built-up (Impervious), Bare Soil, and Water, at 10-meter resolution. This resolution is far superior to the 250-meter resolution of MODIS land-cover products in capturing fine-scale urban features. This map served as the primary land cover input for the InVEST Urban Cooling model to calculate the baseline Heat Mitigation Index (HMI), representing cooling efficiency circa 2024.
Vegetation dynamics for trend analysis
Long-term vegetation dynamics were assessed using the MODIS MOD13Q1.061 NDVI product, which provides 16-day observations at a spatial resolution of 250 m (Paul et al., 2025; Švik et al., 2025). This dataset was selected because it offers a temporally consistent record suitable for detecting statistically significant changes in vegetation greenness over the 2003–2024 period. Although the MOD13Q1 product is available from earlier years, the 2003–2024 period was selected to ensure a complete and internally consistent annual NDVI time series after quality screening and aggregation. This period provided sufficient temporal depth for robust Mann–Kendall and Sen’s slope trend estimates while minimizing inconsistencies arising from incomplete or lower-quality early observations. To quantify long-term trends, the Mann–Kendall test and Sen’s slope estimator were applied to annual maximum NDVI values, thereby reducing the influence of seasonal variability and cloud-related noise.
Before calculating annual maximum NDVI, low-quality MODIS observations were screened using the quality-assurance information provided with the MOD13Q1.061 product. Observations affected by cloud contamination, snow/ice, unreliable retrieval conditions, or poor pixel reliability were excluded. Annual maximum NDVI values were then derived from the remaining quality-controlled 16-day observations, reducing the influence of atmospheric contamination and short-term noise on the trend analysis.
A key methodological consideration is the difference in spatial resolution and sensor origin between the NDVI trend data (250 m, MODIS) and the land-cover data used for the current cooling assessment (10 m, Sentinel-2/Esri). In this study, these datasets serve complementary rather than equivalent purposes: the MODIS NDVI series is used to capture long-term vegetation trajectories at a neighborhood scale, while the 10 m land-cover dataset represents current urban land-cover conditions in greater spatial detail. For integrated priority mapping, the high-resolution 2024 land-cover data were aggregated to the 250 m MODIS analysis grid, and the dominant land-cover class within each grid cell was identified. This approach allows long-term NDVI trends to be interpreted in relation to the most recent land-cover structure while maintaining a consistent spatial unit for overlay analysis.
Integrated analytical framework
The novel analytical framework developed in this study integrates current cooling performance with long-term vegetation change to support spatial prioritization of heat mitigation. First, current cooling performance was represented by the Heat Mitigation Index (HMI), calculated using the 2024 high-resolution land-use/land-cover map within the InVEST Urban Cooling Model. This layer provides a spatially detailed representation of the present cooling performance across the city. Second, the historical vegetation trajectory was characterized using MODIS NDVI trends over 2003–2024, identifying areas of significant long-term vegetation improvement, stability, or decline.
To harmonize the spatial resolution of the current cooling layer with the MODIS-based vegetation trend layer, the 10 m HMI raster produced by the InVEST Urban Cooling Model was aggregated to the common 250 m MODIS analysis grid. For each 250 m grid cell, the aggregated HMI value was calculated as the area-weighted mean of all valid 10 m HMI pixels falling within that cell. The resulting 250 m HMI layer was then used for quartile-based thresholding and overlay analysis with the MODIS NDVI trend classes.
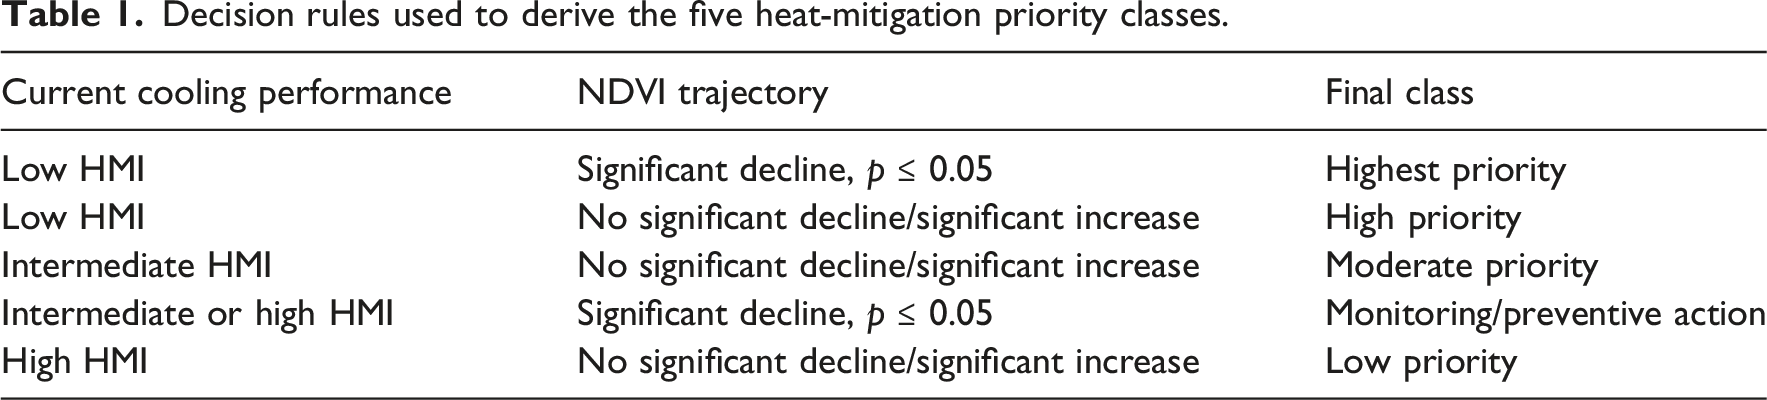
Decision rules used to derive the five heat-mitigation priority classes.
Climate data
Climate data for the InVEST Urban Cooling Model, required for calculating the evapotranspiration component of cooling performance, were obtained from the global reference evapotranspiration (ETo/PET) raster dataset developed by Zomer et al. (2022). These data are based on the FAO-56 Penman–Monteith equation and bias-corrected using WorldClim, providing a consistent climatological basis for model parameterization. For the baseline cooling assessment, the 1970–2000 climatology was used as a standardized reference surface rather than as a reconstruction of actual 2024 meteorological conditions. This choice allows current land-cover patterns to be evaluated against a stable climatic baseline. It reduces the influence of short-term interannual variability on the estimation of vegetation-related cooling performance.
In this study, the historical climatology was used only to parameterize the baseline InVEST cooling assessment. Although current land-cover and vegetation conditions may not fully correspond to the 1970–2000 climate normal, this approach is more appropriate for comparing relative spatial differences in cooling performance than for reproducing absolute contemporary thermal conditions. This limitation is acknowledged in the interpretation of the results. Within the InVEST model, monthly potential evapotranspiration (PET) raster datasets were used to calculate the annual evapotranspiration-related cooling contribution by linking PET values to the 2024 land-cover map and assigning appropriate crop coefficients (Kc) to each land-cover type.
Urban cooling modeling
The InVEST Urban Cooling Model was used to estimate vegetation-related cooling performance across Kraków. The model represents urban cooling through the combined effects of shade, evapotranspiration, and surface albedo, which together determine each pixel’s cooling capacity.
Cooling Capacity index
The Cooling Capacity (CC) index for each pixel was calculated as follows:
Evapotranspiration index
The evapotranspiration index was calculated as follows: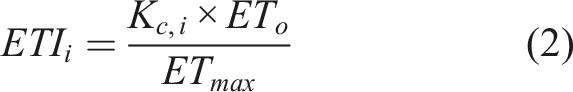
Reference evapotranspiration
Reference evapotranspiration was derived using the FAO-56 Penman–Monteith equation: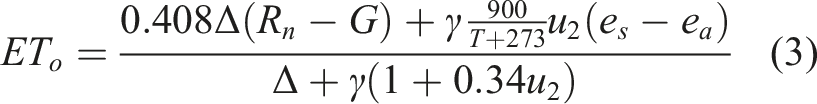
Heat Mitigation Index
For large green areas, the Heat Mitigation Index (HMI) was calculated as follows: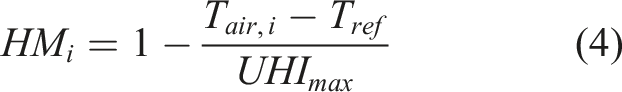
Vegetation trend analysis
Mann–Kendall trend test
Long-term NDVI trends during 2003–2024 were evaluated using the Mann–Kendall test. The Mann–Kendall statistic 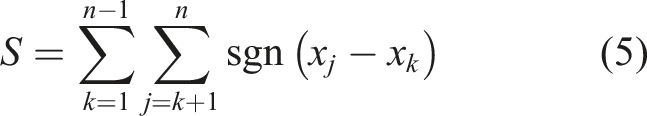
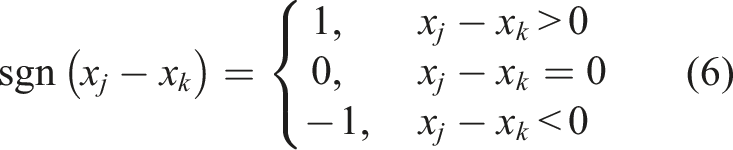
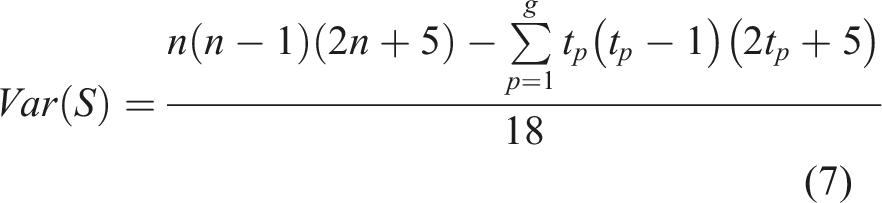
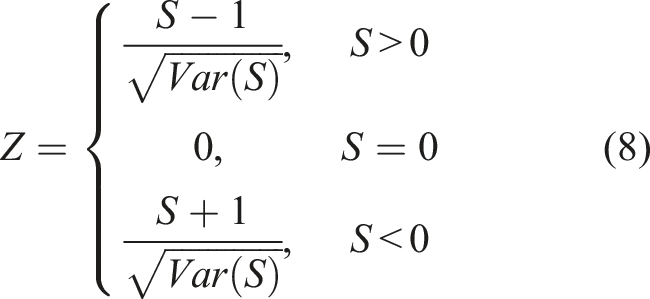
Negative and statistically significant
Sen’s slope estimation
The magnitude of NDVI change was quantified using Sen’s slope estimator: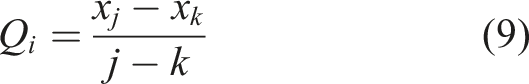
Statistical analysis and validation
Statistical analyses were conducted to assess the empirical consistency of the InVEST-derived Heat Mitigation Index (HMI), examine the long-term temporal association between vegetation and land surface temperature, and contextualize the spatial relationship between vegetation condition and modeled cooling performance. First, the spatial consistency between the InVEST-derived Heat Mitigation Index (HMI) and observed thermal conditions was examined using the Landsat Collection 2 Level-2 Surface Temperature product for Kraków, Poland. The Landsat LST layer was obtained from cloud-free Summer 2024 Landsat Collection 2 Level-2 Surface Temperature observations covering the study area and derived from the Landsat 8/9 OLI/TIRS thermal sensor system. The LST raster was clipped to the Kraków administrative boundary and spatially harmonized with the HMI layer. Because the HMI surface was originally produced from the 10 m land-cover input, it was aggregated to the common 250 m MODIS analysis grid using the area-weighted mean of valid pixels within each grid cell. The Landsat-derived LST layer was then co-registered and aggregated/resampled to the same 250 m grid to ensure cell-by-cell comparison. Pearson’s correlation was calculated across matched 250 m grid cells within the Kraków study boundary. A significant negative spatial correlation was found between HMI and LST (Pearson’s r = −0.48, p < 0.001), indicating broad spatial agreement between higher modeled cooling performance and lower observed surface temperatures. This comparison was used as a limited spatial consistency check rather than as a full validation of the prioritization framework.
Second, a monthly time series of LST and MODIS NDVI (2003–2024) revealed a strong temporal association (r = +0.89) at the seasonal scale. This mainly reflects seasonal phenological cycles in this temperate climate, with summer peaks in both temperature and vegetation activity, and is therefore presented as contextual evidence rather than as a direct test of cooling performance. Third, the association between NDVI and HMI was quantified using Pearson’s r (r = 0.566). This shows a moderate spatial association between modeled cooling and the city’s vegetation gradient. However, this analysis does not constitute mechanistic validation, as HMI itself incorporates vegetation-related parameters. Finally, a sensitivity analysis varied key InVEST parameters (cooling distance and green area threshold by ± 30%). While absolute HMI values showed moderate sensitivity, the relative spatial patterns of priority zones remained robust. These results support the use of the framework for spatial prioritization and indicate that the uncertainty assessment is limited to selected model parameters rather than the full parameter space (Figure 2). Workflow for identifying priority heat mitigation zones.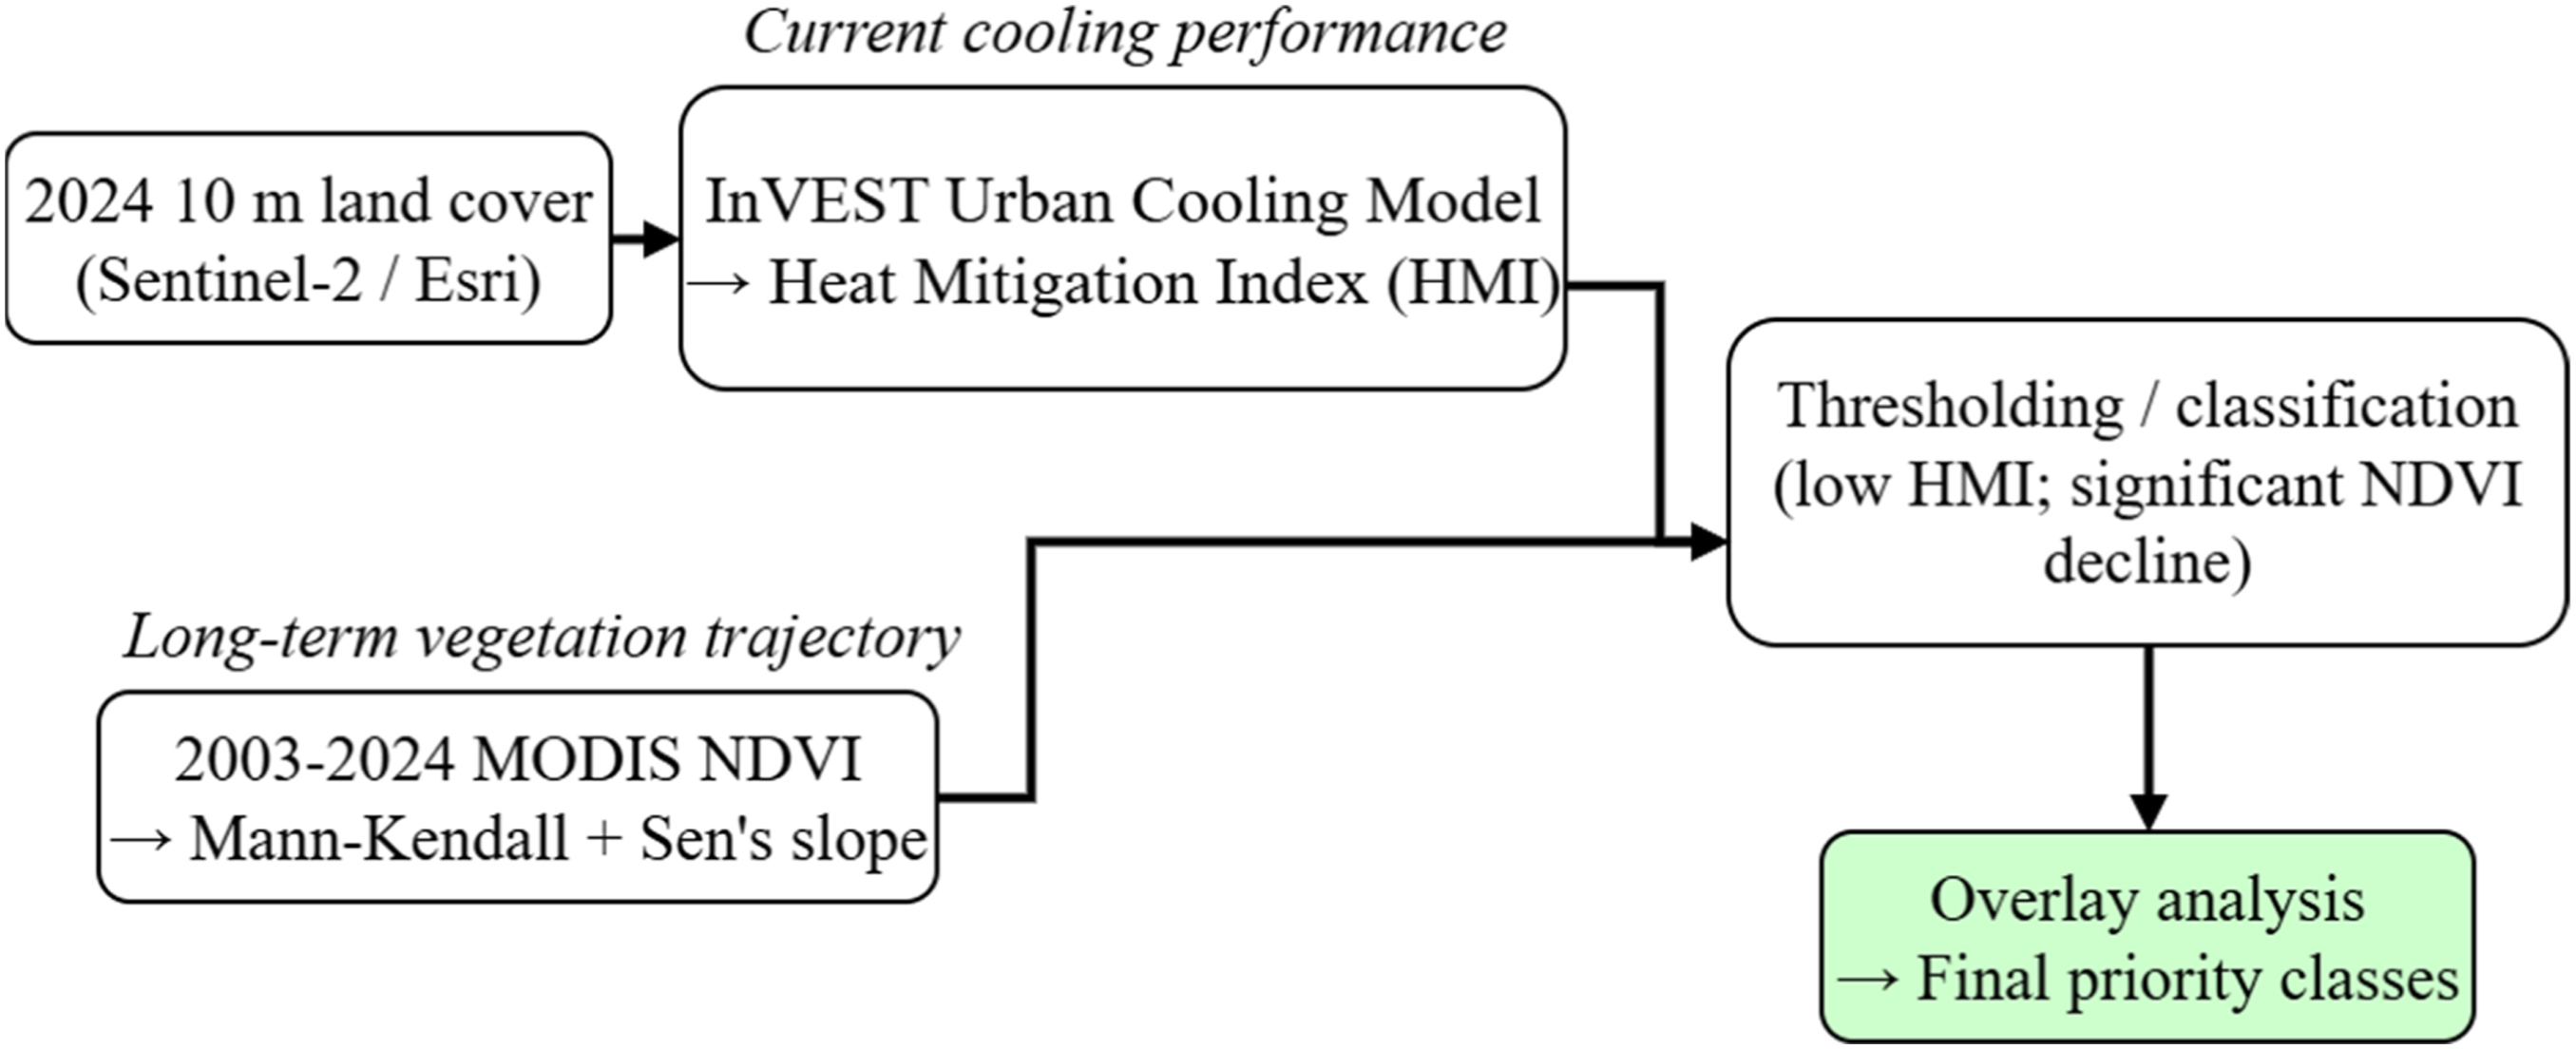
Results
Current cooling performance in Kraków
The InVEST Urban Cooling Model indicates clear spatial contrasts in vegetation-related cooling performance across Kraków (Figure 3). Areas with greater vegetation cover, particularly tree-dominated land-cover classes, exhibit higher cooling performance. In contrast, built-up and sparsely vegetated areas show lower values. The spatial pattern of the Heat Mitigation Index (HMI) highlights the importance of urban green spaces in moderating thermal conditions, with the highest values concentrated in parks, wooded zones, and other vegetated areas. In contrast, densely built urban surfaces generally display lower cooling performance. The Cooling Capacity (CC) and shade layers further support this pattern, showing that vegetation-rich areas provide stronger cooling through shading and evapotranspiration. These results confirm that current cooling performance in Kraków is closely associated with the spatial distribution of vegetated land cover and that tree-covered areas represent the most effective cooling elements within the urban landscape. Spatial distribution and impact of urban vegetation on heat mitigation in Kraków: InVEST® urban cooling model analysis. (a) Land use land cover. (b) Heat mitigation index. (c) Cooling capacity. (d) Shade.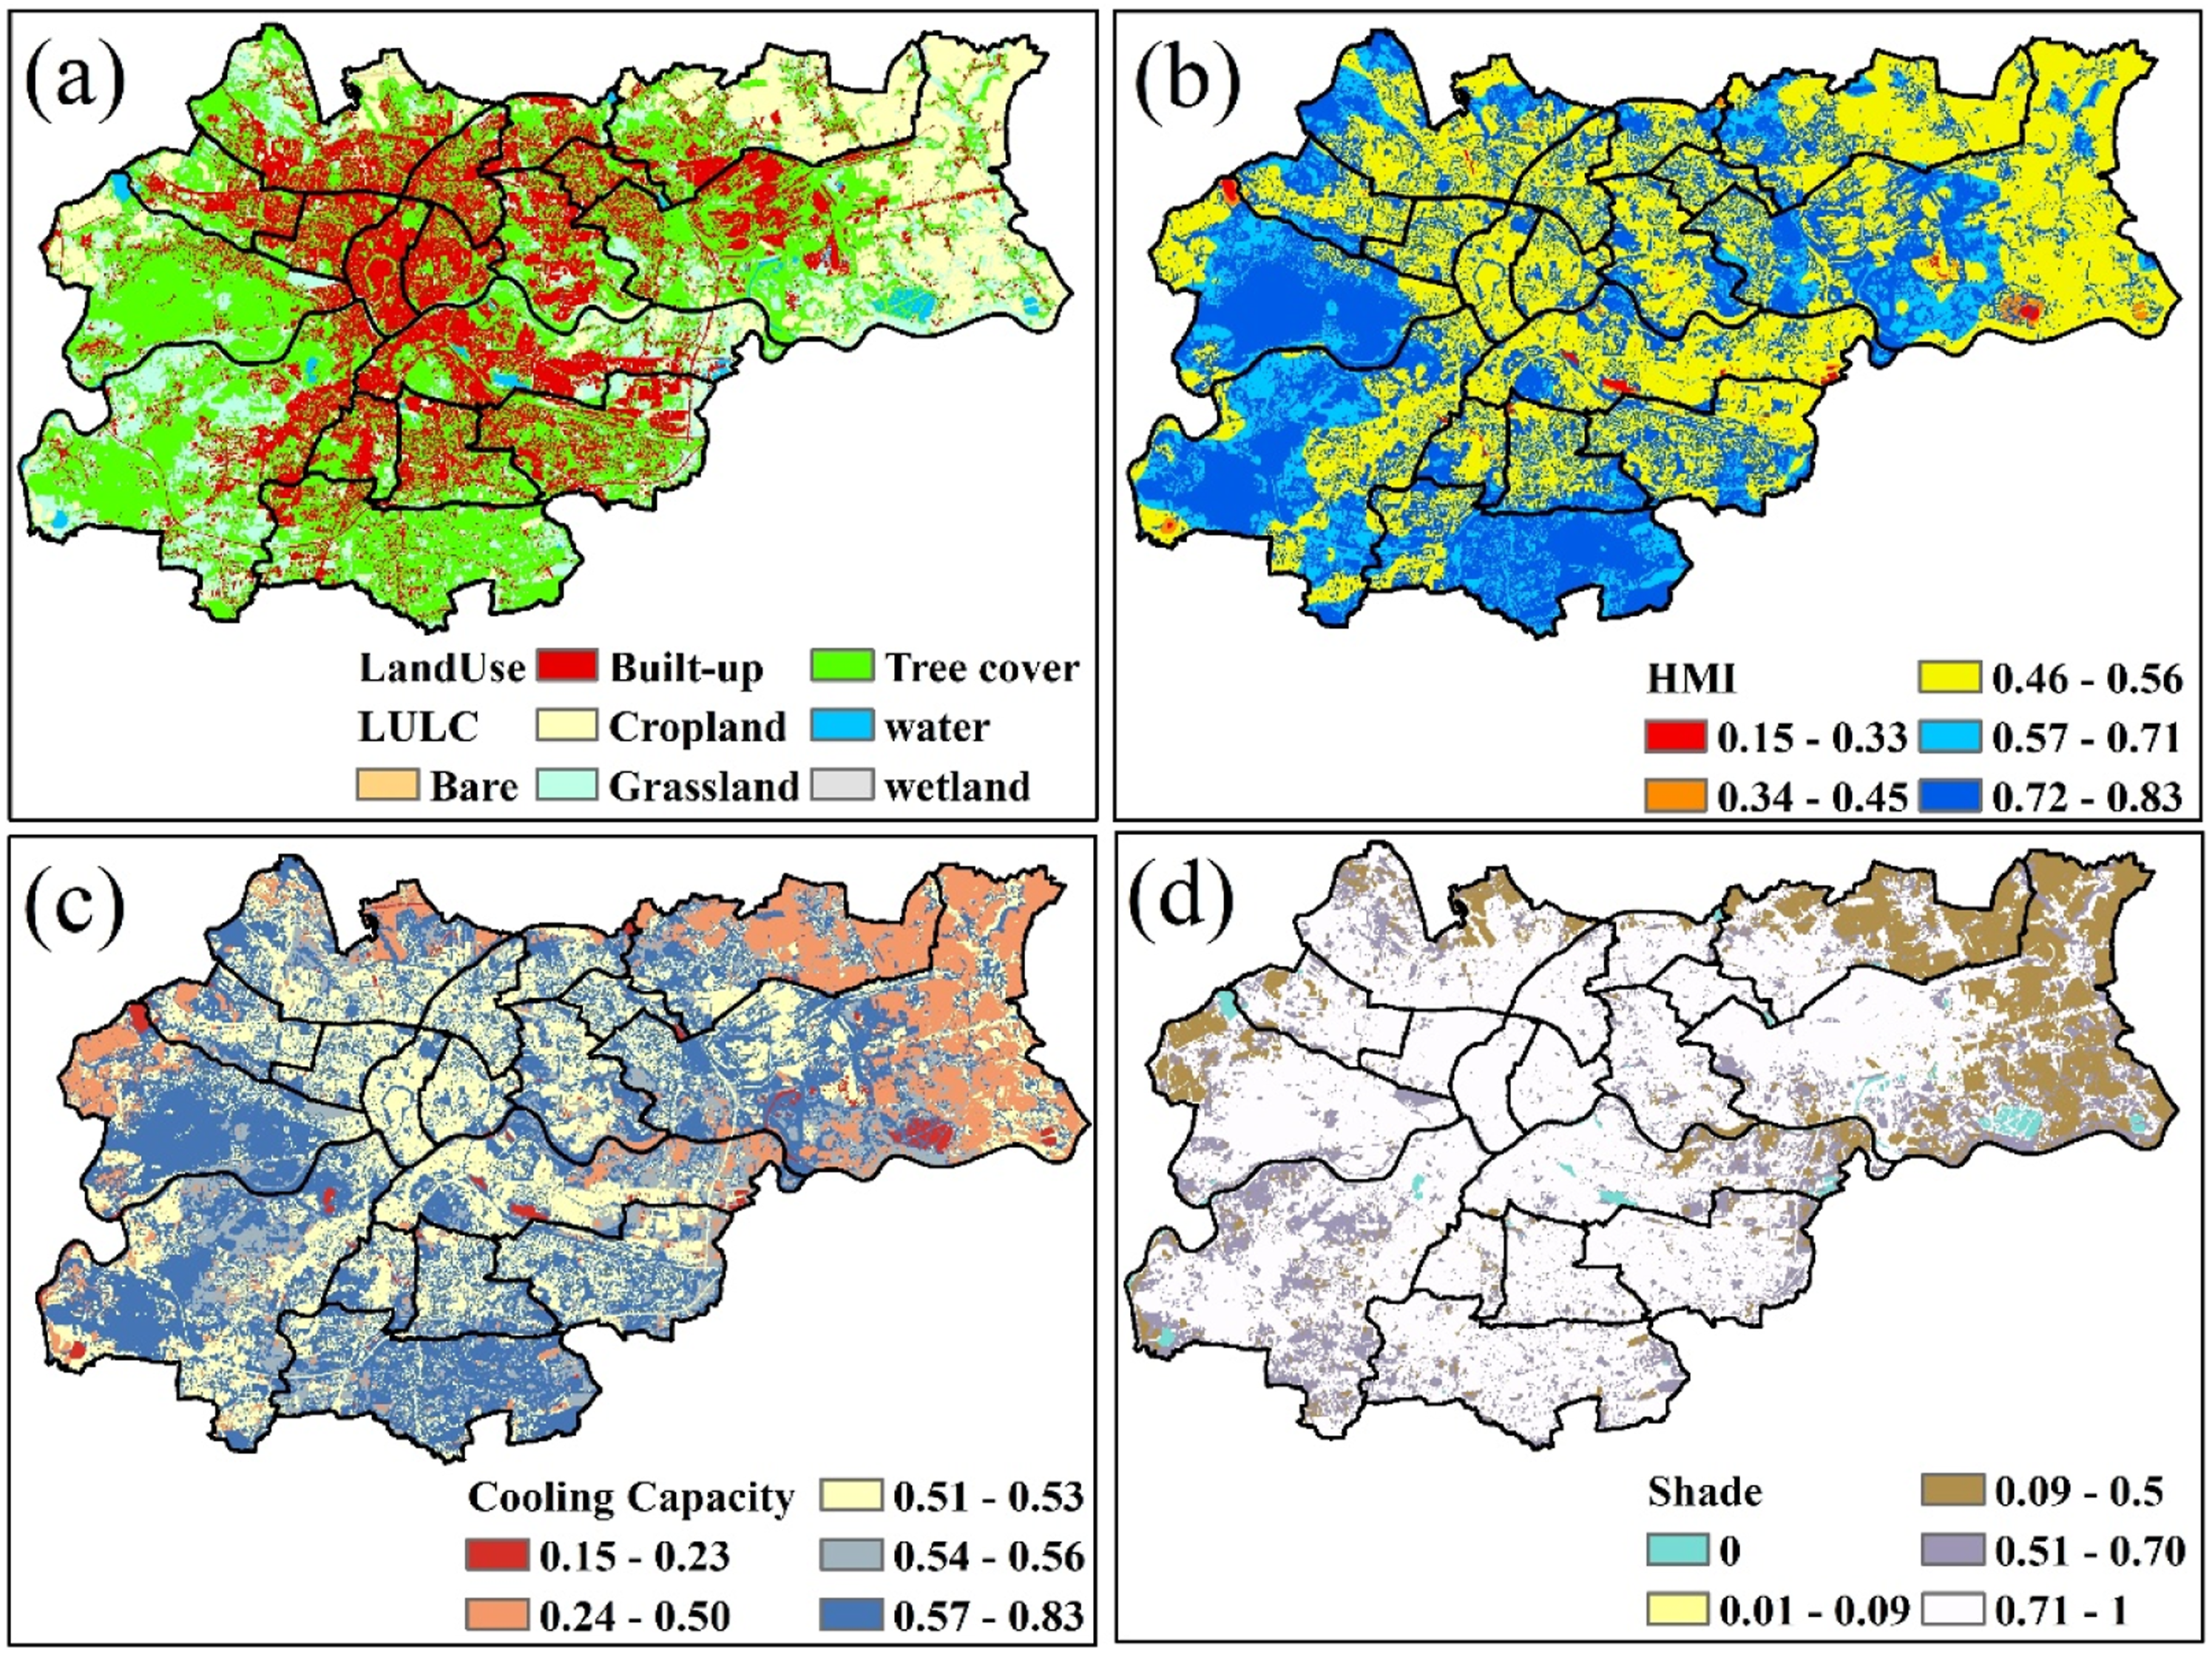
Long-term vegetation trends and priority heat mitigation classes
The Mann–Kendall trend analysis of NDVI for 2003–2024 reveals spatially heterogeneous long-term vegetation dynamics across Kraków (Figure 4(a)). Areas of significant NDVI decline are concentrated mainly in parts of the urban core and other built-up zones, while areas of significant increase are more common in less densely developed and more vegetated parts of the city. A substantial proportion of the study area shows no significant long-term trend, indicating relative stability in vegetation condition over the study period. Long-term vegetation trends and priority heat mitigation classes in Kraków. (a) Spatial distribution of significant NDVI trends during 2003–2024 based on the Mann–Kendall test, using p ≤ 0.05 as the significance threshold. (b) Priority classes derived from the integration of long-term vegetation trends and current cooling performance represented by the Heat Mitigation Index (HMI).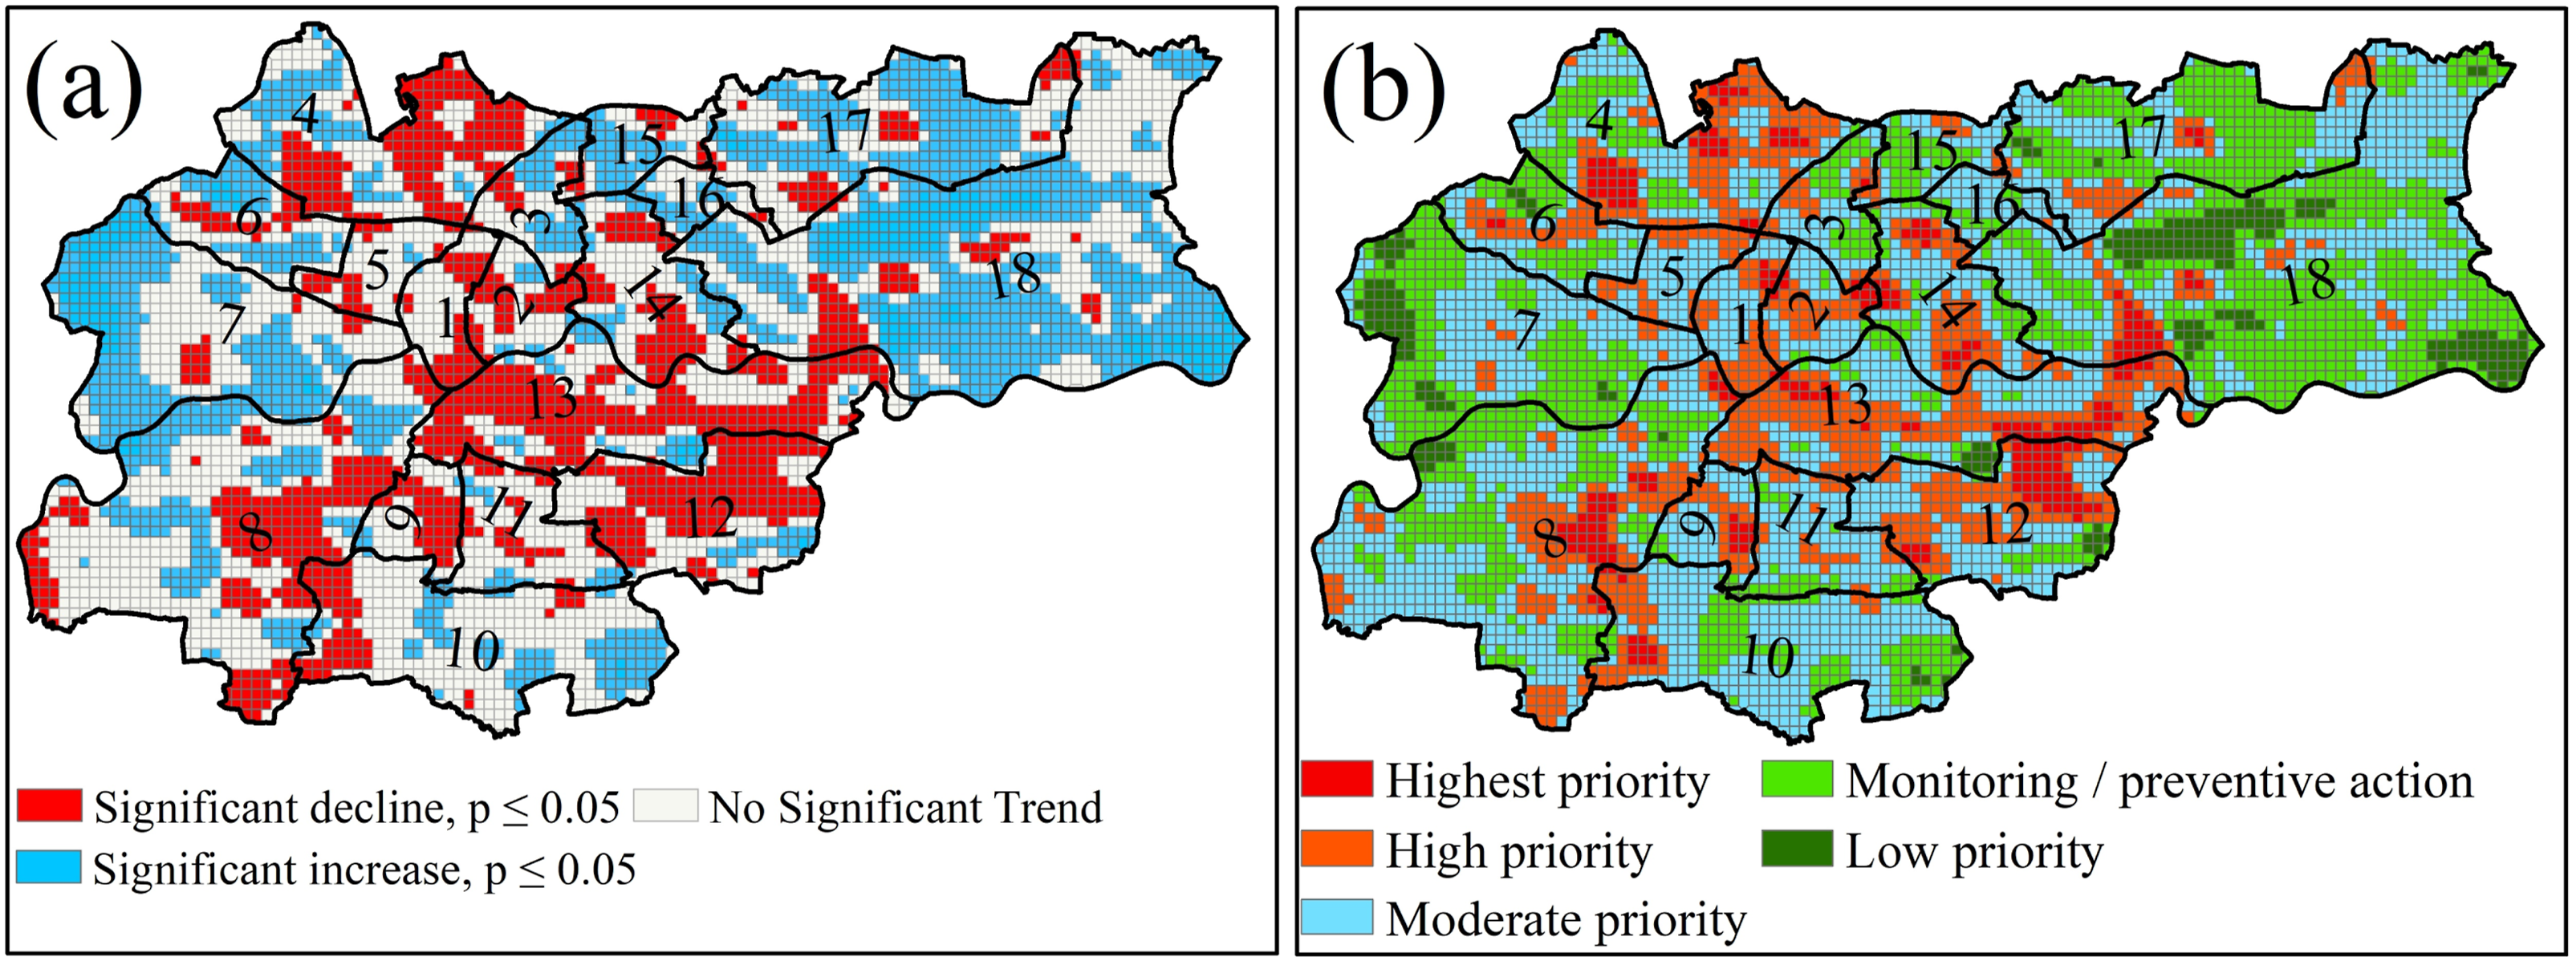
To translate these patterns into a planning-oriented output, long-term vegetation trends were integrated with current cooling performance (HMI) to derive priority heat-mitigation classes (Figure 4(b)). This framework identified five classes reflecting different combinations of current cooling conditions and vegetation trajectories. Moderate-priority zones occupied the largest share of the study area, covering 13,419.67 ha (41.13%), followed by monitoring/preventive action zones with 10,021.57 ha (30.72%) and high-priority zones with 6107.14 ha (18.72%). Highest-priority zones accounted for 1627.18 ha (4.99%), while low-priority zones covered 1451.18 ha (4.45%).
The highest-priority class represents areas where current cooling performance is weakest and where long-term vegetation decline has also been observed, indicating the strongest need for intervention. High-priority and moderate-priority classes represent areas with varying degrees of cooling limitation and vegetation vulnerability, while monitoring/preventive action zones indicate locations where cooling performance remains relatively better, but vegetation trajectories suggest potential future risk. Together, the highest- and high-priority classes account for 23.71% of the study area, highlighting that nearly one-quarter of Kraków requires immediate or near-term attention in urban greening and heat mitigation planning.
Relationship between NDVI and heat mitigation index
The relationship between NDVI and the Heat Mitigation Index (HMI) shows a moderate positive spatial association (Figure 5). Pearson’s correlation coefficient was 0.5659 (p < 2.2e–16), indicating that areas with healthier and denser vegetation generally correspond to higher modeled cooling performance. The fitted regression equation, HMI = 0.3693 + 0.5367× NDVI, and an R2 value of 0.3202 suggest that NDVI explains a meaningful, although not exhaustive, share of the spatial variation in HMI. This result is consistent with the expected contribution of vegetation to urban cooling. Still, it should be interpreted as a contextual spatial association rather than as a mechanistic validation because vegetation-related properties are already embedded in the HMI formulation. Nevertheless, the analysis supports the broader interpretation that greener urban surfaces tend to provide stronger cooling benefits and that vegetation condition remains an important spatial correlate of current cooling performance. Correlation between NDVI and Heat Mitigation Index (HMI) in Kraków: Regression and trend analysis.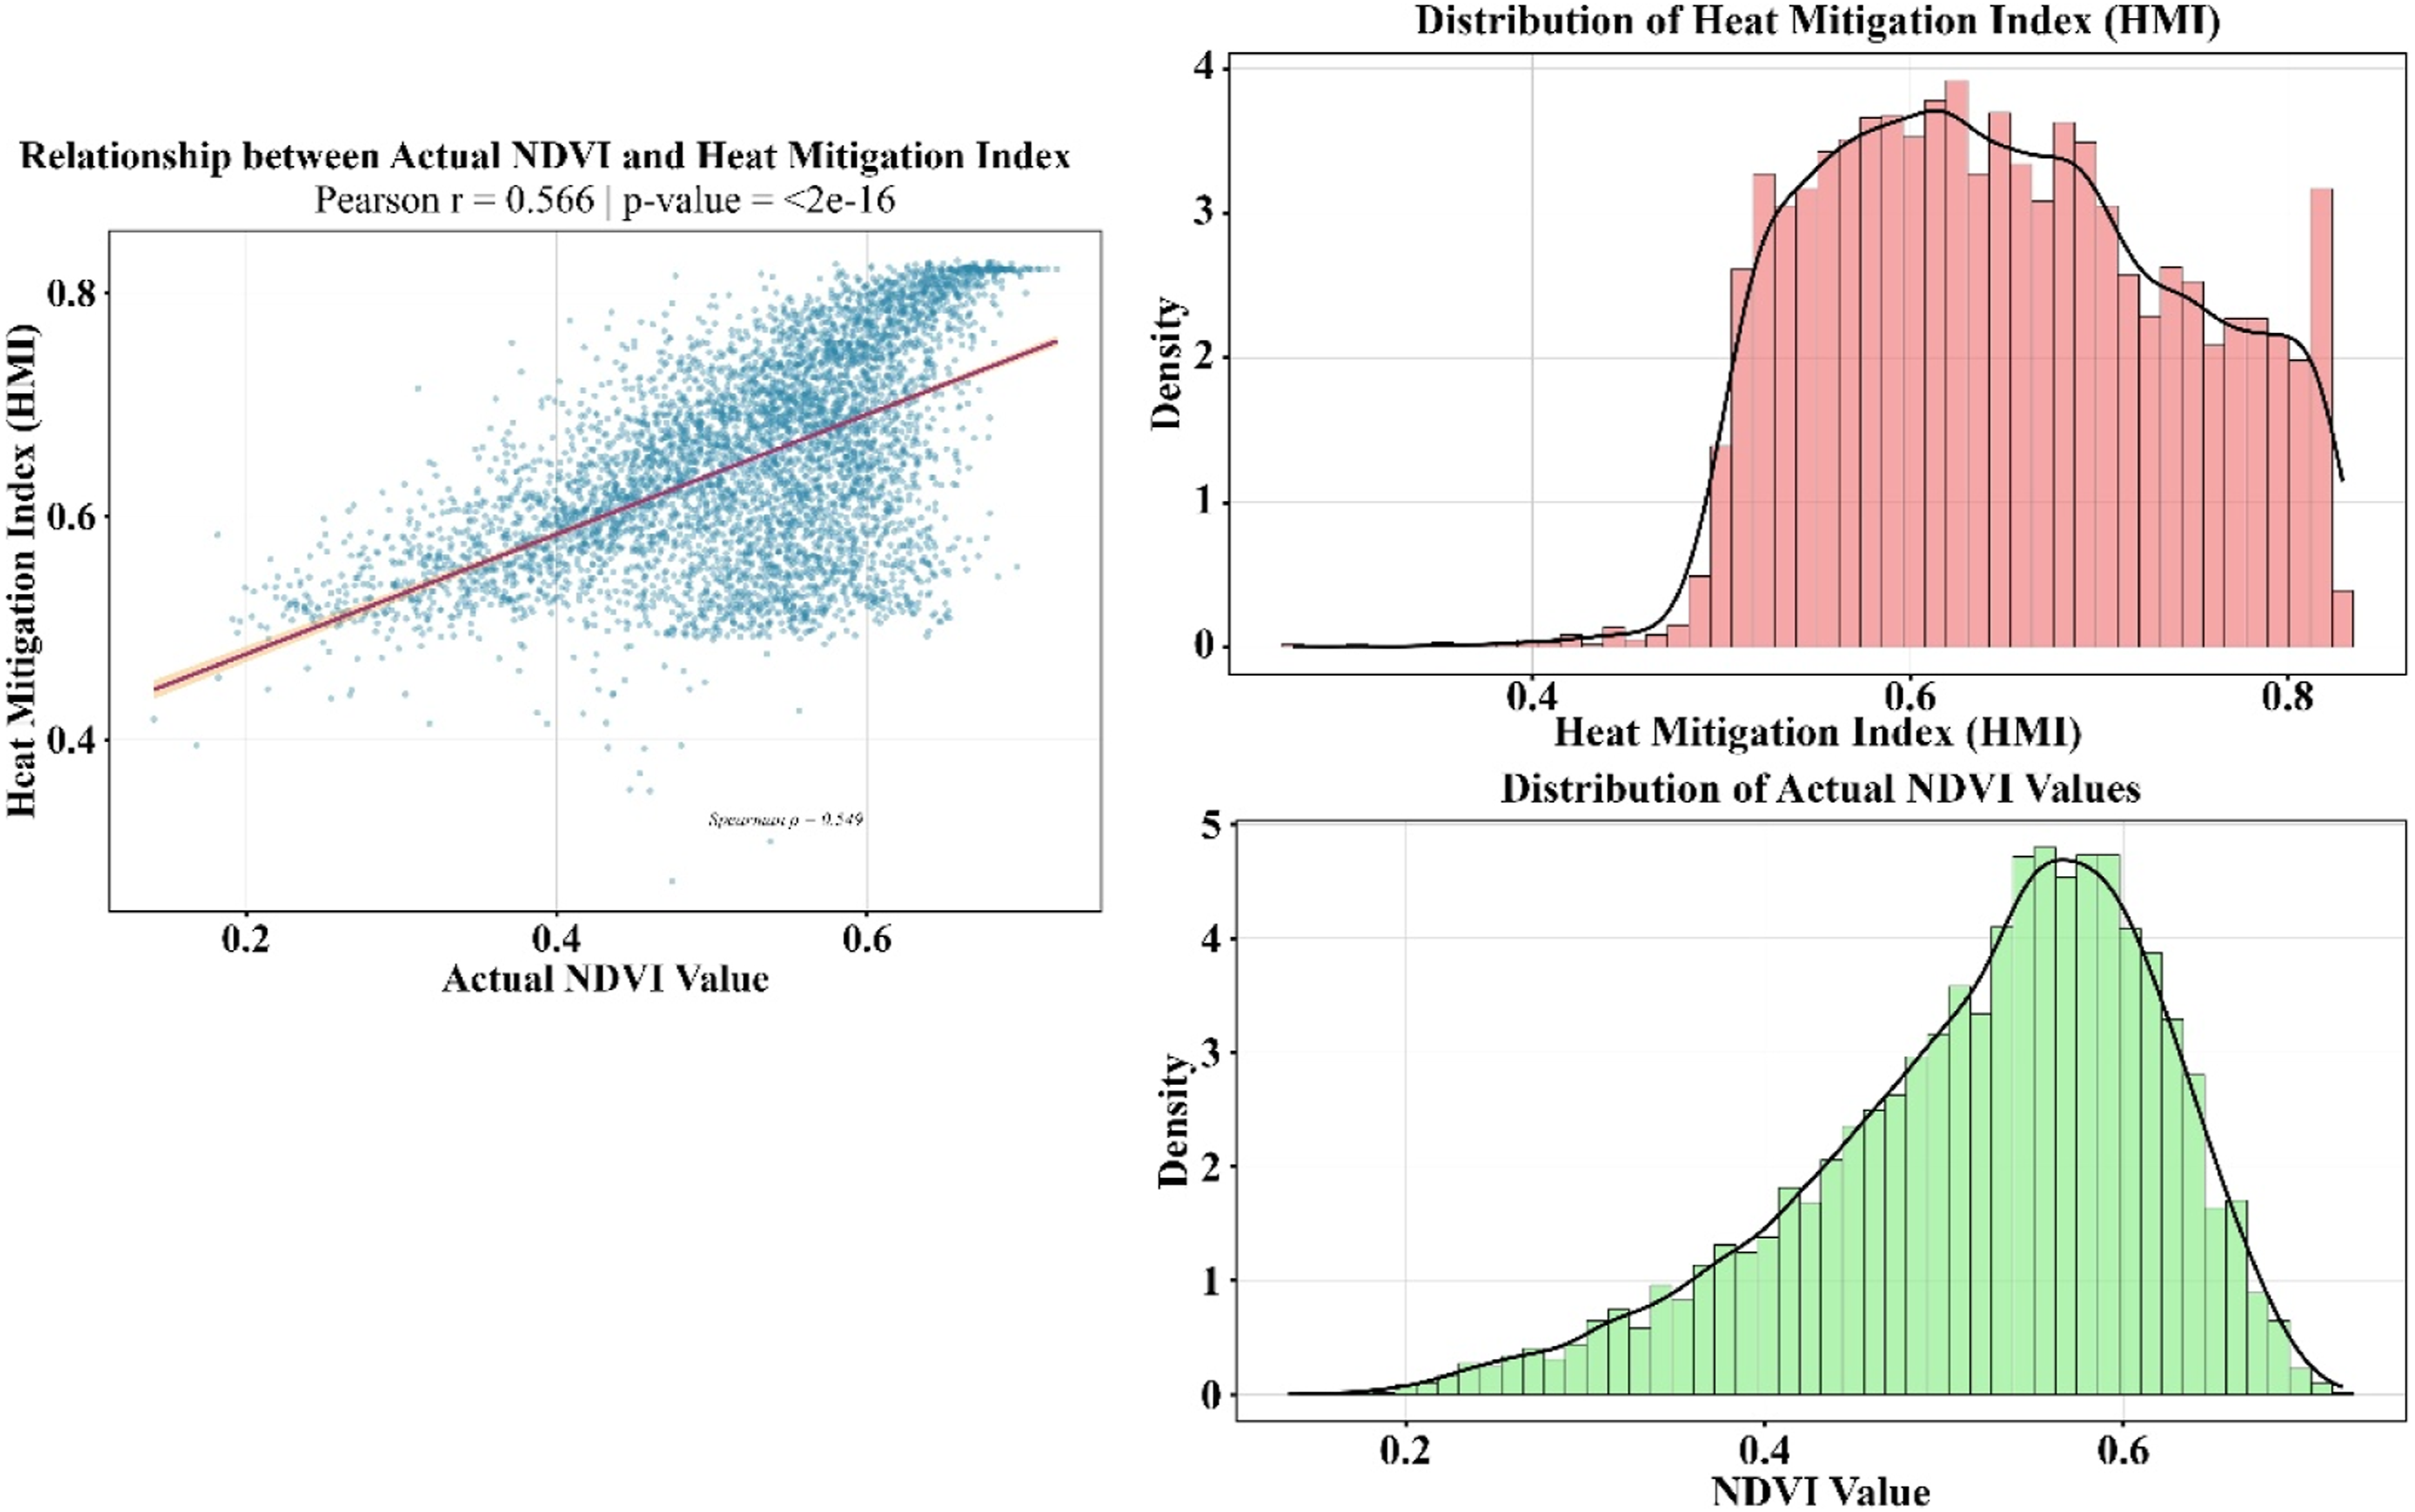
Seasonal co-variation of LST and NDVI
Figure 6 presents the long-term seasonal co-variation between Land Surface Temperature (LST) and NDVI in Kraków during 2003–2024. The monthly heatmaps show a clear seasonal pattern: LST peaks during summer and NDVI reaches its highest values during the main growing season. The temporal association between LST and NDVI is strongly positive (r = +0.89), reflecting the shared seasonality of temperature and vegetation activity in this temperate urban environment. This relationship is presented as contextual evidence rather than as direct validation of the cooling framework. It primarily captures phenological and seasonal cycles, showing that the annual dynamics of vegetation and surface temperature are closely linked over time, while reinforcing the interpretation of NDVI as an indicator of vegetation trajectory rather than a direct measure of cooling effectiveness. Seasonal co-variation of land surface temperature (LST) and NDVI in Kraków during 2003–2024. (a) Monthly LST heatmap, (b) monthly NDVI heatmap, and (c) scatter plot showing their temporal association. The observed positive relationship mainly reflects seasonal phenology and temperature cycles in this temperate urban environment. It is presented as contextual evidence rather than a mechanistic validation of the heat mitigation framework.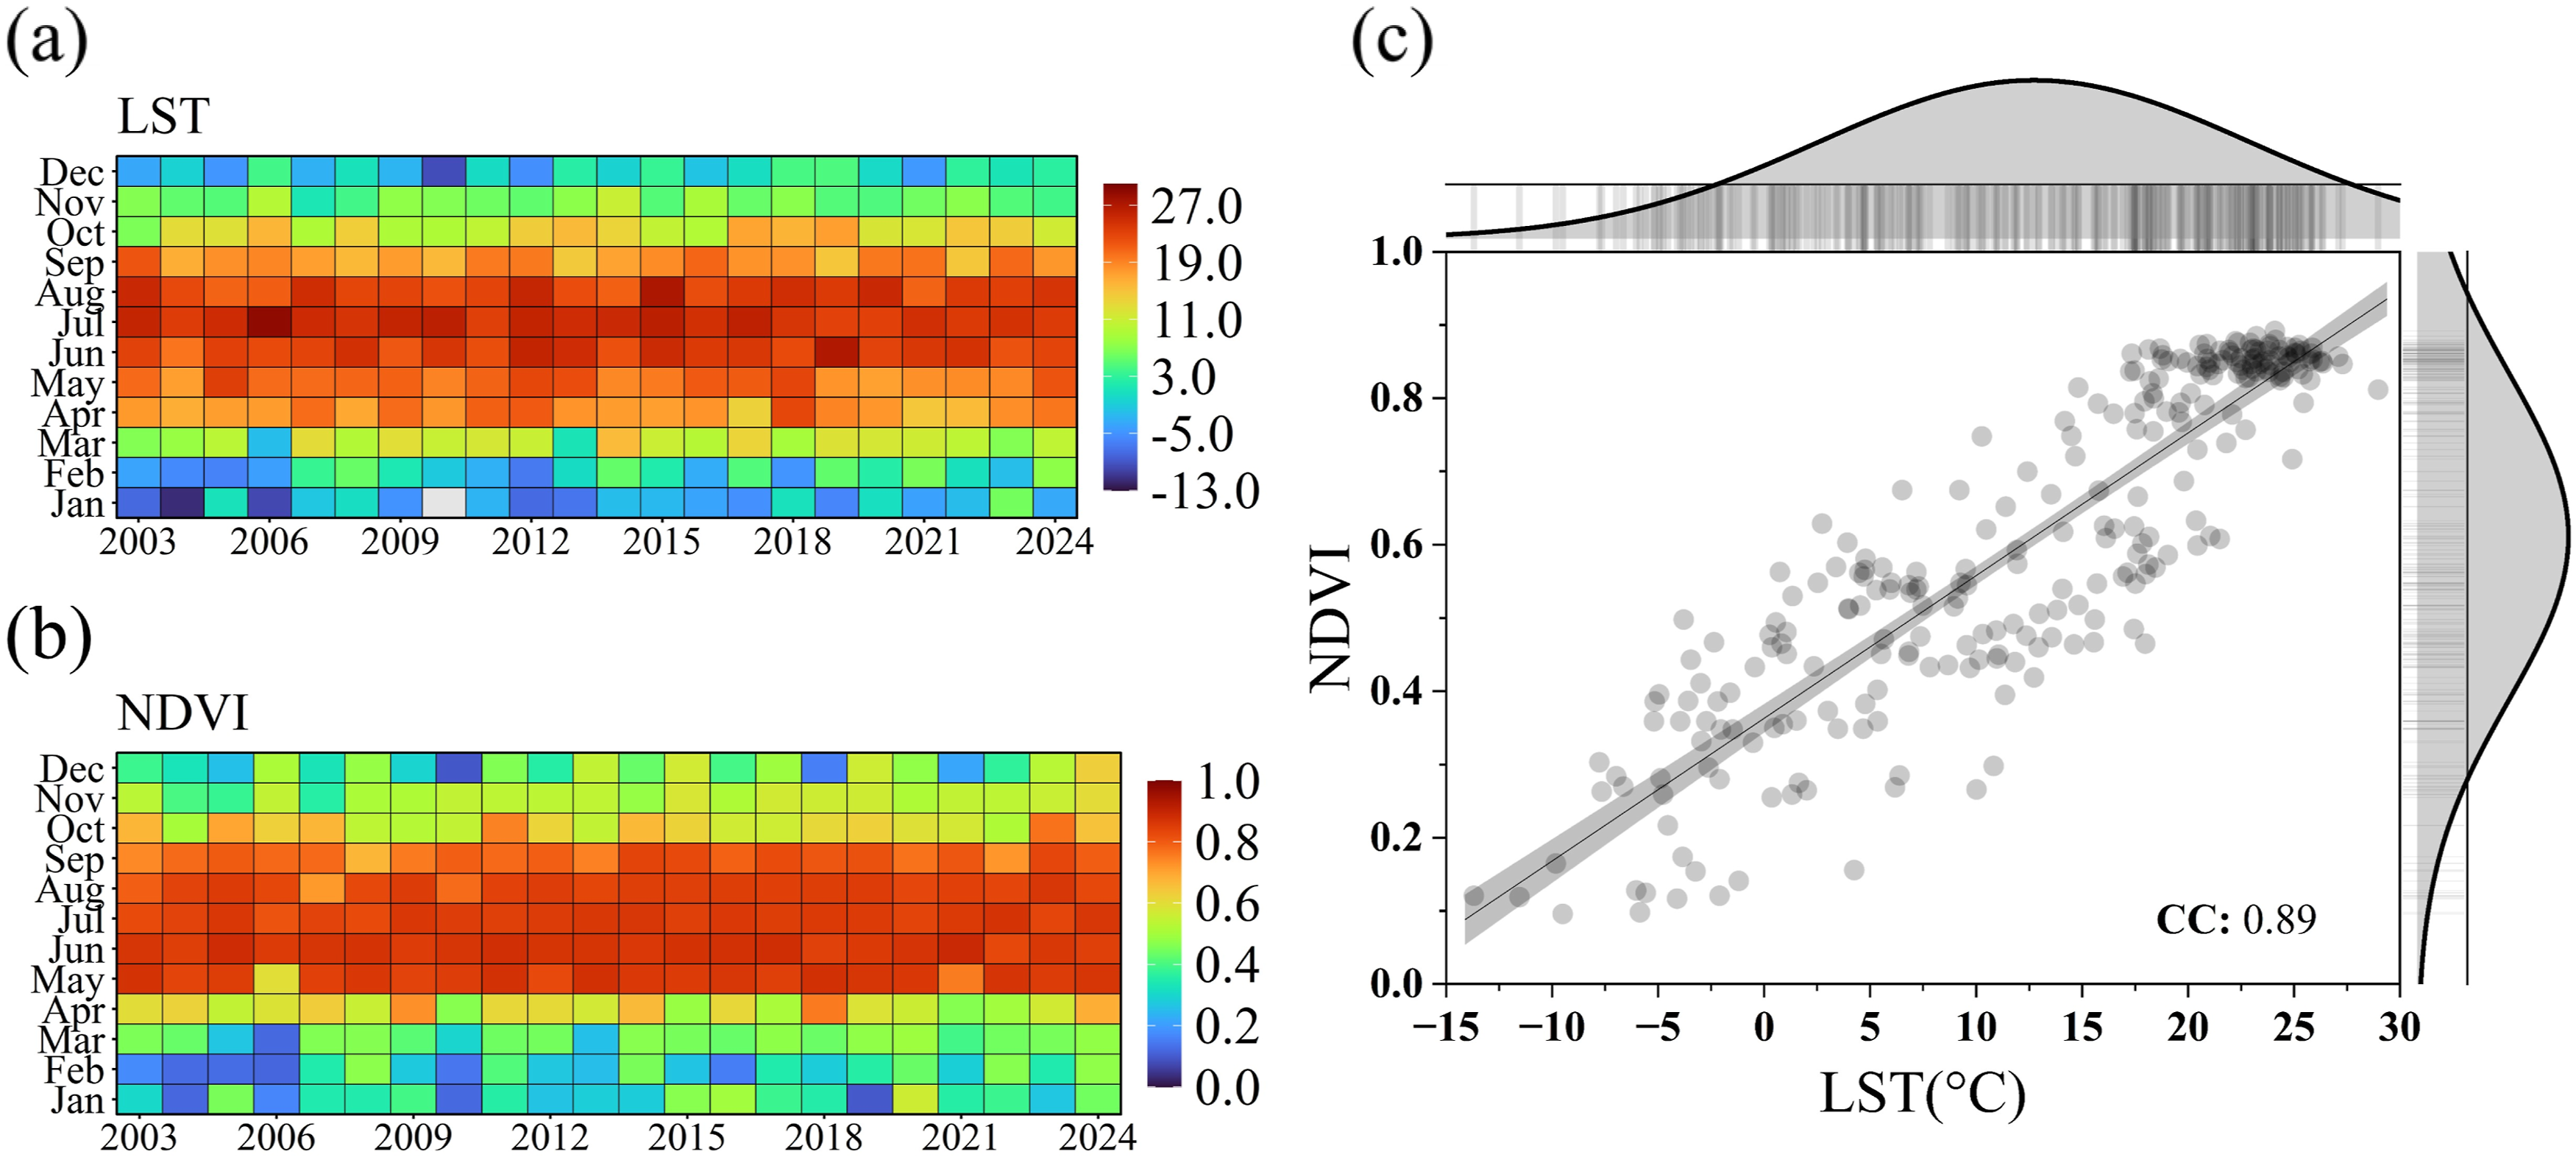
Discussion
This study developed a dual-criteria spatial prioritization framework for urban heat mitigation in Kraków by integrating modeled current cooling performance with long-term vegetation trends. The results highlight two main findings. First, vegetation condition is positively associated with modeled cooling performance, with tree-covered areas showing the highest HMI values. Second, combining current cooling performance with long-term NDVI trends provides a clearer basis for identifying where heat mitigation interventions are most urgently needed than either layer alone. In this sense, the main contribution of the study is not only the assessment of urban cooling in Kraków but also the translation of that assessment into a spatial prioritization framework for action.
The observed moderate positive association between NDVI and HMI (r = 0.566) aligns with previous studies showing that denser, healthier vegetation is linked to stronger urban cooling effects (Gallay et al., 2023; Li et al., 2024). The results also reveal a clear hierarchy in cooling performance across land-cover types, with tree cover yielding the highest HMI values, followed by grasslands and croplands. This pattern aligns with the established importance of shading and evapotranspiration in urban heat mitigation (Ma et al., 2025).
The findings from our study in Kraków reinforce the fundamental importance of maintaining and expanding tree-rich green spaces as the most effective vegetation-based cooling elements in the urban landscape (Anderson et al., 2022; Barron et al., 2019; Kong et al., 2016).
The role of long-term vegetation trends in spatial prioritization
A central motivation of this study was to move beyond static assessments of urban cooling. While many urban heat studies identify where vegetation currently provides cooling, they often do not consider whether that vegetation is stable, improving, or declining over time (Liu et al., 2025; Moncada-Morales et al., 2025). The NDVI trend analysis for 2003–2024 addresses this gap by adding a temporal dimension to the assessment. The finding that 9.37% of vegetated areas in Kraków experienced a statistically significant long-term decline in NDVI (Mann–Kendall test, p ≤ 0.05) indicates that part of the city’s vegetation base supporting urban cooling is showing signs of degradation. Importantly, vegetation decline alone does not automatically determine intervention priority because not all declining areas currently show the weakest cooling performance. For this reason, the study combined the vegetation trajectory with the current HMI rather than interpreting NDVI decline in isolation.
The coupling of vegetation trajectories and HMI is the key strength of the novel framework. Areas classified as highest priority are those with low current cooling performance. Concomitantly, these areas coincide with significant long-term vegetation decline. By contrast, monitoring/preventive action zones are locations where current cooling remains relatively strong, but long-term vegetation trajectories suggest a potential future weakening of cooling capacity. This trajectory-based distinction is important because it enables the framework to differentiate areas requiring immediate intervention from those where protection, monitoring, or preventive management is more appropriate. In that respect, the framework provides a more targeted interpretation of urban heat vulnerability than a single-date cooling map alone.
Implications for urban greening and heat mitigation planning
The spatial distribution of the priority classes is directly relevant to planning. Highest- and high-priority zones together account for 23.71% of the study area, indicating that nearly one-quarter of Kraków requires immediate or near-term attention for urban greening and heat mitigation planning. These areas are where intervention is likely to yield the greatest benefit, as current cooling performance is constrained and the vegetation base is either already weak or in decline. This makes the framework useful for supporting neighborhood-scale prioritization and spatial screening of greening investments, including street-tree planting, park enhancement, and the protection or restoration of deteriorating vegetated surfaces.
In practical planning, the framework can help align heat mitigation strategies with existing municipal priorities, such as expanding green infrastructure and advancing climate adaptation planning. Tree-based interventions are particularly relevant, given the higher cooling performance observed in tree-covered land-cover classes and the established role of tree canopy in moderating urban temperatures through shade and evapotranspiration (Ma et al., 2025). At the same time, the results suggest that urban greening should not be guided solely by current vegetation density but also by where vegetation-supported cooling is most vulnerable to weakening over time.
From an implementation perspective, the framework can improve the spatial targeting of greening programs by identifying priority areas based on both current cooling deficits and long-term vegetation trajectories. This can help planners allocate limited resources more efficiently and scale interventions to match management capacity.
Interpretation in relation to previous studies
The results broadly align with prior work showing that trees generally provide stronger cooling effects than lower-stature vegetation, such as grasslands or croplands (Li et al., 2022; Na et al., 2024). They also support the broader argument that vegetation dynamics matter for interpreting urban climate services and that relying solely on static vegetation-temperature relationships may overlook areas where cooling benefits are gradually being lost (Moncada-Morales et al., 2025). In this respect, the framework responds to recent calls for more dynamic, planning-oriented assessments of urban vegetation and heat mitigation (Liu et al., 2025; Moncada-Morales et al., 2025).
At the same time, the results should be interpreted with appropriate caution. The association between NDVI and HMI is informative but does not mechanistically validate the cooling model because vegetation-related properties are already embedded in the HMI formulation. Likewise, the strong temporal association between NDVI and LST primarily reflects shared seasonality and phenology in this temperate climate rather than directly validating cooling performance. These analyses are therefore better understood as contextual support for interpreting the framework than as independent evidence of model accuracy.
Limitations and implications for transferability
Several limitations should be considered when interpreting the results. First, the study integrates datasets with different spatial resolutions and sensor origins: 10 m land-cover data for the current cooling assessment and 250 m MODIS NDVI data for long-term vegetation trends. Accordingly, the resulting priority classes are intended primarily for neighborhood-scale spatial prioritization, rather than for parcel-level diagnosis or site-specific intervention design. Although the 10 m land-cover data were aggregated to a common 250 m analysis grid for overlay analysis, some sub-grid heterogeneity inevitably remains in mixed urban areas. The framework should therefore be understood as a planning and screening tool for identifying broader heat-mitigation priority zones, rather than as a basis for prescribing actions for individual plots or street segments. Future work could improve this aspect by using longer high-resolution vegetation time series, such as Sentinel-2, once sufficient temporal depth is available.
Second, the InVEST Urban Cooling Model offers a practical, widely used representation of vegetation-related cooling. However, it relies on generalized parameters and simplified assumptions about cooling distance, evapotranspiration, and shade. In this study, comparison with Landsat-derived LST showed broad spatial agreement with expected temperature patterns, but this should be treated as a limited consistency check rather than full validation. The sensitivity analysis suggests that the relative spatial pattern of priority zones is reasonably robust to variation in selected parameters. Yet the uncertainty analysis remains limited to a subset of model assumptions rather than the full parameter space.
Third, using the 1970–2000 climatology as a baseline provides a stable reference for estimating relative cooling performance, but it does not reflect actual 2024 meteorological conditions. The framework should therefore be interpreted primarily as a tool for spatial comparison and prioritization rather than for predicting absolute thermal conditions under contemporary weather. In addition, while the framework identifies where vegetation decline and cooling deficits coincide, it does not directly explain the social, ecological, or governance processes driving these patterns. Further work incorporating land-use change, soil and hydrological conditions, and socioeconomic vulnerability would strengthen both causal interpretation and planning relevance.
Broader relevance and future directions
Although this study focuses on Kraków, the framework is broadly relevant to urban climate adaptation because it relies on widely available remote sensing data and an openly accessible modeling workflow. This makes it potentially transferable to other cities seeking to move from static cooling assessments toward more proactive identification of heat mitigation priorities. The approach may be especially useful in cities with unevenly distributed green infrastructure, where existing vegetation is under pressure, or where planners need to allocate limited resources more strategically.
Future research should focus on improving three aspects of the framework. First, higher-resolution, multi-temporal vegetation datasets would improve detection of local-scale trends. Second, additional empirical observations, including air temperature and microclimate measurements, would strengthen local calibration and evaluation of model performance. Third, integrating socioeconomic indicators could support more explicit, equity-oriented prioritization of urban heat mitigation. These developments would help extend the framework from a spatial decision-support tool toward a more comprehensive basis for climate-resilient urban planning.
Conclusions
This study presents a novel decision-support framework for urban heat mitigation that goes beyond static assessments by integrating current cooling performance with long-term vegetation trends to inform spatial prioritization. Tailored for Kraków, Poland, the framework employs high-resolution land-cover mapping, the InVEST Urban Cooling Model, and NDVI trend analysis from 2003 to 2024 to identify priority heat-mitigation classes across the city. Key findings emphasize the importance of vegetation, particularly tree cover, in managing urban microclimates. A moderate positive association was identified between the Normalized Difference Vegetation Index (NDVI), which reflects plant health and density, and the Heat Mitigation Index (HMI), with tree-covered areas demonstrating superior cooling properties. Notably, 9.37% of Kraków’s vegetated area exhibited a statistically significant long-term decline in NDVI (Mann–Kendall test, p ≤ 0.05), indicating heightened thermal vulnerability.
The core contribution of the research lies in providing an integrated spatial prioritization framework. By mapping areas where low current cooling performance coincides with declining vegetation health, the framework helps identify broader neighborhood-scale priority zones for intervention, monitoring, and preventive management. The resulting classification showed that the highest-priority zones covered 1627.18 ha (4.99%) of the study area, while high-priority zones accounted for 6107.14 ha (18.72%). Together, these classes represent nearly one-quarter of Kraków, indicating substantial scope for targeted greening and heat mitigation measures.
This framework provides a practical basis for aligning urban greening with spatial climate adaptation priorities and offers a transferable analytical approach based on open-source tools and remote-sensing data. Rather than identifying only where cooling is currently strong or weak, the framework highlights where cooling deficits coincide with longer-term vegetation decline, thereby supporting a shift from reactive to more proactive urban heat mitigation planning. The proposed framework is best interpreted as a neighborhood-scale planning and screening tool for identifying broader heat-mitigation priority zones, rather than as a parcel-level prescription framework. Future research should refine the framework through higher-resolution multi-temporal vegetation data, additional empirical calibration, and the integration of socioeconomic indicators to strengthen its planning relevance across different urban contexts.
Footnotes
Ethical considerations
This article does not contain any studies with human or animal participants performed by any of the authors.
Consent for publication
Not applicable. This study does not involve human participants or identifiable personal data.
Funding
The authors received no financial support for the research, authorship, and/or publication of this article.
Declaration of conflicting interests
The authors declared no potential conflicts of interest with respect to the research, authorship, and/or publication of this article.
Data Availability Statement
Statement Data will be made available on request.