
Abstract
Supervisory control and data acquisition (SCADA) systems have become widely diffuse in modern wind energy technology. The slowdown of new installations and the increasing percentage of energy entering the grid from renewable stochastic sources has diverted attention to the careful optimization of operating farms. Elaborating the complex data stream from SCADA systems into knowledge poses technological and scientific challenges. SCADA data analysis therefore lies at the crossroads of mechanical engineering, applied mathematics, statistics and physics. In the present work, mathematical methods are proposed for tackling the complexity of SCADA data. This idea is to elaborate simplified and more powerful data sets through one action: discretization of continuous quantities. The approach is employed for two very different issues: performance evaluation and wake effects analysis, which is investigated from the point of view of power losses, due to the difficulties associated with optimal turbine alignment with the wind. Two indexes for performance evaluation are formulated. Recurrent non-trivial orientation patterns of clusters of turbines are individuated, and the efficiency associated to them is analyzed. The methods are tested on two wind farms situated in southern Italy.
Introduction
Optimization of wind farm operation has become a fertile field in recent years, because the financial crisis has led to a slowdown of new installations and because a remarkable amount of energy dispatched into the electric grids originates from stochastic sources (e.g. wind energy). Therefore, in order for the grid to be as “smart” as possible and to balance efficiently with energy coming from non-renewable sources, sophisticated control systems are needed, especially for energy conversion systems such as wind turbines, as they have low density on the territory.
Exploiting control systems is useful both for optimization and for fault prevention: In Expert Report 2013 (Expert Report. Condition Monitoring, 2013) it is estimated that a sudden failure of a 1.5 MW wind turbine during winter time leads to around €50,000 of missed production. This amount is up to 5 times greater than the missed production due to a wisely planned maintenance program. Similarly, in Expert Report 2014 (Expert Report. Wind Turbine Control Systems, 2014) it is estimated that a complete optimization program of wind turbines might diminish by up to a 20% the cost of energy generated from wind.
Sophisticated supervisory control and data acquisition (SCADA) has rapidly become a major subject in the scientific literature, not only for the economic advantages described above, but also, and most importantly, because codifying and extracting information about the machines from the output of control systems is a challenging task. SCADA control systems measure (over a 10 minute time period) the minimum, maximum, average and standard deviation of a vast amount of measurement channels; they also measure the details of wind flow, machine response and alignment to it, the conversion of wind kinetic energy into active power, the vibrational status and the temperatures at the more meaningful parts of the turbine.
Vast data streams must be turned into information, further processed into knowledge, and possibly integrated in the control system itself for automation of early diagnosis and performance evaluation techniques. For these reasons, SCADA data analysis lies at the crossroads of mechanical engineering, computer science, statistics, physics and applied mathematics. We can demarcate approaches to SCADA data analysis into three categories: artificial neural network approaches (for numerical modeling issues and for their capability in codifying non-linearity), statistical methods (for their power to turn vast data sets from a limitation into an opportunity), and post-processing techniques (because they dramatically simplify the size of data sets, possibly enriching (or at least not compromising) their quality).
The present work deals with post-processing algorithms for tackling the complexity of SCADA data streams: the underlying philosophy is that acting with two kind of operations, filtering and discretization, leads to a very advantageous set of pros, despite some cons which can be circumvented if the operations are performed judiciously. For this reason, and for the intrinsic arbitrariness of any discretization procedure, particular attention shall be devoted to validation of the results’ consistency and stability. Further, the innovativeness of the present work lies in the fact that the approach can be adapted to very different issues. Two relevant examples shall be provided and discussed: evaluation of turbine operational behavior, through the formulation of malfunctioning indexes, and the analysis of how wake interactions affect the turbine’s capability to optimally align to the wind direction, and how this is reflected in the quality of power output and in the efficiency.
In the following, we recall some relevant contributions to SCADA data analysis, that allow us to briefly sketch the state of the art. For a comprehensive review on SCADA data analysis, based on statistics, physics, modeling and data mining, we refer to Kusiak et al. (2013).
In Kusiak and Zheng (2010), an evolutionary strategy algorithm is used for solving optimization models and determining optimal control settings: it is shown that judicious fine tuning of blade pitch angle and generator torque improves the power coefficient. In Kusiak and Verma (2012), artificial neural network (ANN) methods are employed for analyzing and preventing bearing faults, using data collected over four months from 24 turbines; it is shown that the algorithm allows reliable prediction of bearing faults 1.5 hours before they occur. In Castellani et al. (2014b), a hybrid method (based on weather forecast data, ANN and computational fluid dynamics) and a pure ANN approach were exploited to obtain an accurate wind energy production forecast on a complex test terrain, and it was shown that pure ANN performs better than the hybrid method, especially if trained with judiciously post-processed SCADA data. This is a meaningful example of the wide range of applications of SCADA data mining techniques: they are crucial not only for performance assessment and fault prevention, but also for accurate wind forecast, which is an important task in order to build smart electric grids. Yang et al. (2013) proposed a condition monitoring technique, based on investigating the correlations among relevant SCADA data; the quantitative assessment of the health condition of a turbine under varying operational conditions was investigated. Wilkinson et al. (2014) reviewed three SCADA-based condition monitoring techniques (signal trending, self-organizing maps and a physical model) and discussed their performance in preventing drivetrain faults. On the Lillgrund test case, a machine learning approach was applied in order to produce individual power curves, and then predict measurements, and a comparison between ANN and Gaussian process regression was made. Further analysis on fault prediction using ANN techniques was tackled by Zhang and Wang (2014), while Elijorde et al.(2014) reported a fault detection approach, combining cluster analysis and frequent pattern mining, and showed that it is indeed capable of detecting the deteriorating condition of a wind turbine.
Wind farm efficiency depends on: wake effects, terrain complexity (which causes local wind flow accelerations) and atmospheric stability. The effect of wakes has been thoroughly investigated, both through numerical simulations and ex-post analysis on SCADA data sets. In Barthelmie et al. (2010), power losses due to wakes were investigated for offshore Horns Rev and Nysted wind farms in Denmark. In McKay et al. (2013), SCADA data mining techniques were used for quantifying power and speed losses due to wakes, appreciable analysis was also devoted to misalignment and yawing under downstream wake angles. Numerical models for simulating wake interactions were employed in Gaumond et al. (2014), where traditional simulations performed with a 10 min average wind direction were replaced by a weighted average of several simulations covering a wide span of directions. In Port-Agel et al. (2013), large-eddy simulations (LESs) were performed to investigate the effects of changing wind direction on the turbine wakes and associated power losses in the Horns Rev offshore wind farm; the simulations show that wind direction has a strong impact on the spatial distribution of turbine-wake characteristics, such as velocity deficit and turbulence intensity. In Hansen et al. (2012), the test case of Horns Rev was studied and a systematic analysis was carried out in order to highlight the dependency of the power deficit on turbulence intensity and stability of the atmosphere. The influence of atmospheric stability on the wind profile was also investigated by Castellani et al. (2010) through numerical models, especially for non-neutral atmospheric regimes. Interpretation of wind flow and turbine performances in complex terrains is very challenging; some issues about the intertwining of wakes and terrain effects are discussed in Castellani et al. (2015). On the test case of a wind farm situated in Italy on very rough terrain (which is also a test case of the present work), it was shown that pure free flow numerical models are not capable of capturing even the main features of actual performances. Instead, simulating wind flow and its interactions with the turbines, it is possible to capture a reliable approximation of performances and of actual alignment patterns to the wind direction.
Previous work by Castellani et al. (2014, 2013, 2014c) and Astolfi et al. (2015) focused on post-processing techniques on SCADA data sets of operating wind farms, for performance evaluation and early fault detection. In Castellani et al. (2014a), the polar efficiency of onshore wind farms was systematically studied and it was shown that the effects of the complexity of the terrain needs a novel way of defining it, with respect to the approach addressed for offshore wind farms. Further, the dependency of polar efficiency on atmospheric stability, wake effects and terrain complexity was investigated for three test cases situated in southern Italy. In Astolfi et al. (2014) early fault diagnosis was addressed through SCADA temperature data analysis: it was shown, for the test case of a wind farm situated in southern Italy, that the proposed method is useful for preventing severe faults.
The structure of this paper is as follows: in “The approach and the wind farms” section, the philosophy of the approach is briefly sketched and the wind farms proposed as test cases are described. Due to the ubiquitous diffusion of SCADA control systems in wind energy technology and, in general, for machines having non-trivial state dynamics, it is important to formulate non-dimensional metrics for operational quality assessment, aspiring for universal codifying. The metrics commonly employed for operational behavior evaluation, for example time availability, are often computed according to an algorithm which depends on contractual agreements between the wind farm owner and SCADA supplier. Further, often information from a given machine is processed and a response about only that machine is provided, therefore it is challenging to find a method combining universality and awareness of the environment (i.e. the cluster of nearby machines) in which a given machine is set. Arising from these motivations, in “Malfunctioning indexes” section, two indexes are formulated to evaluate the operational behavior of the turbines, moving from a number map (associating each 10 minute time step a smart number codifying as much information as possible) to an absolute and a relative classification.
In “Number map and wake effects” section, the approach of simplifying information by converting it into binary numbers is employed for the analysis of yaw positions. The relative position of nacelles of meaningful clusters of nearby turbines is investigated under regimes which give rise to interesting wake effects. A connection between anomalous misalignment and power losses is thus established. In “Zoom on efficiency and wake effects” section, a further zoom is performed on one of the test case wind farms, whose data set size is large enough to guarantee some statistical significance to the following approach. Data are filtered on very stringent conditions according to met-mast measurements, in order to have at hand a data set describing how the park reacts to a very unusual and clearly identified “external state”. Subsequently, the discretization of nacelle positions is performed and the recurrence of the dominant orientation patterns of whole clusters is highlighted. The most frequent configurations are analyzed and classified from the point of view of cluster efficiency, in order to find out if the most common ways the cluster orientates are indeed the most favorable. This post-processing algorithm provides non-trivial indications about the perspective of active yaw control systems under regimes affected by severe wakes. In “Conclusions and future directions” section, the results are briefly summarized and further directions for the present work are sketched.
The approach and the wind farms
Extracting knowledge from the complex information encrypted in the SCADA data is usually accomplished, as summarized in “Introduction” section, by sophisticated statistical methods or artificial neural network techniques. The approach of the present work is instead based on post-processing the raw SCADA measurements with two kinds of actions: filtering peculiar operative phases or regimes, and mapping states or measurements into binary numbers.
The former action allows us to smear out “noise” from the blind SCADA data sets and thus to build refined databases. The latter action instead reduces the quality of the data sets. Let us sketch the two basic examples employed in the present work: if one converts the continuous dynamics of the states of the machine into a series of digits (activation or not of a given state, on a given judiciously short time basis), one ends up with a simpler, yet slightly poorer, database. SCADA measurements are by construction an average of a series of frequent discrete samplings: from the point of view of time they are discrete, but the values they assume constitute a continuous set. It might be useful for highlighting particular phenomena to discretize these measurements: for example, if one divides the common range of variability of a given channel into intervals, and associates a digit to each interval, turning from 0 to 1 if the measurement falls inside it, one ends up with a data set built of binary numbers. This data set is much simpler, slightly poorer, but hopefully much more powerful than the original one.
The two basic actions employed in the present work (filtering and mapping SCADA data into digits) have the opposite effect on the quality of the information contained in the database, however the final goal is the same: building simpler and more “powerful” data sets with respect to the complex “parent” ones. As will be demonstrated in the following sections, if the operations above are performed judiciously, they produce data sets on which very simple statistical methods lead to very powerful results.
The main features of the methods sketched in the following sections are summarized here:
For the analysis in “Malfunctioning indexes” section, the continuous dynamics of the states is converted into binary signals. The dynamics of the states are encoded in a series of entries of mutually exclusive states, with an associated time stamp describing what each turbine does. A 10 minute time basis for our number map has been considered natural, in order to build a data set of binary numbers parallel to the SCADA measurements. To each state a digit is associated for each 10 minute interval: the digit shall change to 1 if the state activates within the interval. The only exception to this rule is the state describing power output production: a 10 minute interval should be considered productive if the production time exceeds a fairly high threshold. For the present work, a threshold of 80% has been employed, but it has been verified that the results do not depend on the threshold as long as it is fairly high. Using simple statistical methods on such a number map, in “Malfunctioning indexes” section, two meaningful indexes for quantifying goodness of operational behavior are built, and their consistency is tested.
The analysis in “Number map and wake effects” and “Zoom on efficiency and wake effects” sections aims at building a connection between wake interactions, their mechanical symptoms on the machines and consequent power output collapses. Therefore, post-processing methods are employed for zooming into regimes characterized by significant wake effects and thus building refined data sets. The layout of the wind farms under investigation suggests which clusters of turbines are more affected by wakes, and under which regime. Therefore data are filtered, considering only the relevant cluster, selecting data according to a meaningful wind direction interval as measured by the meteorological mast, and selecting a narrow interval of relatively low wind speeds (because the effect of wakes is enhanced). For the test cases under investigation, the meteorological mast anemometer is a reliable landmark, as shall be computationally demonstrated, because it lies near the examined clusters. After the filtering procedure, data sets are simplified by converting them into binary signals: the nacelle position of each turbine of the cluster is represented by a binary number. This procedure makes the database slightly coarser, but, as we shall see in “Number map and wake effects” and “Zoom on efficiency and wake effects” sections, simple statistical methods allow extraction of powerful knowledge about the mechanical behavior and power losses due to inability of the rotor to align optimally with the wind direction. Further, in “Zoom on efficiency and wake effects” section, a deeper analysis is carried out in order to connect the above approach to the issue of determining configurations associated to optimal efficiency, and of evaluating the way machines tendentially align to wind, during regimes characterized by severe wake effects.
The wind farms chosen as test cases for the proposed methods have very different features: wind farm 1 lies on very gentle terrain (Figure 1), while wind farm 2 lies on very complex terrain, with slopes of up to 60% in proximity to the turbines (Figure 2). In both cases, the inter-turbine distance results in considerable wake effects.
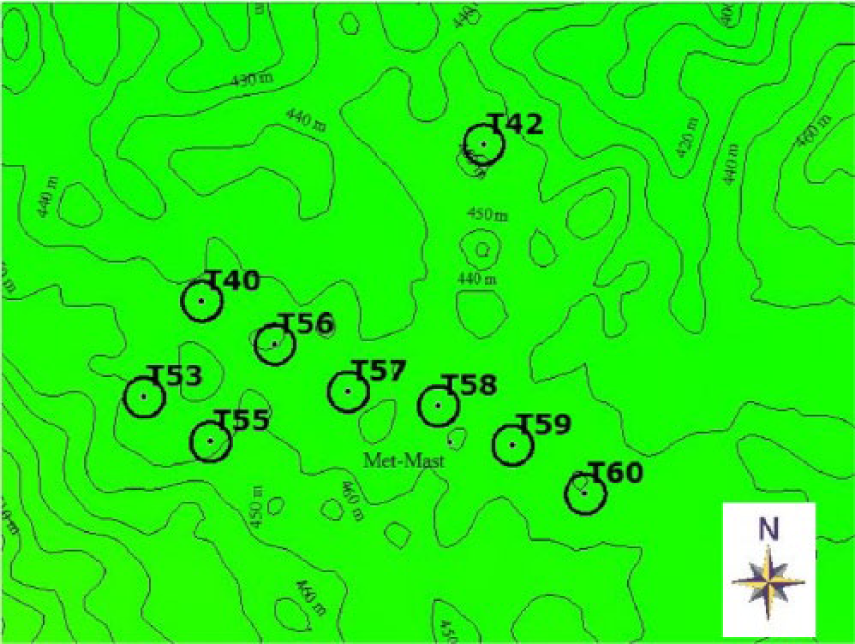
Wind farm 1: layout.
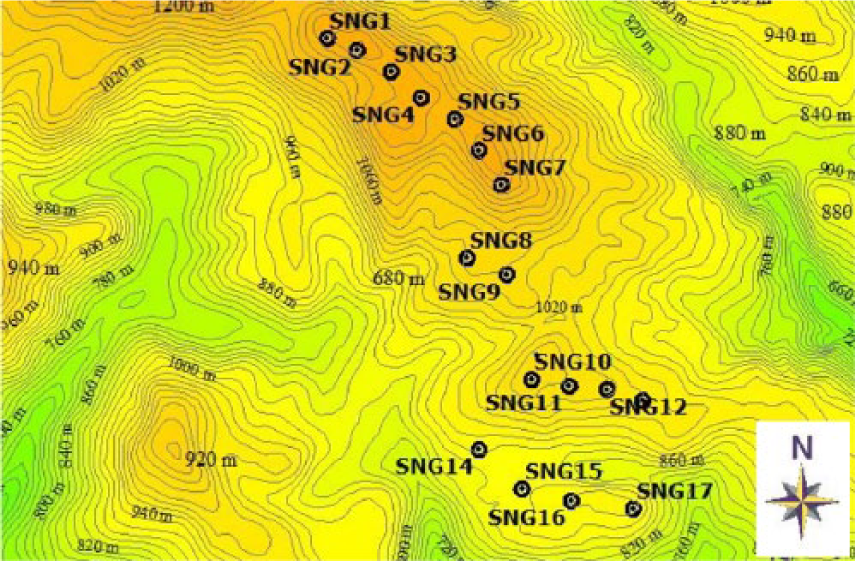
Wind farm 2: layout.
The features of the two wind farms are summarized in Table 1.
Features of the test case for wind farms.
Malfunctioning indexes
Through the approach described in “The approach and the wind farms” section, the continuous motion of the dynamics of the states is simplified into a sequence of binary numbers on the same 10 minute time basis as the SCADA measurements. The next step is identifying a criterion for extracting knowledge from this number map. Both an absolute and a relative classification are useful: the former is whether a given time step for a given turbine is productive (or potentially but not actually productive due to inadequate wind intensity) or not. In other words, we consider a time step as “good” if the turbine has produced (or has not produced, but not because of itself). We consider the time step “bad” otherwise. The other useful classification is relative: we compute, horizontally along the wind farm, the mode of the binary numbers associated with all the turbines. A time step is anomalous if it deviates from the mode, i.e. the turbine behaves differently from the trend of the farm. The two classifications can be combined, and a time step for a given turbine can be anomalous (or not) and productive (or not).
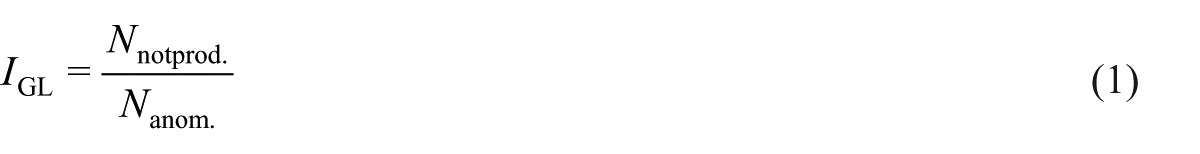
With this classification at hand, two malfunctioning indexes for each turbine can be formulated. The former, equation (1), is the ratio of the number of non-productive time steps to the number of anomalous time steps
The latter index, equation (2), is the ratio of the number of anomalous non-productive time steps to the number of anomalous productive time steps
Both indexes are intuitively expected to rise with increasing turbine malfunctioning, but their nature deserves a deeper discussion because they both have pros and cons.
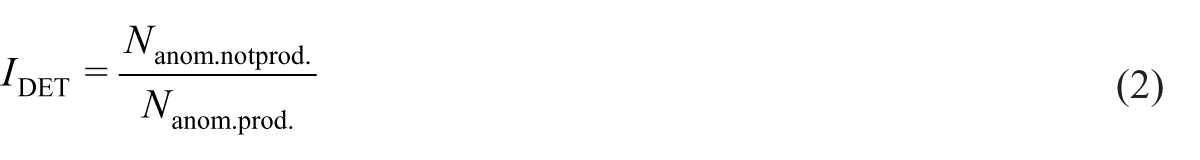
On the grounds of the discussion above, both indexes have been considered important in providing a picture of the operational behavior of the machines under every possible regime. They have thus been computed on the historical data of the year 2013 and 2014 from wind farm 1. In the long-term, the indexes are expected to display a similar trend, because whole farm malfunctioning should become negligible and anomalies should correlate more and more to malfunctioning. This is indeed the case, as qualitatively shown in Figure 3 for wind farm 1. A two tail t-test has been performed to test whether the hypothesis that the two data sets of Figure 3 have the same mean can be accepted: this hypothesis cannot be rejected, therefore
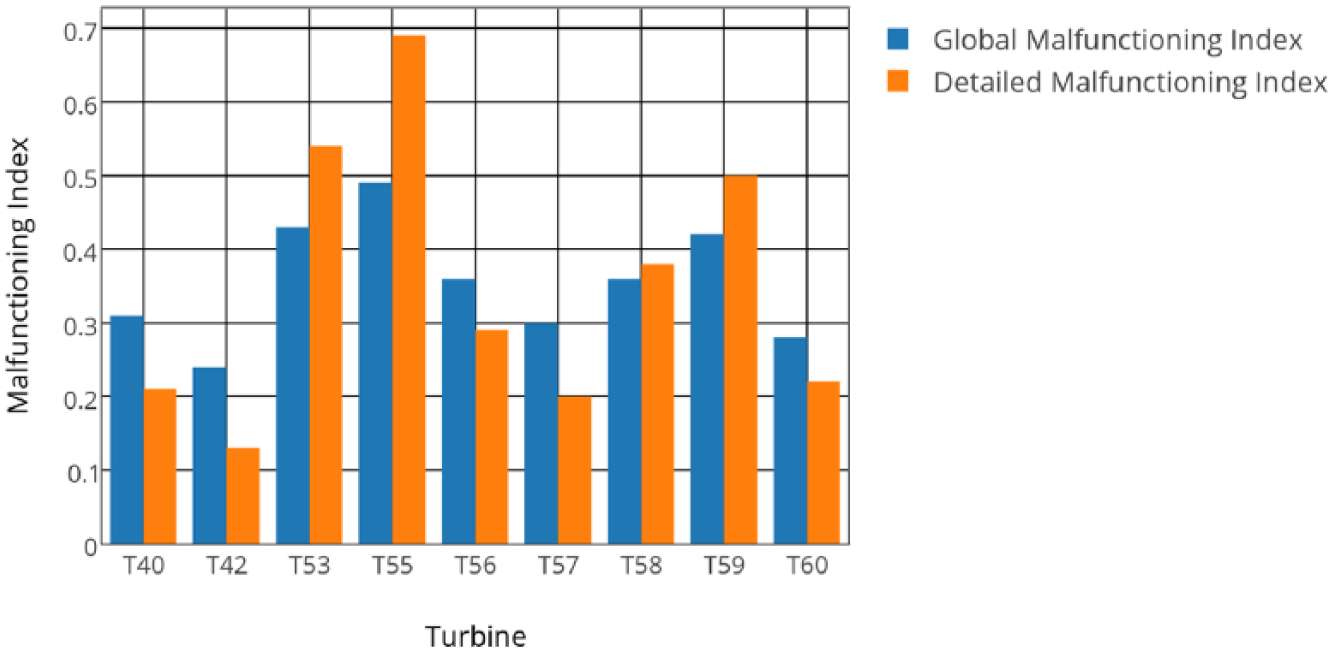
Wind farm 1:
Figure 4 shows another useful qualitative application of the indexes: comparing operational behavior during a given period against a historical background. In this Figure, August 2014 is compared with the historical background of the year 2013.
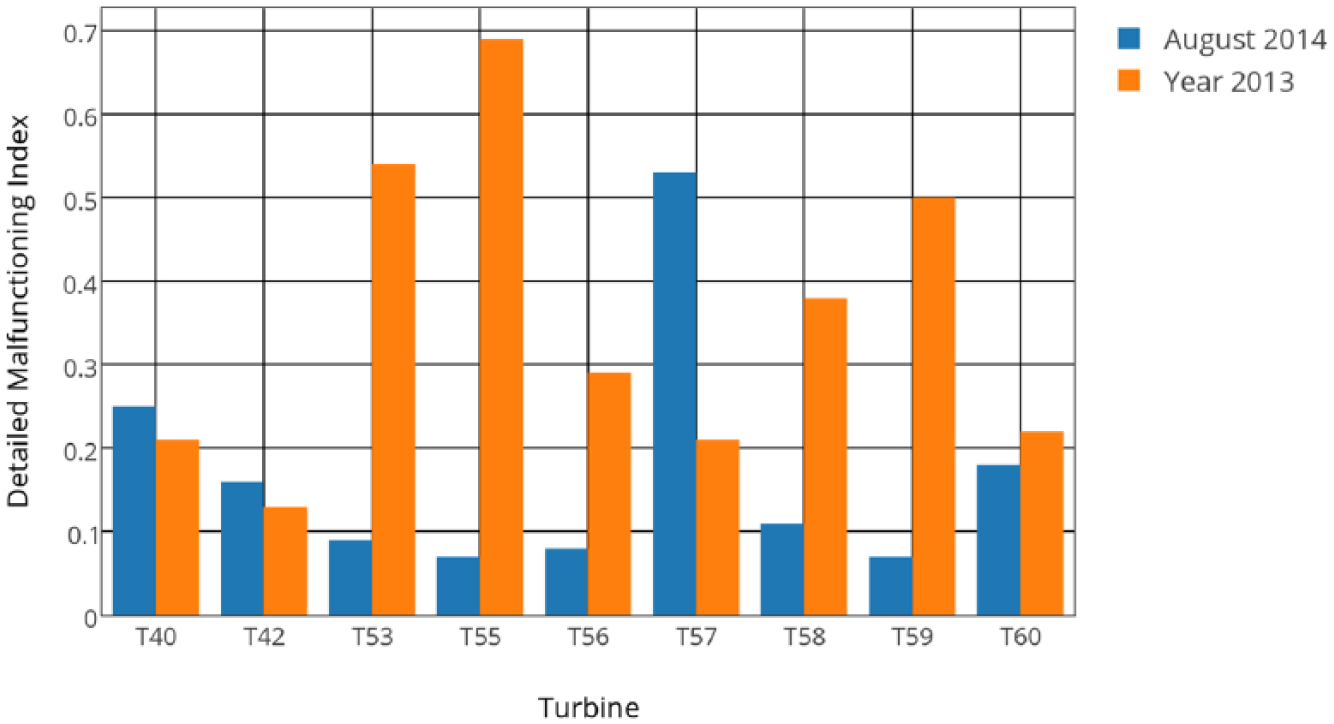
Wind farm 1:
Figures 5 and 6 show
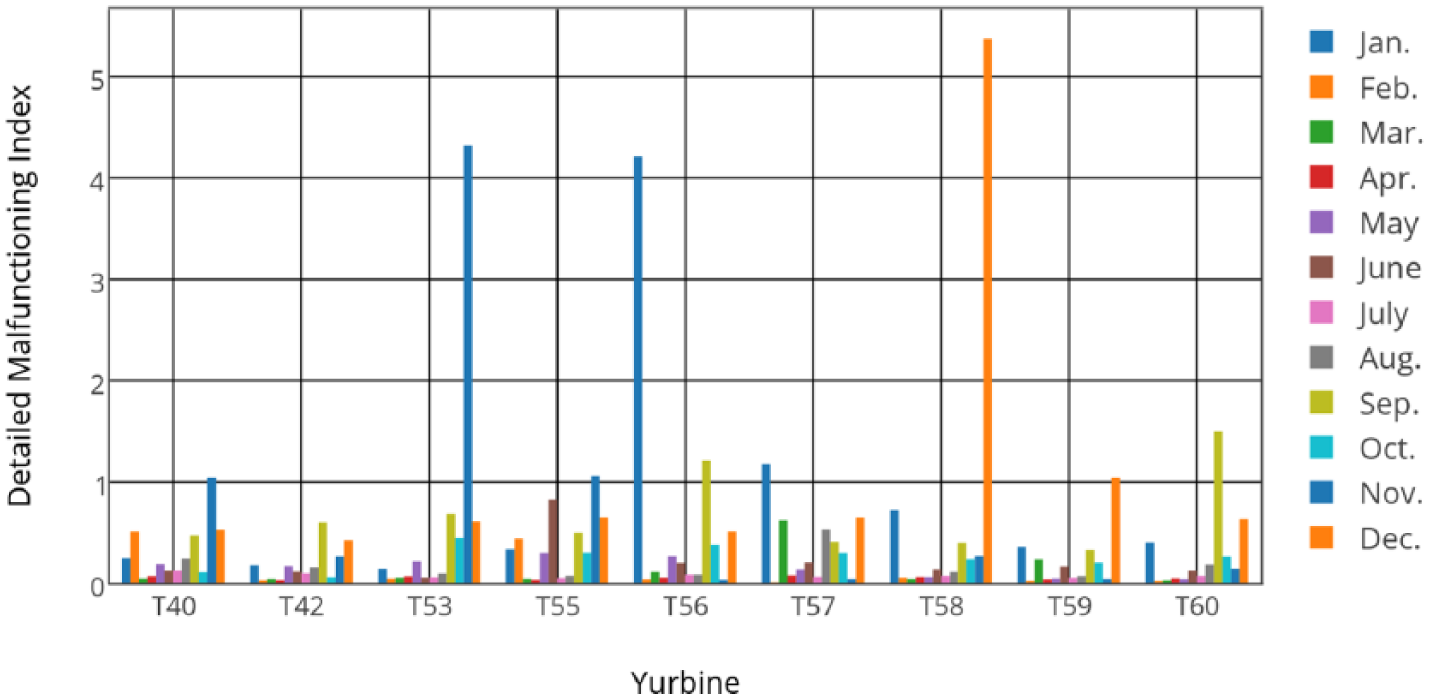
Wind farm 1:
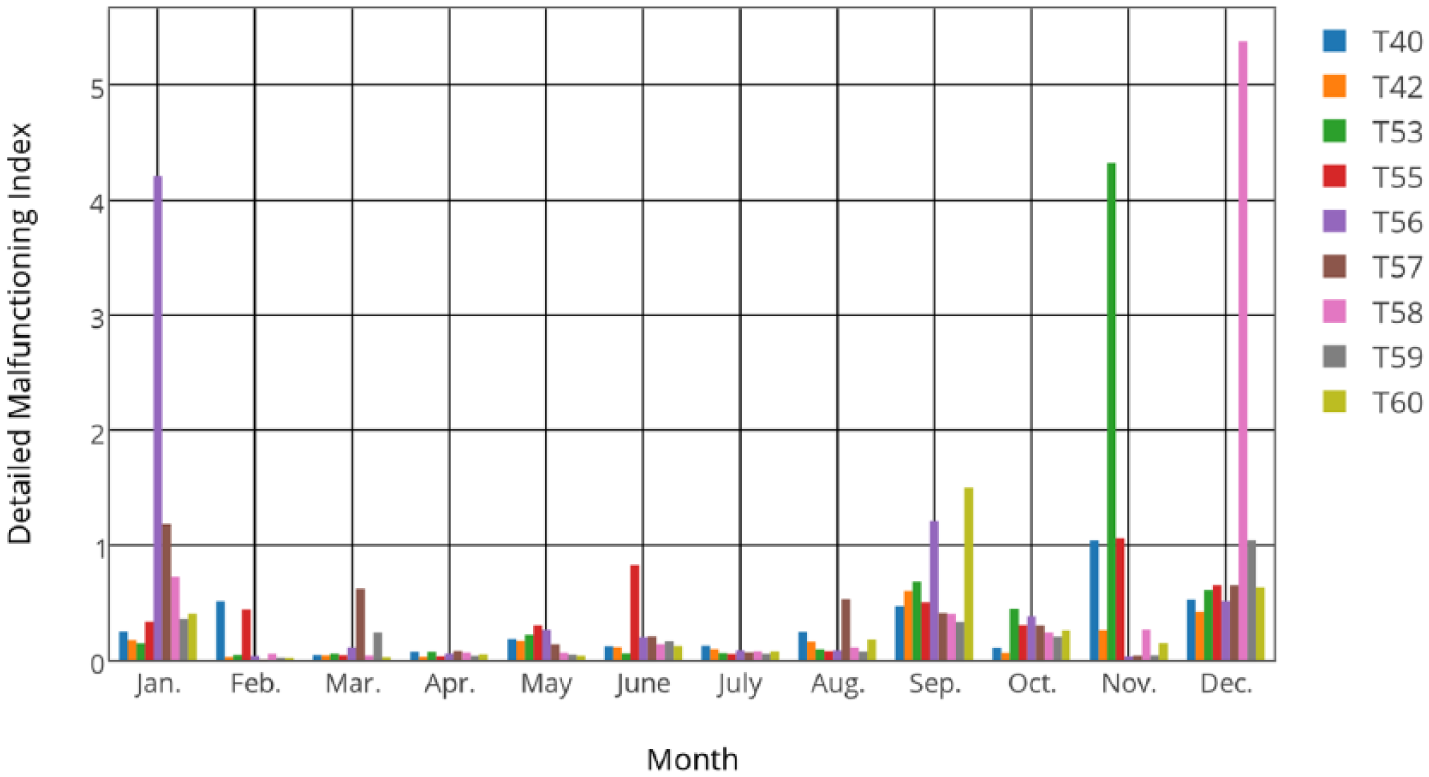
Wind farm 1:
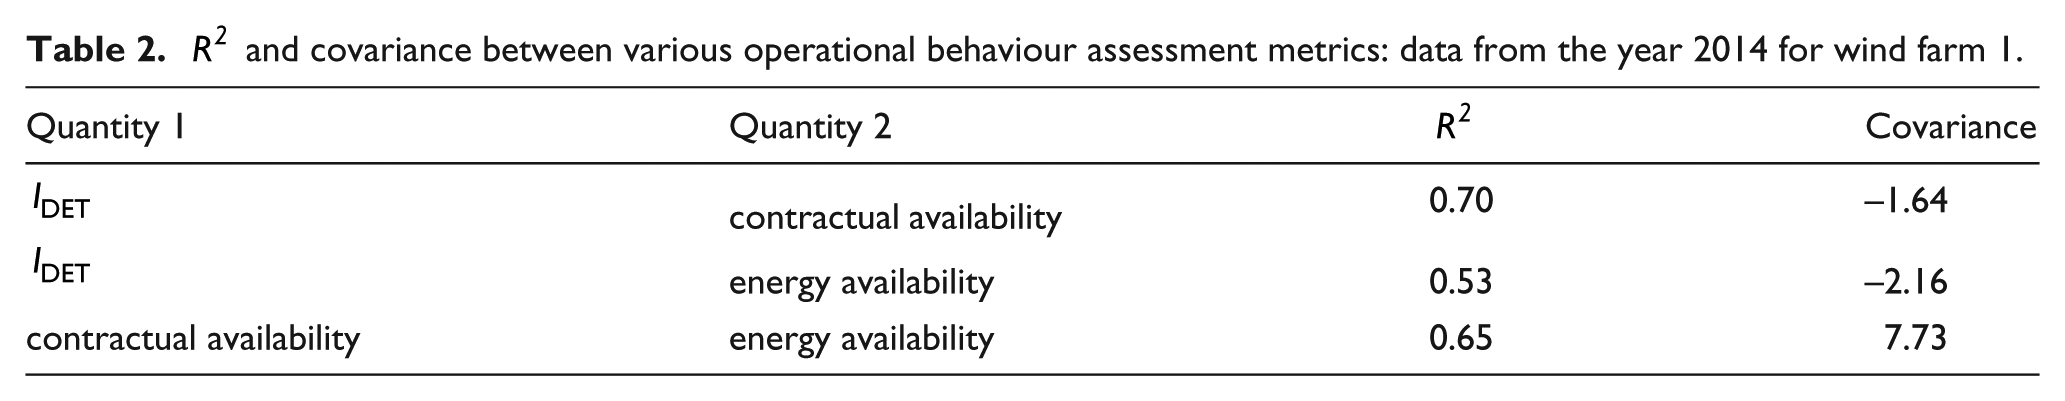
From the analysis of Table 2,
Number map and wake effects
The philosophy depicted in “The approach and the wind farms” section has been applied to the test cases of wind farms 1 and 2, for exploring how wake interactions interplay with the effects of terrain complexity.
The terrain of wind farm 2 is so complex and vast that only the central subcluster of Figure 2 has been considered; it has been chosen because the inter-turbine distance is such that considerable wake interactions arise when the wind blows from the most frequent direction sectors of the rose. Furthermore, there are severe slopes near the turbines, and the operating meteorological mast lies in the proximity of the selected cluster, thus providing a reliable landmark for wind direction and intensity.
Wind farm 1 is a very different testing ground, as the slopes are very gentle and the dynamics are mainly driven by wakes. The subcluster of turbines T56-T60 has been chosen because, when the wind blows from the most populated
The test cases of subclusters of the wind farms have been chosen because they both lie near to a reliable meteorological reference, and they are both affected by severe wakes under a very populated wind direction sector. Further interest arises from the fact that the two specular subclusters lie on terrains with opposite features.
The data sets at our disposal have been filtered on the regime of wind speed intensity, as measured by the met mast to be between 3 and 7 m/s. For low wind speeds, the effects of wakes and terrain are enhanced, while at high wind speeds turbines usually produce at rated power.
The analysis is focused on the nacelle positions of the chosen subclusters when the wind blows from the
The procedure is as follows: data are filtered on an interval of variable amplitude, centered on the
The amplitude of the range of measurements associated to the same binary number is chosen to compromise the necessity of a fair population and to avoid coarse graining effects. Bins which are too large would dilute the continuous information of the measurements, and the method would therefore be unable to capture the expected movement of the cluster of turbines as a higher order entity. Thus, the procedure results in simplified data sets, made up of a series of vectors of digital numbers (one for each turbine).
A primary effect of the presence of rotors on the wind flow is the so-called wind veer: when a turbine is under wake, it is usually unable to optimally follow the wind direction, which changes too rapidly. Therefore, the nacelle anomalously blocks, causing significant power losses; this should be seen mathematically in the form of an anomalous correlation between the rotor positions of the upstream and downstream turbines. In other words, when wakes are relevant, a series of turbines should be seen “as a whole”, rather than as a collection of individual independent machines. In order to analyze this effect, simple statistical methods are useful.
Binary numbers have been considered both collectively for the set of turbines under analysis (by simply attaching them as strings), or separately for each turbine. The mode of the global configuration has been computed, and it has been compared with the vector built up with the mode of each turbine data set. It has been observed that, if one opens up the wind direction interval as measured from the meteo mast (according to which data are filtered), or if one opens up the binning too much, the mode of the vectors becomes equal to the vector of the modes. This is an evident manifestation that, when there are no wakes, the response of a turbine to wind direction is, at least in mode, independent of what the other turbines do. When one zooms very carefully into the dynamics of wakes, with proper direction amplitude and fine-grained binary number map, the alignment to the wind of a cluster of turbines appears, as it is, an intertwined phenomenon.
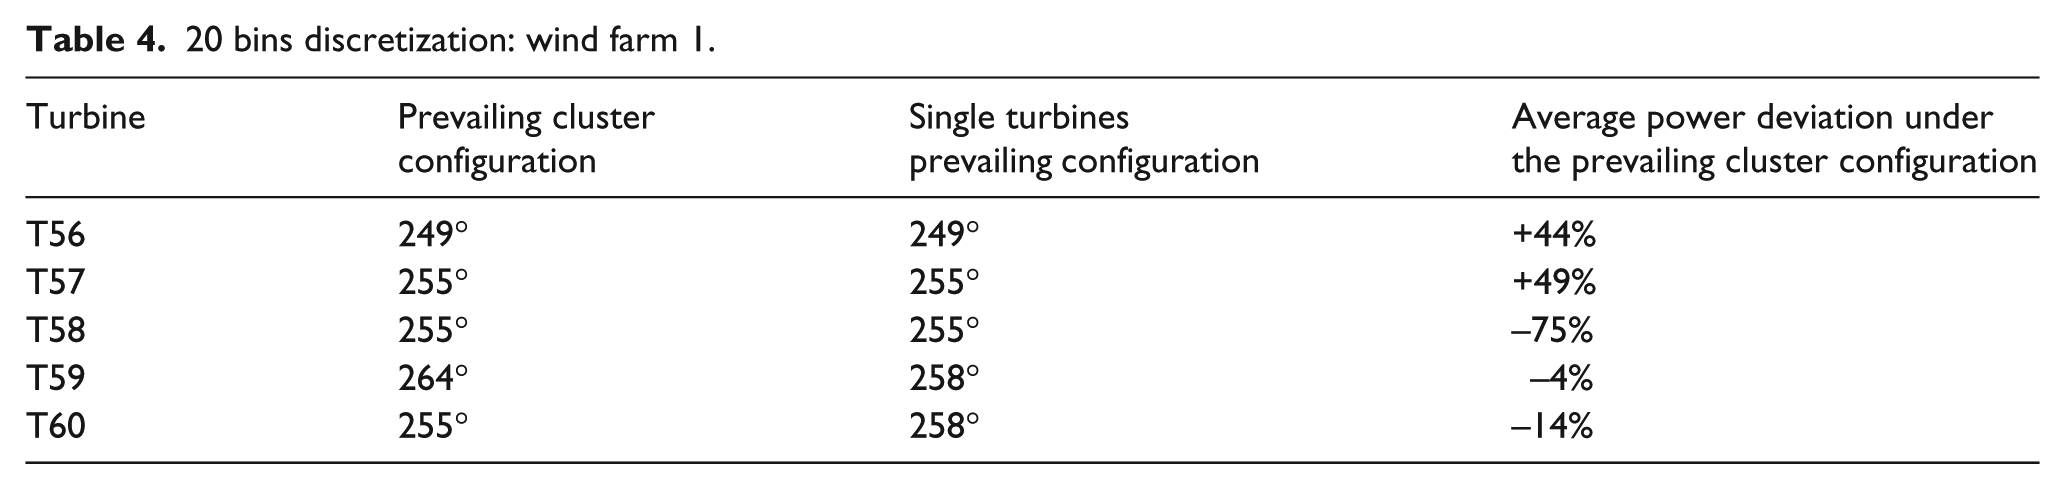
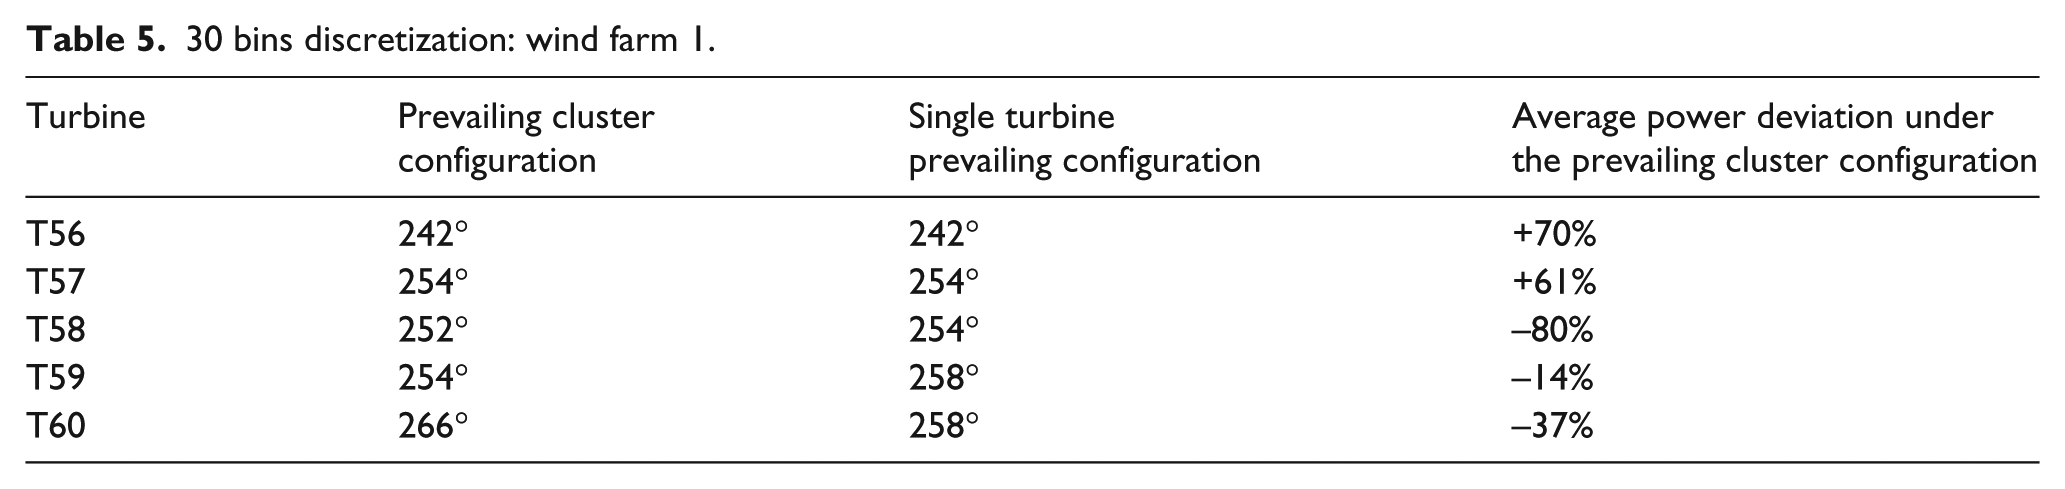
Figures 7 and 8 show the analysis for wind farm 1; due to the vastness of the data set, two fine-grained maps are applied: 20 bins and 30 bins, i.e. respectively 20 and 30 digits for each position, on a
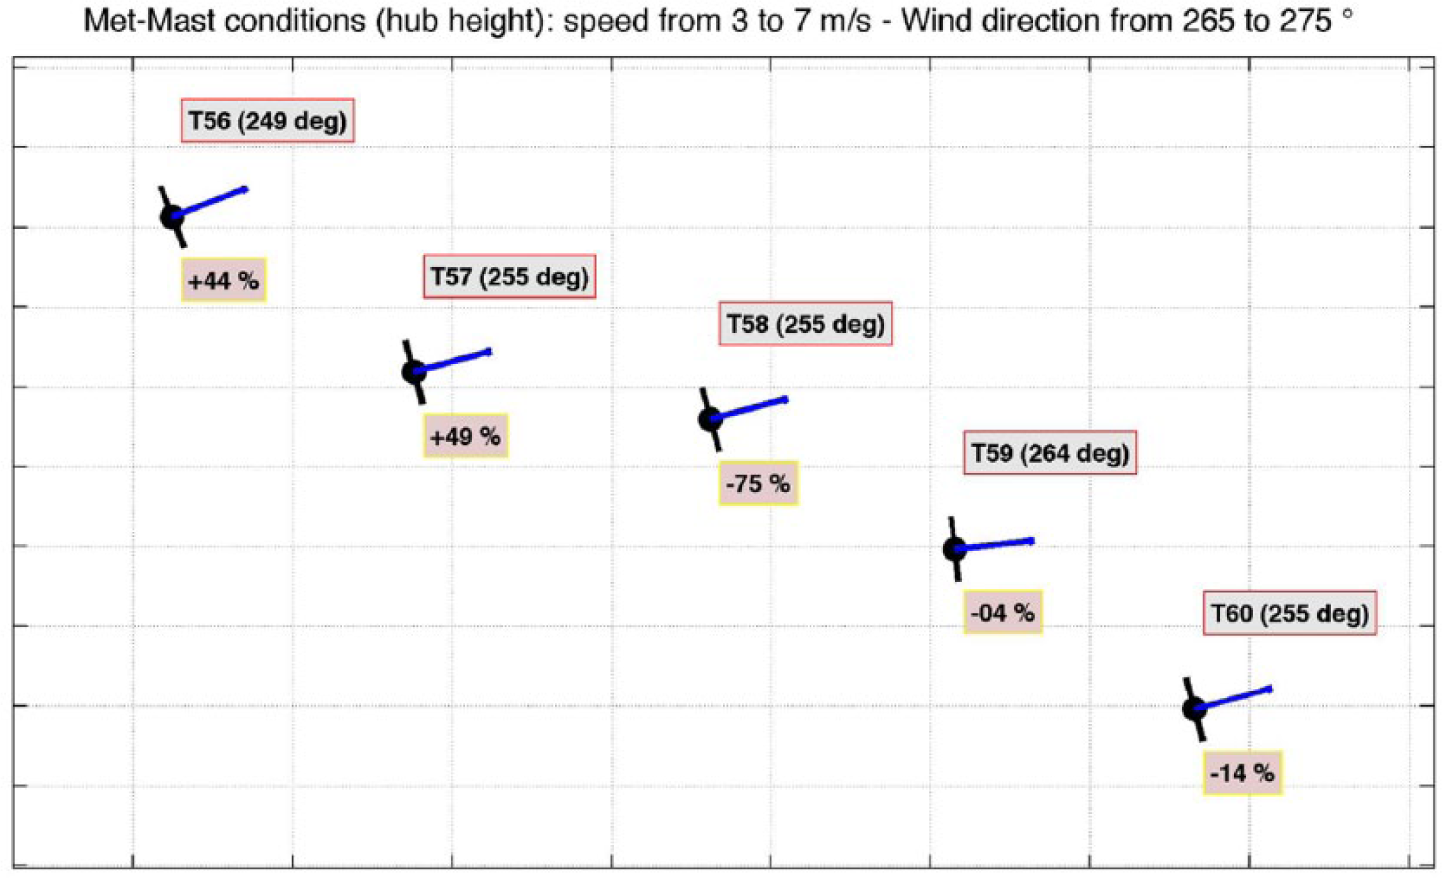
Wind farm 1: prevailing turbine alignment and power distribution on this configuration, for the
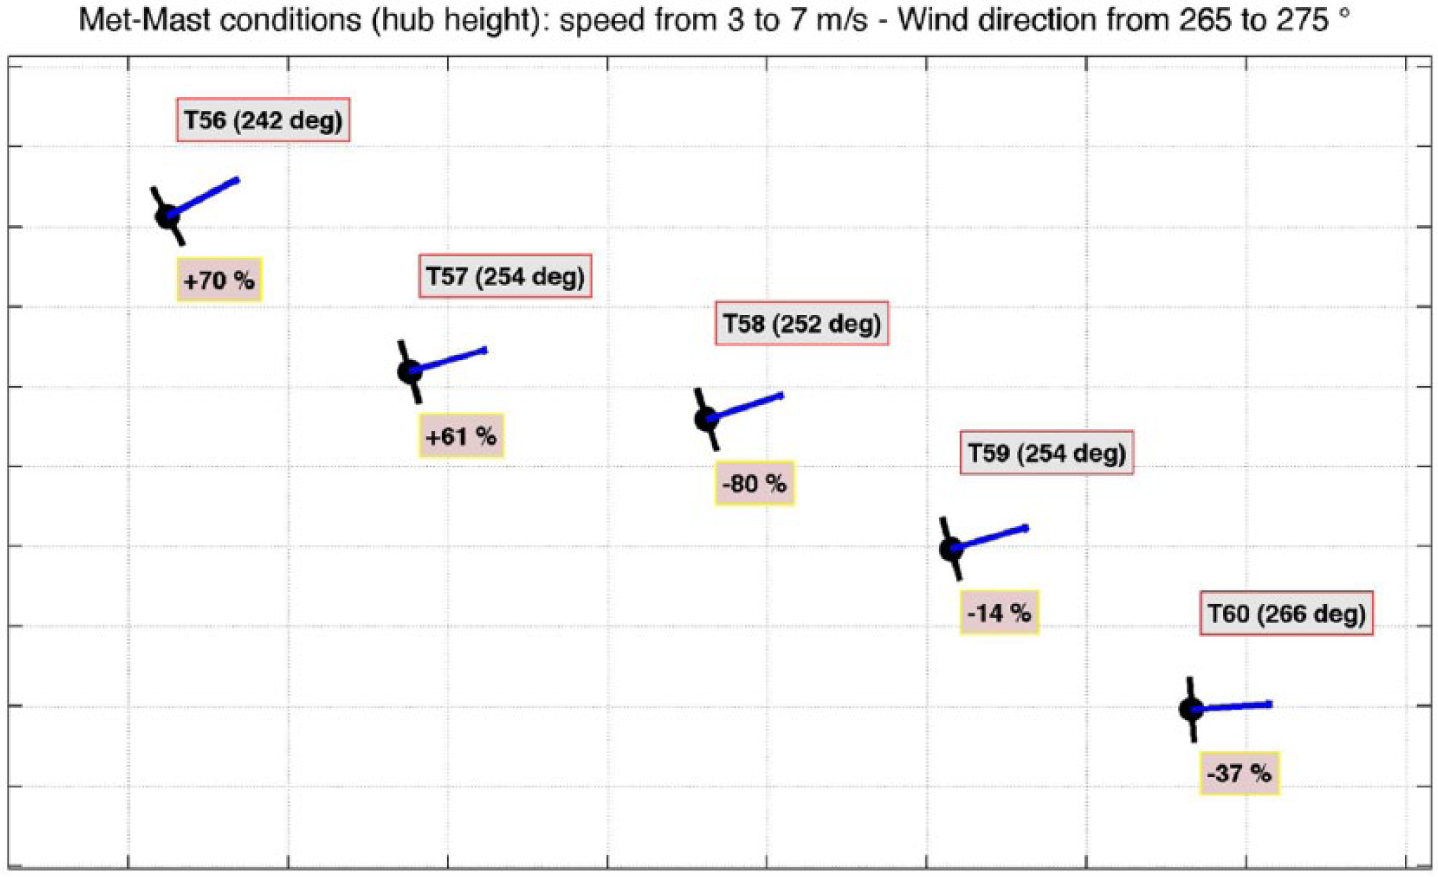
Wind farm 1: prevailing turbine alignment and power distribution on this configuration, for
T58 is affected by the most evident power loss, due to the effect of wake from turbine T57. The power losses are mainly driven by wakes, and there is no considerable effect due to terrain complexity.
Comparison of Table 3 with Tables 4 and 5 shows that the turbines most affected by wakes (T58-T59 especially) deviate more severely from the cluster average under the prevailing configuration than in general when the wind blows from
The most frequent position of the rotors is quite different from the inflow conditions defined by the met-mast; this can be due to complex flow conditions induced by multiple wakes overlapping. The wakes of T53 and T55 seem to influence the behaviour of the selected sub-cluster in some way.
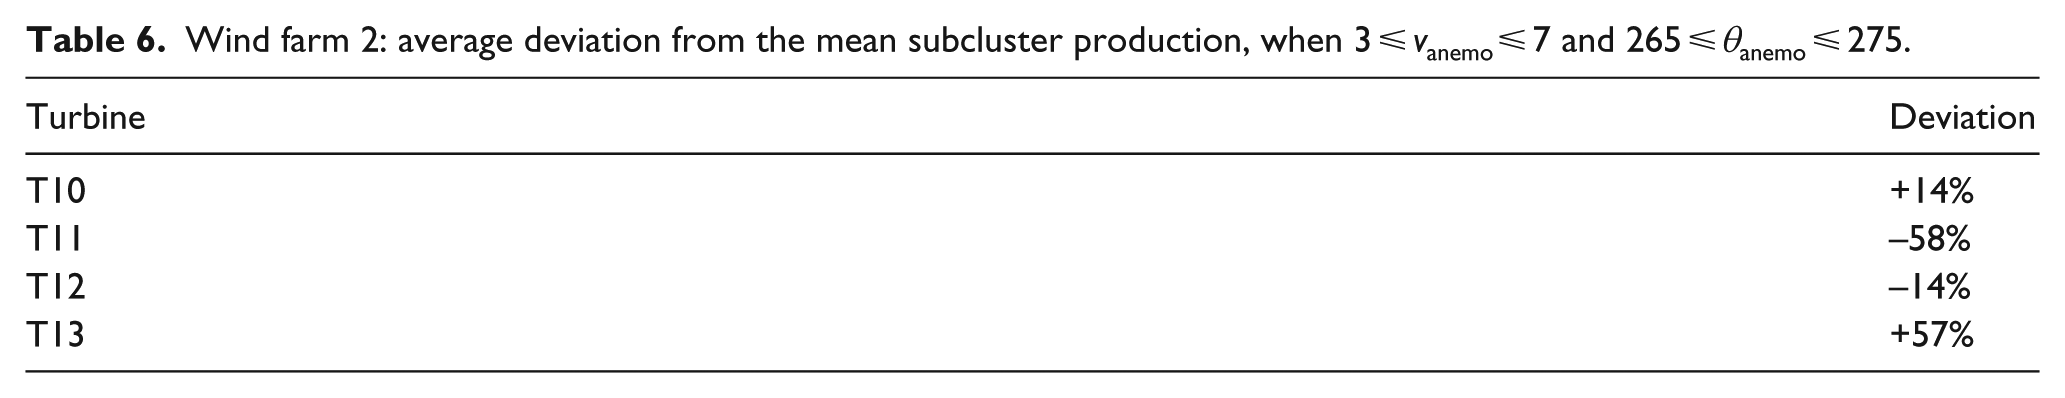
Wind farm 1: average deviation from the mean subcluster production, when 3 ⩽ vanemo ⩽ 7 and 265 ⩽ θanemo ⩽ 275.

20 bins discretization: wind farm 1.
30 bins discretization: wind farm 1.
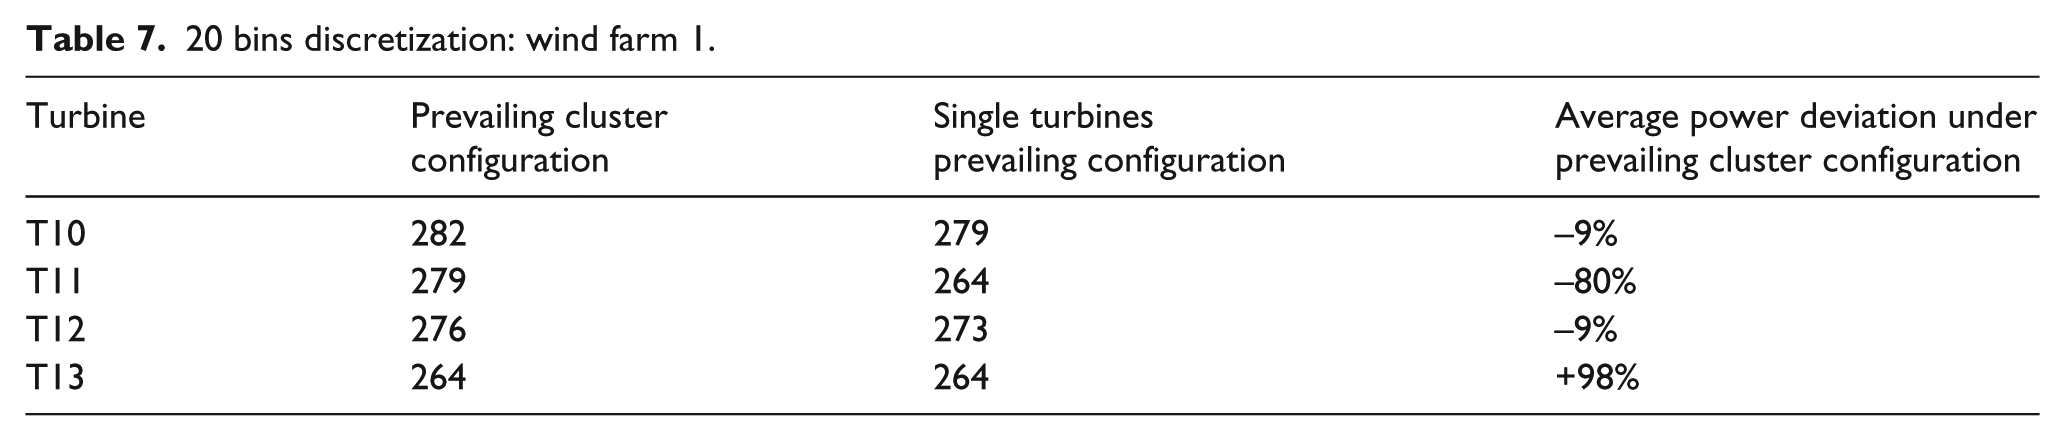
The analysis of the wind farm 2 test case reveals interesting and very different features with respect to wind farm 1, as shown in Figure 9 and Tables 6 and 7.
Turbine T11 is heavily affected by the wake of turbine T10. Under the prevailing configuration, the power production of T11 deviates on average by
The wake dynamics are very complex and are mixed with the effect of the terrain. The downwind position of T13 reveals good production, because in such a complex environment the wakes of upstream turbines lack directionality.
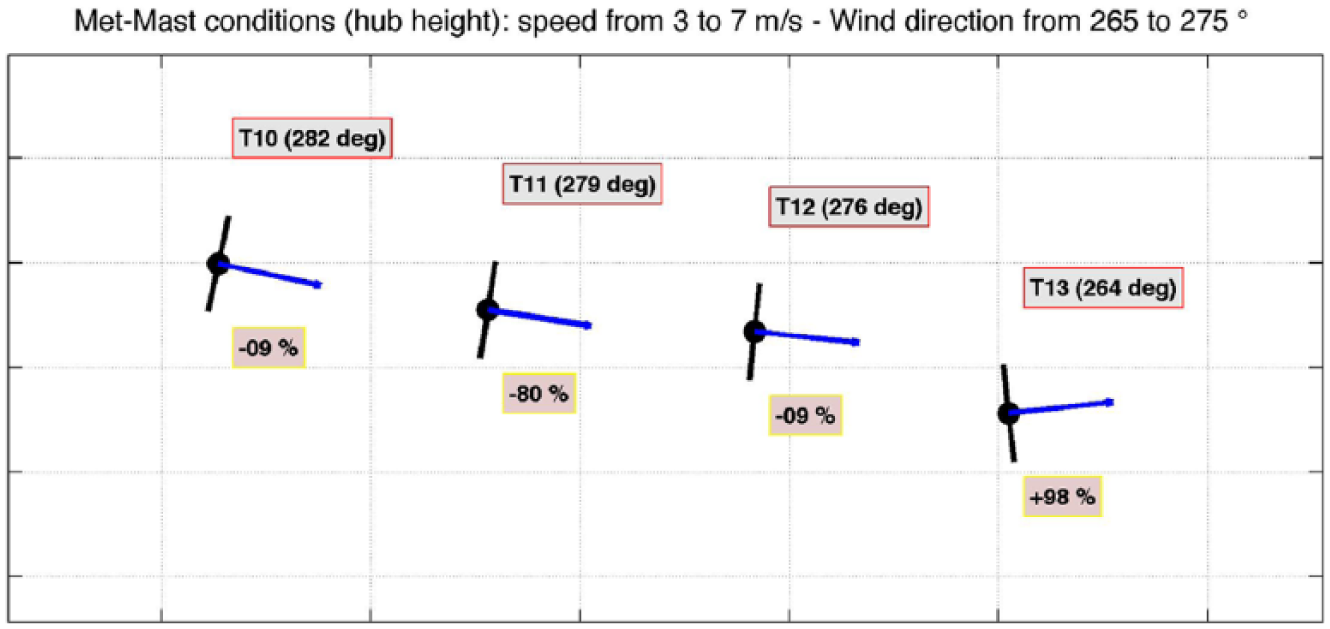
Wind farm 2: prevailing turbine alignment and power distribution on this configuration, for 270° sector, with 20 bins discretization.
Wind farm 2: average deviation from the mean subcluster production, when 3 ⩽ vanemo ⩽ 7 and 265 ⩽ θanemo ⩽ 275.
20 bins discretization: wind farm 1.
Zoom on efficiency and wake effects
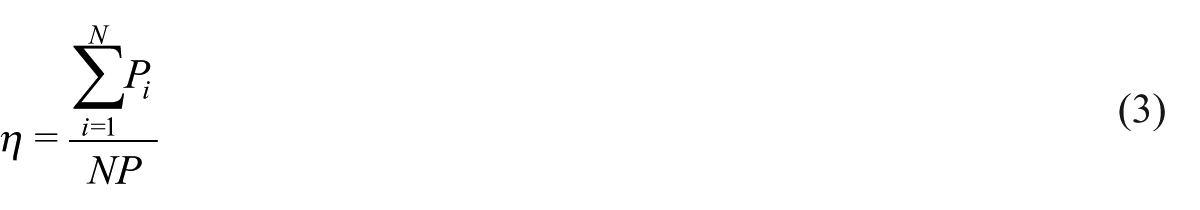
A well established single parameter metric for evaluating goodness of power output quality is the efficiency (Barthelmie et al., 2010). Previous work by Castellani et al. (2014a) demonstrates that for onshore wind farms, possibly on complex terrains, the definition of efficiency should be adapted. The standard definition of efficiency is given in equation (3)
where
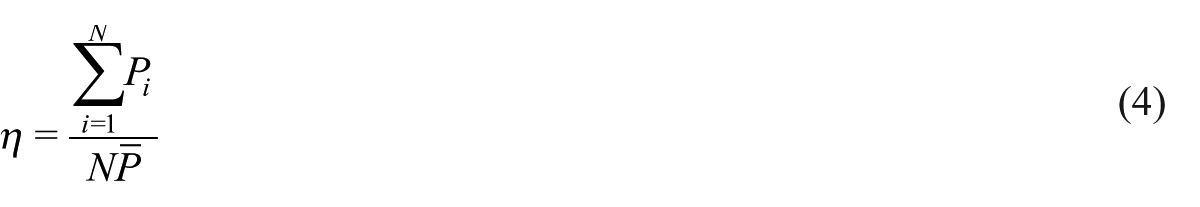
where
The efficiency, as defined in equation (4), can be identified as the ideal candidate to quantify the goodness of the orientation patterns of nacelles to the wind direction. In the following we shall therefore construct a closer link between misalignment, due to wake effects, and power losses. The power of the method proposed in “Number map and wake effects” section, which we recall and evolve, is that we consider the orientation of a whole cluster of turbines rather than a collection of individual turbines.
The proposed algorithm is as follows: only wind farm 1 is considered, because its data set is the larger of those at our disposal and shall provide a statistical significance to the analysis. The focus is still on winds from the
The procedure described above also explains why turbine T56 has been left out of the current analysis: in order to highlight more clearly the effect of wakes through variability of the polar efficiency, only the turbines suffering from the most severe wakes have been included. Further, the aim is to select a very narrow wind direction interval, where the efficiency can be considered flat to a good approximation. This allows us to have at hand a data set describing in the first instance the same “external state”, to which we intend to inquire how turbines react, in order to identify the most favorable configurations. Since we need to trust strictly met-mast measurements, whose reliability is verified by supporting evidence summarized in “Number map and wake effects” section, we should exclude turbines which do not lie close to it; for this reason, the compact subcluster T57-T60 has been chosen.
Next, nacelle positions are converted into binary numbers through discretization, as described in “Number map and wake effects” section. The results presented hereon are obtained with a
Every time step and every efficiency measurement can therefore be associated to a string, describing the orientation of the cluster of turbines. One can subsequently: classify the configurations according to the frequency of their occurrence, identify the dominant patterns of the cluster and inquire if they are favorable or not. The procedure is as follows: the average efficiency has been computed for the whole data set passing the filter. Further, for each configuration one can compute the average efficiency associated to the pattern. Figure 10 shows the mean efficiency for the eight most frequent orientation patterns. A limited number of configurations has been chosen, ensuring that a significant population is associated with each of them.
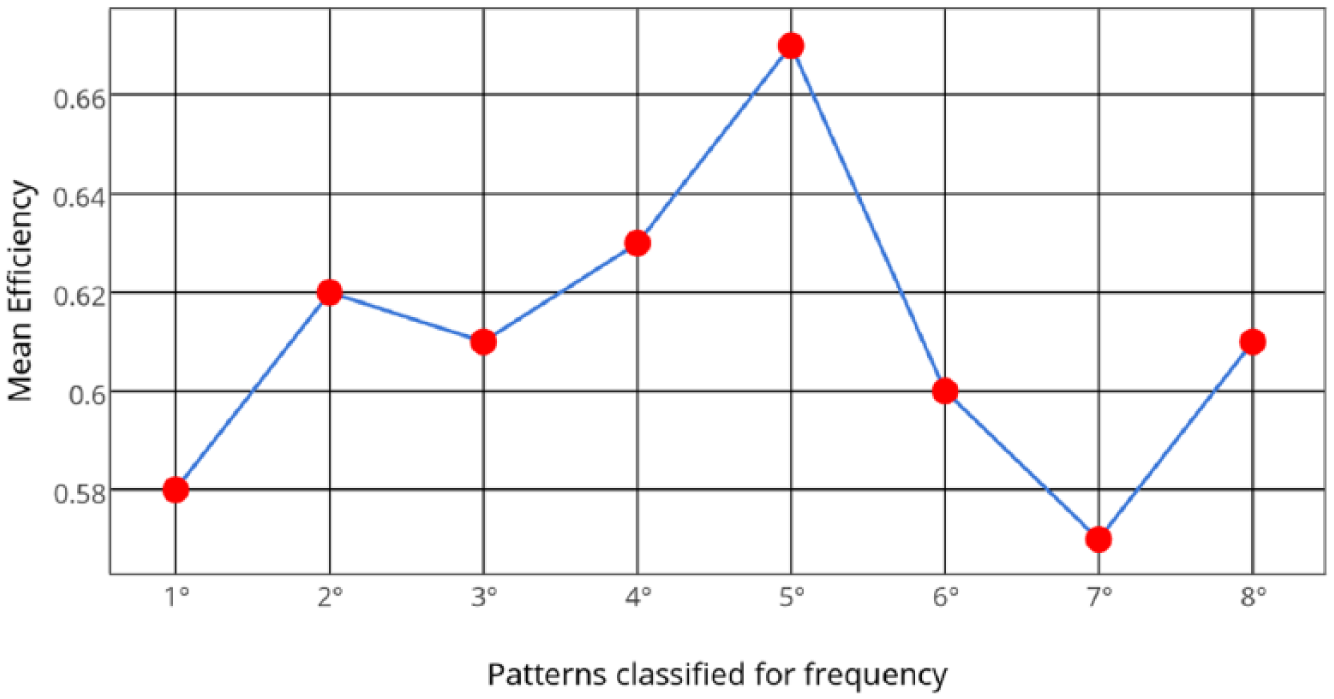
The eight most frequent patterns and their mean efficiency.
From Figure 10, it arises that non-negligible efficiency deviations occur between the most frequent patterns, and therefore the control system response to wind direction heavily affects the quality of performances. In Figure 11, the eight most frequent patterns are analyzed in terms of two quantities, which allow non-ambiguous evaluation of their goodness:
mean efficiency, as in Figure 10;
percentage of records occurring on that pattern, which show an efficiency higher than the global average (Figure 11).
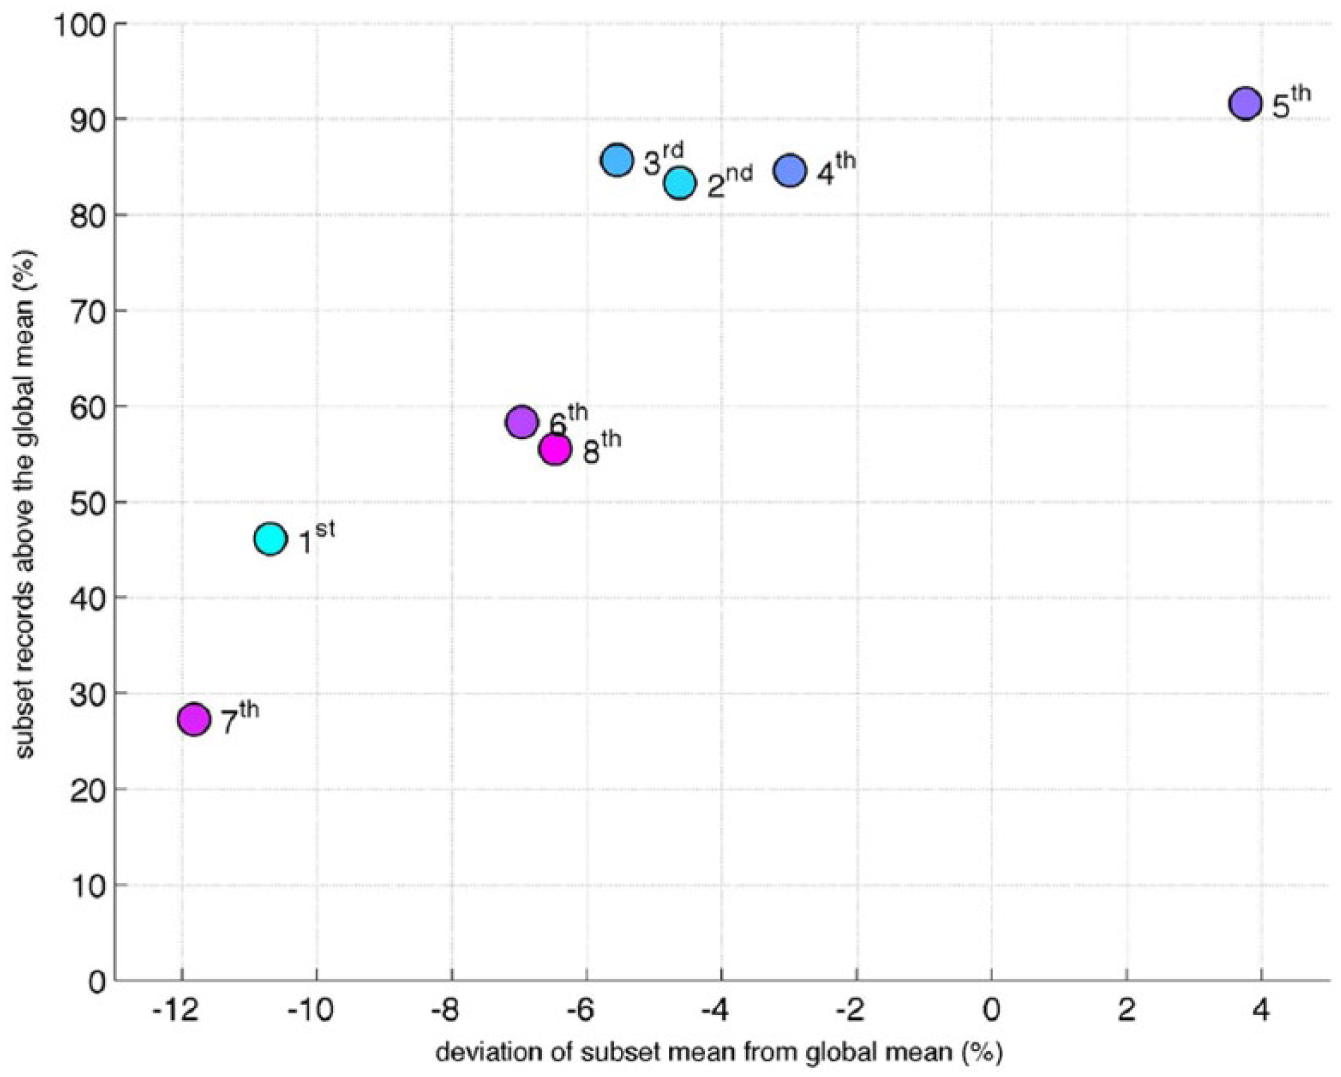
The eight most frequent patterns: a deeper insight into their efficiency.
The subtle issue of whether efficiency is a biased metric deserves a short discussion. From equation (4), it arises that if all turbines perform badly, yet uniformly, efficiency is paradoxically 1. For this reason, the consistency of our approach has been crosschecked by computing the mean cluster power on each record to a given associated pattern configuration; in this way, one can quantify the goodness of the alignment through a unique power measurement. The results are shown in Figure 12. The two configurations displaying better efficiency (4th and 5th) are also associated with better mean production; discrepancies are highlighted further by a power analysis approach, because the 4th and 5th configurations display a mean power more or less double that of the most frequent worst configurations. This strongly supports the consistency and goodness of our approach.
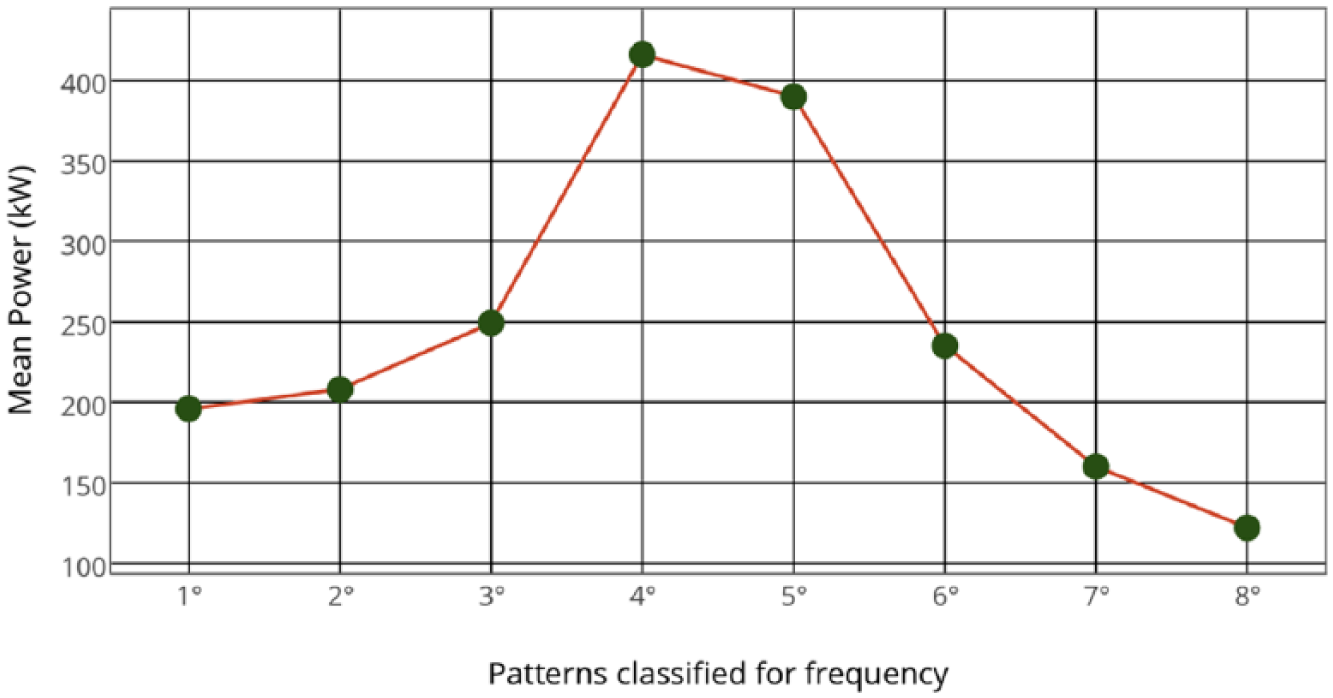
The eight most frequent patterns and their mean power.
A further consistency check has been performed: how representative are the most frequent patterns, isolated through a filtering procedure, of the unfiltered data set? And are the performances on these configurations, when no filter is applied, comparable to those highlighted on the refined data set? These questions are answered by repeating the plot of Figure 12 on the unfiltered data set and on the data set filtered only on the wind direction. The results are shown in Figure 13, which shows that the trend is the same for all the data sets. In particular, the 5th most frequent position, one of the two best ones, displays a higher mean power when no filter on wind intensity is applied.
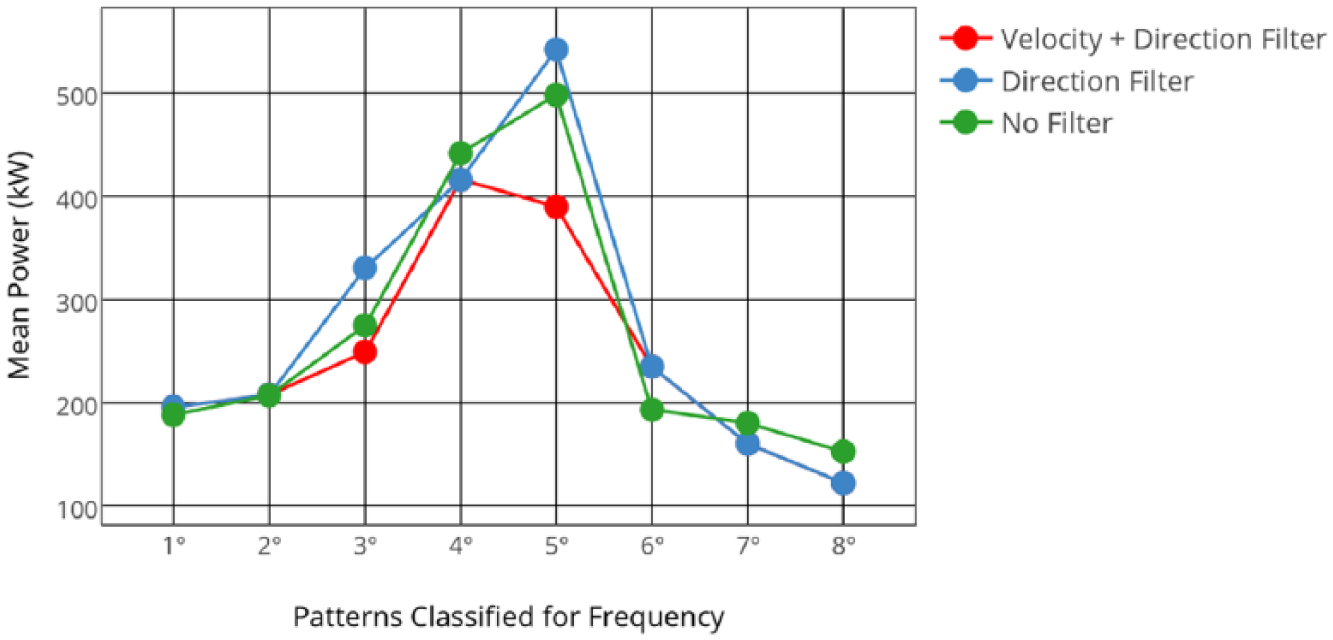
The eight most frequent cluster configurations and their mean turbine power: intensity and direction filter, direction filter, no filter.
Yaw active control and non-trivial alignment programs (Theodoropoulous et al., 2014; Wagenaar et al., 2012; Fleming et al., 2013) are becoming a relevant topic for offshore wind farms, since dynamics is mainly driven by wakes, and minimizing consequent power losses is a crucial task. The analysis of “Number map and wake effects” section could be a valuable starting point for extending this approach to onshore wind farms, where farm layout and wake effects conspire non-trivially with the complexity of the terrain. Identifying the features of the best configurations is indeed very useful from the perspective of yaw active control systems. In Figure 14, the two worst and two best configurations (among the most frequent) are shown pictorially.
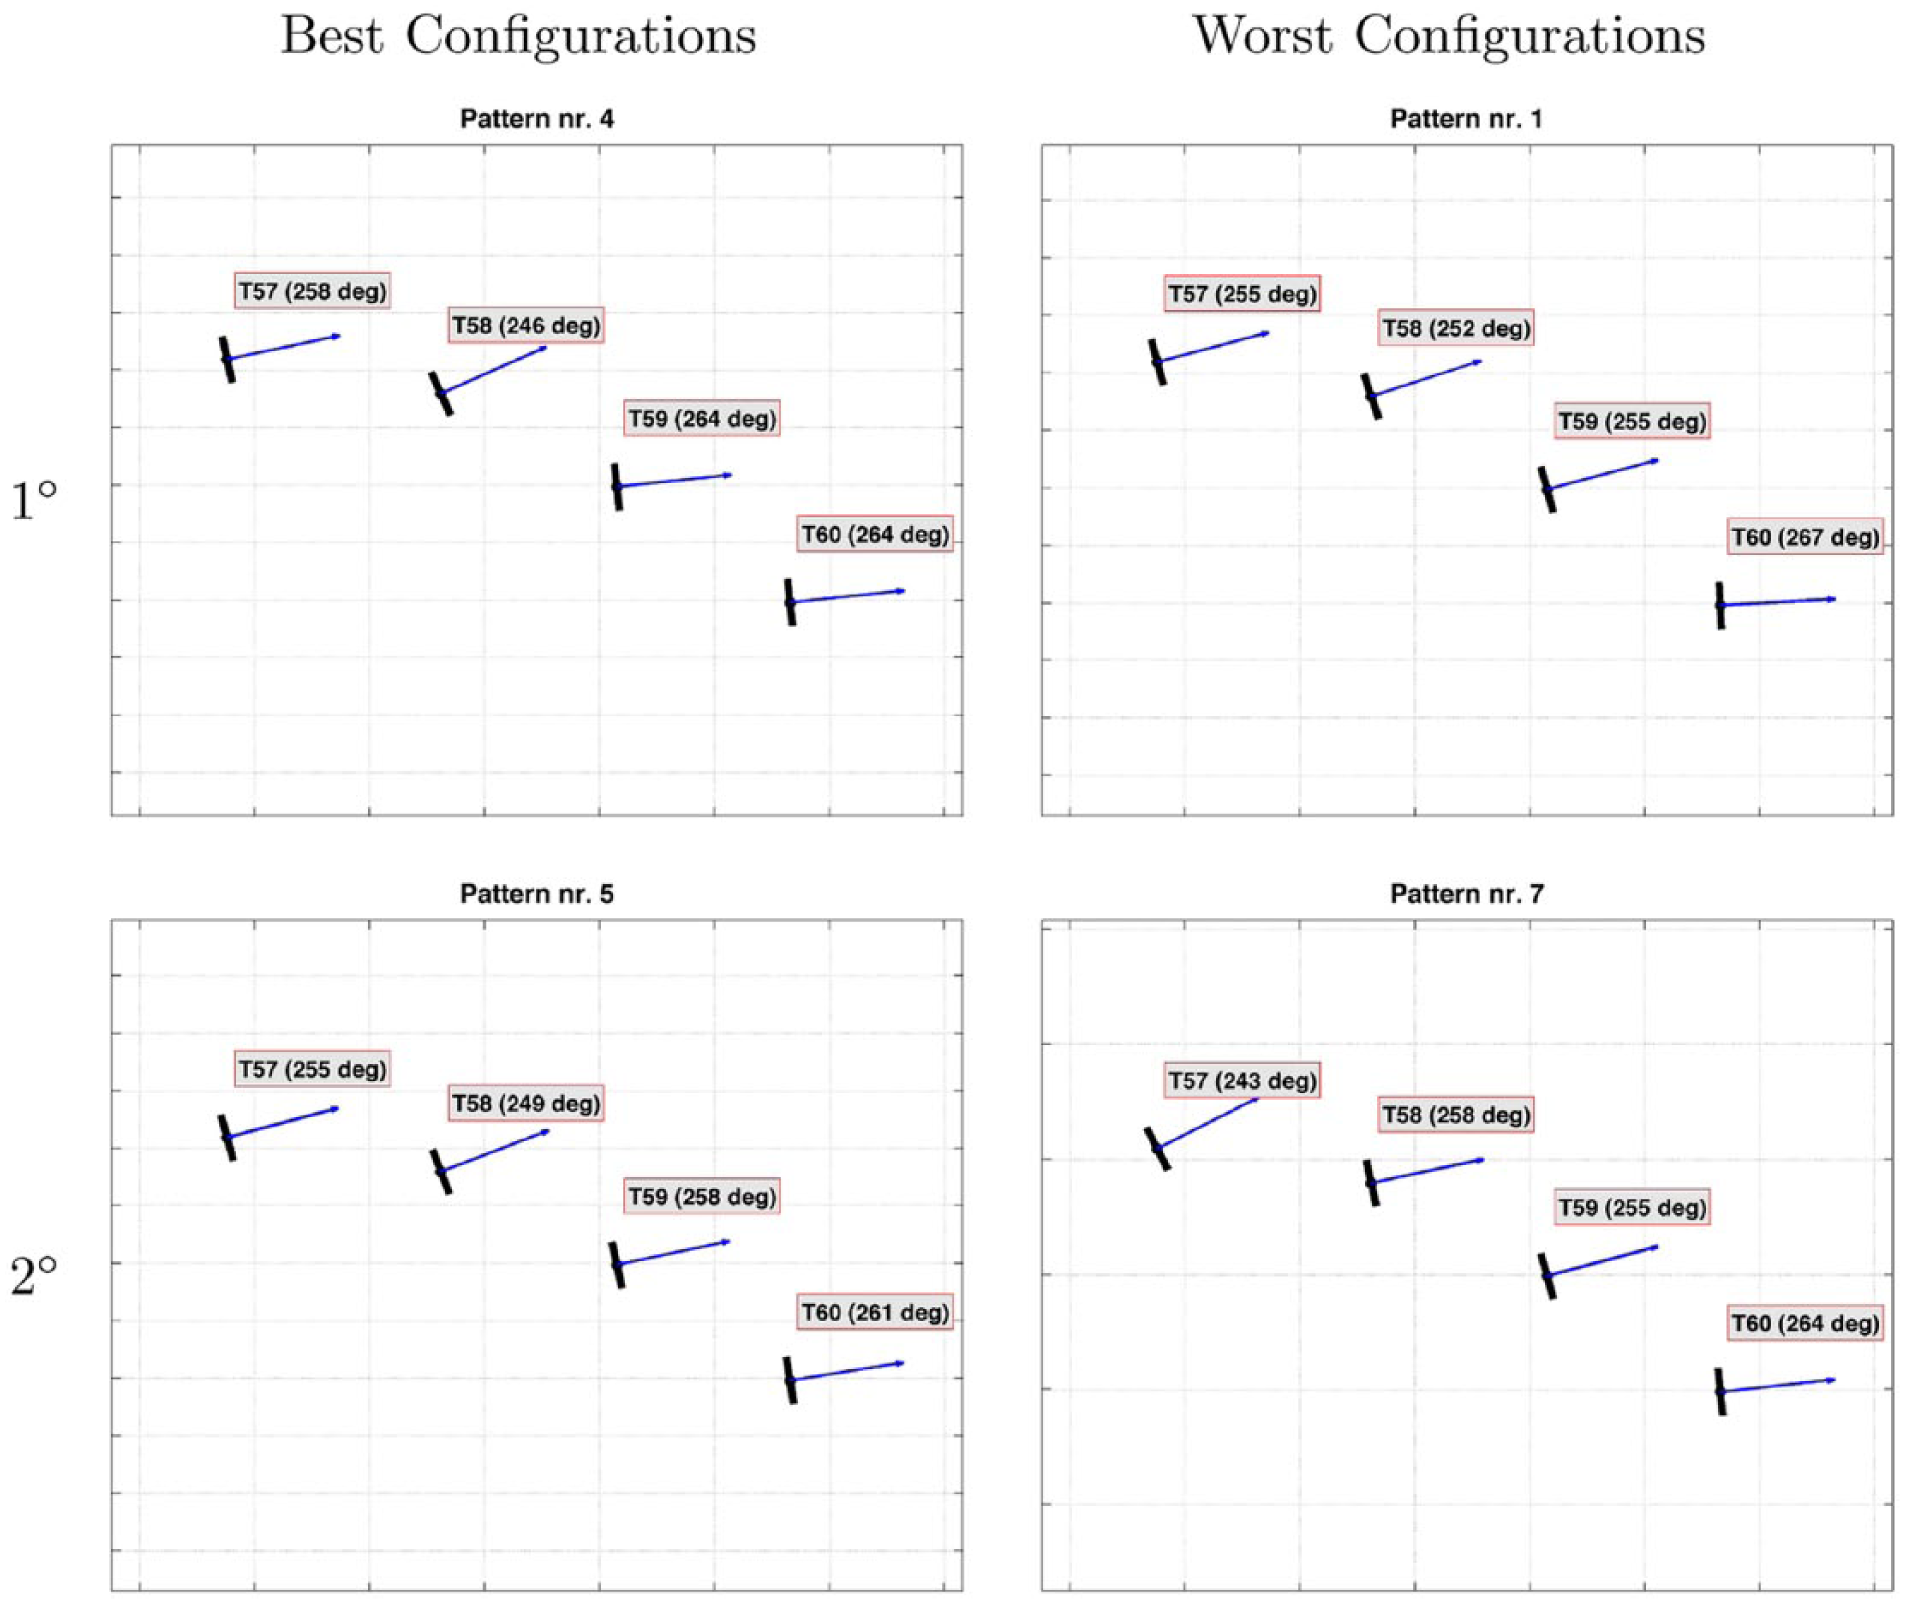
Cluster alignment patterns of the two best and the two worst configurations among the most frequent.
From Figure 14 some interesting considerations arise;
The orientation vector associated with the best performances is the following:
The best performing configurations display an almost parallel orientation of turbines T59 and T60. This again avoids creation of wakes along the line joining T59 to T60. Nevertheless, the relative orientation of the turbines T59 and T60 is less crucial for the considered test case, since the line joining them has an almost 300° orientation. The chosen test case especially tests the relative and absolute orientation of turbines T57 and T58.
The arbitrariness in the grain of the discretization can easily be circumvented, as the lower limit of the size of the intervals is dictated by the size of the common standard deviation of a nacelle position measurement. One must not distinguish computationally between measurements that are experimentally indistinguishable. If one, instead, considers a coarser grain, the best configuration is a deterioration of the one described above. Further, if one varies the binning grain, the frequency ratio between the best configuration and the most populated one remains of the same order of magnitude. Therefore, clear indications of stability and consistency of the proposed approach have been obtained.
Conclusions and future directions
In the present paper, some methods have been proposed and discussed for post-processing data, spreading out from wind turbine control systems, and extracting knowledge from them. The subject is rapidly growing in the literature, both for the scientific challenges imposed by the task of synthesizing vast and complex data sets into meaningful indicators, and for industrial urgency; the financial crisis has diverted funds from new installations into optimizing operating farms. Further, the necessity of building “smart” electric grids requires accurate balancing of renewable intermittent sources and non-renewable energy sources, therefore accurate production forecast, for which operational data is an essential ingredient, is a crucial development.
The vastness of the data sets commonly employed can be turned from a limitation into an advantage and there are several techniques for tackling SCADA data: artificial neural networks on “raw” measurements (because of their capability in codifying non-linearity), statistical methods and post-processing techniques.
The methods discussed in the present work share a common ground, as they are based on post-processing techniques which simplify the continuous dynamics of appropriate quantities into a map built of binary numbers. At the cost of introducing some coarse graining and converting continuous quantities into discrete ones, simplified data sets are obtained. Using simple statistical methods on these allows us to extract meaningful knowledge.
This philosophy has been applied to two very different phenomena: machine state dynamics and turbine alignment with the wind direction. The methods have been tested on two wind farms in southern Italy, which have been chosen because they lie on very different terrains: the first being almost flat, the second being very complex (with slopes of up to 60% in proximity of the turbines).
In “Malfunctioning indexes” section, a binary map of the dynamics of the states of the machine is built on the same 10 minute time basis of the SCADA measurements. A digit is associated with each of the operating states, turning from 0 to 1 if the state activates during the time interval. On post-processing the simplified data sets, two indexes are formulated for quantifying the goodness of the operational behavior of each single machine and of the whole wind farm. It is shown that the indexes are consistent, because in the long-term they correlate linearly with machine downtime. However, in the short-term they capture more complex information with respect to the amount of downtime: they codify how much a turbine deviates, for better or worse functioning, with respect to the trend of the farm.
In “Number map and wake effects” section, the continuous dynamics of turbine alignment to wind direction is tackled by discretization into a binary number map: to each nacelle position falling inside a discrete interval, the same string built of 1s and 0s is associated. Subclusters of the test case wind farms and meteorological regimes are selected according to the criterion of observing the dynamics of wake interactions. It is shown that the method is capable of codifying the main features of the wind flow, of turbine alignment (or rather misalignment) when wake effects conspire with terrain complexity, and of the consequent power losses. Further, “Zoom on efficiency and wake effects” section features a deepening of the above analysis: the subcluster T57-T60 of wind farm 1 is considered, and data are filtered on a very narrow wind direction range. Response of the turbines to such wind configuration is investigated through the approach of “Number map and wake effects” section, identifying the dominant cluster configurations. To each configuration, a set of efficiency measurements is associated, and it is highlighted that among the recurrent patterns non-negligible performance deviations arise.
Further applications of the present work include extending the number map of state dynamics: the analysis of “Malfunctioning indexes” section is focused on the operating states and provides a tool for non-trivially quantifying the goodness of operational behavior. In other words, the analysis is focused on what each turbine and the farm do, when wind conditions are such that machines are expected to produce. We plan to extend the above approach to the information contained in the status codes: they demarcate in three classes of decreasing severity (error, warning, info) and build the basis for understanding why each turbine behaves as dictated by the corresponding operating state. Status codes dynamics is far more complicated than operating state dynamics; however we trust that the method proposed in the present work could successfully be a basis for understanding and classifying fault onset, their reasons and characteristic time of return to normal functionality after breakdown or maintenance.
The analysis in “Number map and wake effects” and “Zoom on efficiency and wake effects” sections poses interesting issues to be investigated further: in “Zoom on efficiency and wake effects” section it has been noticed that, even for a wind farm situated on a very gentle terrain and with a nacelle alignment of best efficiency, under regimes affected by severe wakes, the positions are far from trivial, if compared with the met-mast landmark. It would be challenging to find whether these features show any relation with subtle aspects of wind flow, for example turbulence. A further promising development is including the analysis of the wind vane signal of each turbine. It would be interesting to investigate whether the wind vanes show dominant configurations (as nacelle positions do) if they clusterize parallel to the nacelle positions or not, and how the displacement between wind vane and nacelle position distributes under the dominant and the most efficient patterns. We support this approach, as well as its future directions, as a valid contribution to the perspective of optimally designing yaw active control systems for wind turbines. Efficiency also deserves further investigation: it actually quantifies the homogeneity of the behavior, rather than goodness of performance. It would therefore be valuable to connect it with deeper insights: on the wind flow, through data sets having shorter time scale, or on the mechanical response of the wind turbine. Linking performances, therefore efficiency and wakes, to vibrational analysis and the investigation of loads would be an important further development in the field of applied mechanics.
Footnotes
Declaration of conflicting interests
The author(s) declared no potential conflicts of interest with respect to the research, authorship, and/or publication of this article.
Funding
The author(s) received no financial support for the research, authorship, and/or publication of this article.