
Abstract
This research represents the first wind energy potential assessment that covers major provinces in Egypt. The paper investigates a realistic study technically and economically of wind energy as a talented renewable source for electricity production of various regions in Egypt. More accurate prediction and measurement of wind speed and direction allow wind plants to supply clean, renewable power to businesses, and homeowners at lower costs. Wind resource assessments must be precise in order for wind farms to be built successfully. Wind resource assessments have been carried out in this study. Wind resources evaluation and precise assessment of wind capacity for the four selected sites in Egypt’s provinces from 2017 for 3 years at 10, 50 m above ground level (AGL): Hurgada, Aswan, Alexandria, and the capital of Egypt (Cairo). The wind speed data is taken from NASA for different sites in Egypt. The average annual wind speed was estimated to be 4.44, 4.31, 4.91, and 3.9 m/s at 10 m height, respectively. The economical factors such as NPC and COE in the selected regions are estimated. The optimum location for wind assessment in Egypt is Alexandria which gives maximum wind speed, maximum annual energy, minimum levelized cost of energy, and highest capacity factor. The proposed wind assessment will generated 20,1729 kWh of electricity per year and electricity generation cost per kWh/$ is 0.0818844. This planned cost of wind electric generation is compatible with the local electricity tariff. Also, Feasibility of Construction small wind turbine in this site is investigated. In addition, a criterion of wind farm site selection is presented here with Environmental Impact Assessment (EIA) study through Birds Migration aspect that decreases with increase turbine tower length and short blade length. Through reducing Egypt’s domestic fossil fuel consumption, this work will potentially save tons of carbon emissions each year.
Keywords
Introduction
While worldwide growth is fast, demand for electricity is exponentially increasing and is expected to continue in the future. Due to the fast growth of Egypt population, Egypt struggles today to fulfill its own energy needs. Moreover, Egypt has been known to rely mainly on oil and natural gas in all of its energy-related activities. Therefore, the rapid rise in energy demand and the depletion of fossil fuels pose a major challenge to the development of Egypt’s national economy. It is therefore now necessary to focus on renewable energy sources to supply as much energy as possible, save limited fuel resources, and the emissions of greenhouse gases (Panwar et al., 2011). Egypt has arisen as the Middle East’s and Africa’s global leader in the use of wind energy for electricity generation in recent years. Egypt has some of the greatest wind resources in the Middle East and North Africa area. Egypt has extensive wind resources, with various coastal places with regular high and consistent wind speeds, particularly in the Suez Gulf and the Nile Valley, where wind speeds can exceed 10.5 m/s at 50 m above sea level (Ahmed, 2018). Today, the total installed wind power capacity is around 1300 MW with 1.1 of the electricity generated in the country as the government is targeting 20% of renewable energy by 2022 (GWEC, 2016; NREA, 2018). Wind power production in Egypt has many advantages:
Egypt has one of the best wind potentials in the world;
There is adequate land with a low alternative economic value accessible;
Electricity consumption and other energy sources is rising;
One of the primary environmental challenges in major cities is air quality;
Community development, and funding, donor support has been quite robust.
Egypt, formally the Arab Republic of Egypt, is a continental republic that covers the Sinai Peninsula, which connects the northeastern corner of Africa to the southwest corner of Asia. Egypt is a Mediterranean cabinet fronted on the northeast by the Gaza Strip (Palestine) and Israel, on the east by the Gulf of Aqaba and the Red Sea, on the south by Sudan, and on the west by Libya as shown in Figure 1. Jordan is just across the Gulf of Aqaba, Saudi Arabia is over the Red Sea, and Greece, Turkey, and Cyprus it’s across the Mediterranean, though none of them have a land boundary with Egypt. Egypt is the world’s 31st largest state, with a total area of 1,002,450 and 606244 km2 of agricultural land, with a population of about 101 million people. Egypt is split into 28 governorates; Lower Egypt has nine governorates in the Nile Delta region, 10 governorates in Upper Egypt along the Nile river south of Cairo to Aswan, and five border governorates covering Sinai and the deserts west and east of the Nile. The average of wind speed in Egypt at 10 m AGL from wind Atlas is (5–6 m/s) as illustrated in Figure 2 (Mortensen et al., 2006). Ancient Egypt is regarded as the cradle of civilization, having witnessed the rise of writing, agriculture, urbanization, organized religion, and central government. Egypt has one of the longest histories of any country, dating back to the sixth to fourth millennia BCE throughout the Nile Delta. The remains of Memphis, Karnak, and the Valley of the Kings, as well as the Giza Necropolis and its Great Sphinx, reflect this legacy and remain a key focus of scholarly and public attention. With a current installed capacity of around 145 MW, wind power in Egypt is in its infancy, accounting for less than 1% of total electricity demand (2750 MW in 2020). Egypt is committed to not only refining and strengthening the legislative and regulatory framework controlling wind power in Egypt, but also to providing the essential credible background information on the geographic diversity and volume of Egypt’s wind resource.
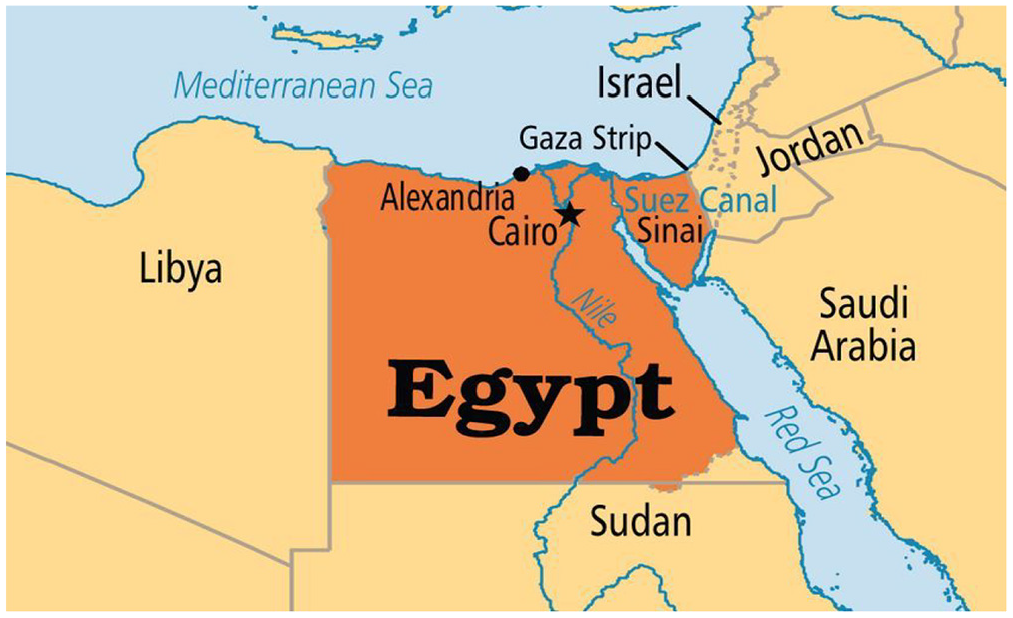
Egypt map.
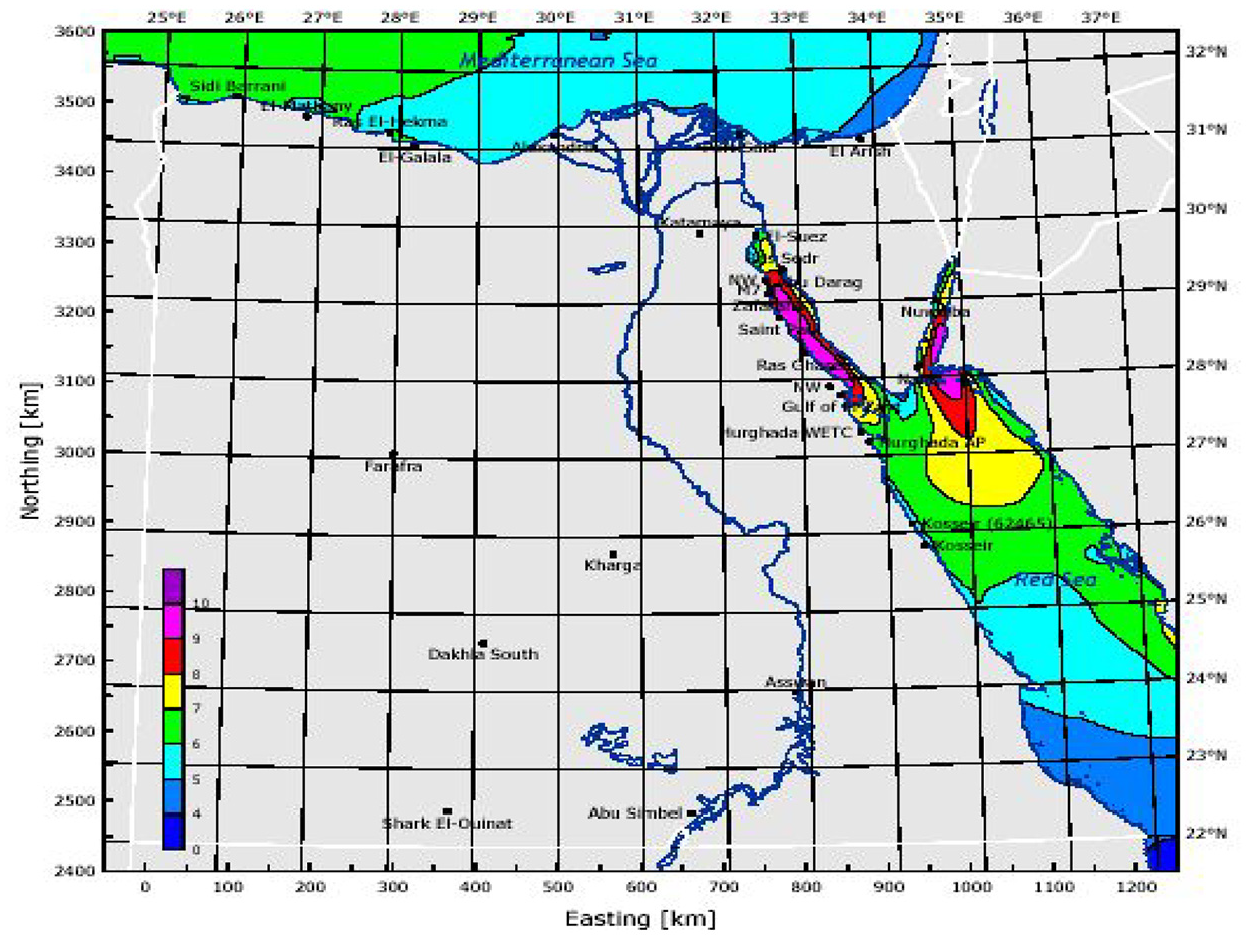
Egyptian weather atlas: mean wind speed 50 m Above ground level (Mortensen et al., 2006).
Many efforts have been made over the last years to fuse the wind energy through the establishment of wind turbines and farms at different locations in Egyptian regions. Motivated by the increase in the electricity tariffs charged to industrial customers and the regular cutbacks in electricity recently experienced in Egypt (Elsobki, 2017). Ahmed and Abouzeid (2001) evaluated the economic feasibility of building a isolated wind energy system by an industrial customer seeking to reduce their national grid dependency. To this end, the wind energy capacity at Cairo’s wind regime was chosen to be measured for complete 1-year duration (2009) using half an hour wind speed data. The wind speed distribution function Weibull parameters were calculated by using the maximum likelihood method. The calculation showed low wind capacity in Cairo. Despite the poor capital, the financial analysis has shown that the wind project will prove financially viable under certain parameters. Therefore, using stand-alone systems to exploit wind energy will help meet the needs of the electric power industries. On the South Sinai coastal areas, a practical approach to wind as a possible renewable source of energy generation is proposed by Shata et al. (Ahmed, 2018; Akdağ and Dinler, 2009). A detailed analysis of the wind characteristics was developed for the chosen sites around the Suez Gulf and the Gulf of Aqaba in the Northern Red Sea, comprising Ras Seder, Abu Redis, El Tor, and Nabq, providing correct estimation of the wind power at different heights of 10–50 m AGL. The wind-power density was also computed and the results revealed that the Ras Seder and Nabq are the absolute best, with annual wind energy of almost 314 and 249 kWh at 50 m, respectively. As a result, onshore wind energy capacity can be evaluated as regional power generation regions. The feasibility of installing 580 MW of onshore wind farms at the four sites, which would generate 2335 GWh of power per year, was evaluated. and the cost of electricity generation varies from 1.84 to 4.22 ¢/kWh. Ghitas et al. (2016) researched into the city of Helwan’s wind energy potential, Cairo based on 2 years wind speed measurements. The measurements were performed by weather station located above NRIAG’s at Helwan Town. The point of the study was to show that; this region’s wind capacity is appropriate for large-scale electric wind applications or can be acceptable for non-grid connected electrical and mechanical applications such as water pumping. Wind power capacity review is exhibited in various areas in Egypt (Abdelhady et al., 2015), on the Mediterranean Red Sea and Western deserts. In 17 places, a technological and financial assessment of power generation with eight different small wind turbines is being done to calculate annual electricity output. The data collected were interpreted and analyzed to calculate the net present value of the selected wind turbines and the payback period estimating the productivity. Especially the dependence of the feed-in tariff on the turbine productivity is examined. In addition, technical and economic evaluation of electricity generation using wind turbines has been carried out at one of Egypt’s most ambitious wind farms: Hurghada (Ahmed Shata and Hanitsch, 2008; Akinsanola et al., 2017; Ohunakin and Akinnawonu, 2012). Wind data collected for this site are used for more than 23 years. The WASP software is used to analyze the station’s wind speed values, as well as their seasonal values, which were compared to measured data. The distribution and behavior of the seasonal wind speed and its frequency at Hurghada were computed and defined using Weibull parameters and the power law coefficient (n). The monthly Plant Load Factor (PLF), which is used to calculate the expected annual energy output of a Wind Energy Conversion System (WECS), was also calculated. Ten different wind turbines of different power capacities with a rated wind speed have been studied. The greater the capacity factor values, the lower the same-height recorded speed for the WECS.
Environmental Impact Assessment (EIA) is a feature that helps decision-makers to evaluate potential environmental implications of proposed projects, compare various approaches, and plan and implement suitable preventive, management, and monitoring. The environmental impact of a wind energy power plant project in Gabal El Zeit, Egypt’s Suez Gulf, has been examined by Abou Shady et al. (2016); Nile and Arab (2018) focuses on the social and environmental assessment to define the suitability for wind power development within the greater East Wind-1 and East Wind subareas identified by NREA, considering technical, social or environmental constraints. Wind direction and strength, turbine power, noise, and vibration are all assessed in the context of the environment. Noise, electromagnetic interference, vibration, and bird migration are among the environmental impact indicators documented in the investigation.
Offshore wind turbines are utilized to take advantage of the high value of wind energy accessible at sea. An overview of Egypt’s Mediterranean Sea offshore wind energy potential is provided (Abdelhady et al., 2017). The techno-economic evaluation was performed in seven regions with an offshore wind turbine of 7.0 MW. According to the analysis, the smallest energy is produced in Alexandria while the maximum energy is produced in El Dabaa. The Levelized Electricity Cost of Energy (LCOE) is approximately 0.075–0.079 $/kWh, making it exceptionally competitive with comparable renewable energy systems in Egypt. The estimation of wind energy potential can be done by computer programs such as RETScreen and System Advisor Model (SAM) (Hermannsson, 2013). Wind speed and electrical production estimated by these programs are examined and compared to the measured data. In Gudmundsson (2013), the author identified the wind energy module of the SAM package renewable energy assessment system and their predictions as compared to calculated operational results. Data was taken from a wind farm in the United States including electricity production for a 5-year period and wind speed measurements that were compared to wind speeds, Annual Energy Production (AEP) of the models. AEP results in SAM are quite good compared to the wind farm data.
Paper objectives
According to the World Wind Atlas the Egypt region has adequate wind energy. Nevertheless, there is no work to evaluate the wind power of these four selected regions and there is no systematic study of its capacity. Therefore, we demonstrate the first estimates of wind power accessible from several coastal meteorological stations in four different regions of Egypt, where all of the wind data used in this work is first presented and addressed through the following purposes:
Display and measure the characteristics of wind at four locations in Egypt
Average energy estimated and Wind power densities at 50 m
Considerations of selection of appropriate wind energy system locations.
Evaluate the technical and financial sustainability of developing different sizes of wind turbines.
Demonstrate bird’s impact on wind turbine output (EIA)
This paper is subdivided into four sections. Section 2 explains the sites chosen and the data that used for this research while Section 3 identifies criteria for the selection of the correct location for the wind energy system. Section 4 deals with the approach used and methodology. Results of the study were comprehensively carried out; the findings and comments are summarized in Section 5.
Wind site selection
The key to any renewable-energy project’s financial and technical success is selecting the best location. The site selection is the most significant decision in the creation of a wind energy system, especially in wind energy systems. Good wind resources sites could even be competitive with conventional energy resources (Abdeslame et al., 2017). Wind energy site selection mainly focus on the places that has abundant wind resource, stable wind direction, concentrated wind distribution and little destructive wind speed. However, the good natural resources in most cases will be affected by many external factors such as the geography, the traffic, the mineral resources, the meteorological disaster, the power grid access and so on. Therefore, the success in selecting the suitable location for building wind power stations depends on the following two factors (Wang et al., 2018):
Environmental: Wind speed, land use, electro-magnetic signals, and bird migration.
Economic: distance to city, distance to power lines, and distance to transportation network.
Wind energy has numerous benefits, which is why it is one of the most rapidly expanding energy sources. However, there are also challenges and disadvantages that hinder the implementation of wind turbines. The most challenge for establishing the wind turbines is that the blade turbines may kill migratory birds especially at high height less than 30 m (Rydell et al., 2012). Moreover, Birds fly about 700 m around the turbines, effectively reducing the area available for the birds to migrate by up to 14% (Miao et al., 2019). To reduce the chance of a bird colliding with a wind turbine, the following characteristics are taken into account (Miao et al., 2019):
Establishing the wind turbines at low hub height approximately 10 m or more than 40 m.
Avoid putting up wind turbines in places where migratory birds congregate. Rivers, ridgelines, and coasts are all good places to look. The level of exposure to turbine collision risk is also influenced by how birds use the terrain.
Use ultrasonic that can be connected to turbines and emit constant, high frequency sounds of 20–100 kHz. This could reduce accidents by preventing bats from getting closer to sound sources.
The prospect of painting purple wind turbines could mitigate deaths of birds and bats. Even if violet paint is not practical, another research line is investigating the use of ultraviolet light to prevent turbine birds and bats (NWCC, 2010).
Getting the turbines taller (the taller tower and the shorter blades reduce bird impact).
Wind resource data
The first stage in determining the initial viability of generating electricity from wind power through a wind farm in a specific region is to describe the wind in terms of speed, direction, and power. The Egyptian wind atlas was extended to cover Egypt as a whole in 2005 by the NREA, the Egyptian Meteorological Authority (EMA), with the purpose of establishing a country-wide assessment of wind energy resources on a meteorological basis. Wind atlas of Egypt is presented in Figure 2 (Mortensen et al., 2006). The atlas shows how wind energy could be used to generate electricity in Egypt. The Atlas’ goal is to have accurate and reliable wind atlas databases in order to assess the potential wind power output produced by wind turbine installations in Egypt, particularly in regions where wind resources are known to be abundant, such as the North West Coast, North East Coast, Gulf of Aqaba, Gulf of Suez, Red Sea Coast, and Western Desert. However, the atlas shows that Egypt has medium averages wind speed ranges from 5 to 6 m/s. However, no pervious study was conducted to investigate the capacity of wind resources in these regions in Egypt to determine the characteristics of the wind and its generation of electricity. In this research, we are trying to study wind energy potential in the whole of Egypt by examining wind energy resources in four different locations most suitable for wind power applications. The four locations that investigated in this study are: Hurgada, Aswan, Alexandria and the capital of Egypt (Cairo). In addition to the Meteorological Authority in Cairo, hourly wind speed data of different wind speeds were collected from the Egyptian New Renewable Energy Authority (NREA) for carrying out this study. These data estimated from the years 2017–2019. Figure 3 displays the geographic location and regional co-ordinates of the selected four locations. Table 1 indicates the wind shear, and the anemometer height used to measure wind data is set at 10 m above ground level. The records of the four selected sites range 3 years (2017–2019) of average monthly wind speed, direction and shear.
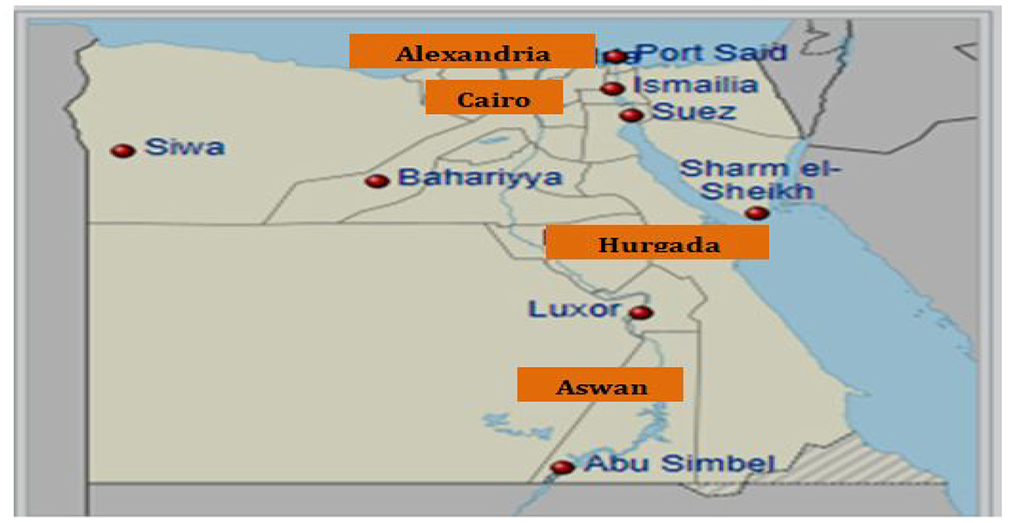
Geographical locations for Egyptian regions: Hurgada, Aswan, Alexandria, and the capital region (Cairo).
Wind parameters and geographic data for the four selected regions.
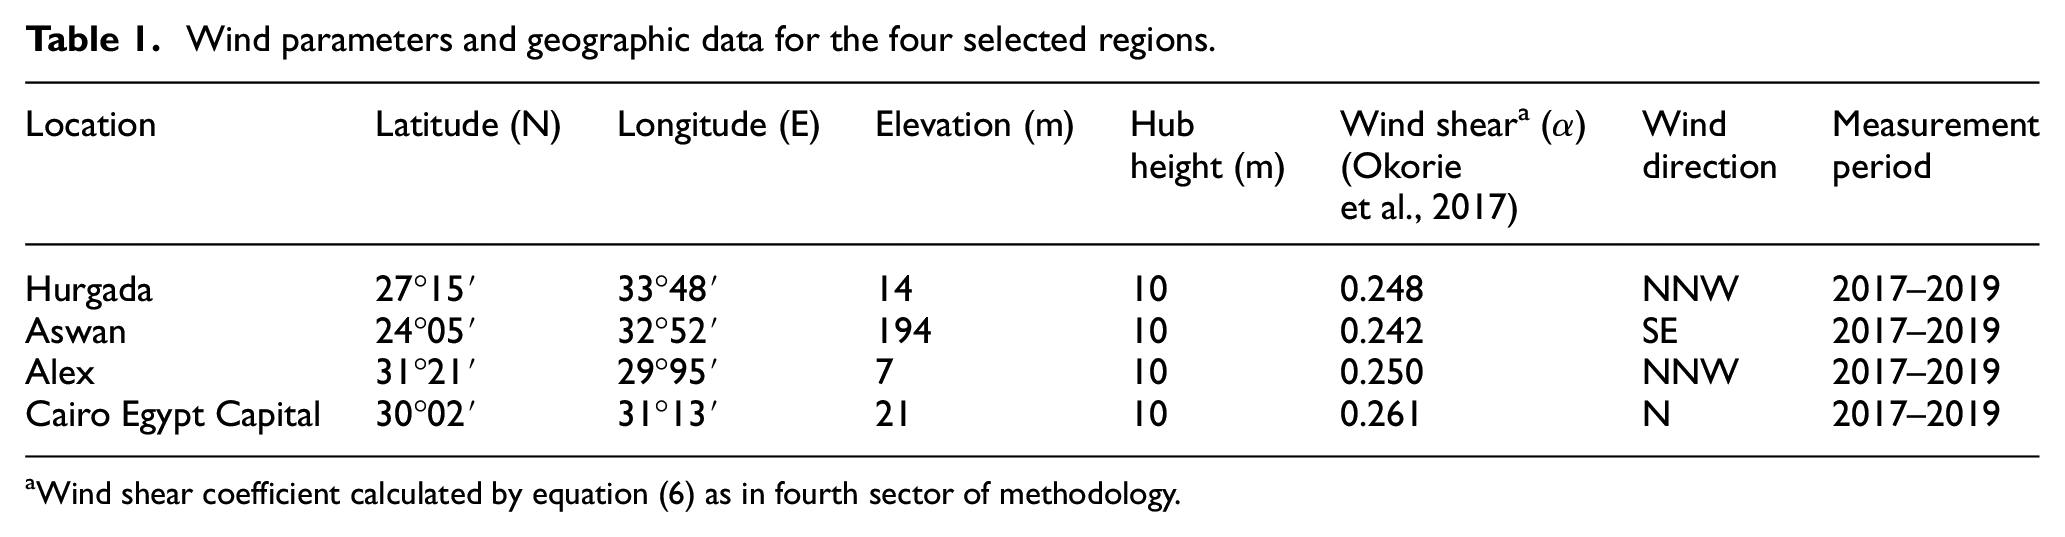
Wind shear coefficient calculated by equation (6) as in fourth sector of methodology.
Methodology and mathematical modeling
There are several statistical techniques available for characterizing and analyzing wind speeds and their frequencies for predicting wind turbines output energy. The Weibull distribution is the most used model for statistical study of wind speed distributions. It describes the wind speed probability distribution. The Weibull distribution is a probability distribution that is continuous. According to many academics, the Weibull model is the most appropriate methodology to apply because it provides a good relationship to experimental data (Alavi et al., 2016; Boudia and Guerri, 2015; Francis and Nalamutt, 2019). As a result, the probability distribution function of the Weibull model is the most relevant statistic to extract from a set of wind speed data for use in evaluating wind energy resources.
The cumulative function of Weibull distribution is expressed as following equation:

F(v) is the cumulative wind speed (v) distribution function, k is the Weibull shape parameter and c is the scale parameter (m/s). Furthermore, one of the most important characteristics of the Weibull function that makes it more useful for wind power projects is that once these parameters are measured at one height, they may be modified to multiple heights. Based on this, if the values c10 and k10 are defined as 10 m above ground level at the standard elevation; parameters of Weibull distribution ch and kh for any height (h) can be estimated as follows (Akdağ and Dinler, 2009):


Since n is the power law coefficient. As a result, the first stage in estimating the investment in wind power facilities is to calculate wind speed. In this study, the power law expression is used as following in equation (4) (Jung et al., 2013):

V 10: wind speed at 10 m height; and shear coefficient values of wind (α) are calculated by equation of Hellmann’s (Pinilla et al., 2009):

The following step to determine any location’s wind capacity is to measure the wind density as it indicates the amount of power available at the chosen area to convert wind to electricity. Also, wind power density can be calculated in equation (7) (Diaf and Notton, 2013):

Since, Ú = 1.225 kg/m3 at 1 atm pressure and 15°C temperature. The relation of air density estimated (Alnaser and Al-Karaghouli, 2000) in equation (8).

The standard temperature is 20°C and Pressure is 101,300 N/m2. Hence, the modified wind power density can be expressed using the following formula (Ahmed, 2018):

To correct equation (9) of wind power density; energy pattern factor (KEm) by adding a correction factor Vm is used. The energy pattern factor was defined in many researches (Mohammadi and Mostafaeipour, 2013; Ramachandra et al., 1997) as the ratio of total available wind energy to average wind speed, and it was defined as follows:

When corrected power is available, the equation below can be used to calculate a more appropriate wind power density at a standard height of 10 m above ground level.

Then, at any acceptable height (h) in meters, the wind power density at level h, monthly wind power density, and energy density per month are represented by equations (12)–(14), respectively.


Results and discussion
Wind data analysis
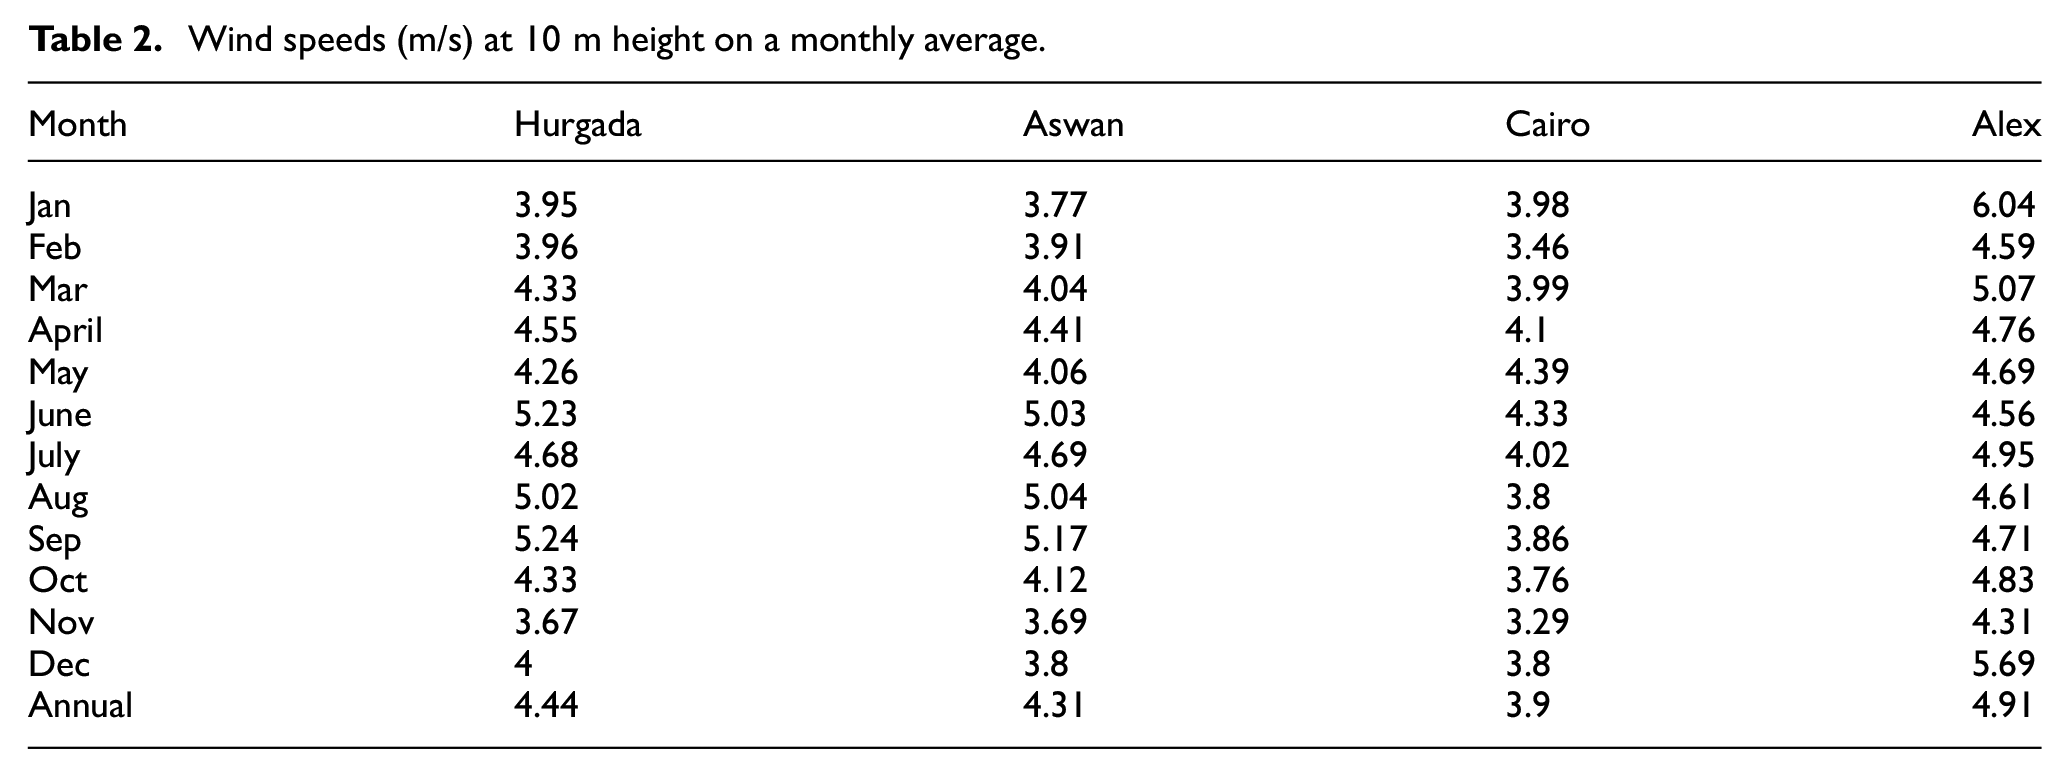
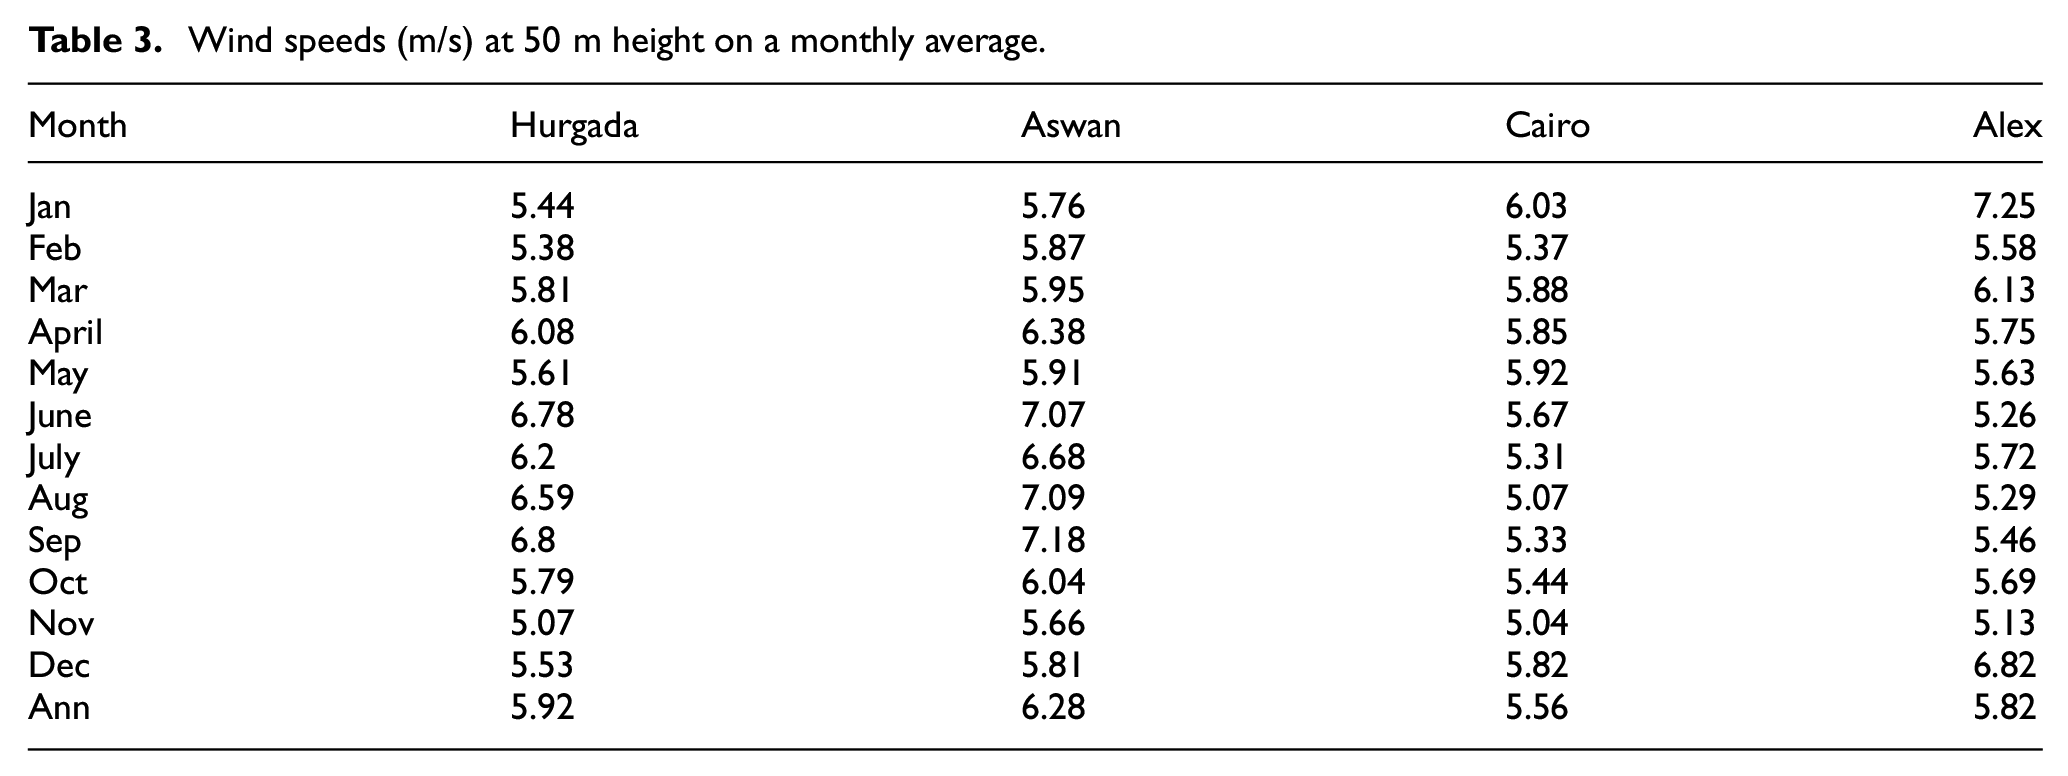
Long-term wind speed values are obtained at a hub height of 10 m from NASA (from 2017 to 2019) of all the selected sites. Then the mean monthly wind speeds are calculated in this analysis. Tables 2 and 3 shows the average monthly and annual wind speed of the four selected sites at 10 and 50 m. From Table 2, it is clear that Alexandria location has the highest average wind speed of 4.91 m/s at 10 m and Aswan at 50 m from Table 3. The frequency percentages of wind speeds for all four selected sites at 10 m (Figure 4(a)) and 50 m (Figure 4(b)) heights are illustrated in Figure 4.
Wind speeds (m/s) at 10 m height on a monthly average.
Wind speeds (m/s) at 50 m height on a monthly average.
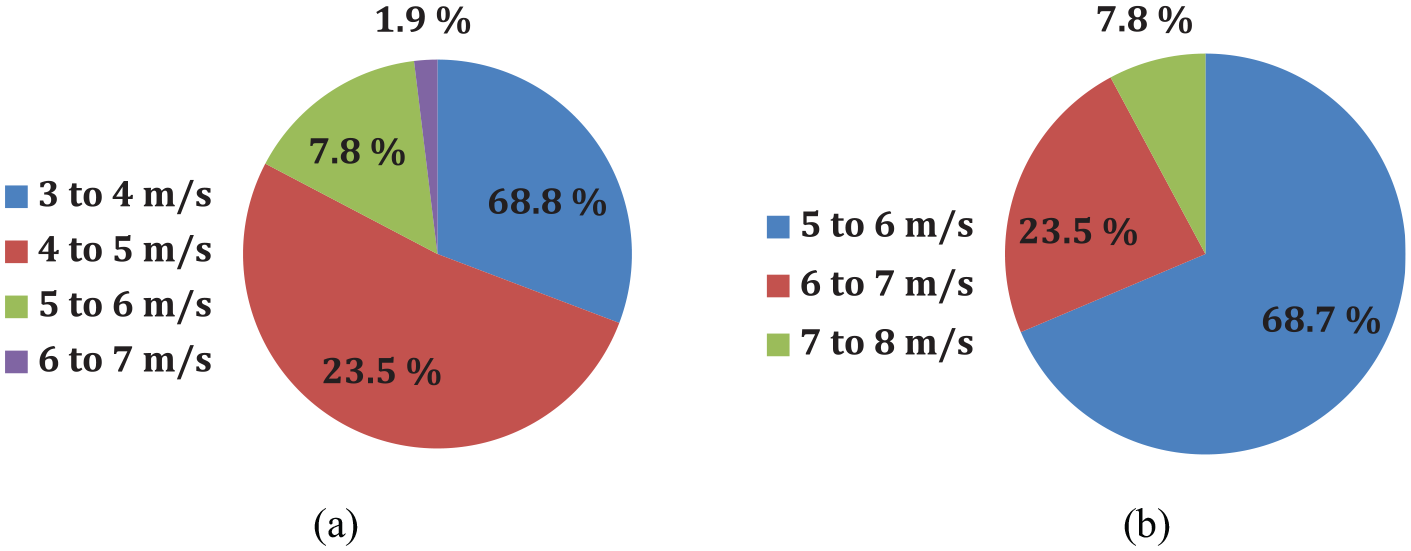
Frequency percentages of wind speeds (m/s) at 10 m and 50 m heights: (a) at 10 m height and (b) at 50 m height.
Wind speed assessment and seasonal variation
Figure 5 illustrates variations in wind speeds at 10 m hub height each month. Understanding the features of seasonal wind speeds at any stage is a critical problem for designers and users who want to better understand the planning of wind turbine installations for power generation. For the four locations, Figure 6(a) and (b) illustrates the power of seasonally variable wind speeds at 10 and 50 m height, respectively. This can be useful in understanding the properties of seasonal wind speeds at any given time.
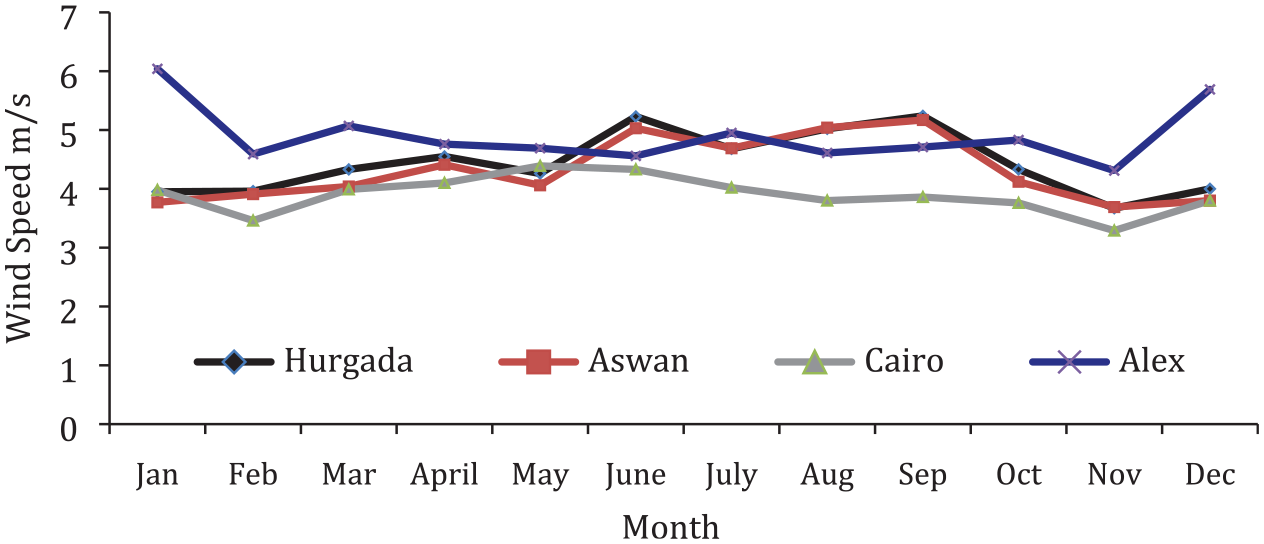
Monthly variability of mean wind speeds at 10 m hub Height along the year.
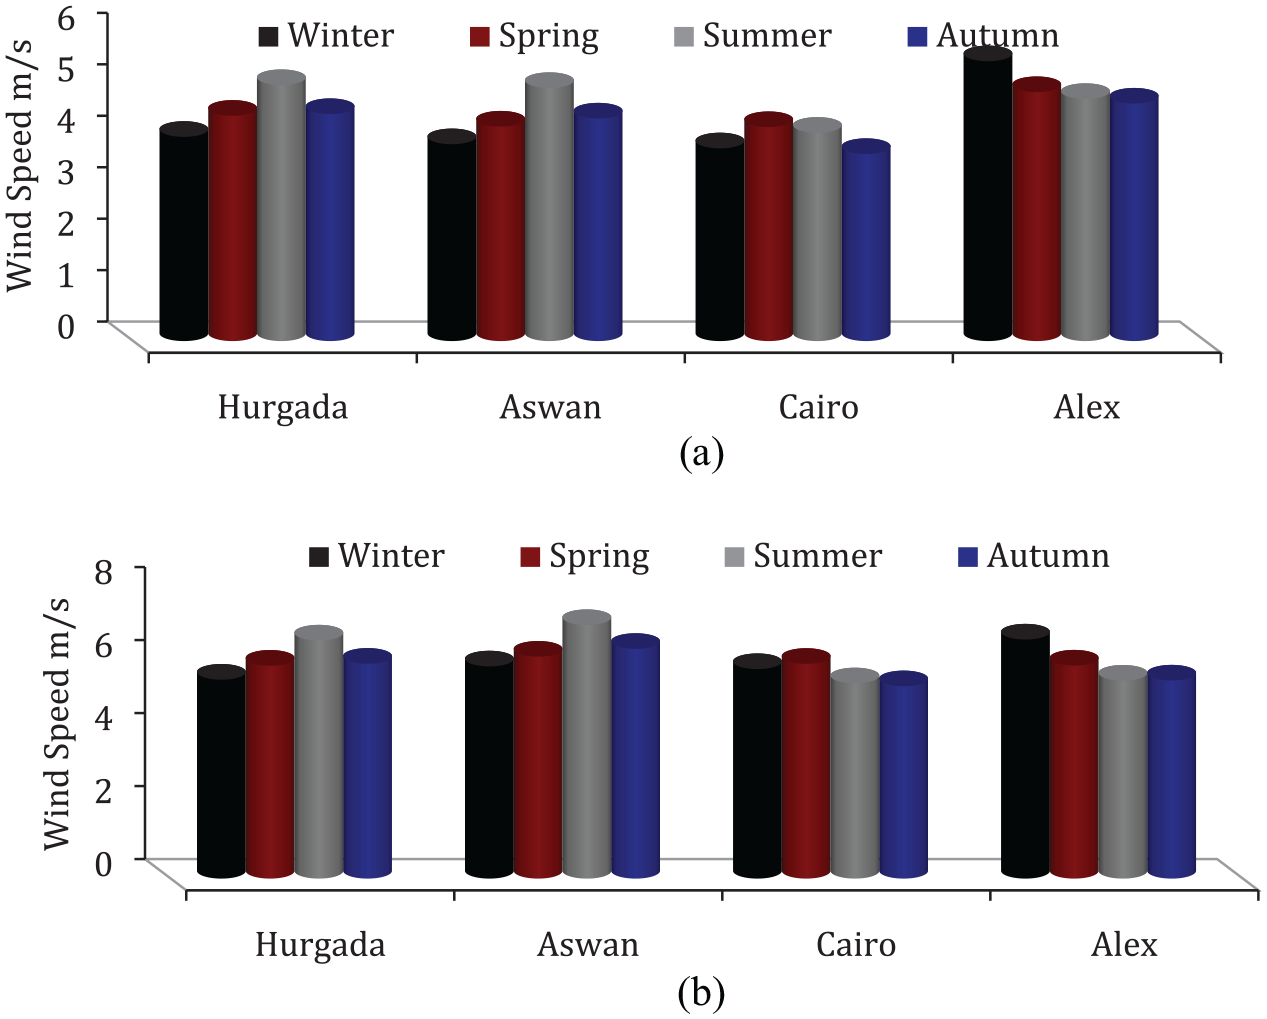
Seasonal variability of wind speeds for four locations at 10 and 50 m heights: (a) at 10 m height and (b) at 50 m height.
Figure 5 indicates some important notes as following:
The greatest average wind speed in this study of the Egypt area was around 6.04 m/s in January at Alexandria, while the minimum average wind speed was around 3.29 m/s in November at Cairo. The monthly wind speed values for all sites are generally high from February to August, with average monthly values varying from 3.96 to 5.04 m/s. In addition, Alexandria experiences monthly wind speeds of more than 4.5 m/s at 10 m at 9 months of the year.
On an annual level, Alexandria has the greatest annual mean wind speeds at 10 m with 4.91 m/s, followed by Hurgada with 4.44 m/s. At a height of 10 meters, the minimum annual mean wind speed at the Cairo site is 3.9 m/s. Otherwise, although this location topography across the coastal view (Table 1). This due to this site has −133 m elevation above sea level. Moreover by increase the hub height more energy can be captured at this site.
It is clear from Figure 6 some following points:
The greatest values for each site vary according to the four seasons of the year. Strong winds (3.97–4.97 m/s at a height of 10 m) have been reported for all meteorological stations during the summer season, with the exception of Alexandria, where it occurs in the winter season at 5.44 m/s.
In the other words, because of the seasonal trend in the midsummer sea breeze, the peak of high winds is. In comparison, the four winter season sites have the lowest peak values in the 3.74–3.97 m/s range.
These three places have the same seasonal value pattern and identifiable peaks; their seasonal fluctuations are normally strong in the spring season, with a little reduction in wind speeds in the summer months, and an autumn minimum wind speed of 3.74 m/s in the early winter months.
At 50 m height; in the four seasons of the year the highest values change for each location. But they are characterized by strong winds (5.45.6.29 m/s) recorded for all the meteorological stations during the summer season except the Alexandria location where it occurs in the winter season with 6.55 m/s.
Wind direction
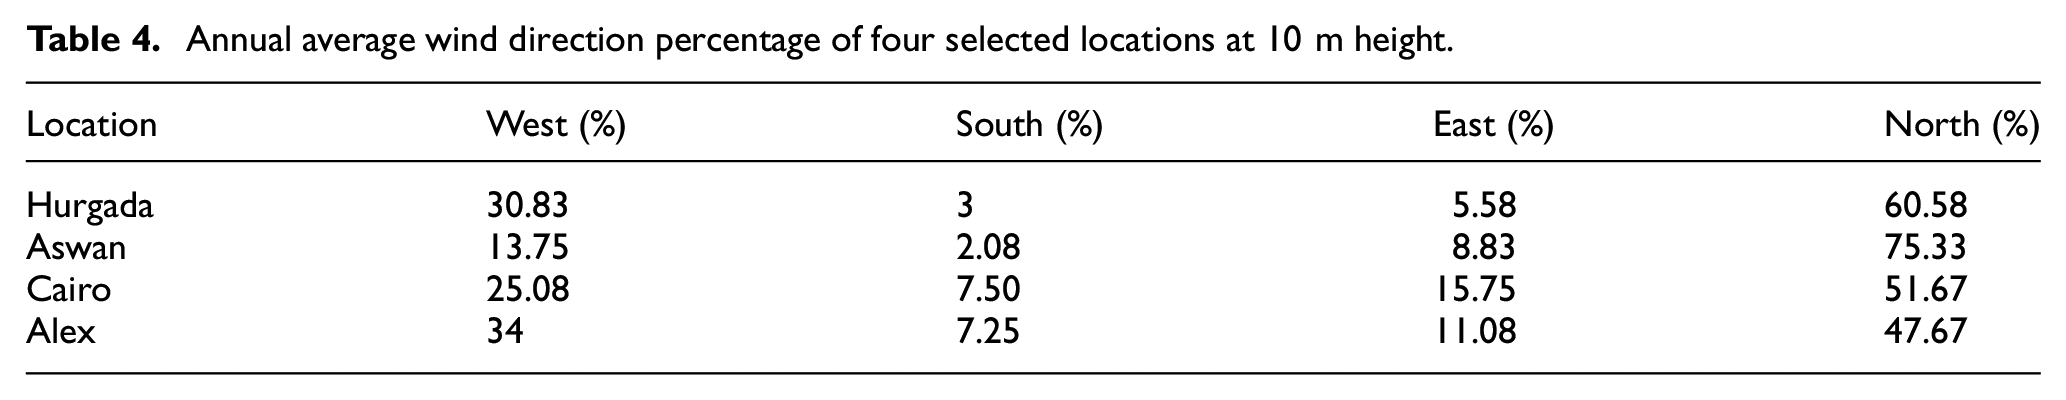
For choosing wind power sites, wind direction is crucial factor. The wind direction is consequently critical for estimating the use of wind power and for efficiently situating the wind farm in a given area. Table 4 and Figure 7 show the annual average wind direction percentage of the four selected locations at 10 m height (2017–2019).
Annual average wind direction percentage of four selected locations at 10 m height.
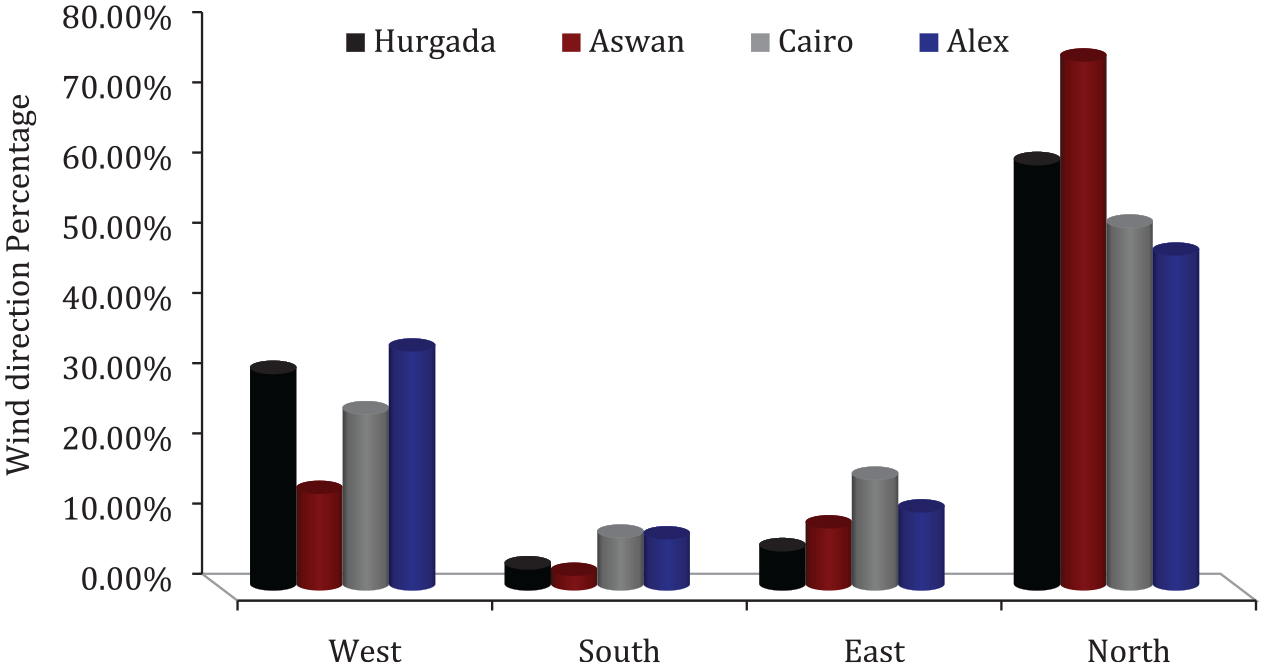
Annual average wind direction percentage of four selected locations at 10 m height.
As seen in Table 4 and Figure 7; Aswan location has the highest annual average wind percentage in north direction (75.33%), Alexandria in west direction (34%) and Cairo in south & east directions. Similarly, the least annual average wind percentage in west & south directions is Aswan location. This means that the wind capacity at Aswan will be steady throughout the year and has great consistency, as long-term winds are adequate. The percentage of hours where the mean wind direction is from one of the four cardinal directions, omitting hours when the mean wind speed is less than 1.0 mph. The percentage of hours spent in the implied intermediate directions is represented by the pale shaded patches at the boundaries (northeast, southeast, southwest, and northwest).
Weibull parameters and wind power density analysis
The best way for determining the feasibility of a wind energy resource at any site is to use wind speed data to calculate the density of wind power. Other methods include employing wind speed distribution functions such as the Weibull distribution, Rayleigh distribution, chi-squared distribution, normal generalized log distribution, and so on to determine the density of wind power (Ouahabi et al., 2017). Weibull’s function, according to researches (Moshfegh, 2011; Saleh et al., 2012; Sohoni et al., 2016), correlates more precisely to the distribution of wind likelihood than other functions. The Weibull and Rayleigh distributions are utilized to match the time series data in this research. Because wind speed varies in a predictable manner, the frequency distribution of wind speed may be estimated using time series data. It’s difficult to find the exact probability density function that represents the wind speed data distribution. The scale parameter c (m/s) and the shape parameter k define the Weibull distribution, which can be measured using a variety of methods including the graphical method (GM), moments method (MOM), standard deviation method (STDM), maximum likelihood method (MLM), Power density method (PDM), Modified maximum likelihood method (MMLM), and Equivalent energy method (EEM) (Kang et al., 2018). MOM is the most powerful approach for calculating the value of k and c at any height in order to meet the Weibull distribution curves, according to Azad et al. (2014). If the average wind speed and variance are known ahead of time, the values of k and c can be calculated as follows (Parajuli, 2016):


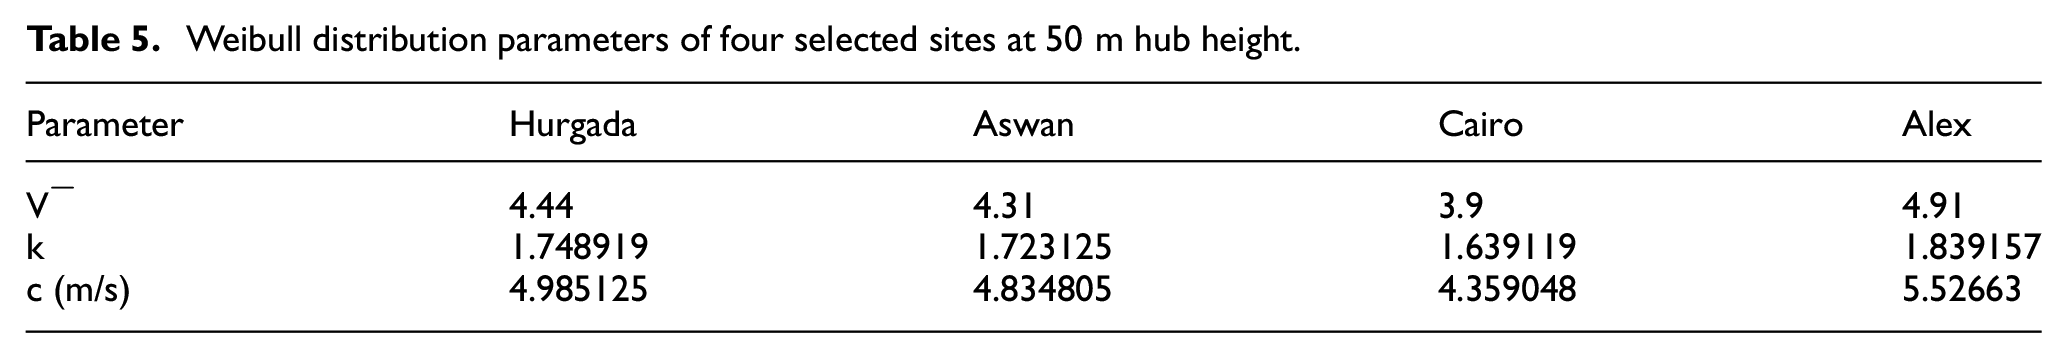
Where V¯: mean wind speed, г: gamma function. Tables 5 and 6 shows the distribution parameters of the hourly wind speed at 10 m (Table 5), 50 m AGL (Table 6).
Weibull distribution parameters of four selected sites at 50 m hub height.
Weibull distribution parameters of four selected sites at 50 m hub height.
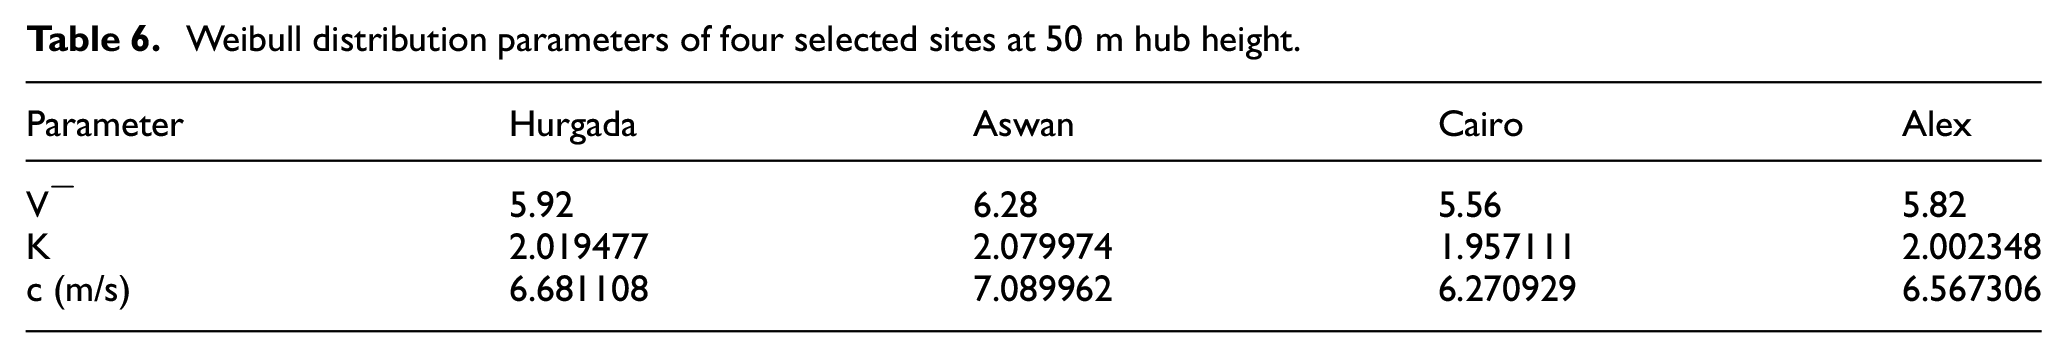
From Tables 5 and 6, it is found that the Weibull parameters at 10 m are maximum at Alexandria location since is highest value of shape parameter of 1.83 and 5.52 m/s of scale parameter while 2.0 of shape parameter and 6.56 m/s of scale parameter at 50 m height AGL.
Wind power density is a measurement of a location’s wind resource efficiency that may be calculated using a variety of methods. The wind power (Pw) flowing at (v) via a blade swept area (A = 1) grows as the cube of its speed, as shown in equation (7), and the Weibull corrective power density (PWi) is shown in equation (18), while the error percentage is given by equation (19) (Kang et al., 2018). Energy pattern factor and energy available per month as stated before in equations (10) & (14) also calculated here. The results of energy and power density of each location by Weibull are presented in Table 7. Also energy and power at 50 m height were estimated in Table 7 using equations (13), (14) of methodology sector.


Wind power and energy density of four locations at 10, 50 m height.
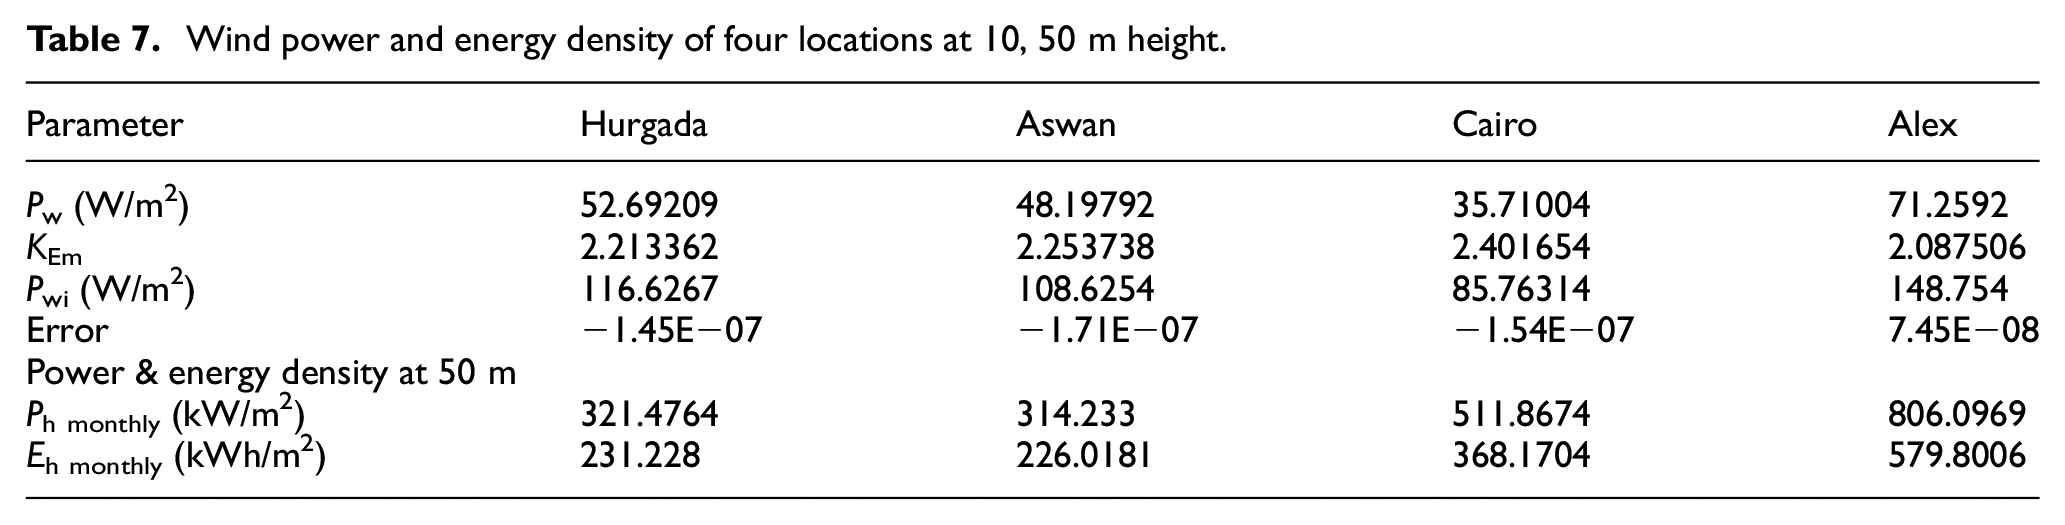
Table 7 shows that the best location for wind assessment to build wind turbines is Alexandria, which has the highest wind power density (148 W/m2) at 10 m height, whereas Cairo has the lowest wind power density (85 W/m2). At 50 m, Alexandria also location has the maximum value of wind power and energy density producing per month (806 kW/m2, 579 kWh/m2, respectively) following Cairo location then Hurgada. This is due to wind shear coefficient that is used in calculations of power and energy density for four selected locations. So, it is recommended to install wind farm in Alexandria, Cairo, and Hurgada locations.
Electric cost and of wind turbines power simulation using SAM package
To maximize their effectiveness, wind turbines must be positioned in very windy areas, as a minor increase in wind speed results in a big increase in power output. The capacity to generate electricity at minimal operating costs is critical to the feasibility and long-term sustainability of wind generating plants. The SAM software tool was used to determine the estimated annual production energy from wind farms at all sites in this investigation. The Program Advisor Model (SAM) is a free techno-economic software model that facilitates decision-making in the renewable energy industry (Blair et al., 2018). The current investigation study shows that the three types wind turbines of different rated power (from 3 to 12.5 kW) and minimum cut-in wind speed to match with site topography are simulated in four selected locations and taking into consideration reference of wind speed data at 10 m and 50 m. The inflation rate used in this study is 3% and wind farm losses are assumed to 2%. The specifications of these wind turbines are presented in Table 8.
Specifications of different wind turbines power used.

Figure 8(a) and (b) depict the annual energy output of each selected wind turbine at the four positions of 10 and 50 m, respectively, whereas Figure 9(a) and (b) depict the levelized cost of energy of each selected wind turbine at the four locations of 10 and 50 m, respectively. Figure 10 show the capacity factor of each selected wind turbine at the four sites of 10 and 50 m (a, b).
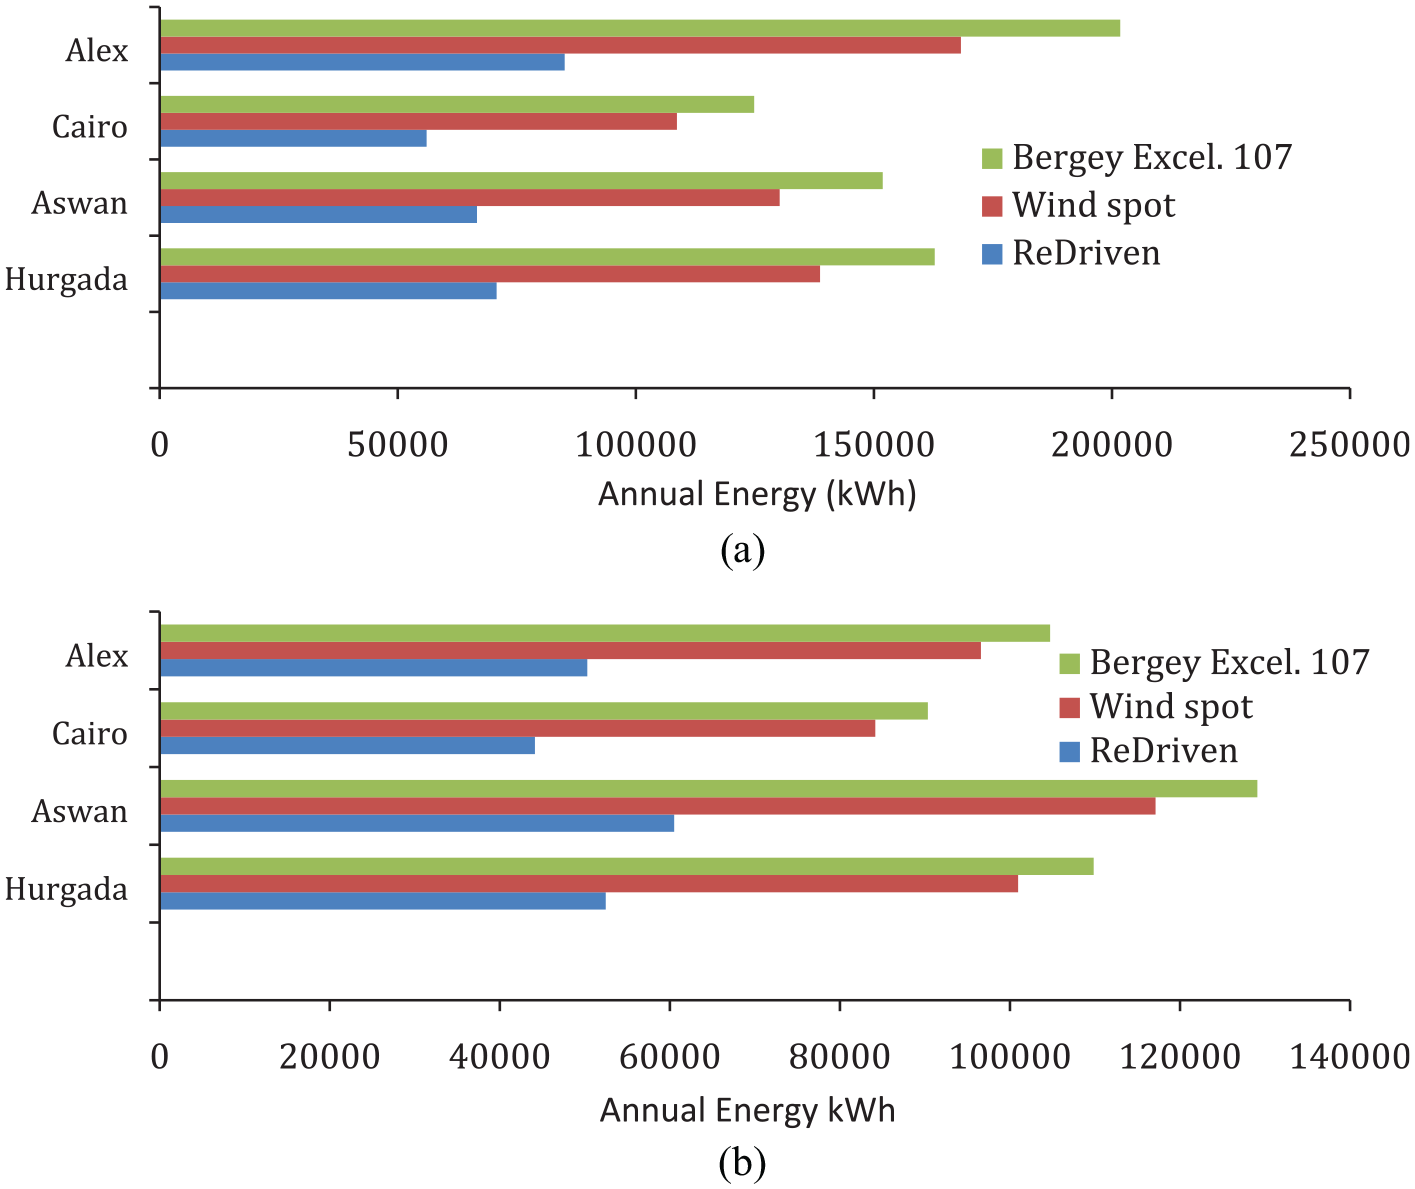
Annual energy output of three selected wind turbines of four locations in Egypt: (a) at 10 m height and (b) at 50 m height.
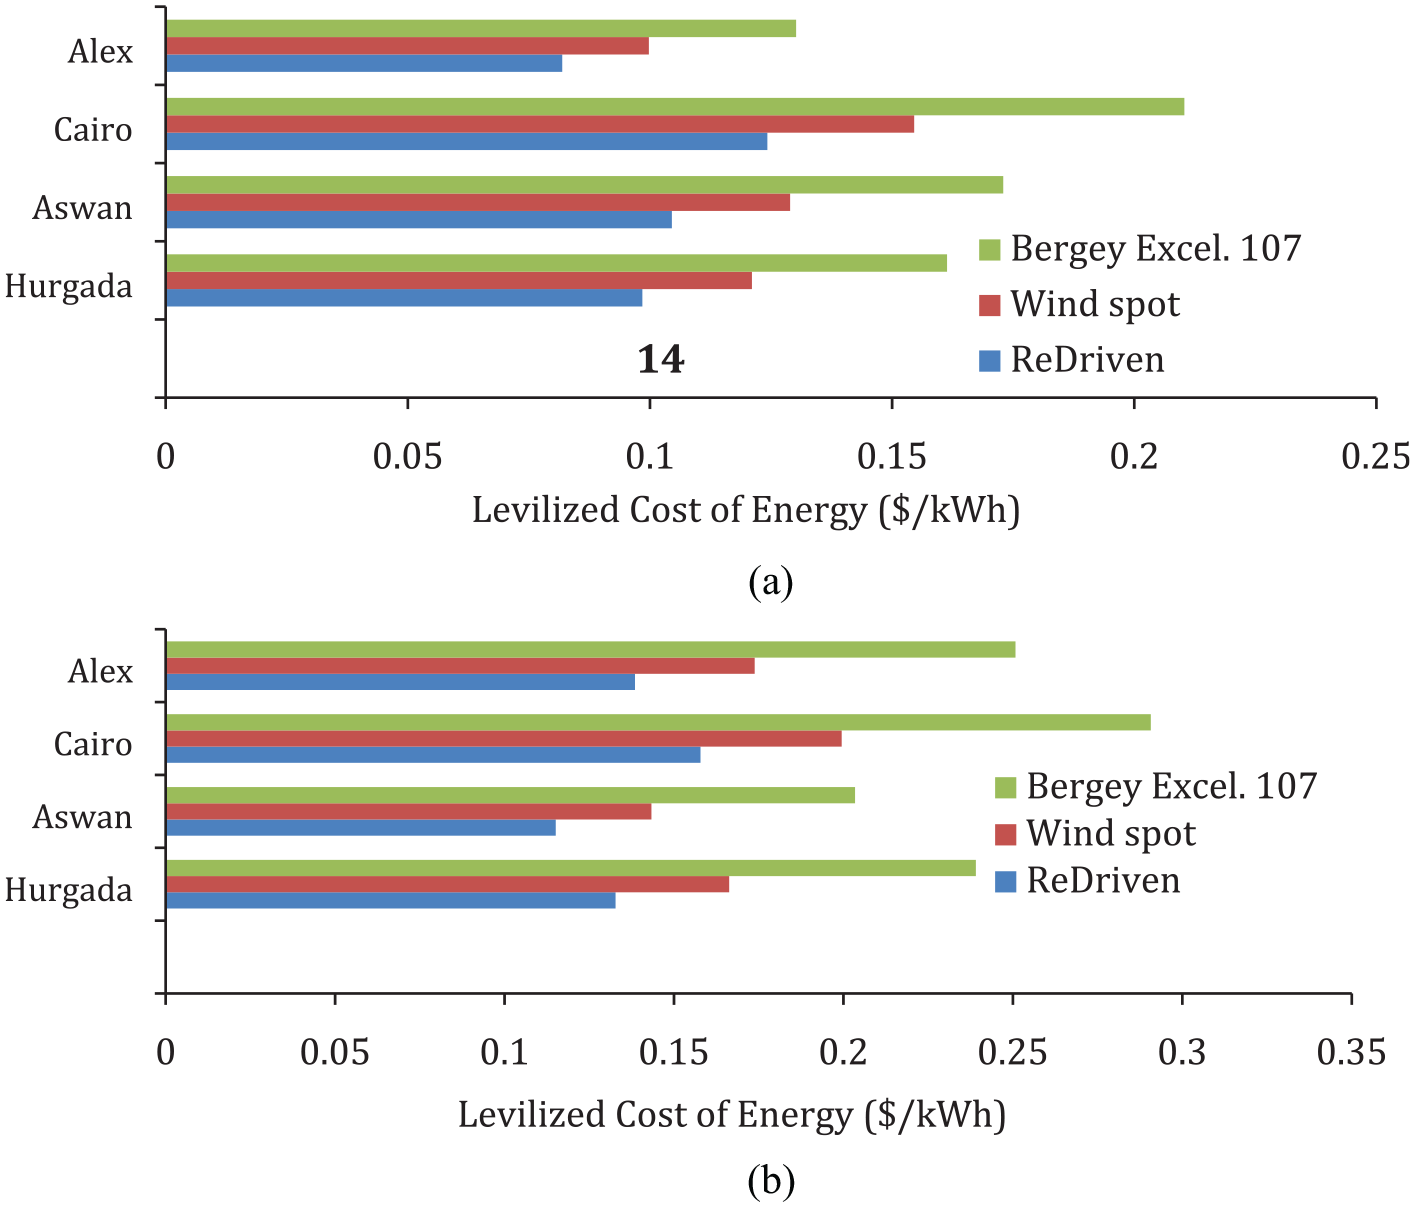
Levelized cost of energy of three selected wind turbines of four locations in Egypt: (a) at 10 m height and (b) at 50 m height.
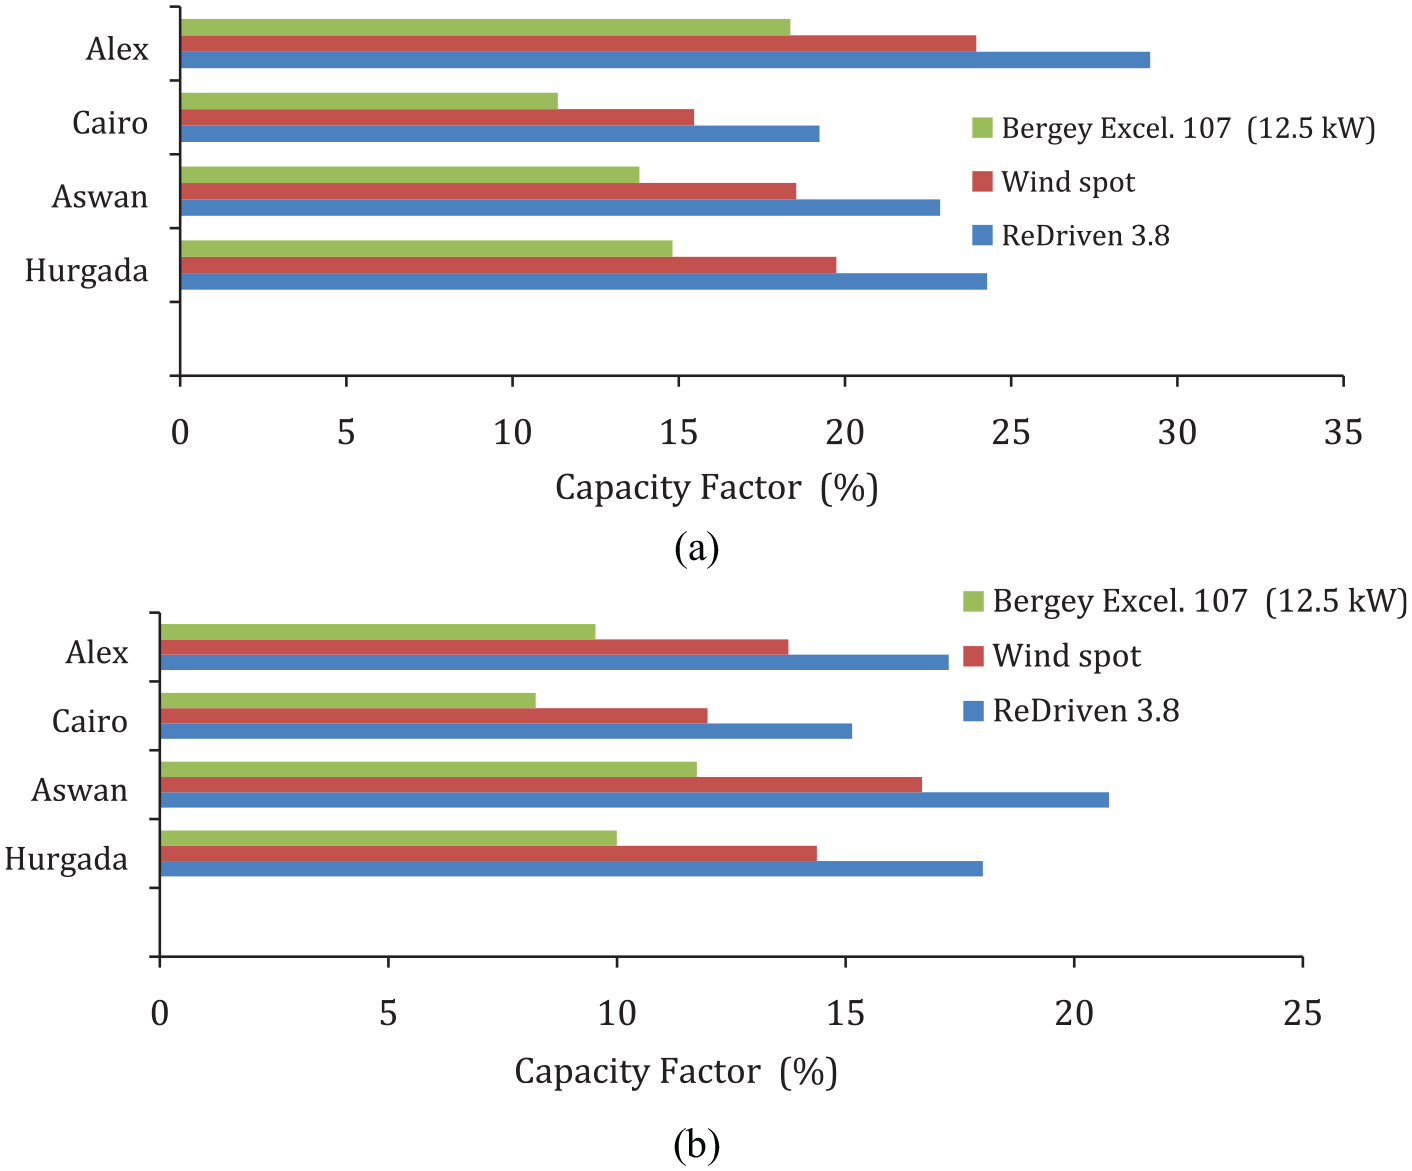
Capacity factor of three selected wind turbines of four locations in Egypt: (a) at 10 m height and (b) at 50 m height.
From Figure 8(a), it is clear that the Alexandria location has the highest annual energy results with all different selected wind turbines at 10 m height. Also, the most fit wind turbine which gives maximum annual energy in all sites is Bergey Excel 107 (12.5 kW). Therefore, the maximum annual energy (20,1729 kWh) occurs at Alexandria location with Bergey Excel 107 wind turbine at 10 m height. While Aswan location has the highest annual energy results (12,9091 kWh) with all different selected wind turbines at 50 m height. Similarly, from Figure 9: it is clear that the Alexandria location has the lowest levelized cost of energy results at 10 m height and Aswan at 50 m height with all different wind turbines of different power. Also, the most fit wind turbine which gives minimum levelized cost of energy in all locations is ReDriven3.8 (3.32 kW). Therefore, the minimum levelized cost of energy (0.081 $/kWh) occurs at Alexandria location with ReDriven3.8 wind turbine at 10 m height. Also from Figure 10, the highest location that gives highest capacity factor values is Alexandria at 10 m height and Aswan at 50 m height. The maximum capacity factor (29%) occurs at Alexandria location of ReDriven3.8 wind turbine at 10 m height.
So, from Figures 8 to 10; the optimum location for wind assessment in Egypt region is Alexandria at 10 m height and Aswan at 50 m height which gives maximum wind speed, maximum annual energy, minimum levelized cost of energy and highest capacity factor. It is recommended to use Bergey Excel 107 (12.5 kW) and ReDriven3.8 (3.32 kW) wind turbines to realize this study of wind assessment. In this study the lowest energy cost is 0.081 $/kWh at 10 m height, while the output price of each kilowatt hour declared in July 2019 by the Egyptian Ministry of Electricity is 0.10 US dollar (Shaker, 2019).
Conclusions
Each month, the features of the wind speed and an accurate estimate of the wind potential and season were analyzed for the four selected locations at different heights between 10 m and 50 m above ground level (AGL) for 3 years from 2017 in Egypt region: Hurgada, Aswan, Alexandria and the capital of Egypt (Cairo). The average annual wind speed is reported to be 4.44, 4.31, 4.91, and 3.9 m/s at 10 m height, respectively. In addition, a criterion of wind farm site selection is presented here with Environmental Impact Assessment (EIA) study through Birds Migration aspect. The results show the following points:
Alexandria has the highest wind speed at 10.91 m/s, while Cairo has the lowest wind speed at 3.9 m/s.
At a height of 10 m, Alexandria has the highest wind power density (148 W/m2), while Cairo has the lowest wind power density (85 W/m2).
At 50 m, Alexandria location has the maximum value of wind power and energy density producing per month (806 kW/m2, 579 kWh/m2, respectively) following Cairo location then Hurgada.
It is recommended to install wind farm in Alexandria, Hurgada Locations.
For Birds Migration, it is decreases with increase turbine tower length and short blade length.
The maximum annual energy occurs at Alexandria location at 10 m and Aswan at 50 m with Bergey Excel 107 wind turbine.
The minimum levelized cost of energy (0.081 $/kWh) occurs at Alexandria location at 10 m and Aswan at 50 m (0.11 $/kWh) with ReDriven3.8 wind turbine.
The optimum location for wind assessment in Egypt region is Alexandria at 10 m and Aswan at 50 m which gives maximum wind speed, maximum annual energy, minimum levelized cost of energy, and highest capacity factor.
Footnotes
Appendix
Declaration of conflicting interests
The author(s) declared no potential conflicts of interest with respect to the research, authorship, and/or publication of this article.
Funding
The author(s) received no financial support for the research, authorship, and/or publication of this article.