
Abstract
An analysis of the behavior of the wind speed using the regional climate model PRECIS in high resolution scenarios of climate change RCPs is presented. The projections indicate that throughout the century, the speed of the surface wind will continue to increase to a greater or lesser extent (depending on the scenario) in most of the national territory, mainly towards the coast north, as an intensification and westward shift of the anticyclone North Atlantic could occur. The most important thing about this increase is that allows to consolidate the current projection of the Cuban wind program, in which the construction of 13 wind farms is proposed, precisely where the wind potential of Cuba will be increased. Finally this increase is added to the wind speed outputs of the Numerical Wind Atlas of Cuba to estimate the values of wind speed over the future periods.
Keywords
Introduction
Global warming is likely to cause catastrophic climate change, especially for the most vulnerable populations, which include small island states and island nations such as Cuba (Howes et al., 2018; Stenntt-Brown et al. 2019; Tejeda et al. 2021) Exploring the impact of climate change on wind energy is also a focus of scientific research and analysis in many countries around the world. The exact location of the wind resource is crucial in the development of wind farm projects. It is also common practice to estimate the wind resource for the next decades from the use of regional climate models fed with reanalysis data from the last years, where it is possible that the wind climatology changes under the future climate. Previous studies have shown that during the last 3 decades of measurements in the planetary boundary layer and in the surface layer of the atmosphere, the wind has changed throughout the world (Kjellström et al., 2011). show that wind speed, and in particular, its seasonality, can change. But their results for average wind speed only provide a view of the climate trend for wind potential and do not allow quantification of the magnitude of change. The effects of climate change on the wind energy sector have not been sufficiently well investigated so far.
The IPCC (Intergovernmental Panel on Climate Change) defines emission scenarios as the plausible representation of the future evolution of emissions of substances that could be radiatively active (greenhouse gases and aerosols), based on a coherent set of assumptions about the factors that drive them and the main relationships between them. The concentration pathways, obtained from the emission scenarios, are entered into a climate model to obtain climate projections. A set of emission scenarios used for the climate projections published in IPCC (1996) was presented at IPCC (1992). That set of scenarios is called IS92. In the IPCC Special Report on Emission Scenarios IPCC (2000) the new Special Report on Emission Scenarios (SRES scenarios) were published. These emission scenarios were developed by IPCC (2000) and used in the IPCC (2001, 2007) reports. Subsequently, IPCC (2013) published the new emission scenarios for climate change “Representative Concentration Pathways (RCPs).”
RCPs are scenarios spanning time series of emissions and concentrations of the full range of greenhouse gases and aerosols and chemically active gases, as well as land use and land cover. The word “representative” means that each concentration pathway offers one of many possible scenarios that would lead to specific radiative forcing characteristics. The word “trajectory” emphasizes that only the long-term concentration levels are of interest, but it also indicates the path followed over time to reach the result in question IPCC (2013).
In various areas of the world, multiple investigations of the expected wind potential variation for the century have been conducted, Devis et al. (2018) examined future changes in wind energy production in Europe using a set of ESMs (Earth System Models). Based on this method, the ESM set projects changes in wind potential outputs in the near future, which varies spatially between about 8%. The most extreme changes occur in the Mediterranean region, which are consistent with those obtained by Kozarcanin et al. (2018). Both authors recommend taking into account the changes that will occur in the near future with respect to wind speed, which is essential when estimating the performance of a wind farm.
Another research was done by Alonso et al. (2019) they analyzed the behavior of the wind speed for three periods of 30 years in the future, using the regional climate model PRECIS (Providing Regional Climates for Impacts Studies) in high resolution scenarios of climate change SRES A1B, driven with boundary conditions from the General Circulation Model ECHAM5 (European Centre/HAMburg climate model) and six of the 16 members of the set of perturbed physics HadCM3 (Hadley Centre Coupled Model, version 3) GCM (Global Climate Model). They found that changes in wind speed will be larger in the eastern and northern coast, becoming statistically significant for the second half of this century. These areas of increased wind power match with the current projection of the Cuban wind program where the construction of 13 new wind farms are contemplated.
These works adequately investigated the impact of climate change on wind energy through sets with runs of regional climate models, made from various climate scenarios of greenhouse gas emissions. However, no research related to the impact of climate change on wind energy has not been evaluated using the representative of possible future emissions and concentration pathways (RCPs).
Such evaluations are highly relevant when considering the following key aspects: renewable energy sources appear as very promising alternatives in mitigation and adaptation to climate change, but are typically climate dependent; apart from the benefits aimed at mitigating climate change, there are others of an environmental and economic nature that have motivated the promotion and development of these alternatives within the energy matrix in Cuba. For these reasons, the development of possible future emissions and concentration pathways linked to assessments of potential impacts on the generation of wind energy have great scientific and practical importance. The main goal of this research is to generate high resolution future climate scenarios for Cuba to analyze the behavior of the wind resource; this variation will be added to the new outputs of The Numerical Wind Atlas of Cuba to estimate the values of wind speed in the future for better use by stakeholders and policy makers in the wind energy sector in Cuba.
Methodology
Wind energy has become the world’s fastest growing renewable energy source due to its environment friendliness and economic viability. However, due to various conditions at locations for wind energy power generation, accurate information of the dynamic nature of turbines and the wind that drives these wind turbines is needed for wind farm siting, as well as operations and management of the wind energy conversion systems (Blanchard and Samanta, 2020). Development of reliable and accurate wind atlas and resource maps helps to identify candidate sites for wind energy applications and facilitates the planning and implementation of wind energy projects (Zegeye, 2021).
A numerical wind atlas constitutes an important source of information to locate favorable places in relation to the use of wind energy, which contributes to the technological and economic development of any country as an alternative mitigation against climate change. These results allow the sizing of future large-scale wind farms for the generation of electrical energy, and small wind turbines in rural areas where the transmission and distribution networks of energy are not accessible.
The variability of the wind is strongly influenced by the mesoscale physical processes that occur in the atmosphere with different spatial and temporal distributions, in addition to factors such as topography, water bodies (oceans, lakes, etc.), and land use. Wind variability is therefore an essential indicator of atmospheric circulation (Wright and Grab, 2017).
Briefing on PRECIS
In this research, for the analysis of the wind resource in Cuba in a future climate, the numerical outputs obtained in the works carried out by Bezanilla et al. (2016) and Taylor et al. (2018) which used version 1.8.2 of the system, were selected PRECIS developed by the Hadley Center of the United Kingdom (UK) Meteorological Office. The RCM (Regional Climate Model) is a 19 levels hydrostatic model described by a hybrid system of coordinates (Simmons and Burridge, 1981). The horizontal resolution is 0.22° × 0.22° equivalent to 25 km, respectively, in the Equator of the rotated grid. Due to the use of this high resolution, the model requires a time step of 2.5 minutes to maintain numerical stability. Surface conditions are required only on water, where the RCM needs time series of sea surface temperature and ice cover, ice thickness, etc.
Boundary conditions comprise standard atmospheric variables as the surface pressure, the horizontal wind components, humidity, and temperature. PRECIS model uses a relaxation technique that is implemented through a buffer area on each vertical levels. The dynamic flows, atmospheric sulfur cycle, cloudiness and precipitation, radiative processes, the land surface, and the processes occurring in soil depth are explicitly described in the model. A detailed description of the PRECIS physical model can be found in Jones et al. (2004)
In this investigation, the ERA-interim reanalysis data (Dee et al., 2011; Simmons et al., 2007) were used as initial and boundary conditions in the PRECIS in the period from January 1, 1989 to December 31, 2001, with a time resolution of 6 hours and a spatial resolution of 1.5° × 1.5°.
Design of experiments
The experiments developed in this work were based on the proposed domain (Dee et al., 2011) (Figure 1), who conducted a detailed analysis of the implications of the dimensions of different domains in the simulation of key aspects of the climate of the Caribbean region. These authors also demonstrated the ability of model PRECIS to produce added value on the higher resolution information that feeds it, something that had already been approached by Campbell et al. (2010).
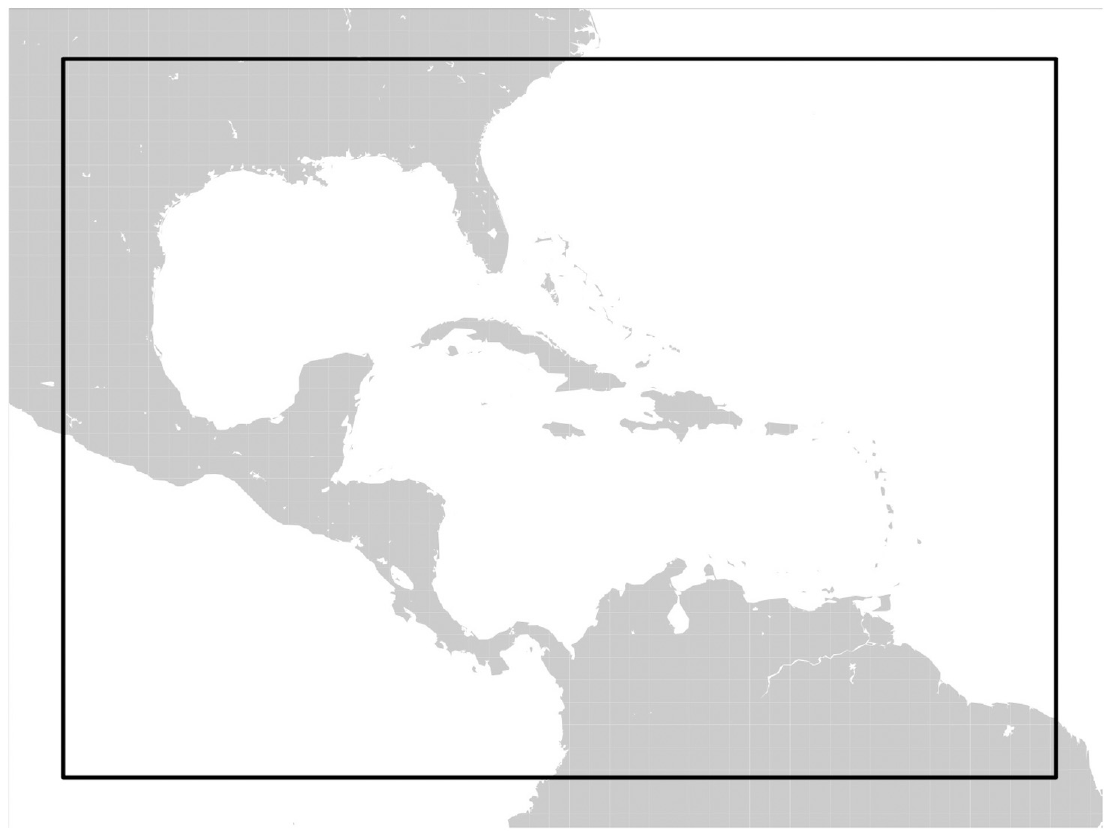
Domain used to run the RCM PRECIS, note the color buffer zone bold.
In this work all the verifications were carried out at 10 m height above ground level where experimental and observational data were available. A detailed description of the PRECIS validation for Cuba can be found in Alonso et al. (2019).
Greenhouse gas emission scenarios
The greenhouse gas emission scenarios selected in this investigation were RCP2.6, RCP4.5, and RCP8.5. These scenarios were selected because they simulate the most extreme future climatic conditions (RCP8.5), the intermediate ones (RCP4.5), and the least severe (RCP2.6).
RCPs describe distinct 21st century trajectories of atmospheric greenhouse gas (GHG) emissions and concentrations, emissions of air pollutants, and land use (IPCC, 2013). The scenarios are used to assess the costs associated with reducing emissions against specific concentration pathways. The pathways represent the range of greenhouse gas emissions include a strict mitigation scenario (RCP2.6), an intermediate scenario (RCP4.5), and a scenario with a very high level of greenhouse gas emissions (RCP8.5).
To determine the change that could occur in the wind during the future climatic conditions selected for this work, was used the methodology described below:
From the model outputs obtained with ERA-interim reanalysis data, the daily averages of the wind speed values were taken at 10 m above ground level during the period of January 01, 1989 to December 31, 2001.
In order to estimate the change in wind speed at regular intervals (30 years), for each grid point of the PRECIS outputs, the differences between the different future periods were calculated (F1 (2011–2040), F2 (2041–2070) and F3 (2071–2098)) with respect to the reference period (1961–1990) given by three different climate scenarios (RCP2.6, RCP4.5, RCP8.5).
Finally, to study the behavior of the wind resource in the future, the values of the change in wind speed (in the regions where the changes were statistically significant) were taken and added to the values used for the preparation of the maps of the new Wind Atlas of Cuba.
Significance
The amount of variation, deviation from the average, or “spread” of the wind speed can be calculated using the standard deviation formula 1 for each grid point

The significance level field in the

where
After calculating the significance
Bias
The bias provides information on the trend of the analyzed meteorological variables. According to Pielke (2013) the bias is defined as:

where
Algorithms description
The Fortran language continues to be one of the most widely used in high-performance computing and is characterized by its power in mathematical calculations. It has the advantage of being a compact language that meets the needs of Meteorology, especially in the field of numerical modeling. Among the most relevant features of this language are parallel calculus, mathematical notation support, static type checking in arrays, and multidimensional arrays.
Based on the foregoing, all the algorithms presented in this investigation were programing in Fortran 90. A program called climate.f (see Figure 2) was used to process the climate data, which from the reading of the data executes the following steps:
Creation of a land-sea mask from a bathymetry file (file that shows the relief of the seabed).
Determination of the angles for the wind roses.
Obtaining the annual average of the PRECIS system variables.
Calculation of the trend of climatic outputs and the ten-year average for wind speed.
Calculation of the absolute mean error of wind speed for meteorological stations.
Interpolation by Cubic Spline of the outputs of the PRECIS system.
Generation of the output data in binary format for NCL (NCAR Command Language) and GrADS (Grid Analysis and Display System).
Automatic creation of CTL files for each output binary file.
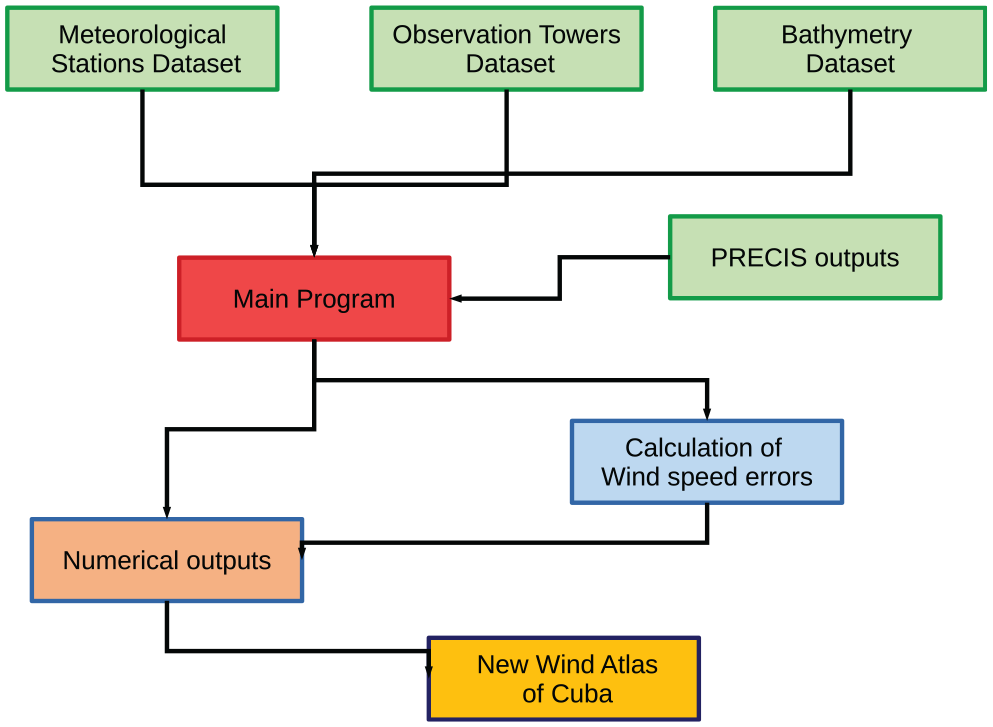
Flow diagram of the climate.f program to create the new Wind Atlas of Cuba.
Results
The significance of the increase or decrease of the wind speed in the periods analyzed for each climate scenario (RCP2.6, RCP4.5, and RCP8.5) was determined from the calculation of the level of significance, explained above. It shows the change that the average wind speed would have with respect to the reference period if Cuba’s climate in the future were similar to that described in the RCPs emissions scenarios. The regions where the increase obtained is truly significant can be determined by setting a threshold of 1.96 of absolute value, which corresponds to 95% of the non-significance interval. Future projections are based on the estimated changes between the reference period (1961–1990) and future periods (2011–2040, 2041–2070, and 2071–2098). The intervals were taken approximately 30 years, since it is the one recommended by Thom and Marcella (1972) for carrying out climatological studies.
Results obtained with the RCP2.6
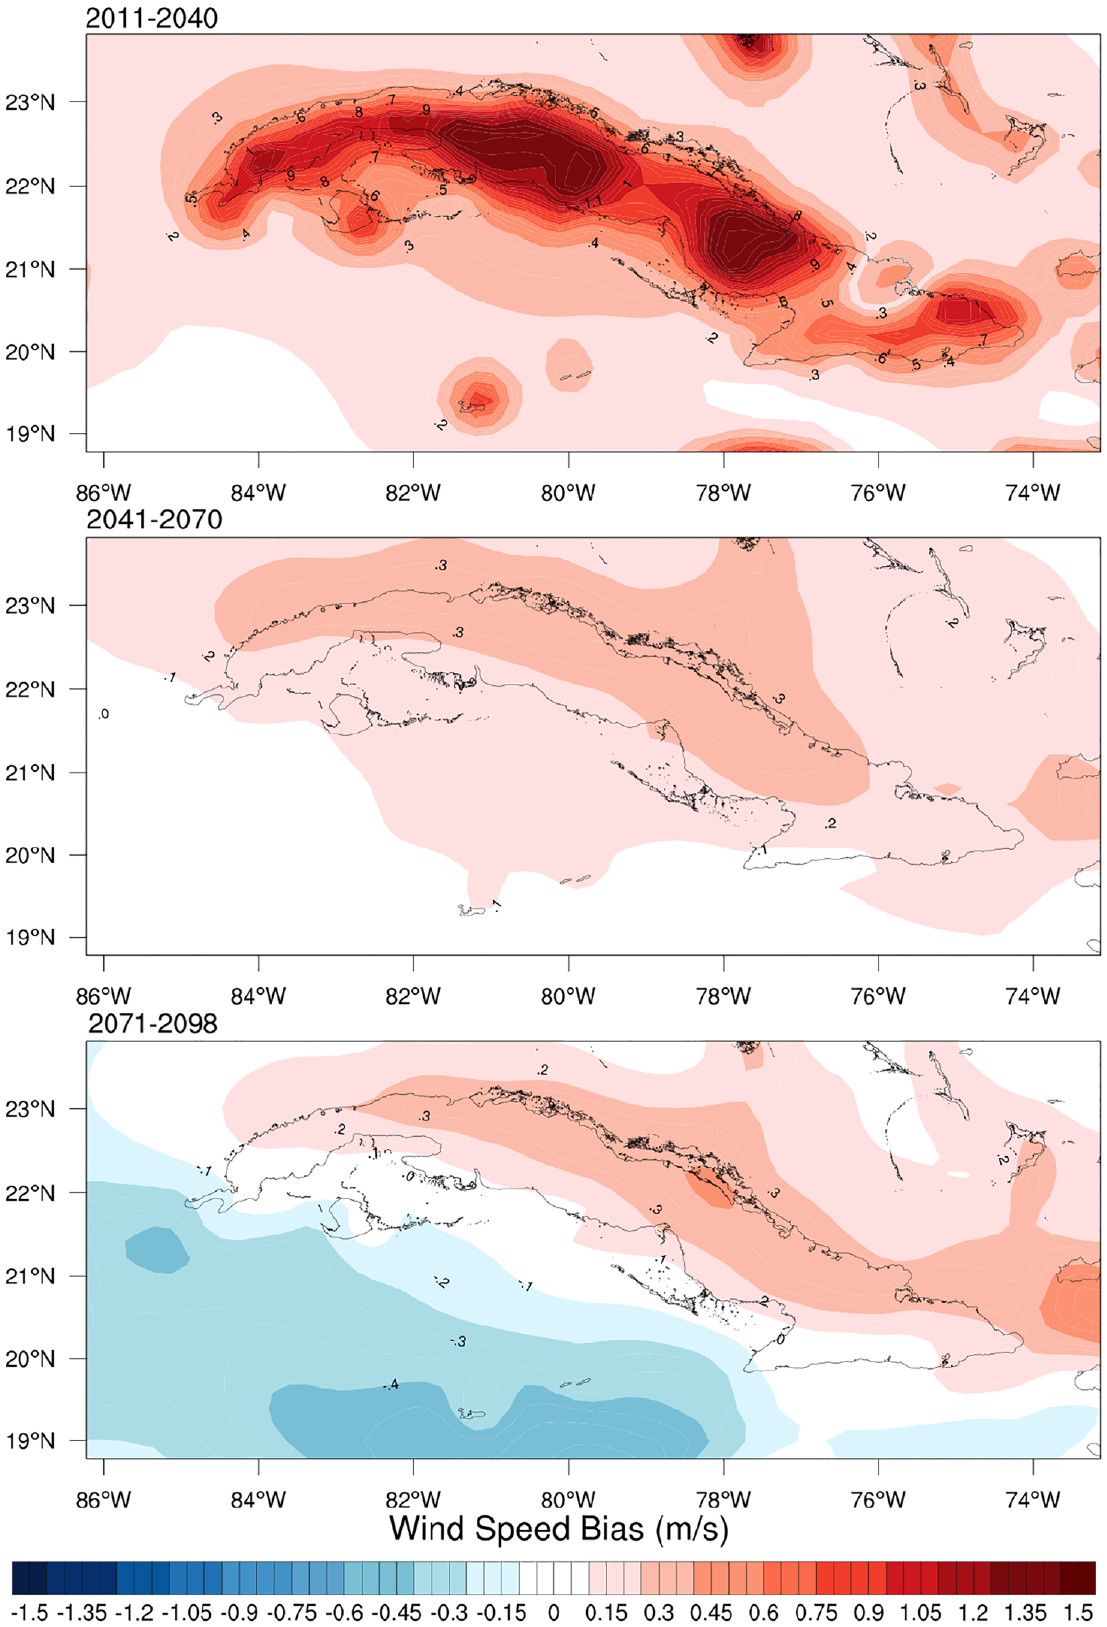
Figure 3 only takes into account the increase or decrease (change) in mean wind speed for future periods considering RCP2.6 climate scenario. A strengthening of the magnitude of the wind is observed, mainly in the first half of the century in the areas of the northwestern and central coast of Cuba.
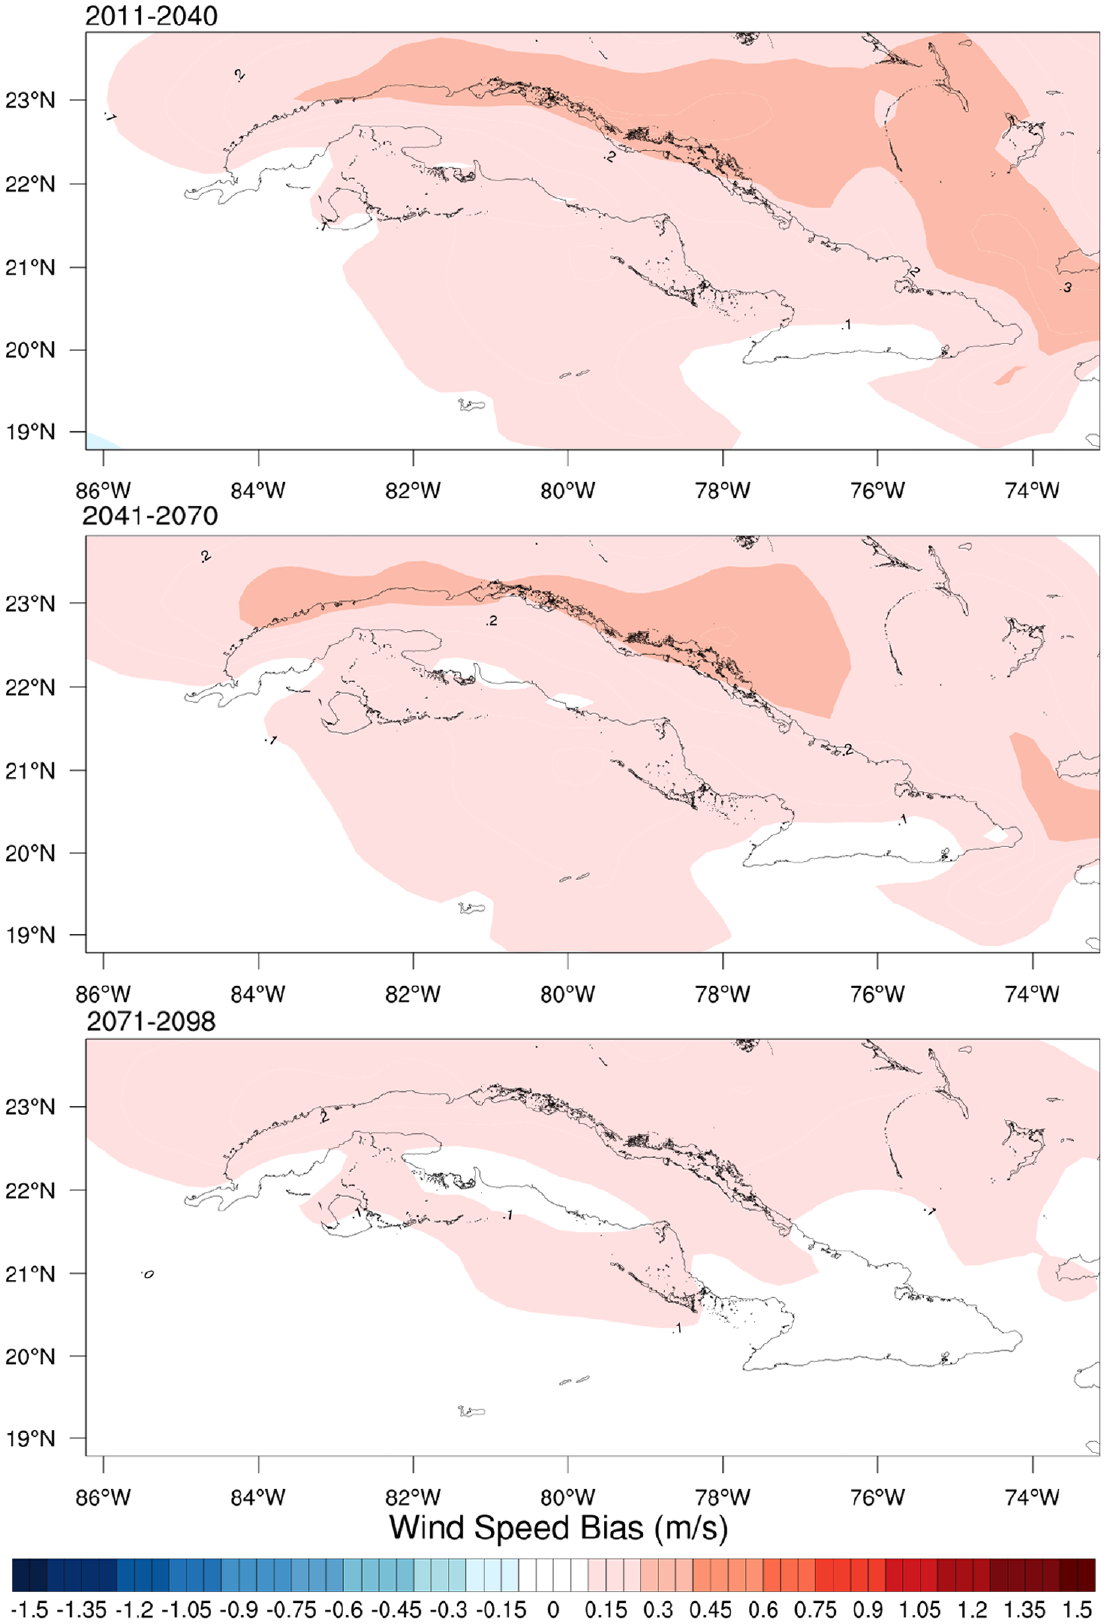
Wind speed bias between the base period and the selected time periods generated with PRECIS in RCP2.6.
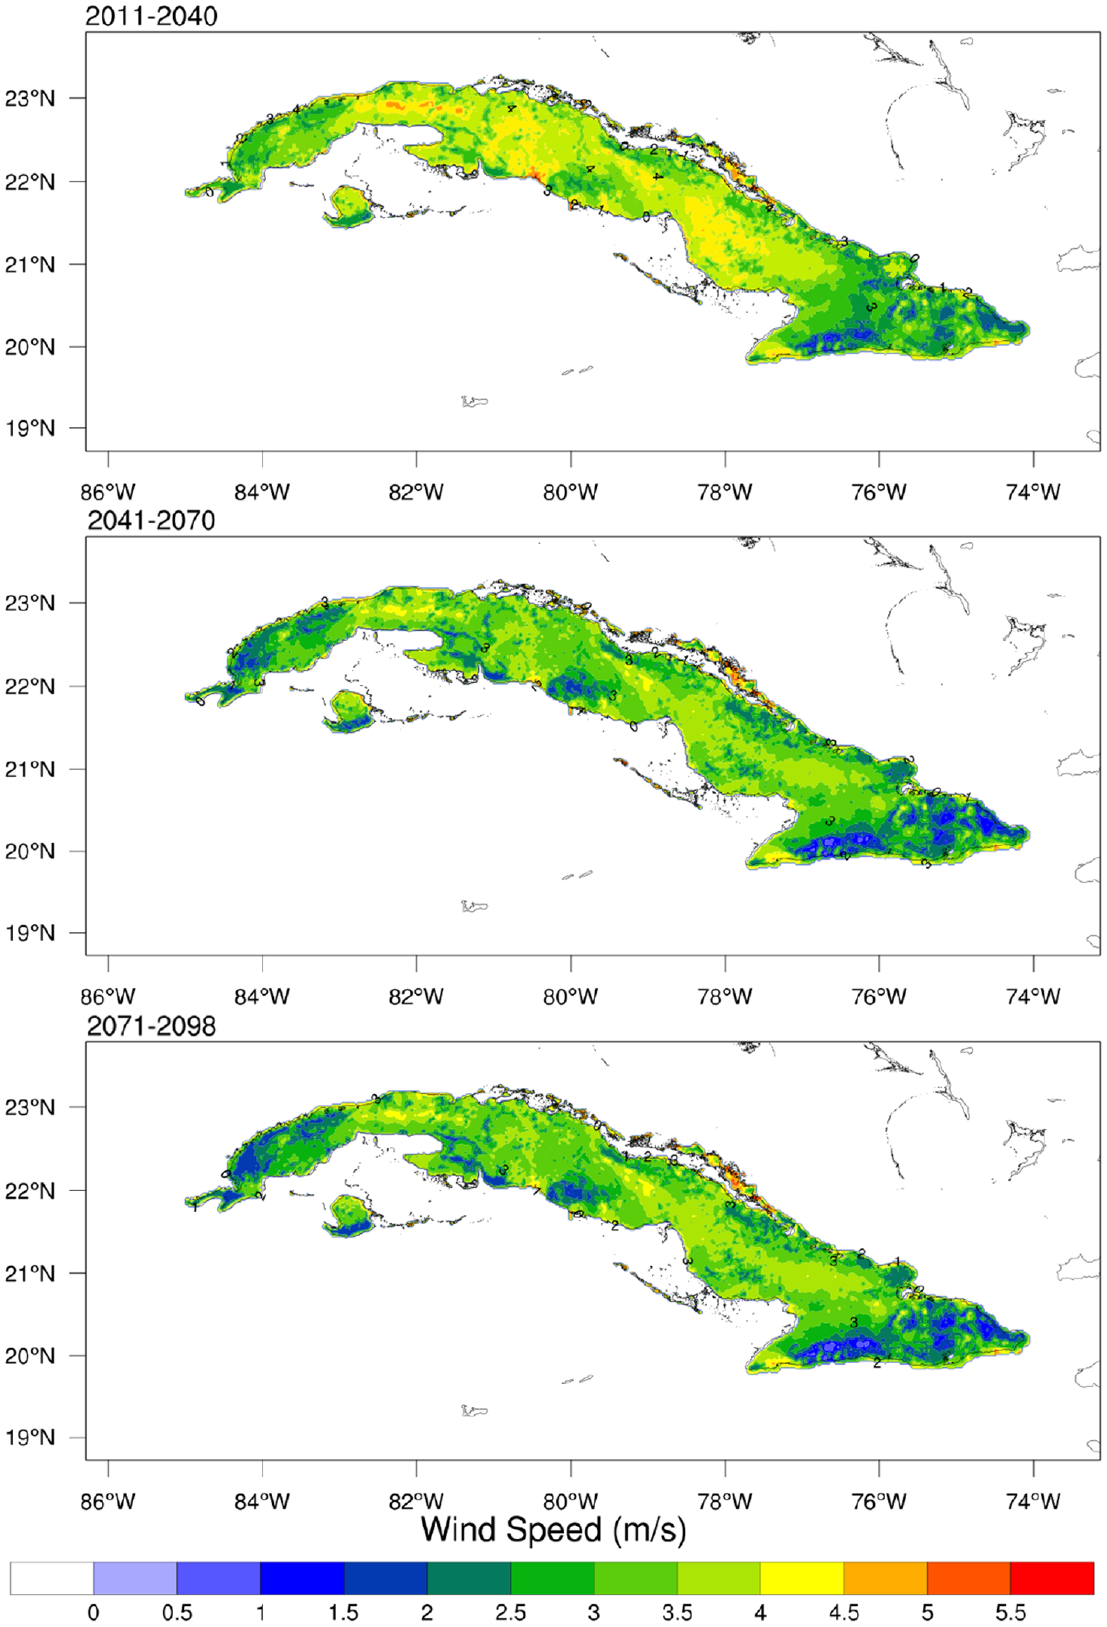
Filtering the values that corresponded to 95% of the non-significance interval, the Figure 4 was obtained, where the change is statistically significant for each of the periods with respect to the reference period. It can be seen that for the periods 2011–2040 and 2041–2070, the average wind speed experiences a slight increase in its magnitude in the areas of the northern coast of the west and center of the country, this increase being less towards the period 2071–2098.
Wind speed bias between the base period and the selected time periods generated with PRECIS in RCP2.6, where the changes are significant.
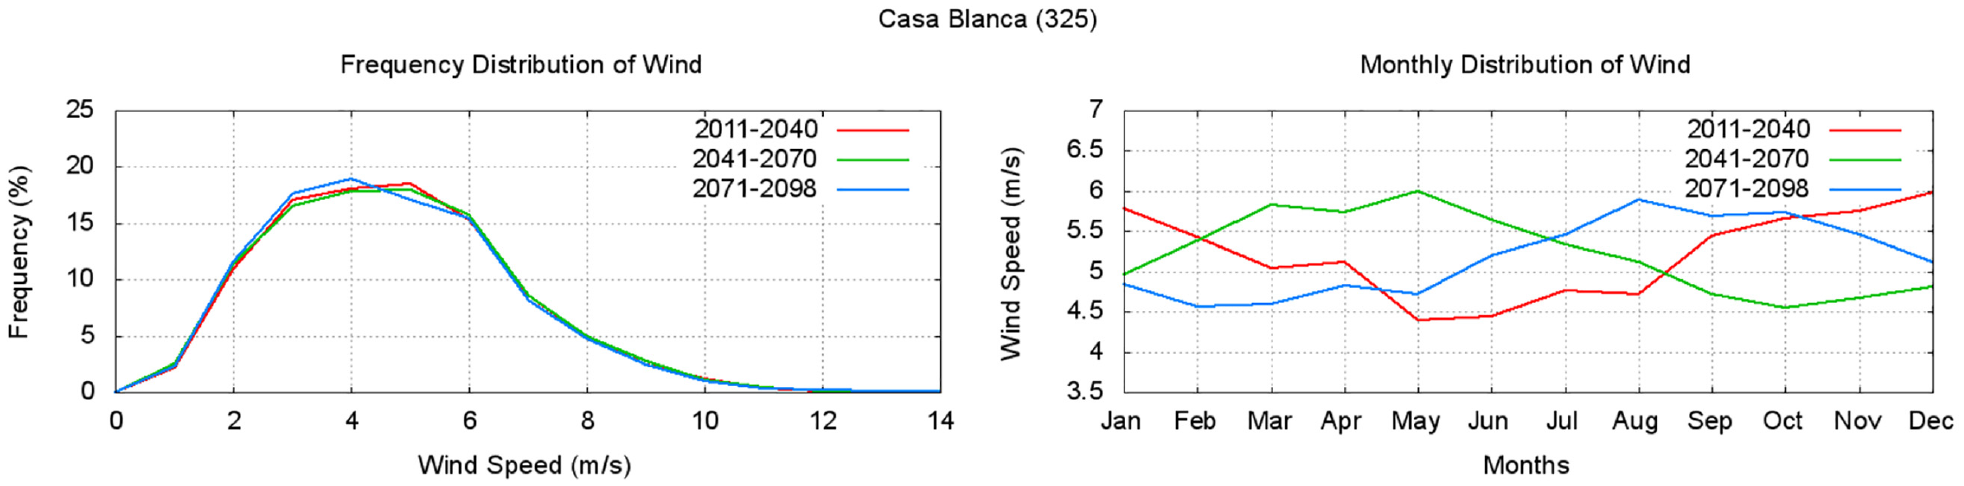
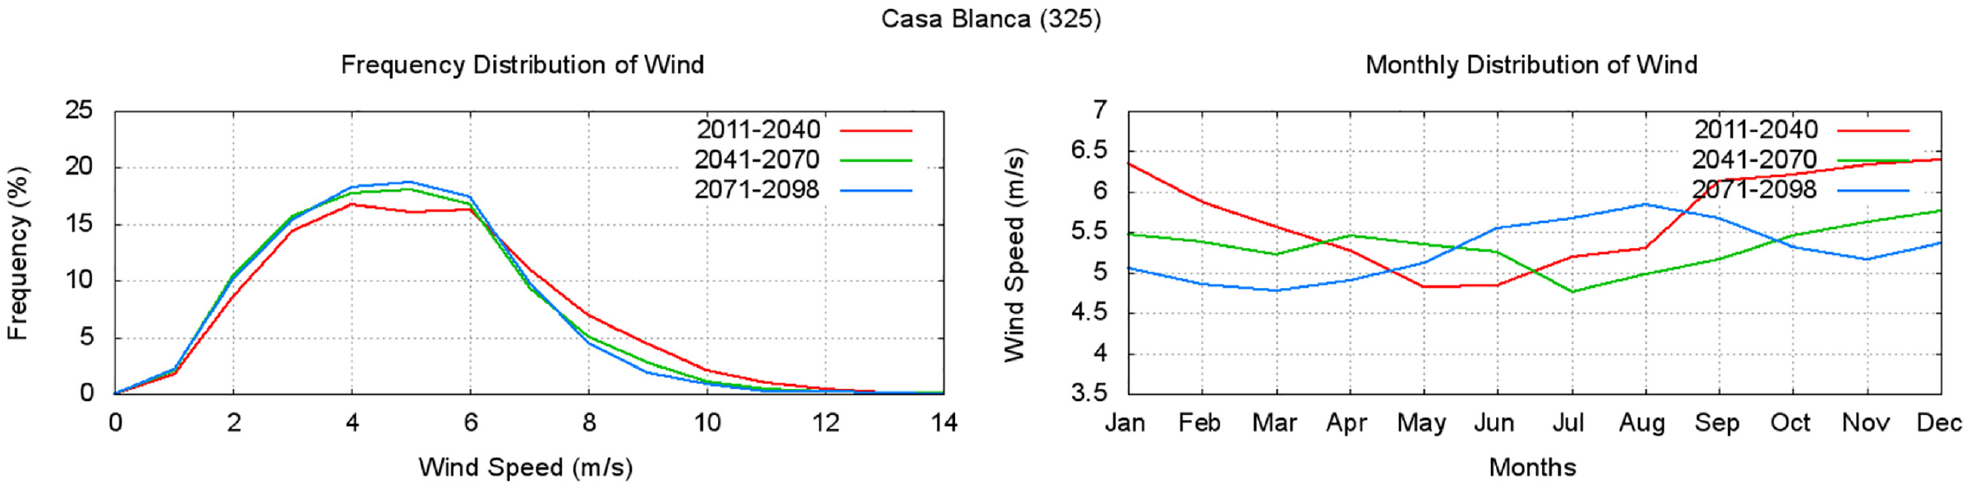
To analyze in more detail the behavior previously observed, the Figures 5–7 show the distribution of the average annual wind frequency given by the PRECIS system (with the RCP2.6) and the monthly wind speed distribution for the Casa Blanca, Puerto Padre, and Maisí stations. The Casa Blanca station (Figure 5) shows a slight increase in the frequency distribution for values between 3 and 4
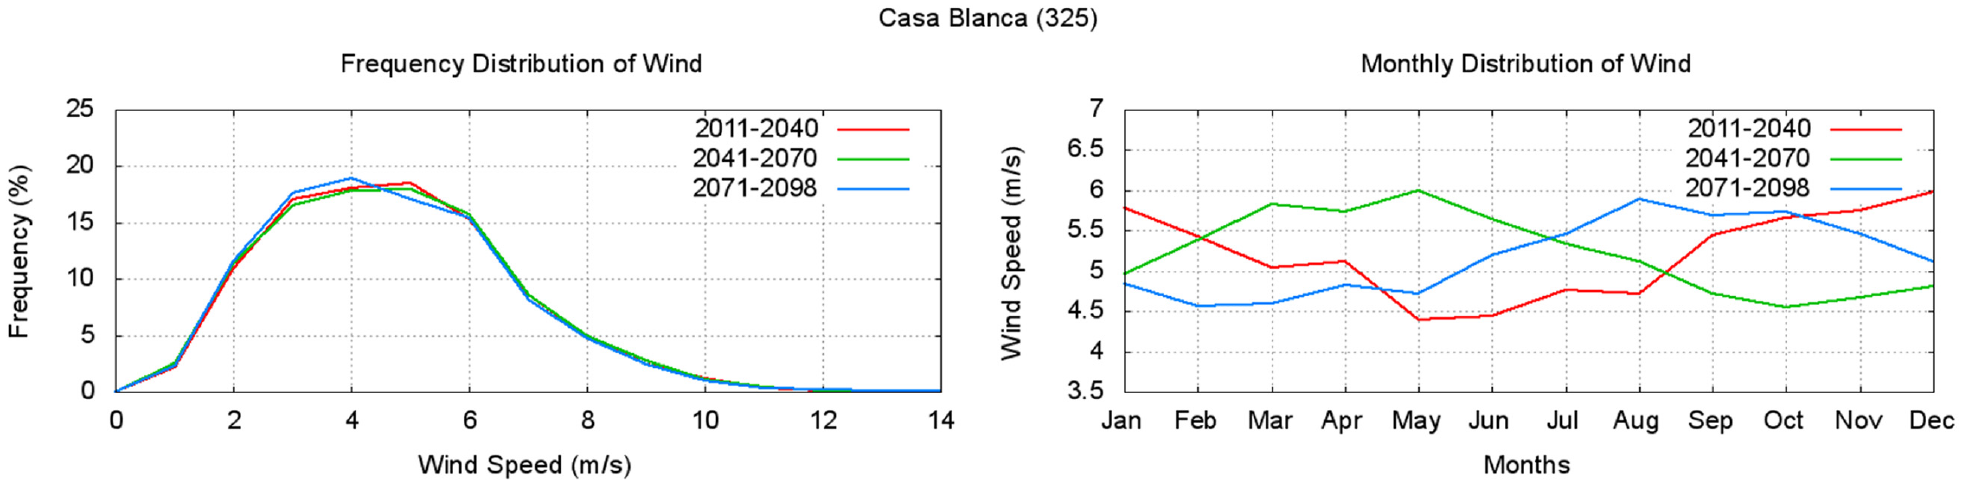
Casa Blanca 2011–2098. Graph (a): Distribution of average annual wind frequency for PRECIS in RCP2.6. Graph (b): monthly distribution of the wind speed.
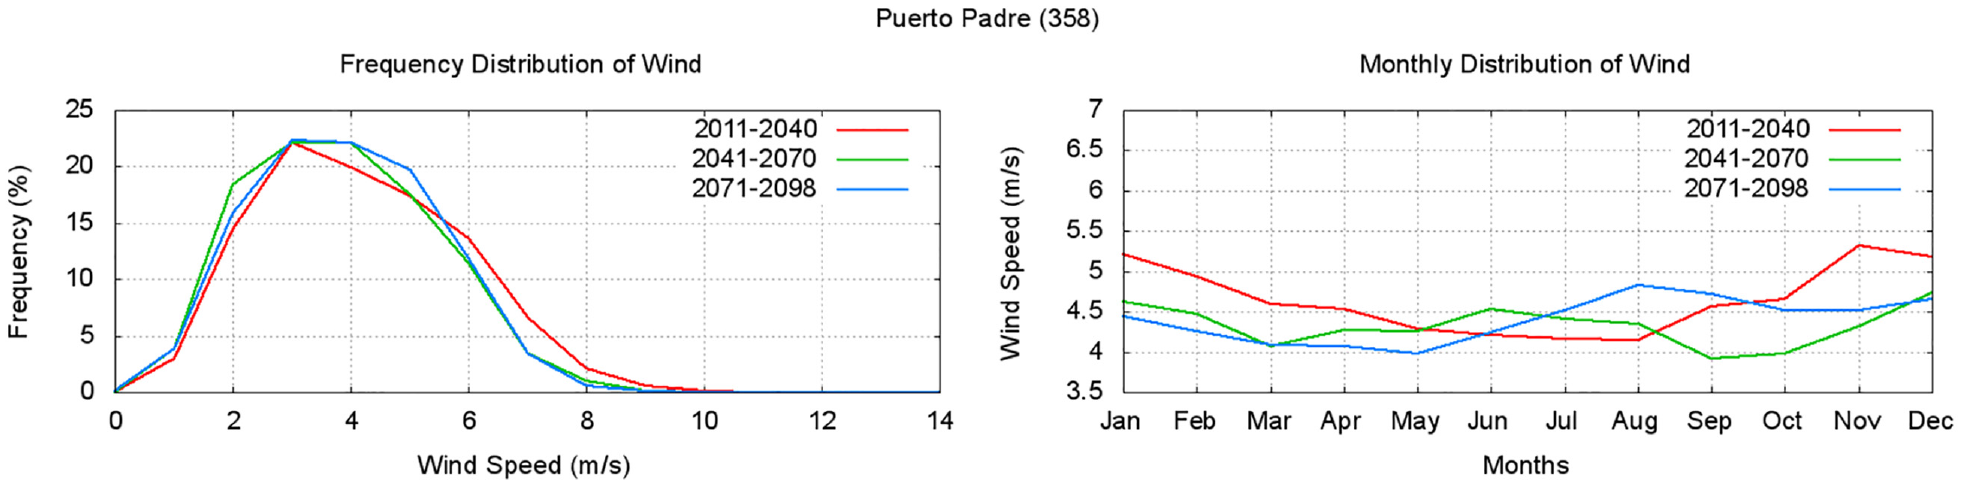
Puerto Padre 2011–2098. Graph (a): Distribution of average annual wind frequency for PRECIS in RCP2.6. Graph (b): monthly distribution of the wind speed.
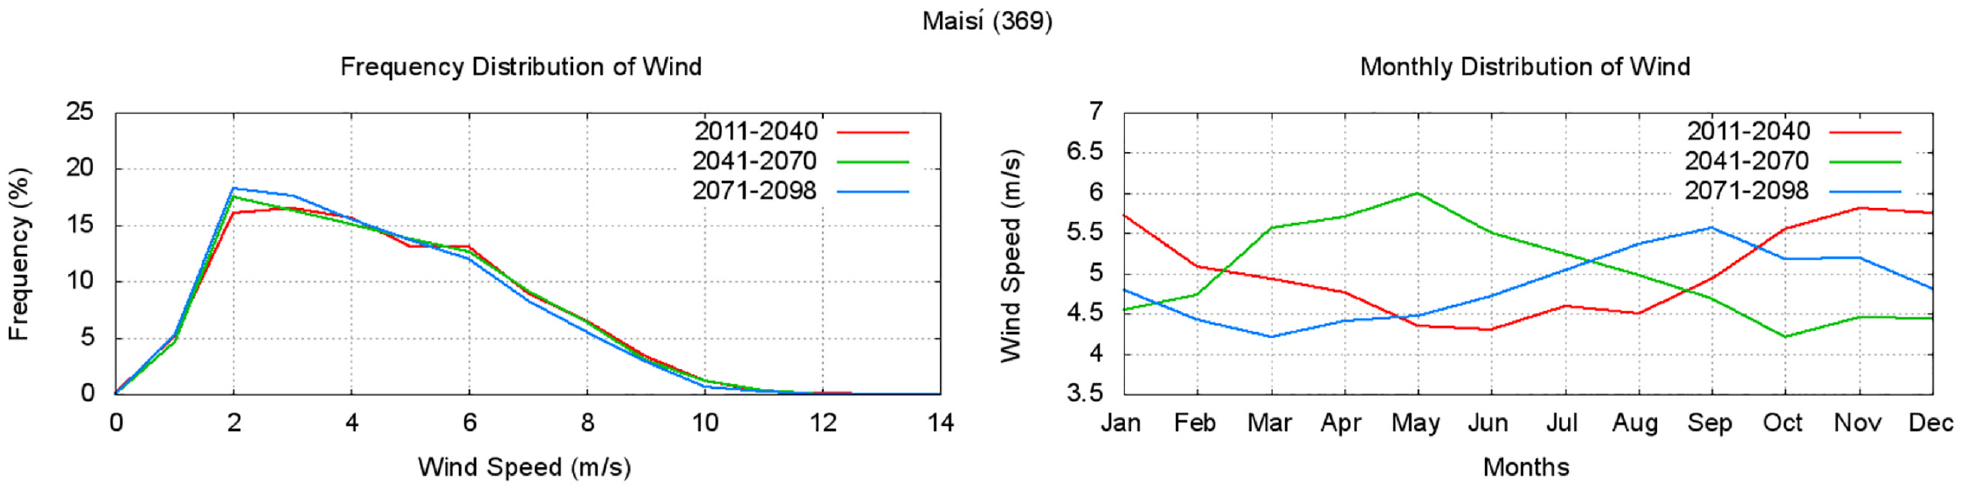
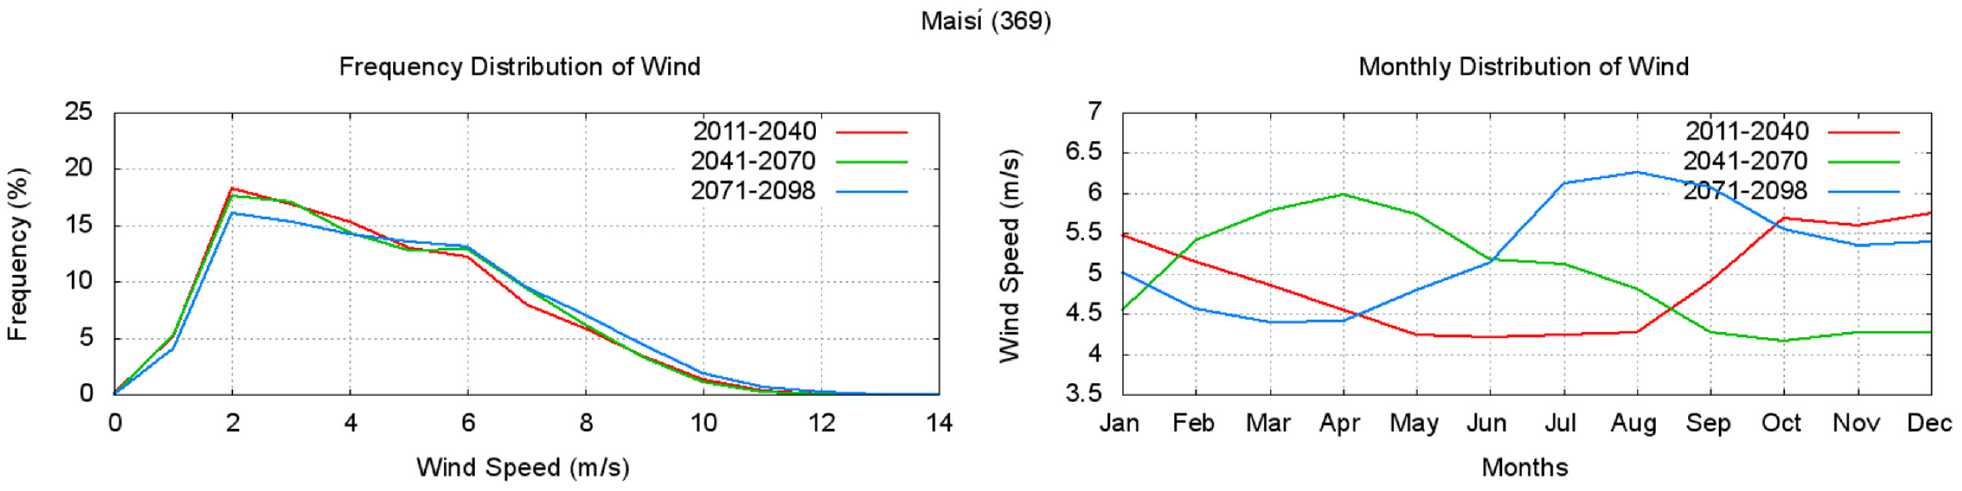
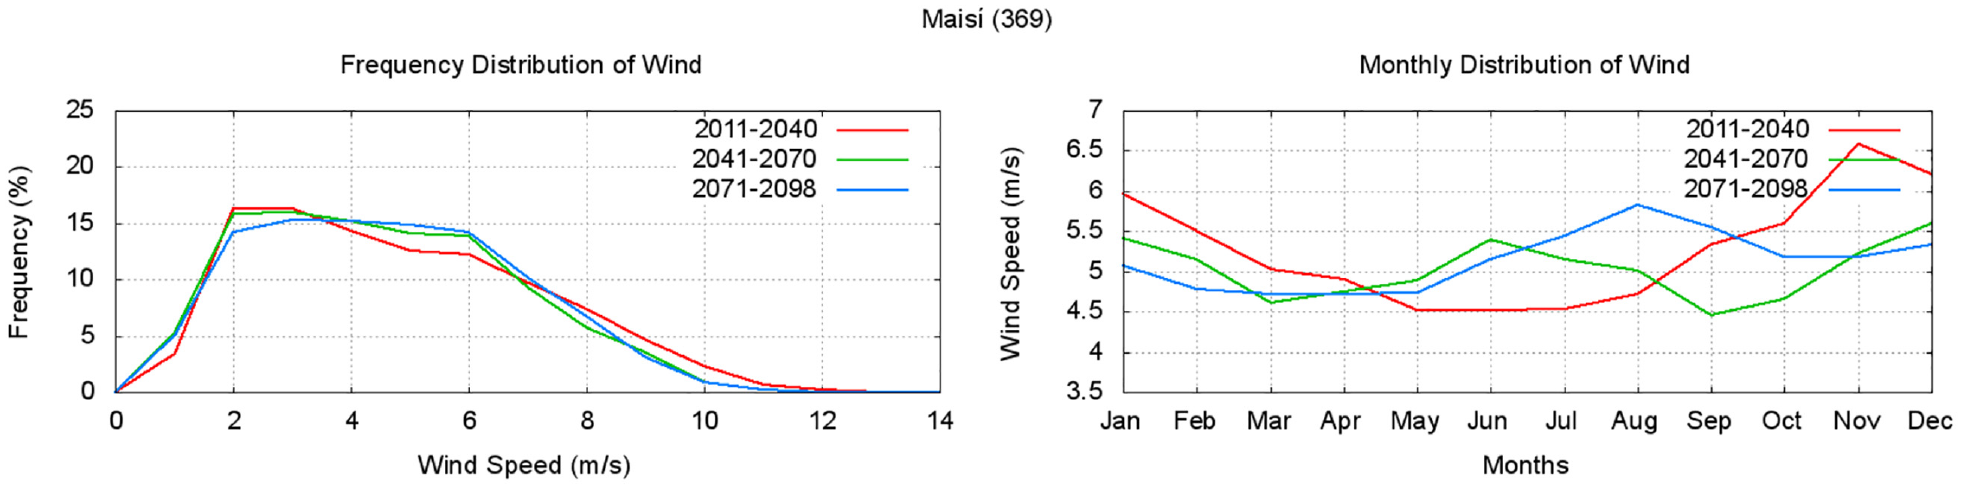
Maisí 2011–2098. Graph (a): Distribution of average annual wind frequency for PRECIS in RCP2.6. Graph (b): monthly distribution of the wind speed.
In the case of Puerto Padre and Maisí stations (Figures 6 and 7) they show a slight upward trend in the distribution of the average annual wind frequency for values between 2 and 4
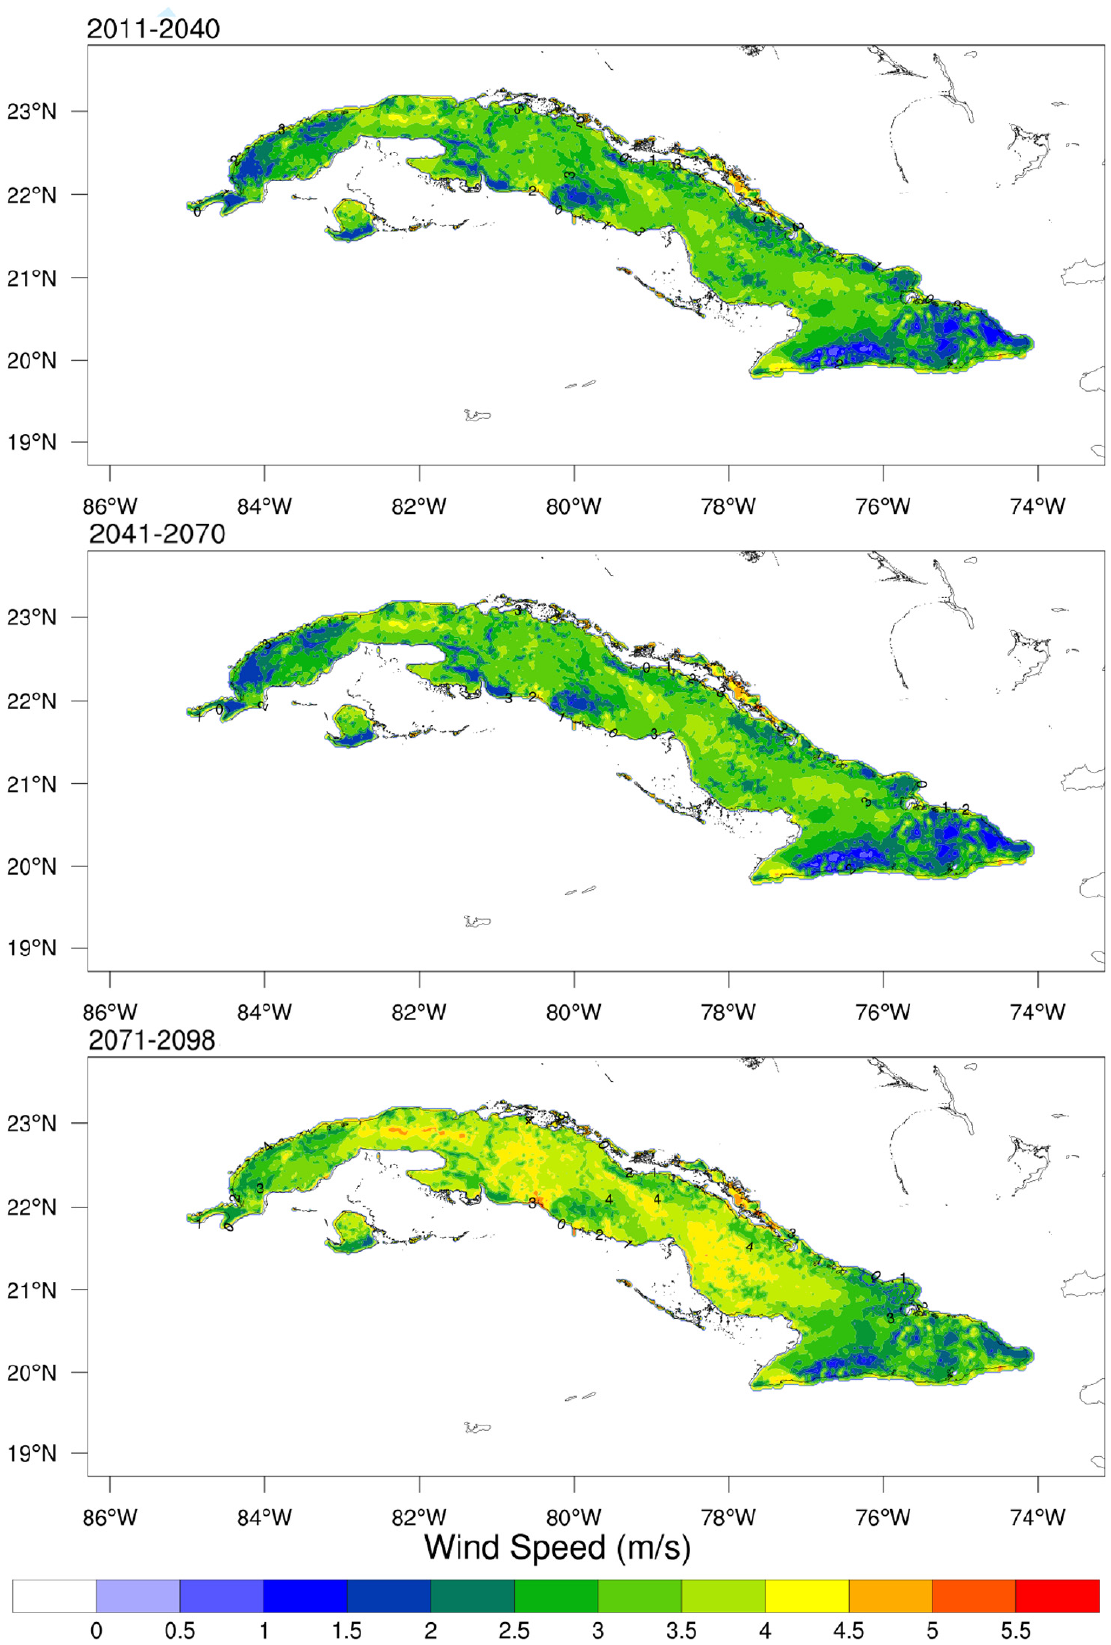
In places where the changes in wind speed were statistically significant, these changes were added to the wind speed outputs of the new Wind Atlas of Cuba (obtained by Alonso et al. 2019) to estimate the speed values of the wind in the three future periods. To do this, the mean wind speed map at 10 m of this new atlas was taken and the increase in wind speed for each of the periods previously analyzed in this work was added (Figure 4). In this way, there is a better estimate of the values that wind speeds must reach in the coming decades. Figure 8 shows the values that the wind speed should have at a height of 10 m in the different future periods throughout the national territory. Values of average wind speed of more than 4
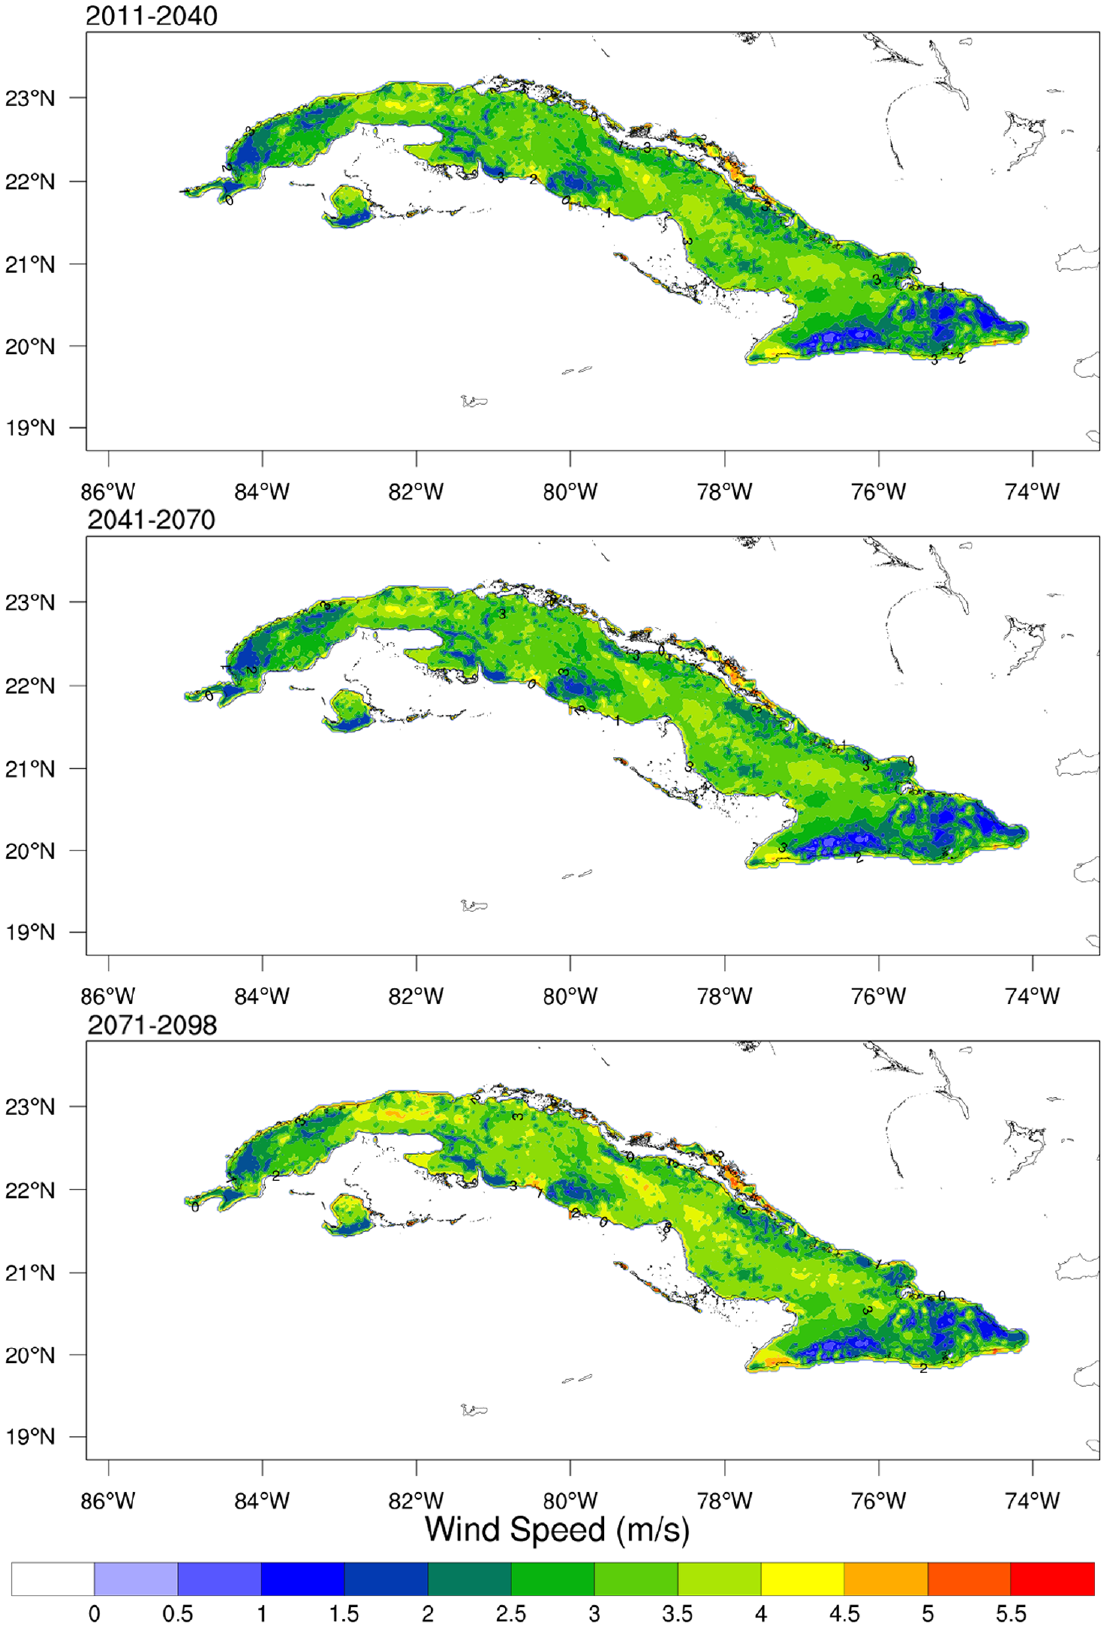
Average wind generated by Alonso et al. (2019) plus the increase in wind speed generated by PRECIS in RCP8.5 at 10 m high for the periods 2011–2040, 2041–2070, and 2071–2098. The values of the average wind speed are given in
Results obtained with RCP4.5
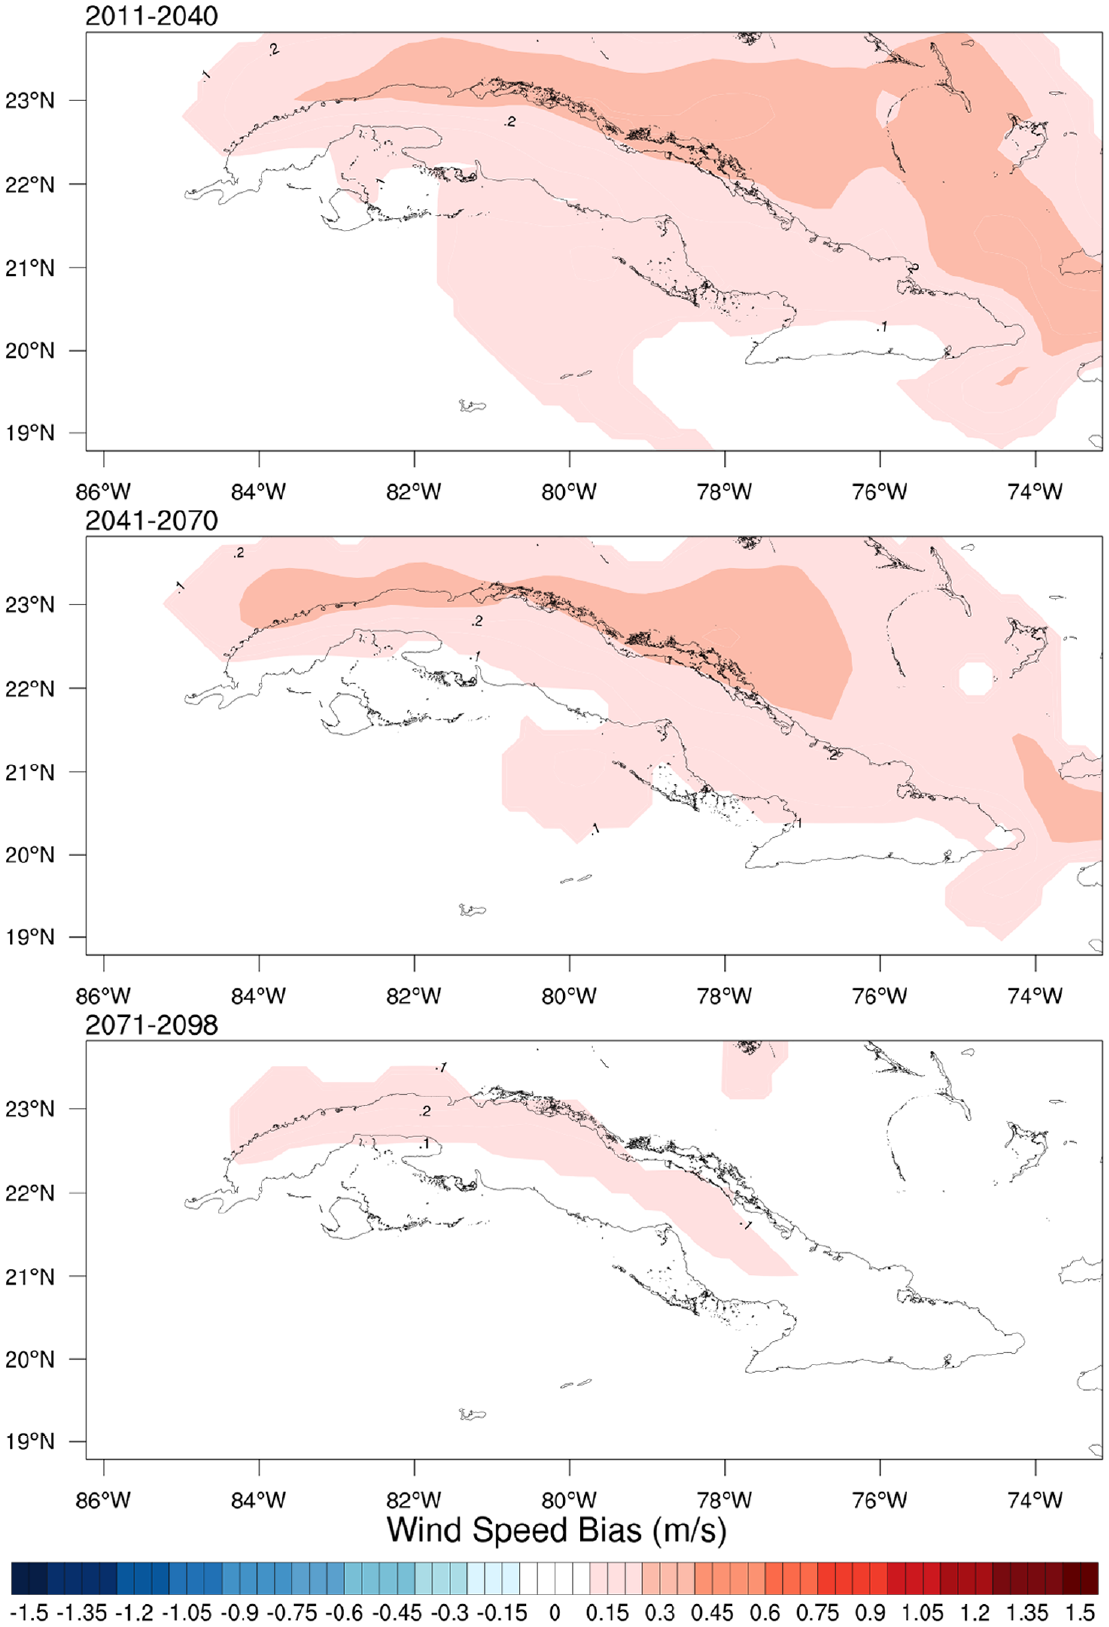
Figure 9 only takes into account the increase or decrease (change) in mean wind speed for future periods considering RCP4.5 climate scenario. A strengthening of the magnitude of the wind is observed, mainly in the second half of the century in the areas of the central north coast and the interior of the island.
Wind speed bias between the base period and the selected time periods generated with PRECIS in RCP4.5.
Filtering the values that corresponded to 95% of the non-significance interval, the Figure 10 was obtained, where the change is statistically significant for each of the periods with respect to the reference period. It can be seen that for the periods 2011–2040 and 2041–2070, the average wind speed experiences a slight increase in terms of its magnitude in almost the entire country, except for some areas of the southern coast. However, a large increase in average wind speed is estimated for the period 2071–2098 in the areas of the central north coast and the interior of the island.
Wind speed bias between the base period and the selected time periods generated with PRECIS in RCP4.5, where the changes are significant.
To analyze in more detail the behavior previously observed, Figures 11–13 show the distribution of the average annual wind frequency given by the PRECIS system (with the change scenario high-resolution climate control RCP4.5) and the monthly wind speed distribution for the Casa Blanca, Puerto Padre and Maisí stations. The three stations show an upward trend in the distribution of the average annual wind frequency for values above 4
Casa Blanca 2011–2098. Graph (a): Distribution of average annual wind frequency for PRECIS in RCP4.5. Graph (b): monthly distribution of the wind speed.
Puerto Padre 2011–2098. Graph (a): Distribution of average annual wind frequency for PRECIS in RCP4.5. Graph (b): monthly distribution of the wind speed.
Maisí 2011–2098. Graph (a): Distribution of average annual wind frequency for PRECIS in RCP4.5. Graph (b): monthly distribution of the wind speed.
In places where the changes in wind speed were statistically significant, these changes were added (as the others RCPs) to the wind speed outputs of the new Cuban Wind Atlas (obtained by Alonso et al., 2019) to estimate the speed values of the wind in the three future periods. To do this, the mean wind speed map at 10 m of this new atlas was taken and the increase in wind speed for each of the periods previously analyzed in this work was added (Figure 10). In this way, there is a better estimate of the values that wind speeds must reach in the coming decades. The Figure 14 shows the values that the wind speed should have at a height of 10 m in the different future periods throughout the national territory. Values of average wind speed of more than 4
Average wind generated by Alonso et al. (2019) plus the increase in wind speed generated by PRECIS in RCP4.5 at 10 m high for the periods 2011–2040, 2041–2070, and 2071–2098. The values of the average wind speed are given in
Results obtained with the RCP8.5
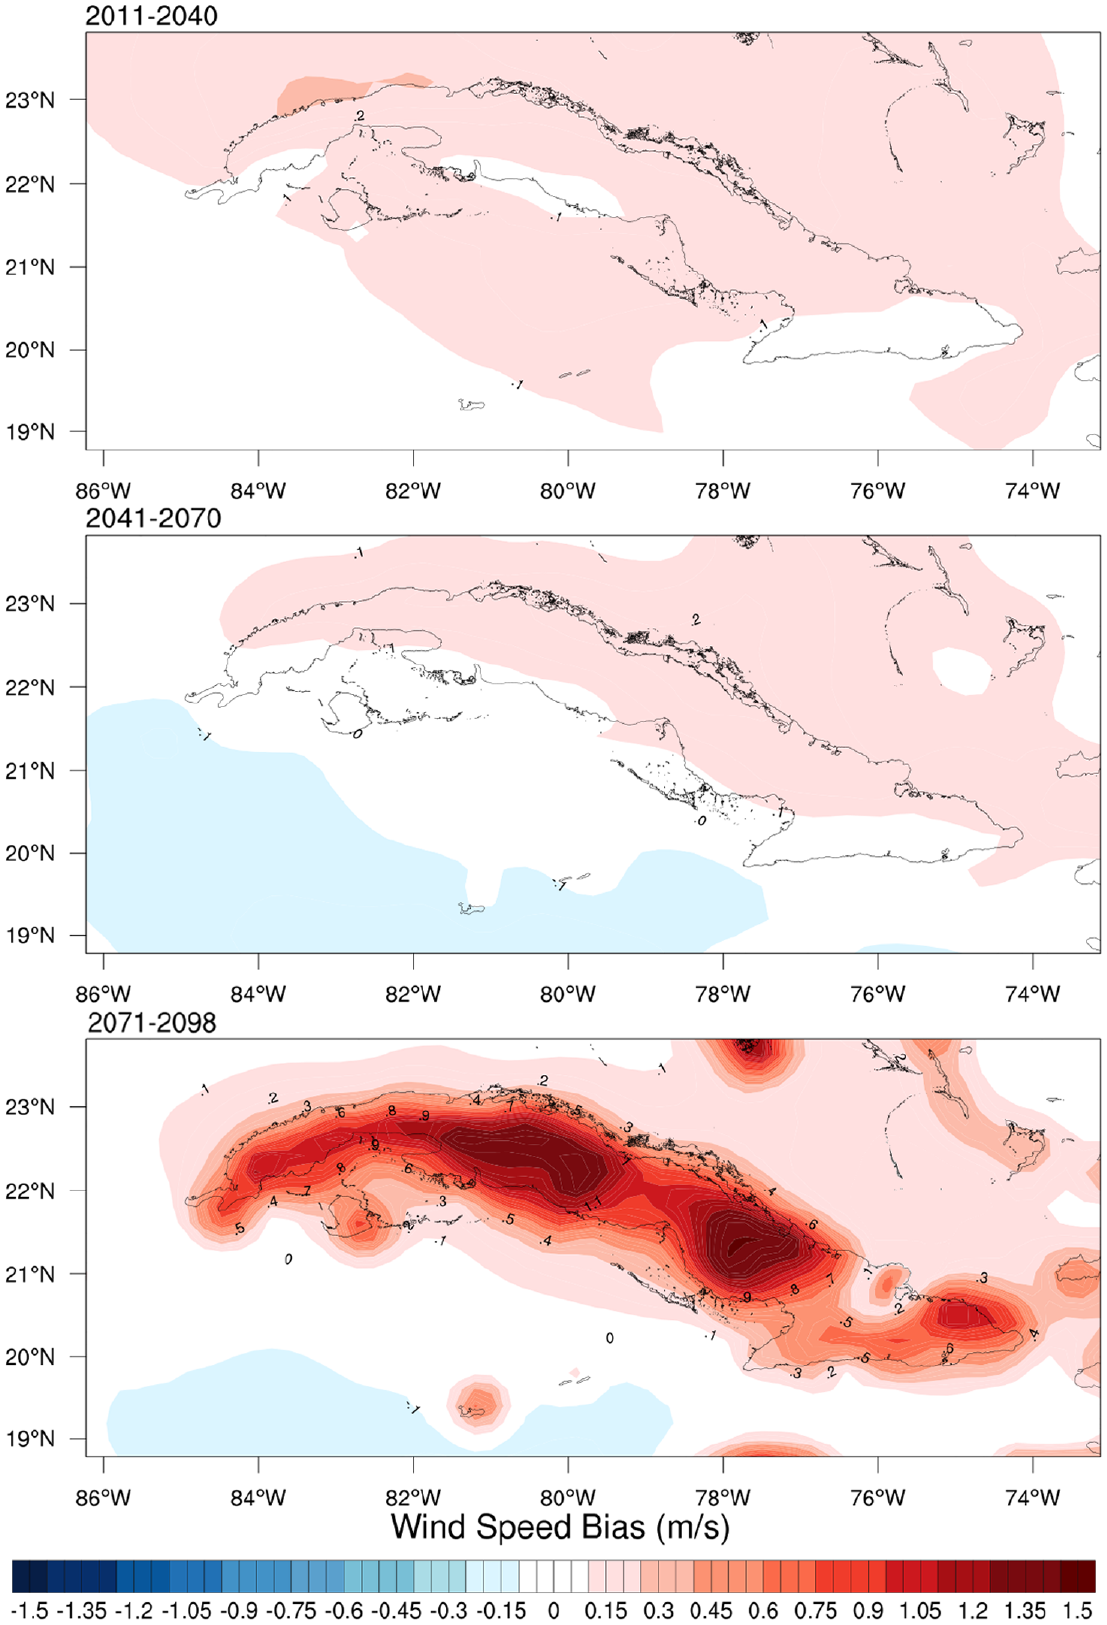
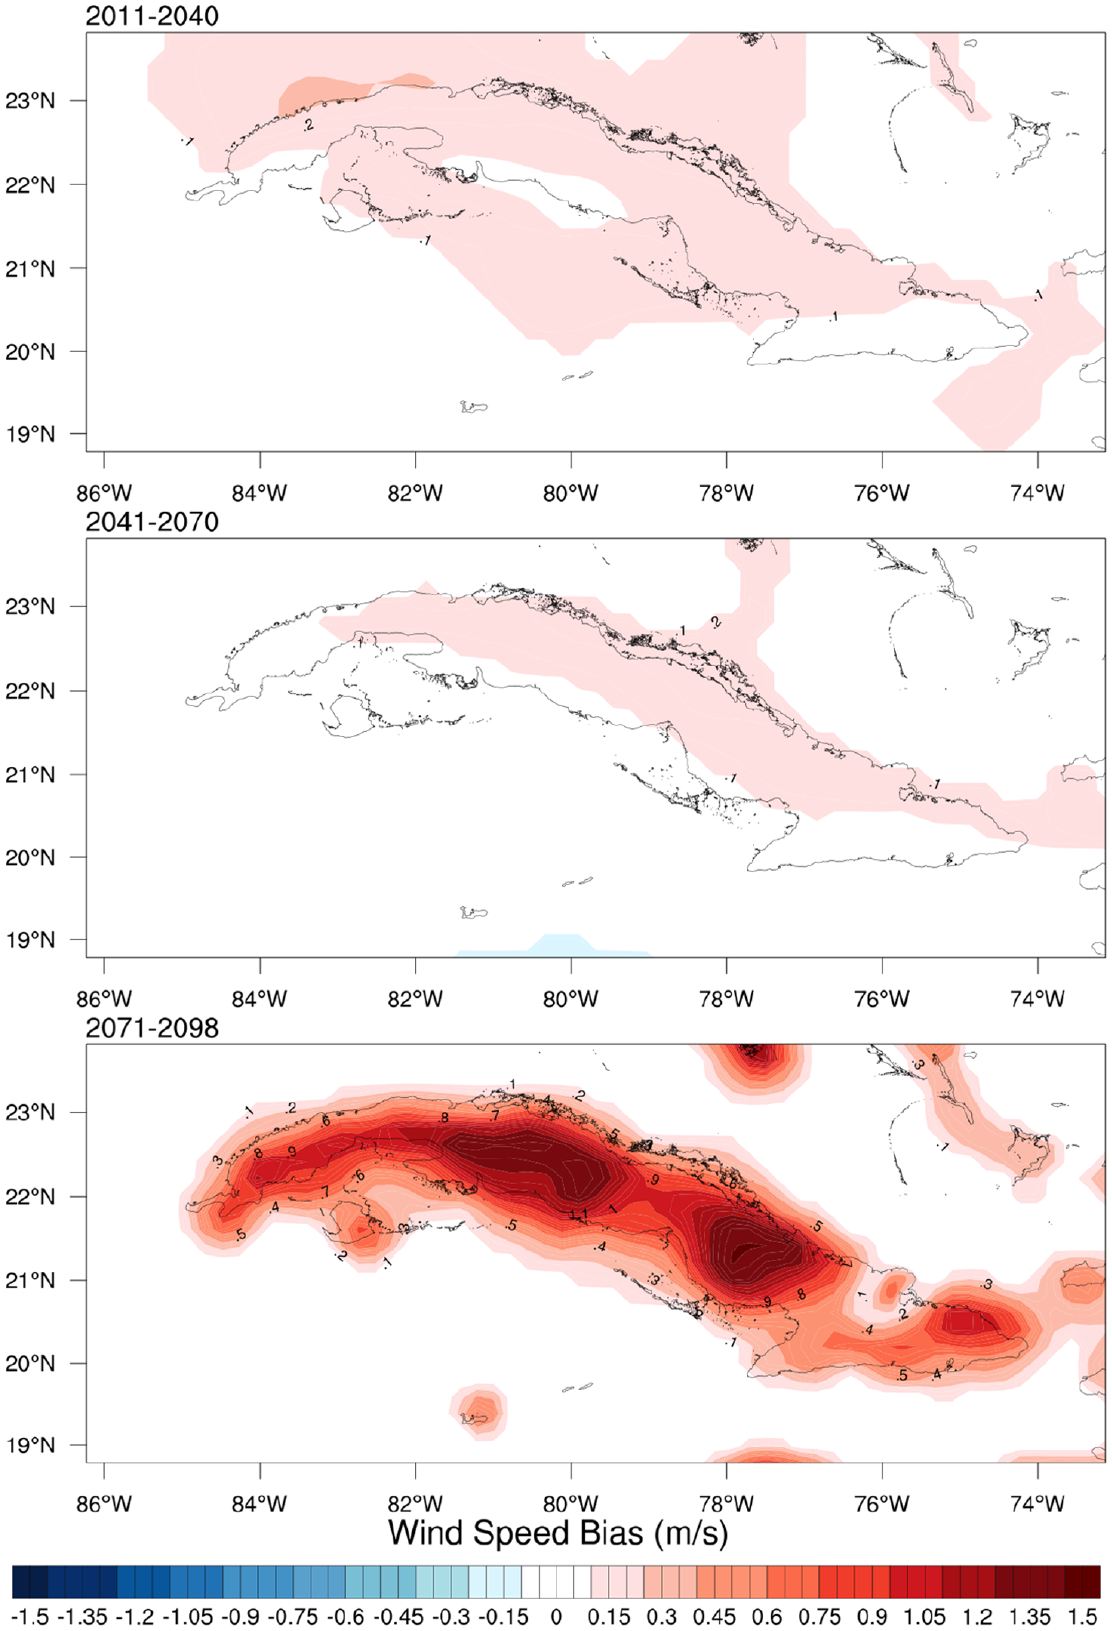
Figure 15 only takes into account the increase or decrease (change) in mean wind speed for future periods considering RCP8.5 climate scenario. There is a marked reinforcement of the magnitude of the wind, mainly in the first half of the century in the interior areas of the island.
Wind speed bias between the base period and the selected time periods generated with PRECIS in RCP8.5.
Filtering the values that corresponded to 95% of the non-significance interval, the Figure 16 was obtained, where the change is statistically significant for each of the periods with respect to the reference period. In it, it can be seen that in the period 2011–2040, the average wind speed experienced a considerable increase in terms of its magnitude in almost the entire country, especially in the interior and center of the island. In the remaining periods (2041–2070 and 2071–2098) a minor increase in the average wind speed is estimated in the northern coastal areas of the entire country. The most important part of this increase is that it allows consolidating the current projection of the Cuban wind program until 2030, in which the construction of new wind farms is proposed, precisely where the wind potential of Cuba will be increased. On the other hand, the southern coast of Cuba will experience a slight decrease in wind speed values that will be greater towards the Caribbean Sea area at the end of the century.
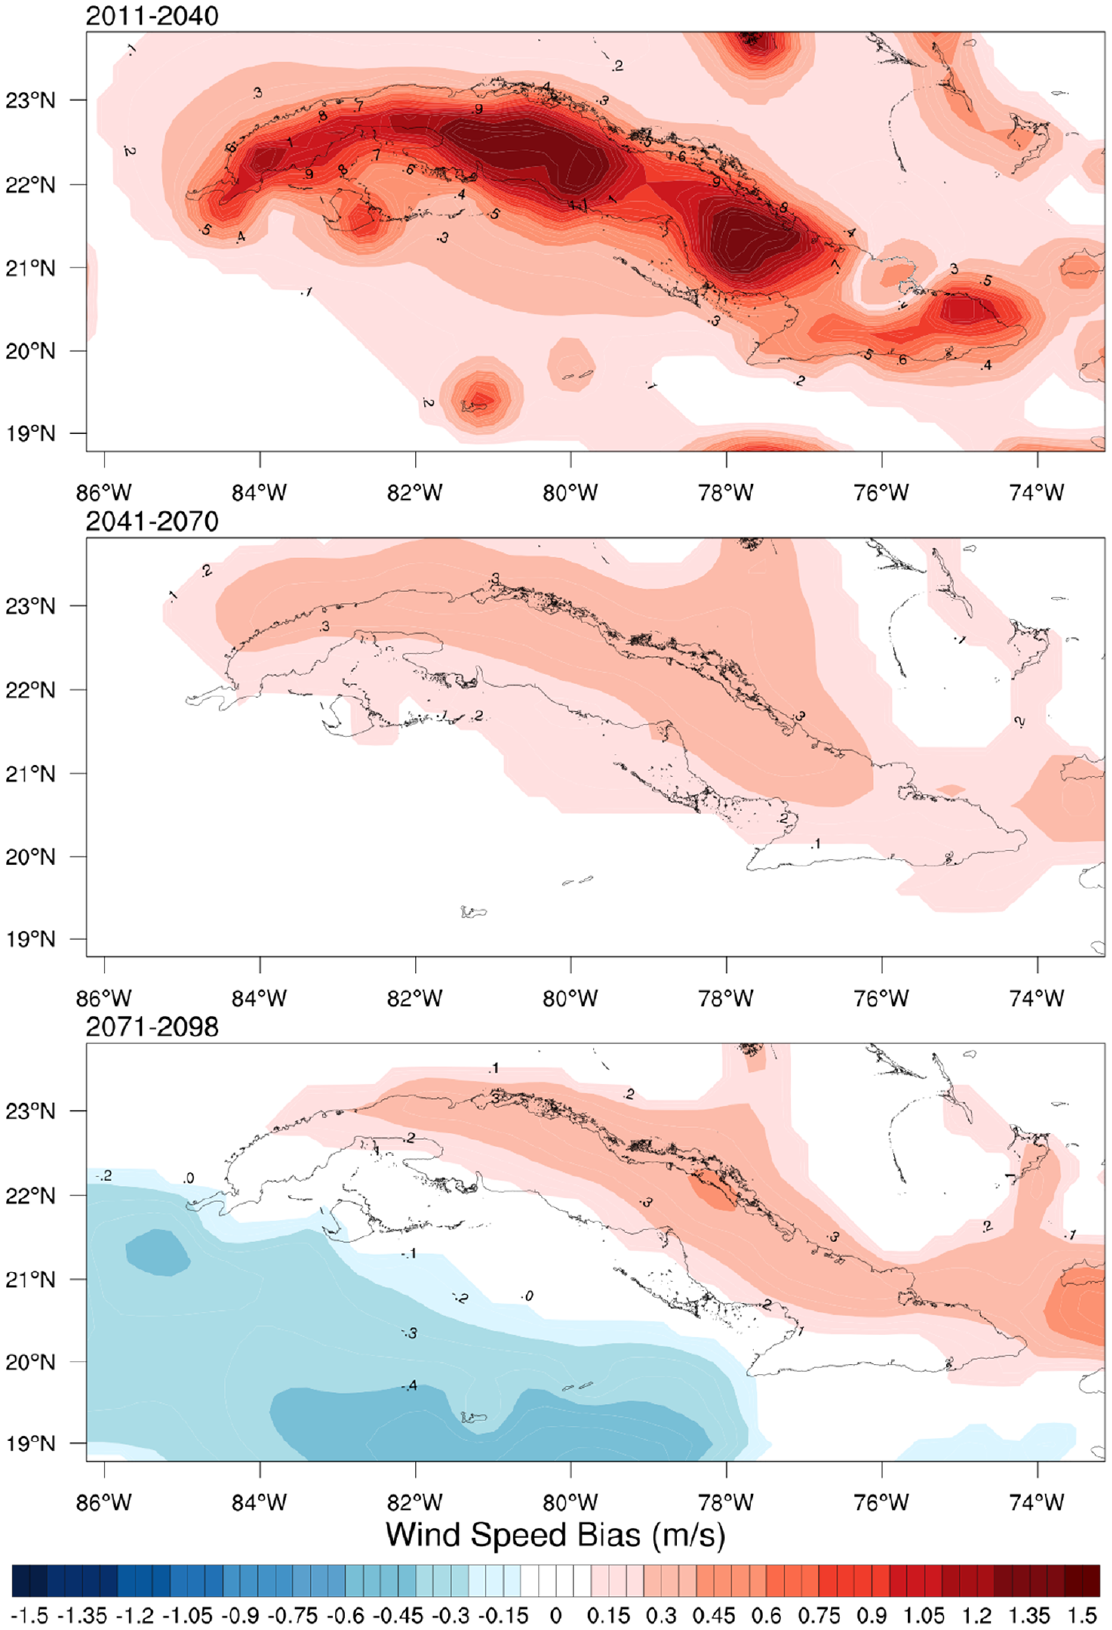
Wind speed bias between the base period and the selected time periods generated with PRECIS in RCP8.5, where the changes are significant.
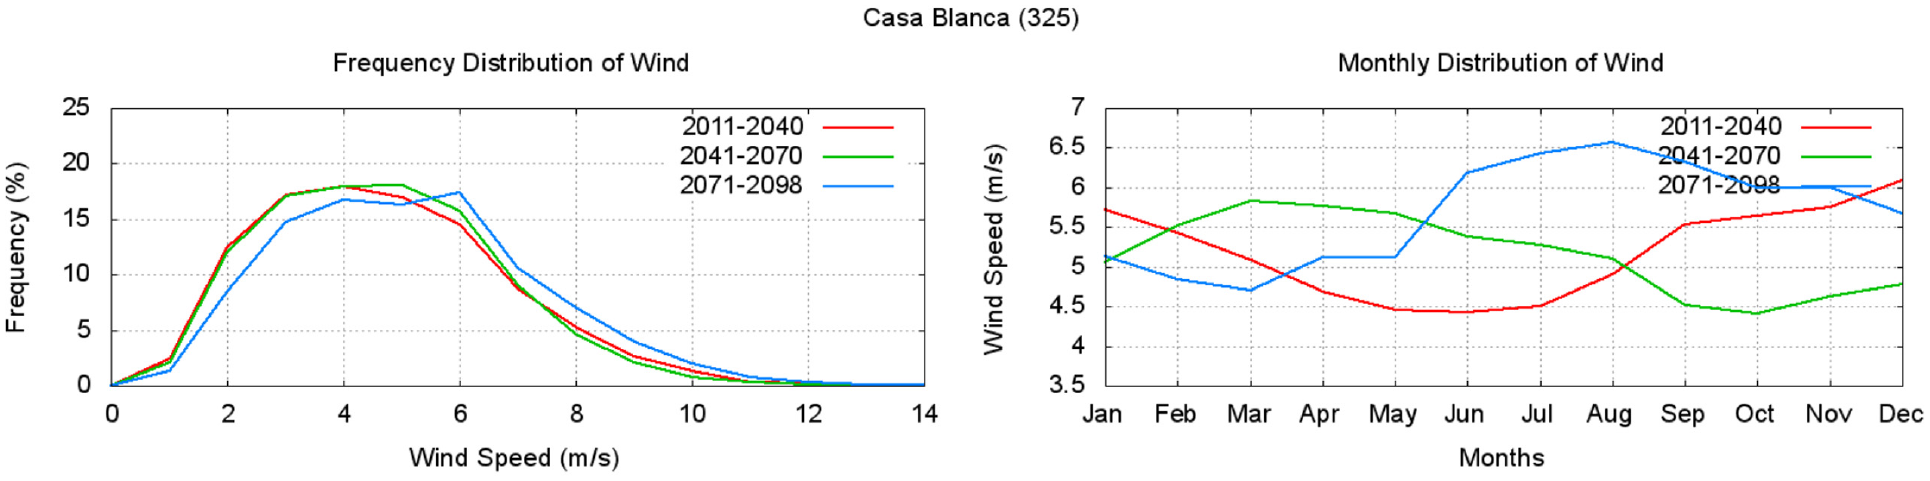
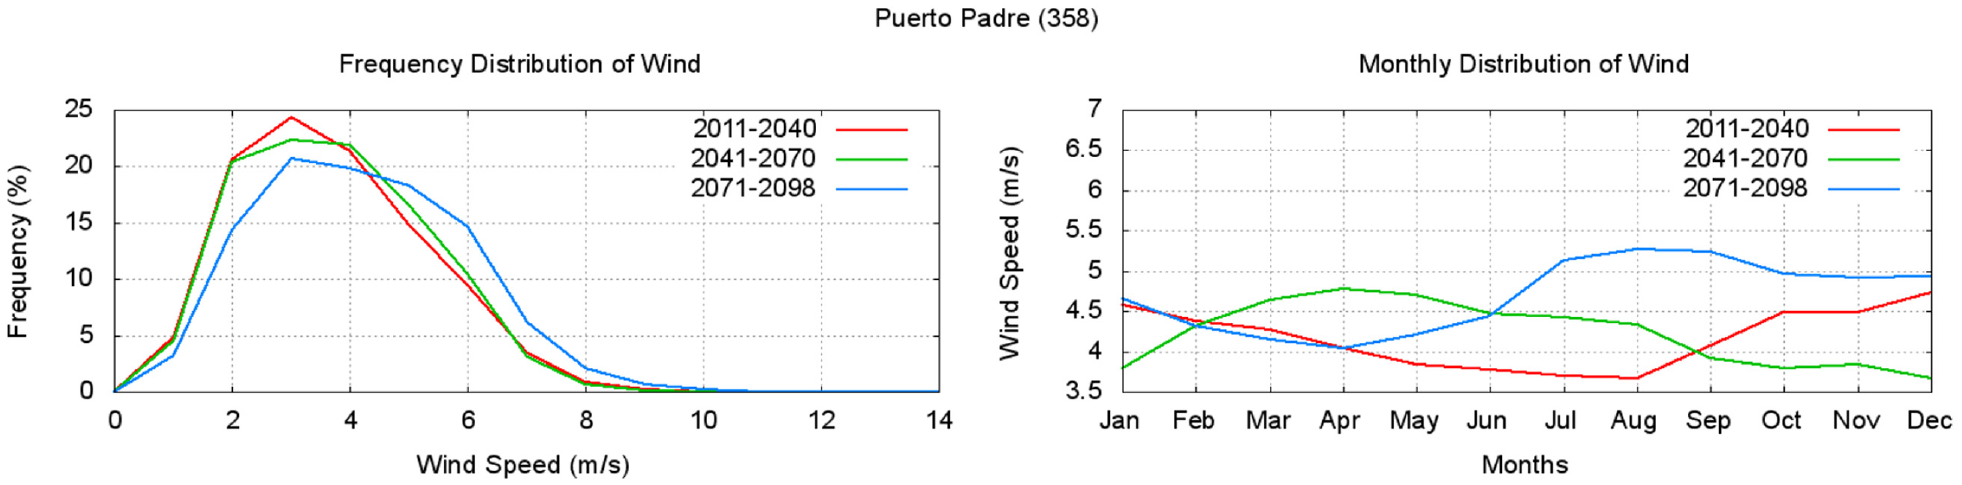
To analyze in more detail the behavior previously observed, Figures 17–19 show the distribution of the average annual wind frequency given by the PRECIS system (with the change scenario high-resolution climate control RCP8.5) and the monthly wind speed distribution for the Casa Blanca, Puerto Padre, and Maisí stations. The three stations show an upward trend in the distribution of the average annual wind frequency for values above 6
Casa Blanca 2011–2098. Graph (a): Distribution of average annual wind frequency for PRECIS in RCP8.5. Graph (b): monthly distribution of the wind speed.
Puerto Padre 2011–2098. Graph (a): Distribution of average annual wind frequency for PRECIS in RCP8.5.Graph (b): monthly distribution of the wind speed.
Maisí 2011–2098. Graph (a): Distribution of average annual wind frequency for PRECIS in RCP8.5.Graph (b): monthly distribution of the wind speed.
In places where the changes in wind speed were statistically significant, these changes were added (as the others RCPs) to the wind speed outputs of the new Cuban Wind Atlas (obtained by Alonso et al., 2019) to estimate the speed values of the wind in the three future periods. To do this, the mean wind speed map at 10 m of this new atlas was taken and the increase in wind speed was added for each of the periods previously analyzed in this work (Figure 16). As in the previous scenarios, there is a better estimate of the values that wind speeds must reach in the coming decades.
The Figure 20 shows the values that the wind speed should have at a height of 10 m in the different future periods throughout the national territory. This is of great importance for the wind energy industry in Cuba; because a significant increase in wind speed can be observed in areas of the interior and north coast of Cuba, especially in the period 2011–2040.
Average wind generated by Alonso et al. (2019) plus the increase in wind speed generated by PRECIS in RCP8.5 at 10 m high for the periods 2011–2040, 2041–2070, and 2071–2098. The values of the average wind speed are given in
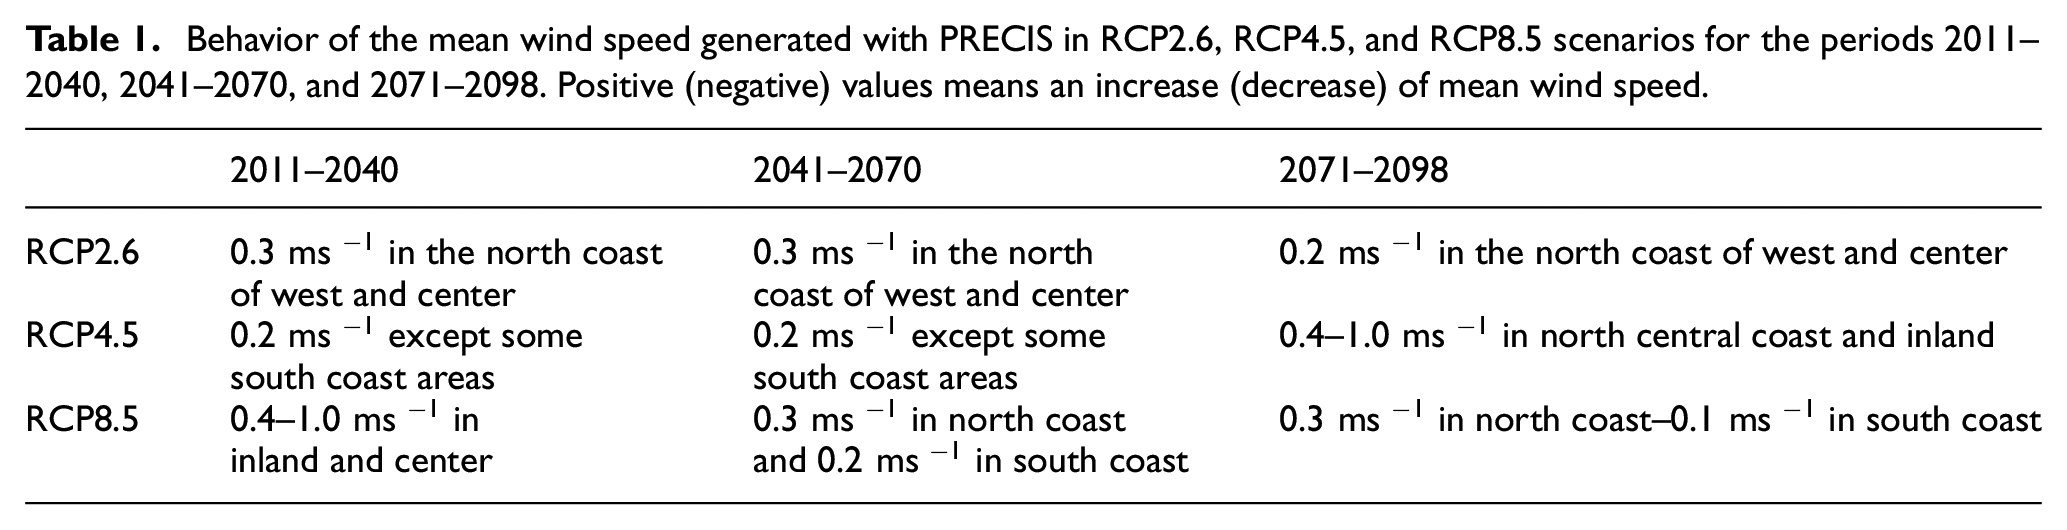
In all the emission scenarios evaluated, the projections indicate that throughout the century, the speed of the surface wind will continue to increase to a greater or lesser extent (depending on the scenario) in most of the national territory, mainly toward the coast north. However, a decrease was observed in areas of the southern coast and the Caribbean Sea by the end of the century, except for the RCP2.6 scenario, where no statistically significant changes were observed. The greatest magnitudes of increase were observed in the RCP8.5 scenario for 2011–2040 and in the RCP4.5 scenario for 2071–2098, mainly in inland regions of the island (see Table 1).
Behavior of the mean wind speed generated with PRECIS in RCP2.6, RCP4.5, and RCP8.5 scenarios for the periods 2011–2040, 2041–2070, and 2071–2098. Positive (negative) values means an increase (decrease) of mean wind speed.
The most important thing about this increase is that it allows us to consolidate the current projection of the Cuban wind program for 2030, in which the construction of 13 wind farms is proposed, precisely where the wind potential of Cuba will be increased from the second half of the century, due to the fact that an intensification and a displacement toward the west of the anticyclone North Atlantic could occur (Alonso et al., 2019; Hidalgo and Alfaro, 2014; Sierra et al., 2015; Taylor et al., 2018).
It is important to know that extrapolation of the increase in wind speed to 10 m at levels 30, 50, and 100 m above ground level, based on current vertical wind profiles, lacks physical sense. The vertical profile of the wind can vary considerably in the future due to changes in the roughness of the terrain, in the vegetation, in the type of soil, etc.; and this significantly increases the level of uncertainty. In addition, the hub height of wind turbines currently exceeds 100 and 120 m and this height is expected to be greater in the future. Taking this into account, it would be necessary to make new calculations of the vertical wind profile at the height of these wind turbines in the coming decades. It is also necessary to consider that the useful life of a wind farm is approximately 20 to 25 years, so that the future projection based on current technology would be irrelevant.
Conclusions and discussions
Wind energy resources assessment has always been a difficult challenge, even more when it comes to future predictions. Climate Change is a fundamental topic of the international scientific community due to the impacts that are expected and it is necessary to anticipate in advance to act consequently. These impacts comprise all sectors of society, including the electricity sector, which is currently being introduced within the energy matrix of renewable energy resources in Cuba. For this reason to have a tool capable of estimating the future behavior of the wind, with its uncertainties, is of great interest. In this work all the verifications were carried out at 10 m height above ground level where experimental and observational data were available. In all the emission scenarios evaluated, projections indicate that throughout the century, the speed of the surface wind will continue to increase to a greater or lesser extent (depending on the scenario) in most of the national territory, mainly towards the coast north, as an intensification and westward shift of the anticyclone North Atlantic could occur. The areas of increase in wind potential for future periods in the eastern region and northern coast of the country coincide with the current projection of the Cuban wind program. The new Wind Atlas of Cuba shows a better representation of the wind resource in the present and provides updated information on the wind resource in future scenarios. The main recommendation that emerges from this work is to use the new version of the Wind Atlas of Cuba to know in detail which are the main regions where the wind resource is available, which is essential for its efficient use as an energy source, by facilitating the selection of the most favorable places for the location of wind farms, windmills and wind turbines. An other recommendation is to extend the spectrum of simulations, combining different global and regional climate models to have an adequate number of future simulations. This would allow us to reduce the uncertainty associated with the use of a single regional climate model combined with several global models. It would also allow us to create a probability distribution function and give our results probabilistically rather than deterministically.
Footnotes
Declaration of conflicting interests
The author(s) declared no potential conflicts of interest with respect to the research, authorship, and/or publication of this article.
Funding
The author(s) received no financial support for the research, authorship, and/or publication of this article.