
Abstract
In this paper is presented an optimal control technology of wind energy system recovering energy in a battery energy accumulator. This control technology makes it possible to regulate the speed of the electric generator at its optimum value, to avoid any over-speed problems leading to strong increases in current in the electrical components of the wind turbine, and subsequently to its destruction. This control technology also makes it possible to maintain the induced electromotive forces in phase with the phase’s currents of the generator to have an additive electromagnetic torque, and in this way the recovered energy will be optimal. This control technology is based on two conversions, one is an Alternative-Continuous conversion performed by an AC-DC converter with IGBTs, and the other is a DC-DC conversion performed by a booster chopper to regulate the voltage of recharges batteries at its nominal value.
Keywords
Introduction
The major problem of wind turbines is the strong increase in speed leading to a strong increase of the current in the electrical components of the turbine, which in the most cases leads to the destruction of these components. In this context, several research works deal with this problem. For example, in Deshpane (2015), analytical and experimental torque calculations of permanent axial magnet eddy-current brake are presented for wind braking systems. Also a study presented in Kang and Lee (2016), concerns the use of braking by eddy-current. These techniques are recent, but they require a complex control system. In Nasri and Tounsi (2017) is presented a braking method using hydraulic systems. This study is also recent, but it is expensive, and it requires a high maintenance cost of the mechanical components. These mechanical systems also lead to dangerous vibrations which can cause deterioration of mechanical components. In addition, modern methods used for electrical systems design are based on analytical calculations of design parameter considering that this method is compatible with stochastic optimization methods as shown in Tounsi (2021, 2022) and Shin et al.(2013). For this reason, this study is based on the design of the power chain components by analytical method.
On the other hand, the study presented in this paper concerns the regulation of the turbine speed at the nominal value by an AC-DC converter controlling the magnitude of the phase currents of the generator and imposing the electromotive forces in phase with the phase’s currents of the generator to have an additive electromagnetic torque, and in this way the recovered energy will be maximized. Another point is taken into account by this study is the adjustment of the battery recharging voltage to its optimum value to recover the maximum amount of energy. The studied system is less expensive compared to the existing equivalent systems, since the energy conversion only requires an AC-DC converter and a booster chopper.
In this context the paper is organized as follows:
Description of the control strategy.
Modeling of the wind turbine under the simulation environment Matlab-Simulink.
Description of simulation results.
Conclusions and perspectives.
Control strategy
The power chain is illustrated in Figure 1. It comprises an horizontal axis propeller for transferring kinetic energy to a synchronous generator with permanent magnets. The synchronous generator converts kinetic energy into electrical energy. An AC-DC converter is controlled in such a way as to regulate the generator’s speed at its optimal rated value. A DC-DC inverter is used to ensure a continuous recharging of the energy accumulator. Indeed, the AC-DC converter outputs a DC voltage equal to the nominal voltage of the energy accumulator. The applied control technique makes it possible to maintain the recharging voltage of the batteries constant equal to its nominal value in order to guarantee recharging of the batteries in optimal regime, whatever the speed of the wind. This control technique helps to protect the components of the power chain against over-current. The control algorithm makes it possible to regulate the phase’s currents in phase with the induced electromotive forces to have an additive electromagnetic torque leading to the maximization of the battery recovered energy. This operating regime makes it possible to optimize the power transferred from the generator to the energy accumulator.

Wind energy generation chain structure.
In conclusion, the wind energy system operates at its optimal regime with protection against over-peed accompanied by over-current in the electrical components.
The vector diagram of synchronous generator operation is shown in Figure 2.
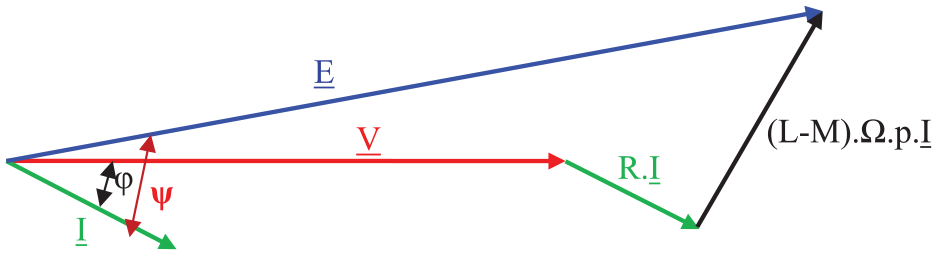
Vector diagram of synchronous generator.
Where V is the phase’s voltage vector, E is the induce electromotive force vector, I is the phase’s current vector, L is the phase’s inductance, M is the phase’s mutual inductance, Ω is the generator angular speed, and p is the number of poles pairs.
For a neglected equivalent generator phase’s inductance and a control of the AC-DC inverter maintaining stator phase currents in phase with induced electromotive forces, the equivalent vector diagram is shown in Figure 3. In this case, the angle ψ is equal to zero and the turbine is at the optimal functioning regime.
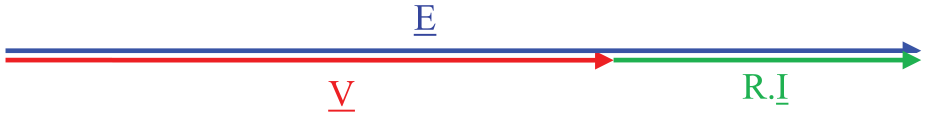
The equivalent vector diagram.
The structure of the AC-DC converter is illustrated in Figure 4.
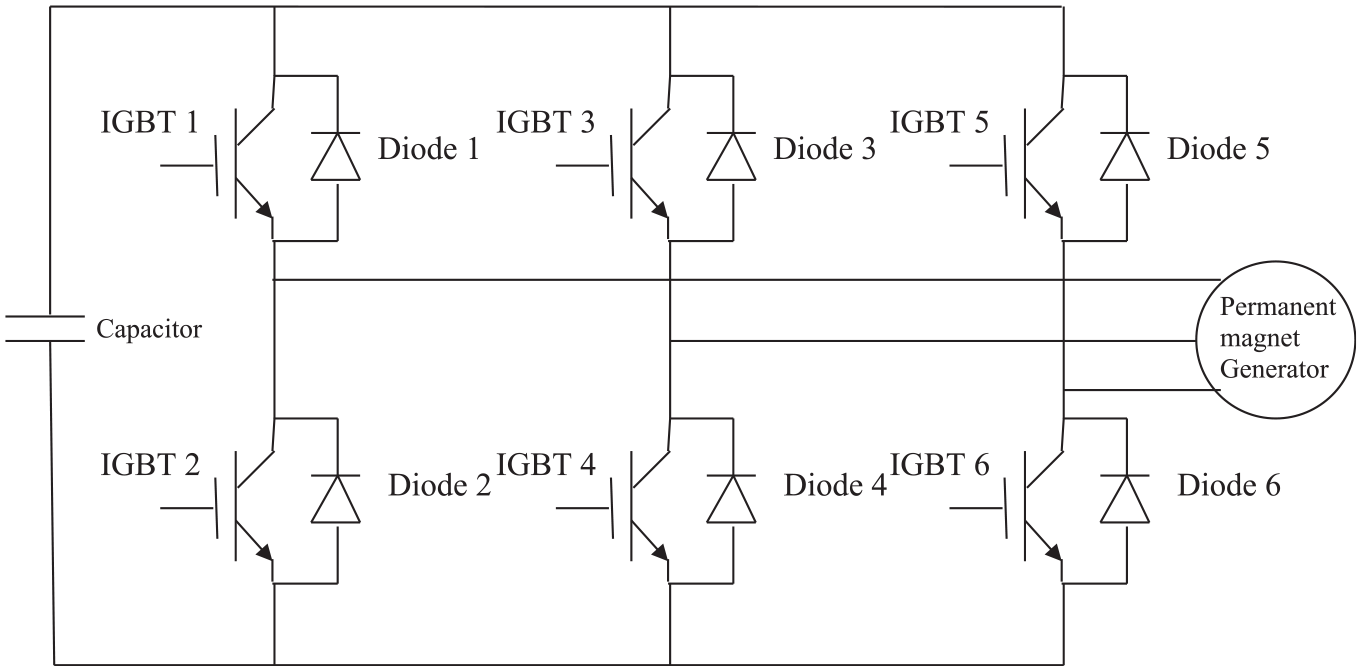
AC-DC converter structure.
Modeling of the wind energy generation chain components
Equation of motion
The equation of the motion of rotating parts is deduced from the fundamental relation of dynamic (Ben Amor et al., 2015; Buticchi et al., 2012; Kang, 2017; Kim et al., 2010; Nhidi et al., 2015; Tounsi, 2015):

where J is the moment of inertia of the rotating parts, rd is the gear ratio, Tm is the torque imposed on the motor shaft caused by the movement of the wind, Tem is the electromagnetic torque, Tmec is the torque due to the mechanical losses, and Tiron is the torque due to iron losses.
The different torques are expressed by the following equations (Ben Amor et al., 2015; Buticchi et al., 2012; Kang, 2017; Kim et al., 2010; Nhidi et al., 2015; Tounsi, 2015) :

where 1.918 is a coefficient that depends on the wind kinetic energy and blades proprieties, Rp is the blades radius and Vwind is the wind speed.

where s is a dry friction coefficient, k is a viscous friction coefficient, γ is a fluid coefficient of friction, and Ω is the angular speed of the electric generator.

where q is the quality coefficient of sheet, f is the stator frequency, Mcs is the mass of the stator yoke, Bcs is the magnetic induction in the stator yoke, Mds is the mass of the stator teeth, and Bd is the magnetic induction in the teeth.

Where ia,b,c and ea,b,c are respectively the currents and the electromotive forces of the phase a, b and c.
The implementation of this equation under Matlab/Simulink environment is illustrated by Figure 5:
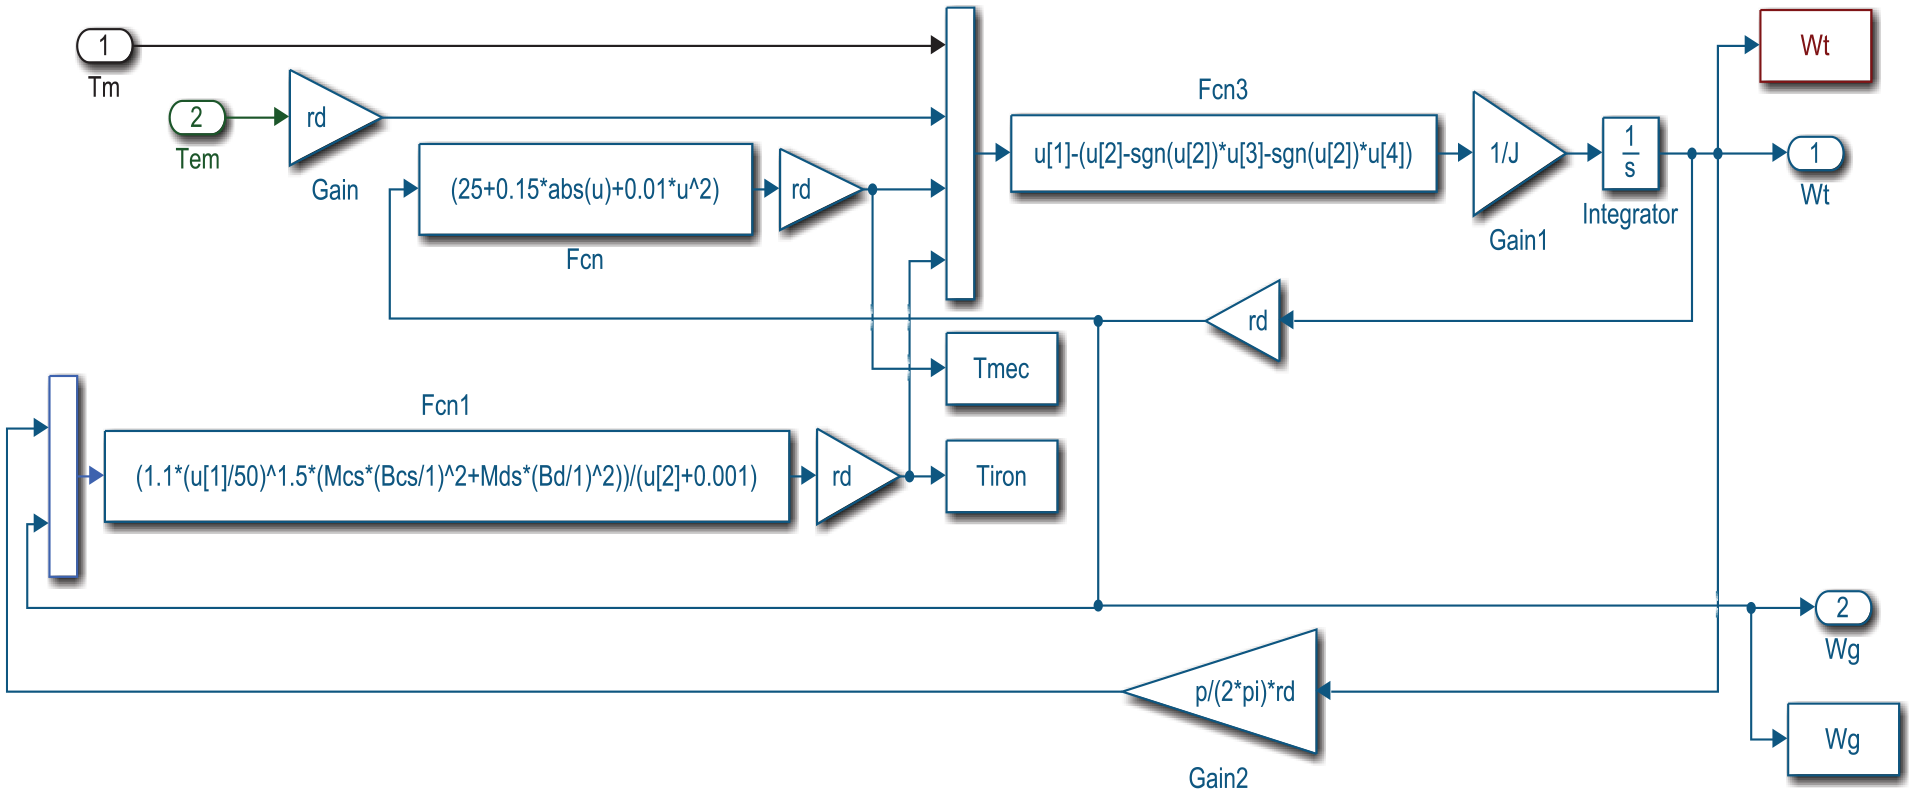
Simulink model of the motion equation.
Induced electromotive forces
The three induced electromotive forces ea, eb, and ec are expressed by the following three equations (Ben Amor et al., 2015; Buticchi et al., 2012; Kang, 2017; Kim et al., 2010; Nhidi et al., 2015; Tounsi, 2015) :


where Ke is the electric constant of the generator.
The Simulink model of the induced electromotive forces is illustrated in Figure 6.
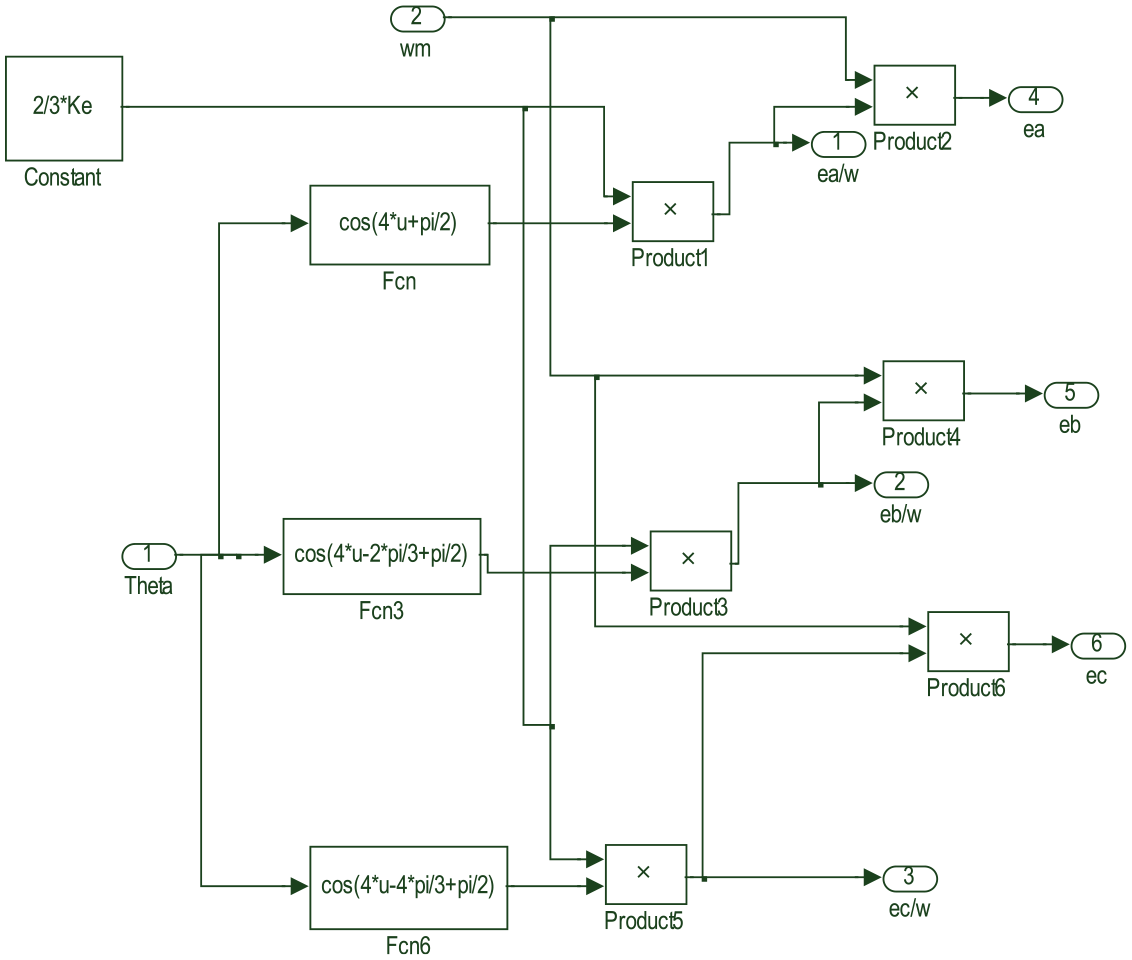
Simulink model of the induced electromotive forces.
Battery load voltage regulator
The battery load voltage regulator generates the amplitude of the reference voltages minimizing the error between the reference battery load voltage and the measured one. Indeed, the reference load voltage is compared to the measured load voltage. The comparator output drives a proportional-Derivative-Integral controller type (PID) to provide the amplitude of the reference voltage minimizing the error between the reference load voltage and the measured load voltage of the battery.
The Simulink model of the battery load voltage regulator is illustrated in Figure 7.
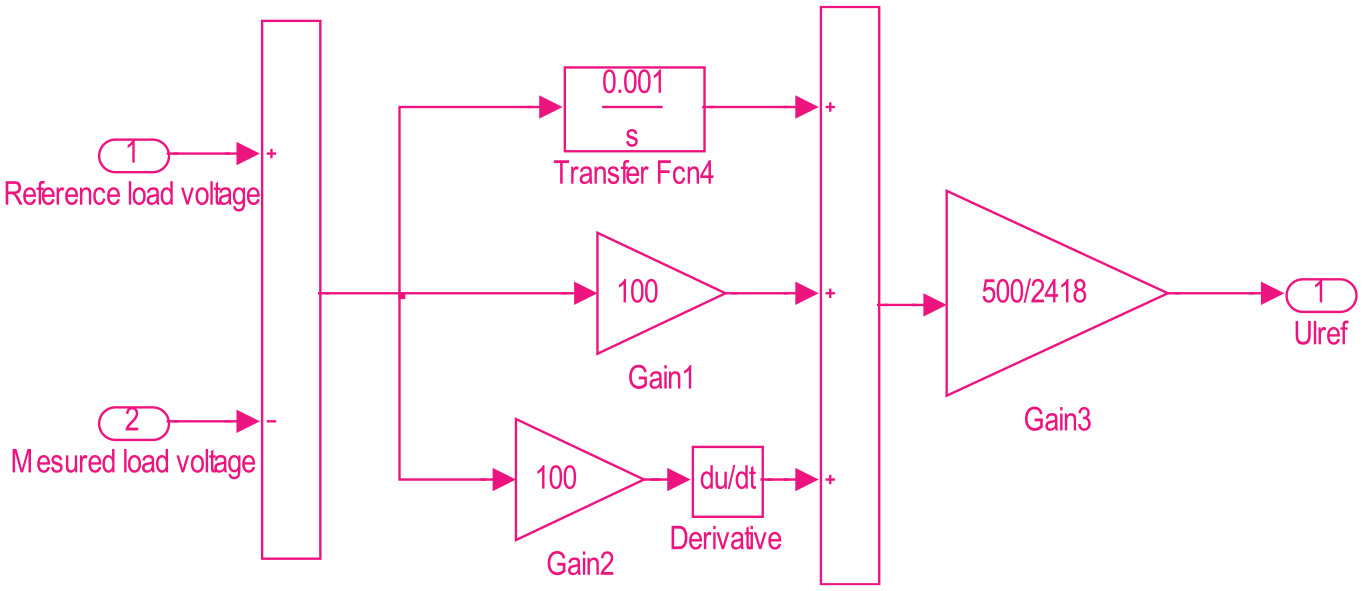
Accumulator load voltage regulator.
Generator speed regulator
The generator angular speed is regulated at its rated value by regulation of the magnitude and the phase of electric currents. A proportional-Derivative-Integral (Figure 8) is used to generate the amplitude of the reference voltages necessary to control the magnitude of the phase currents and thereafter the electromagnetic torque influencing the useful torque of the turbine.
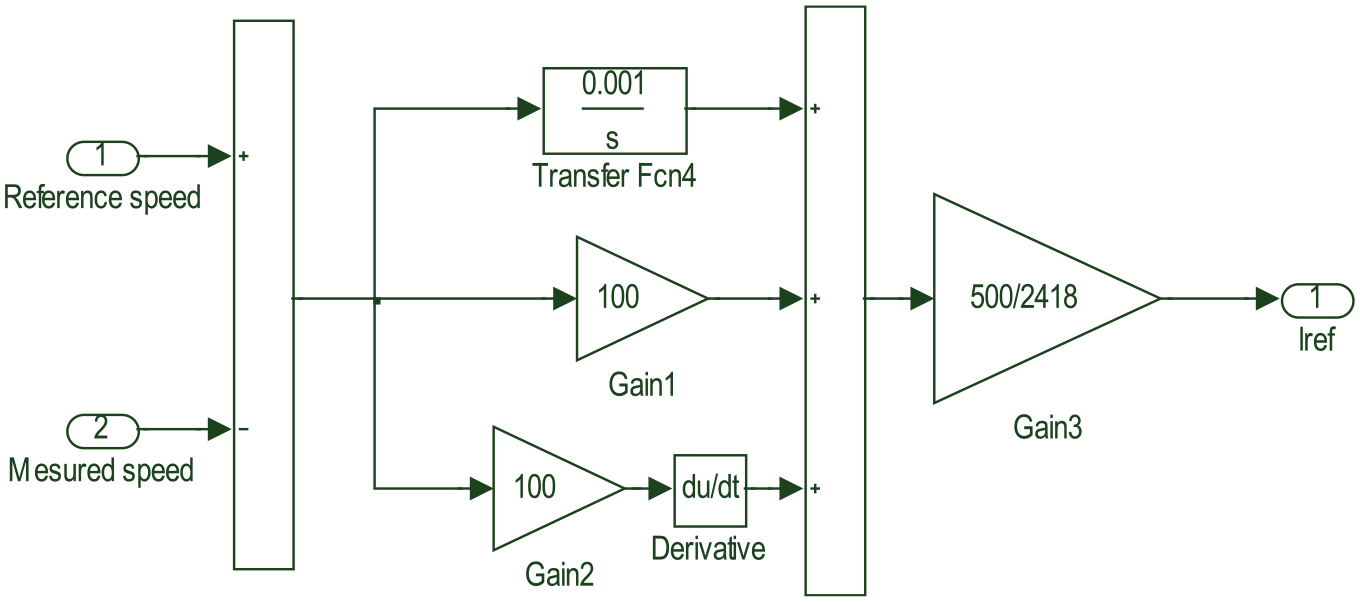
Generator speed regulator.
Voltages regulator allows to impose phase’s currents having the same shape and in phase with the induced electromotive forces to have an adding electromagnetic torque and thereafter an optimal recovered energy. Figure 9 presents the Simulink model of phase’s voltages regulator.
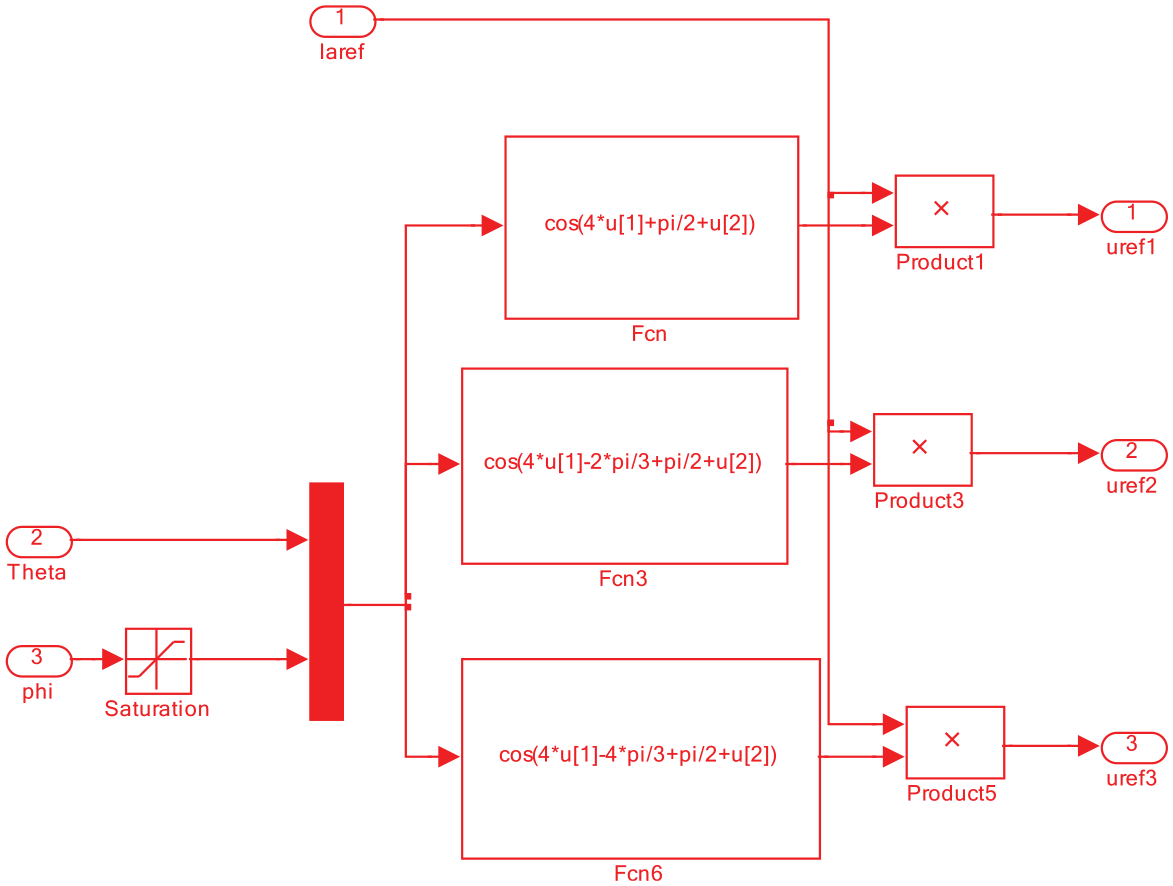
Model of voltages regulator.
Control signals generator
The control signal generator compares the three reference voltages to a triangular signal having a frequency much greater than the voltages provided by the regulators of the currents. The output of each comparator drives a hysteresis variant between “0” and “1” logic to reproduce the suggested form of the control signals of the IGBTs (Insolated Gate Bipolar Transistor) transistors.
The control signals of the IGBTs S2, S4, and S6 are respectively complementary to the signals S1, S3, and S5 to avoid short circuits. In addition, the control pulses of the signals S2, S4, and S6 are shortened to avoid duplication between the two control signals of an arm. The Simulink model of the control signals generator is illustrated in Figure 10.
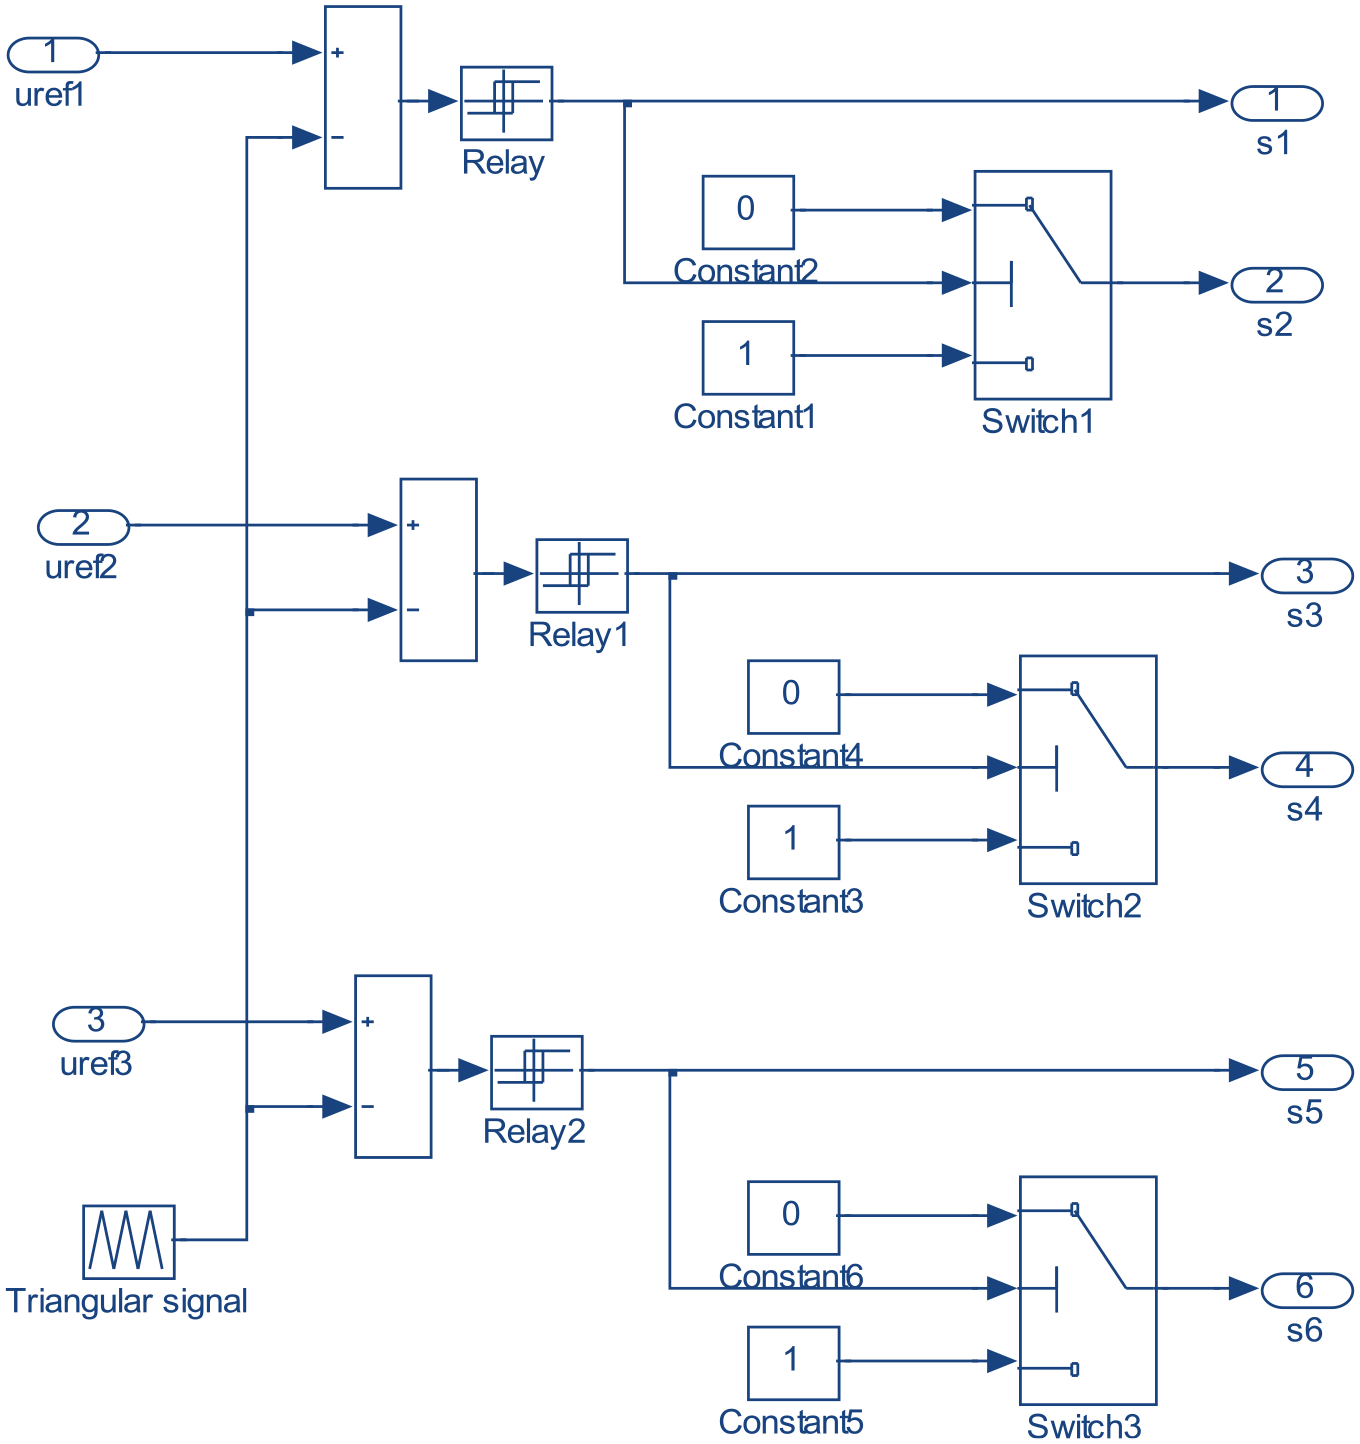
Model of the control signal generator.
Model of generator-converter assembly
Each phase of the generator is equivalent to a resistor in series with an inductance and an induced electromotive force. The generator three phase’s model is described by the following equations (Ben Amor et al., 2015; Buticchi et al., 2012; Kang, 2017; Kim et al., 2010; Nhidi et al., 2015; Shin et al., 2013; Tounsi, 2015):


where R, L, and M are respectively the resistance, the inductance and the mutual inductance of the phases a, b, and c, ia,b,c, ea,b,c, and va,b,c are respectively the currents, the induced electromotive forces and the voltages of the phase a, b, and c.
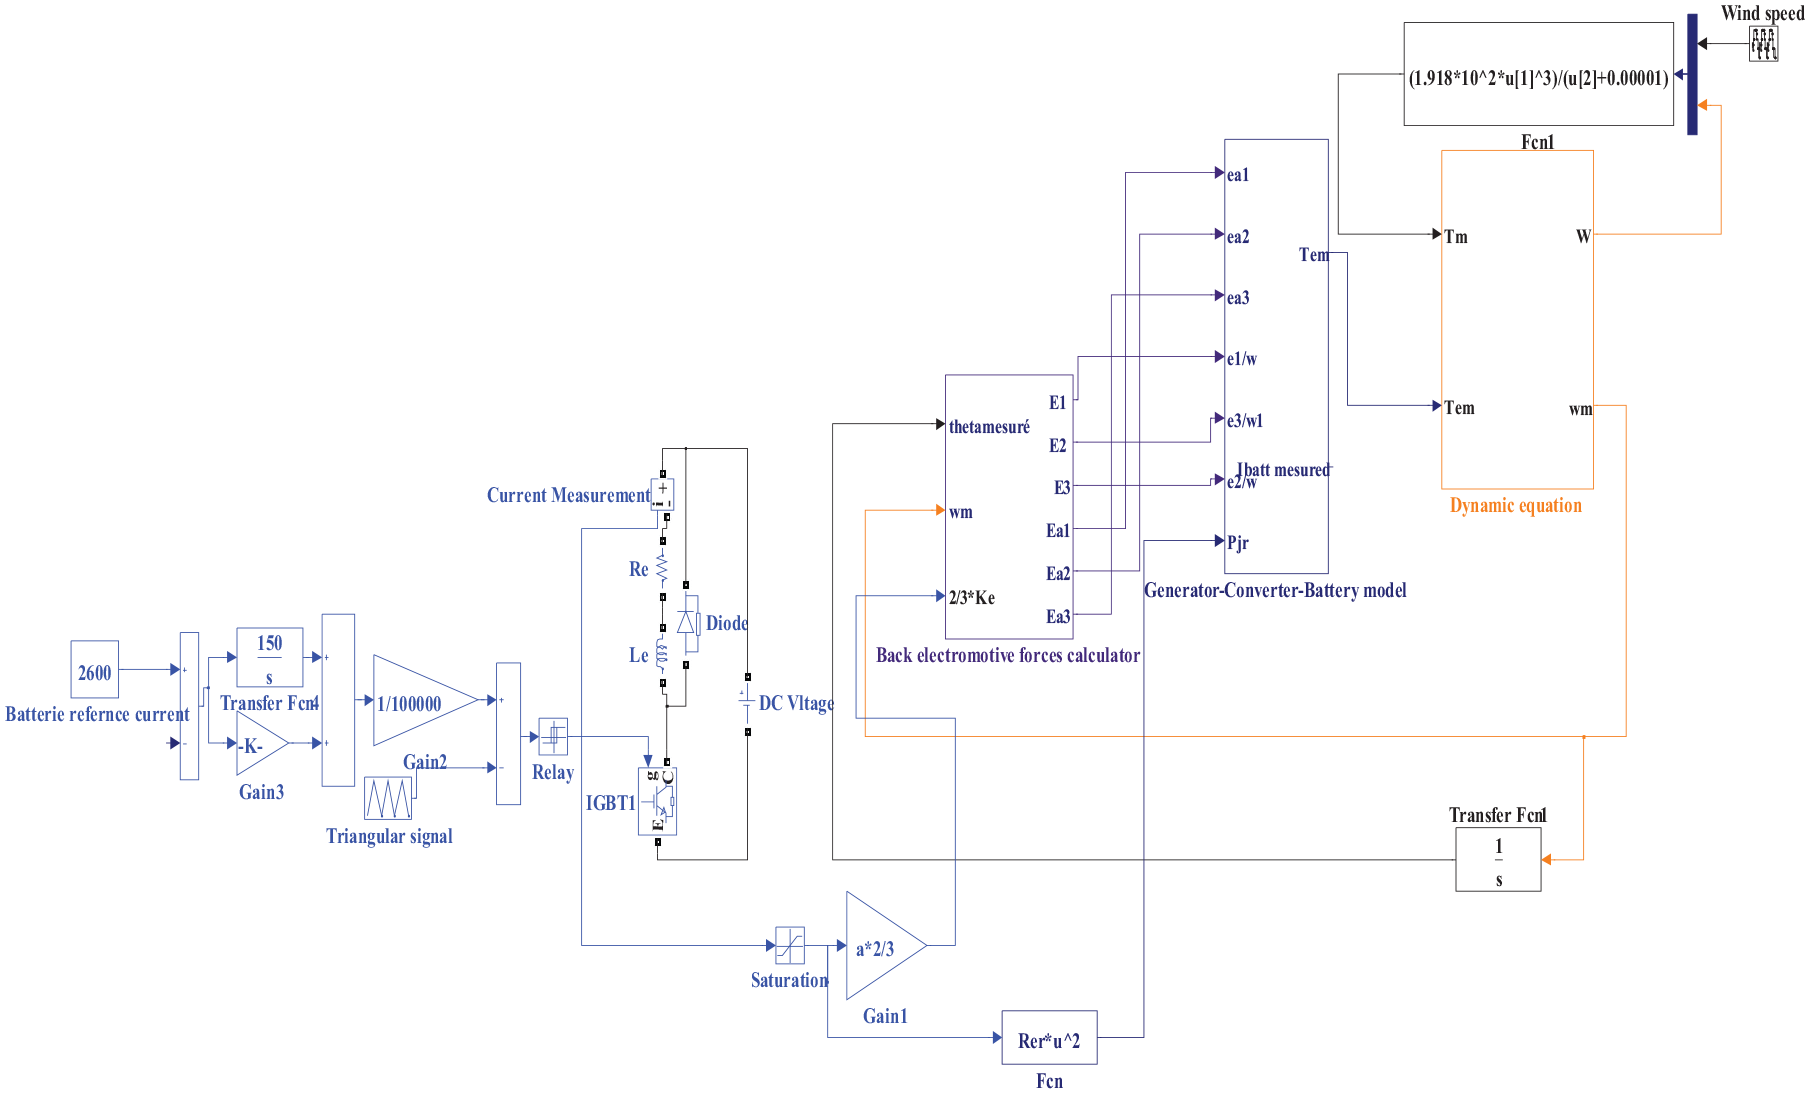
The model of the generator-converter-battery assembly is implanted under Matlab-Simulink according to Figure 11.
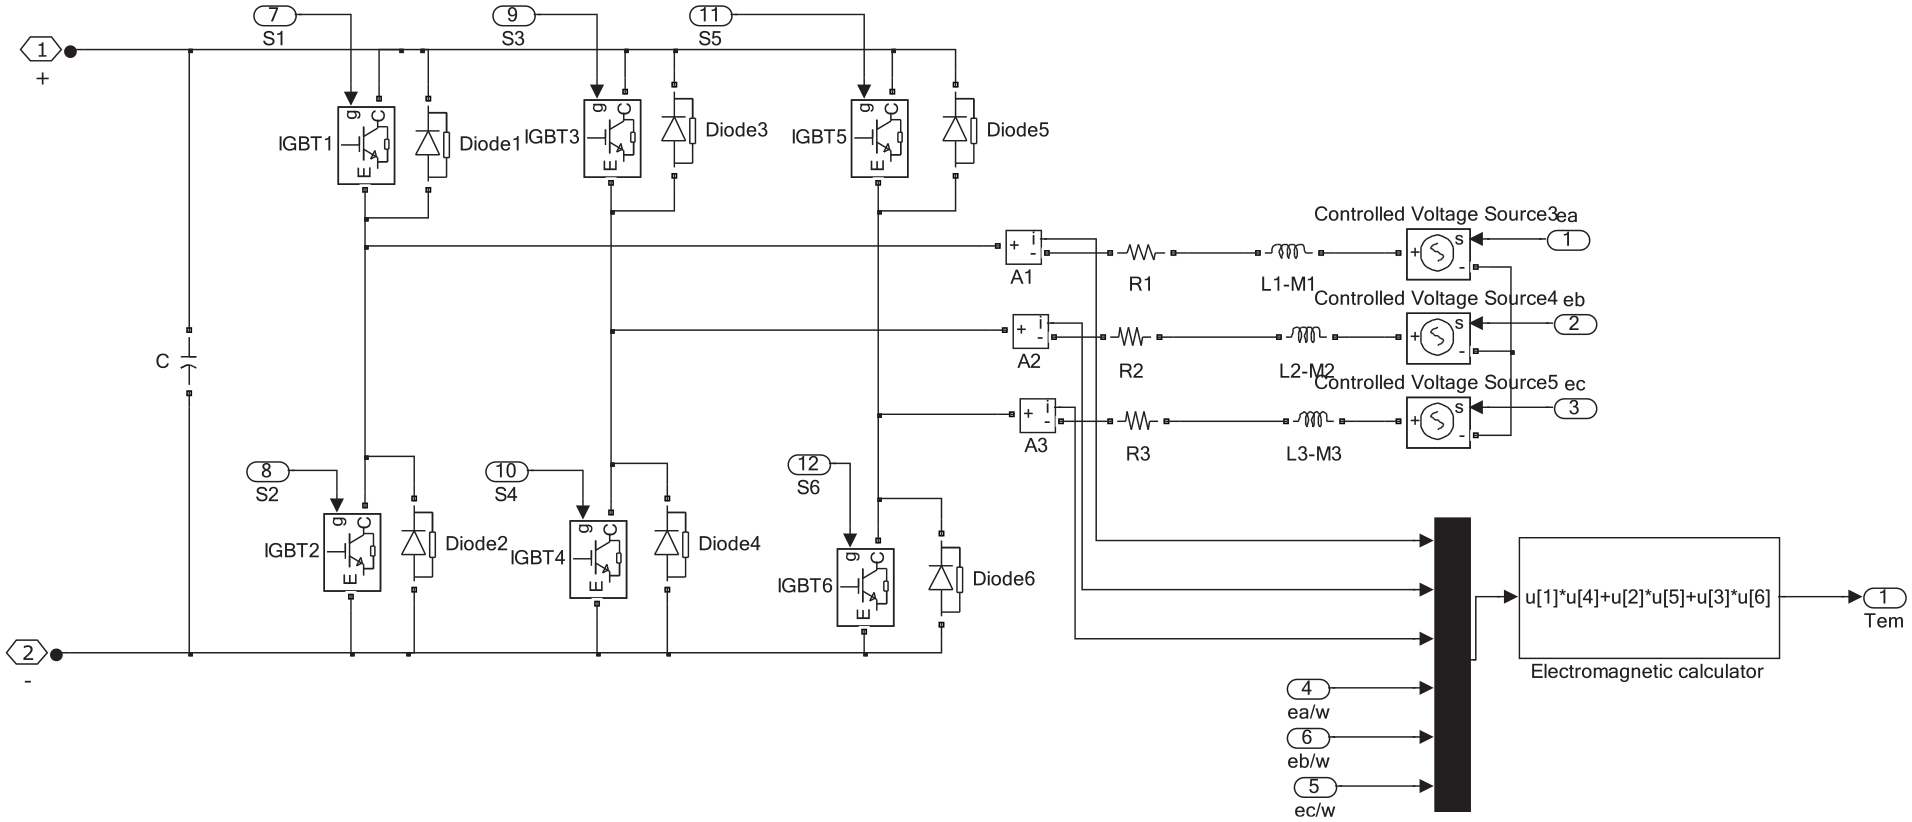
Model of the generator-converter.
DC-DC inverter pulse width modulation control
The use of a DC-DC inverter (Figure 12) is in the goal to regulate the charging voltage of the battery. Indeed, the reference charging voltage is compared to the measured response voltage. The output of the comparator attacks a Proportional-Derivative-Integral regulator to generate the ideal reference voltage regulating the charging current at its desired value. In addition, the reference voltage is modulated by a triangular signal and a hysteresis variant between logical “0” and “1.” The value of the inverter inductance is adjusted iteratively to reduce the charging voltage fluctuations. The switching frequency is reduced to 100 Hz to reduce the electromagnetic interference and noise.
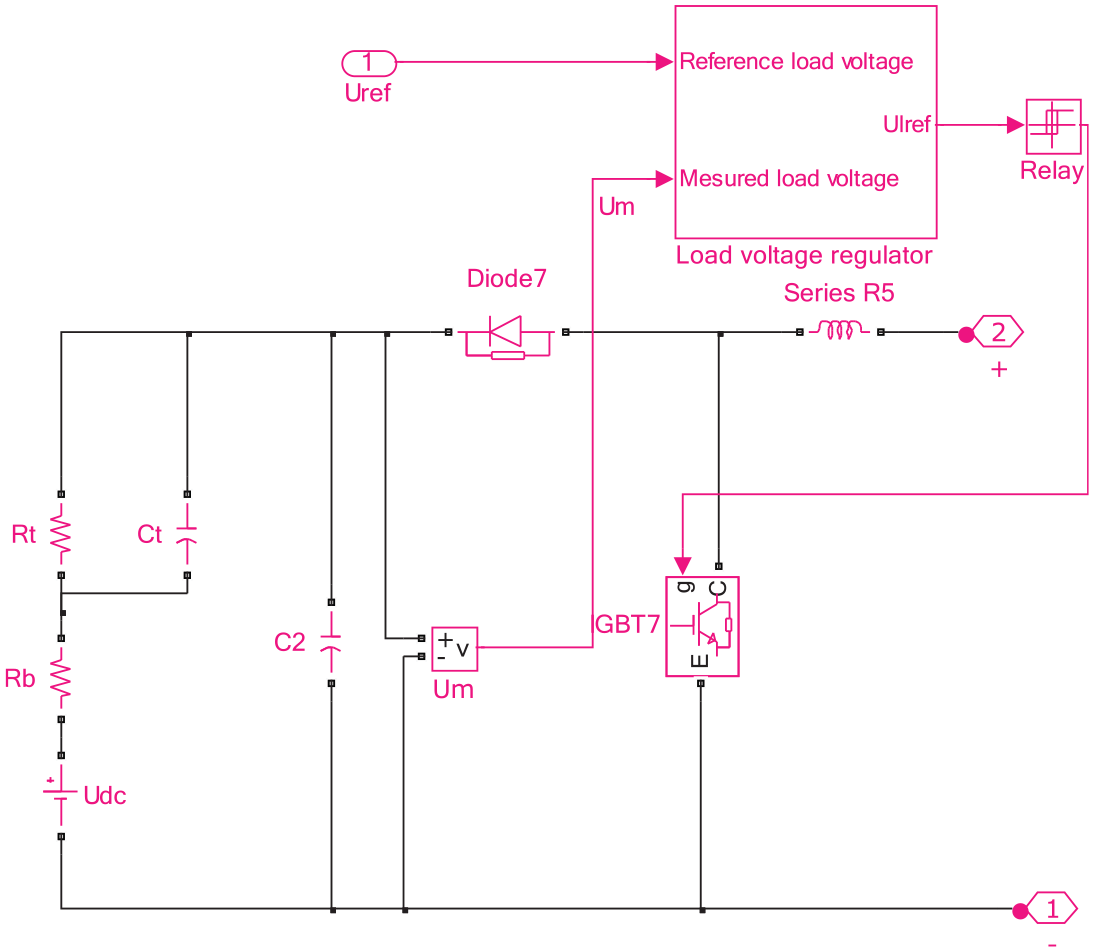
DC-DC inverter regulating battery load voltage by pulse width modulation.
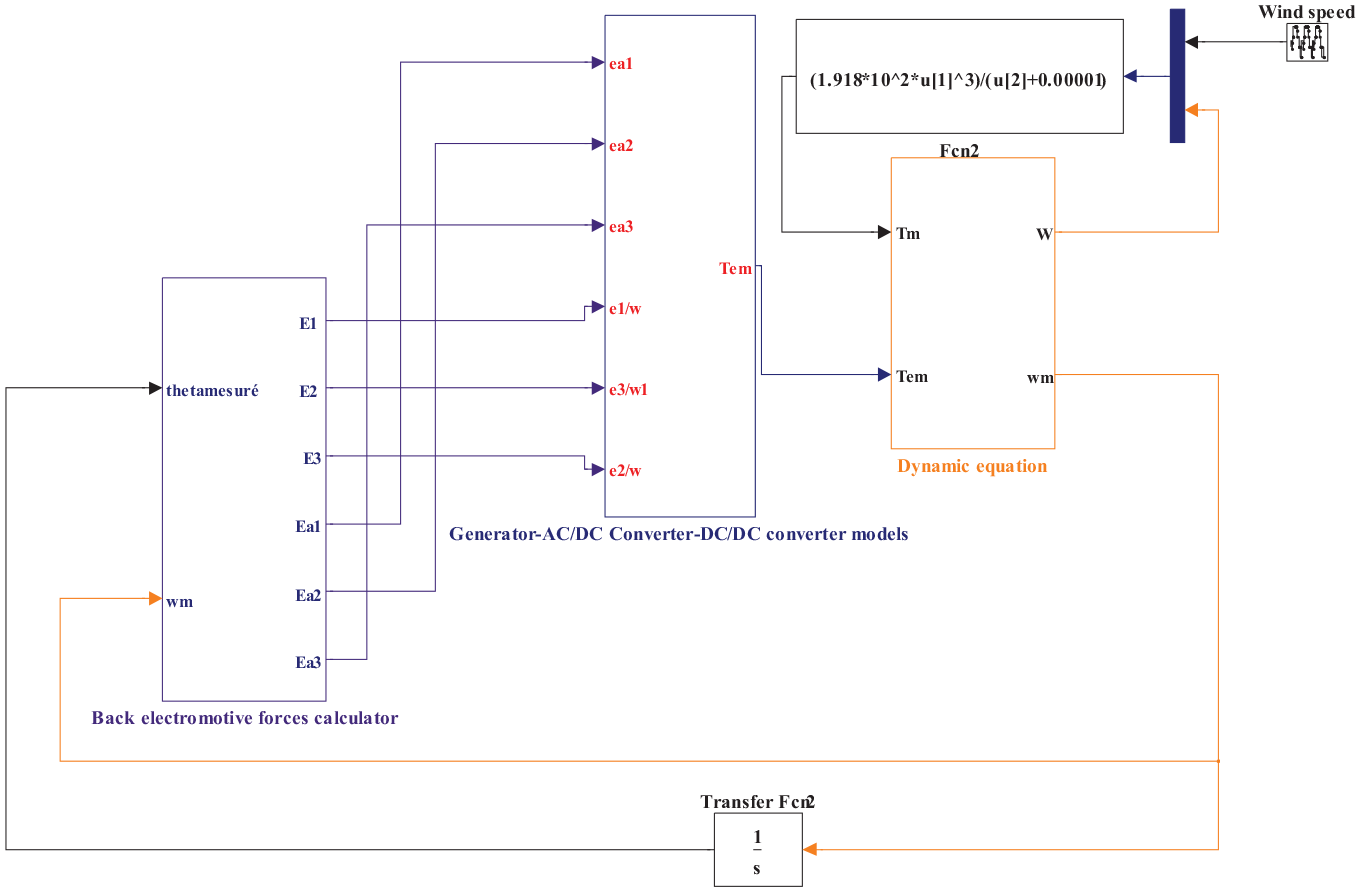
Generation chain global model
The coupling of different sub-models of the wind energy generation chain leads to the global model implanted under the Matlab-Simulink environment as given in Figure 13.
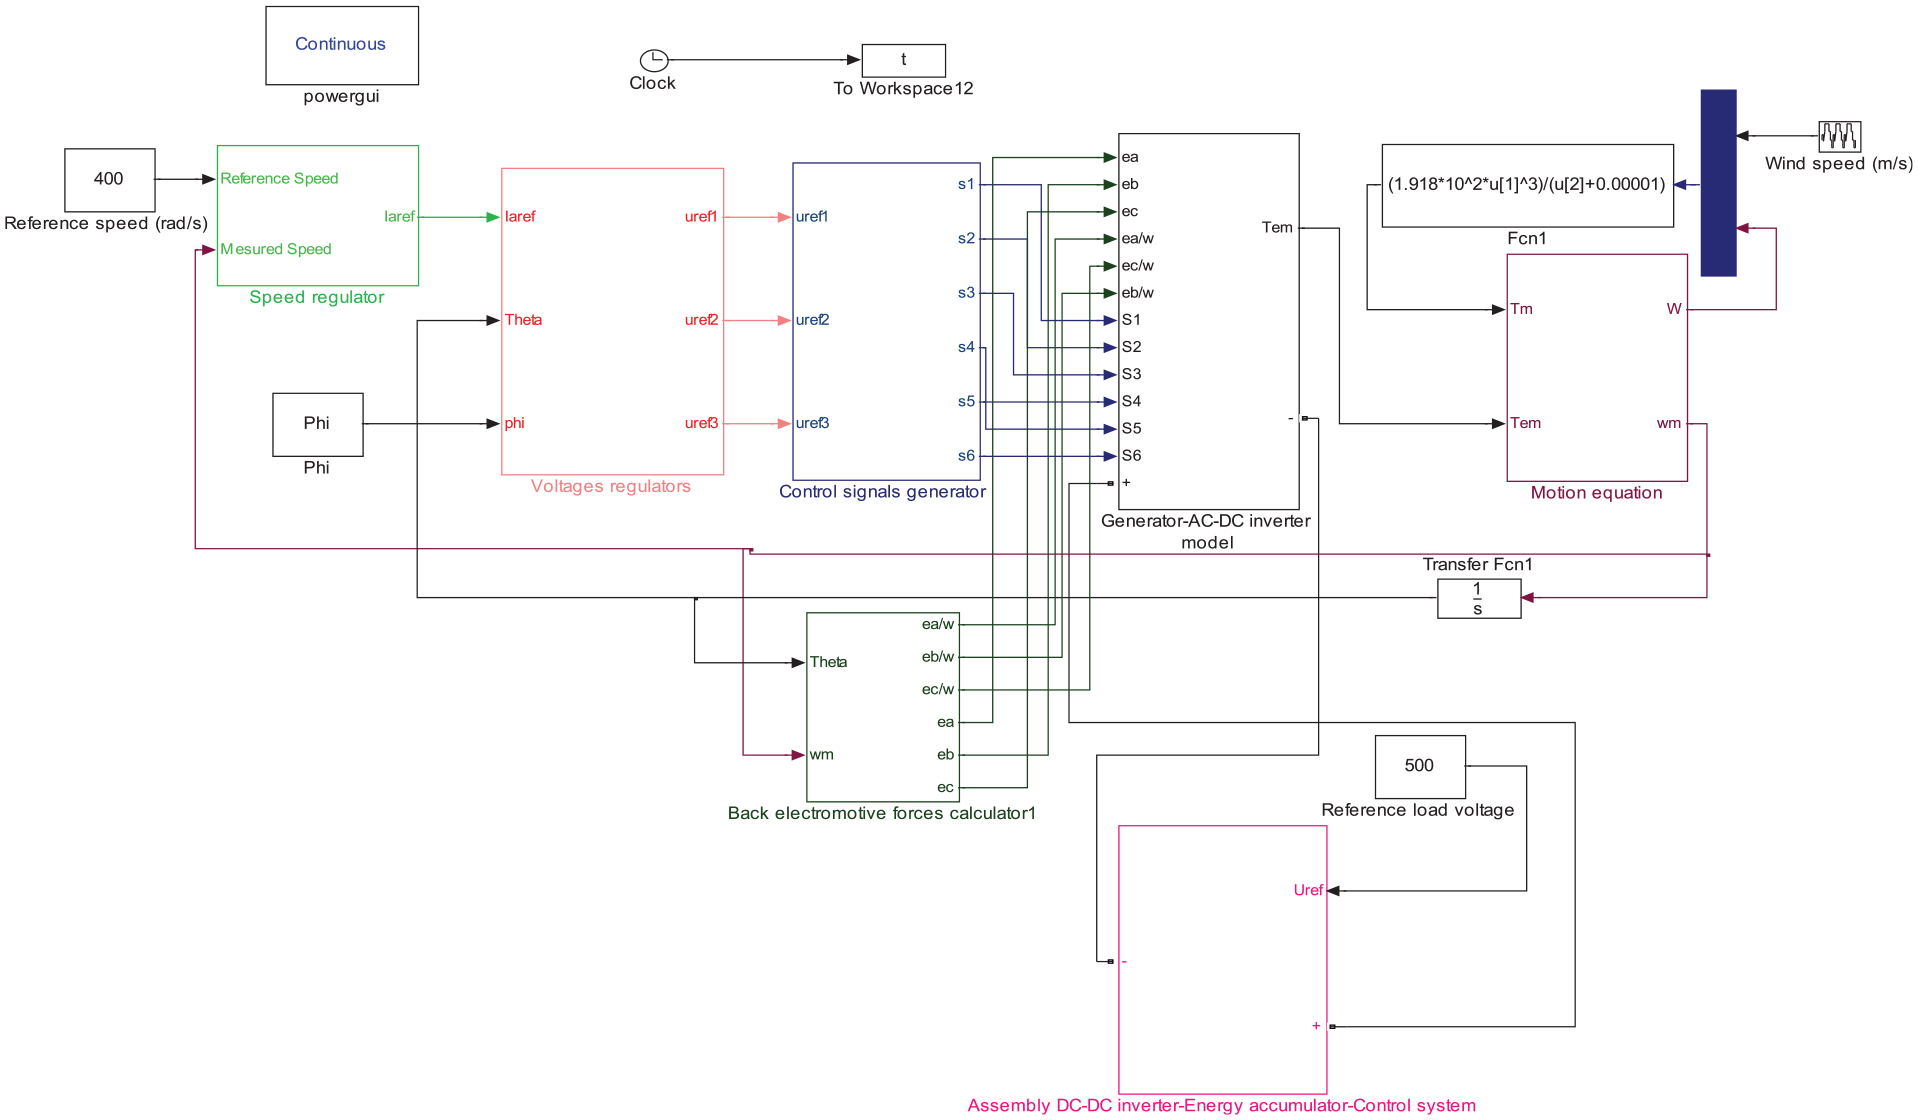
Global model of the wind energy generation chain.
Classical models of wind energy systems
Conversion chain structures
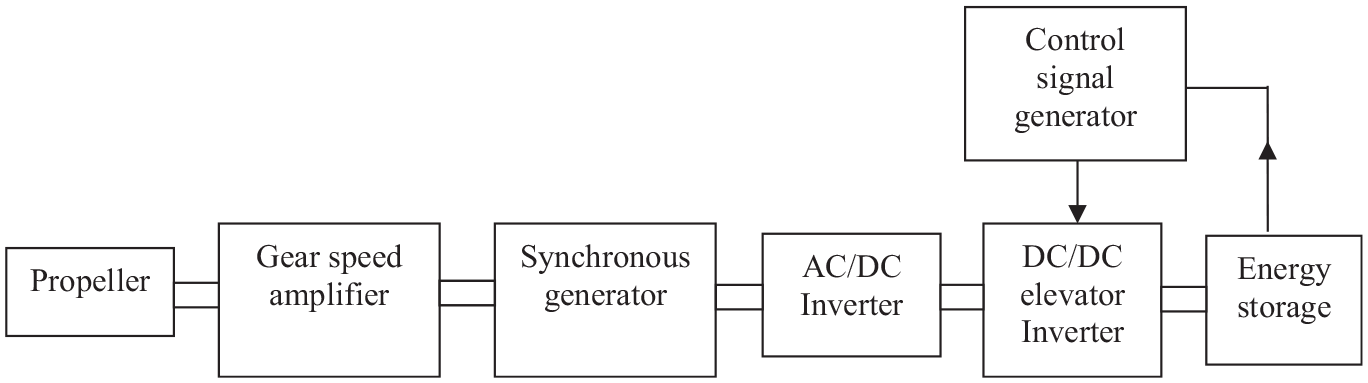
Figures 14 to 16 illustrate the principal of existing wind energy system.
Structure of the power chain with current regulator.
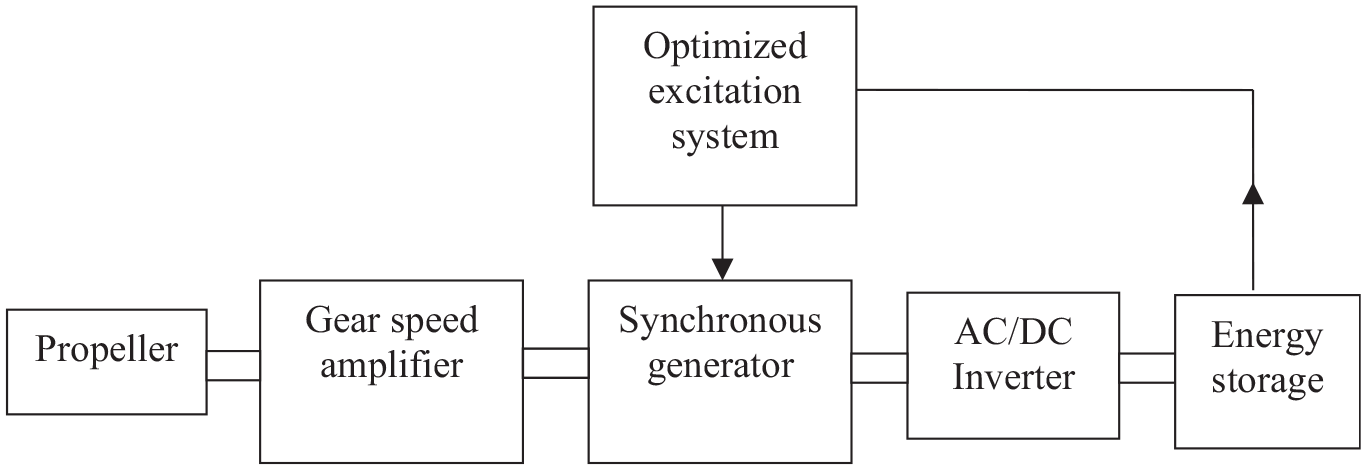
Structure of the power chain with excitation current regulator.
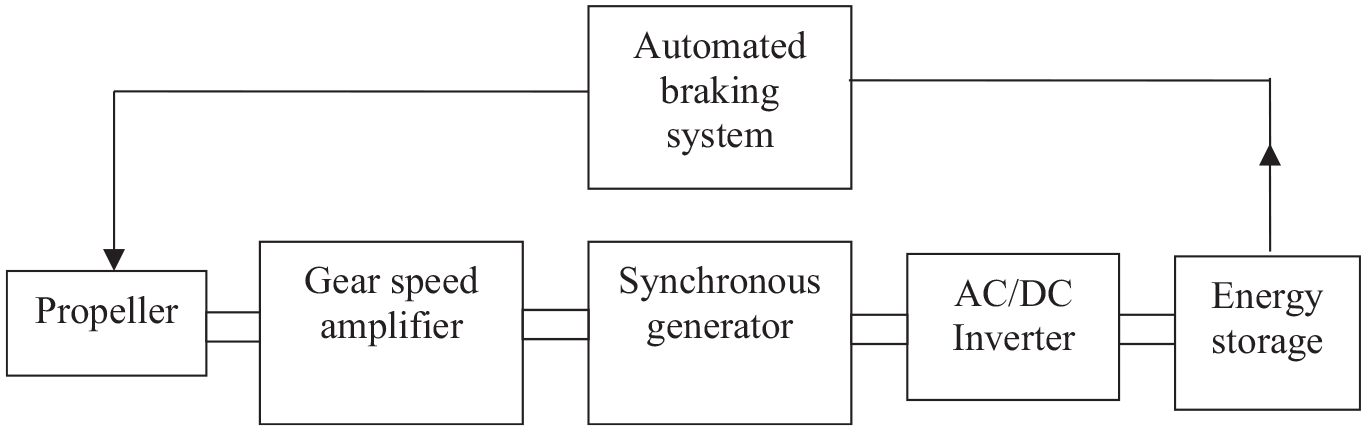
Structure of the power chain with braking system.
Models of the conversion chain structure
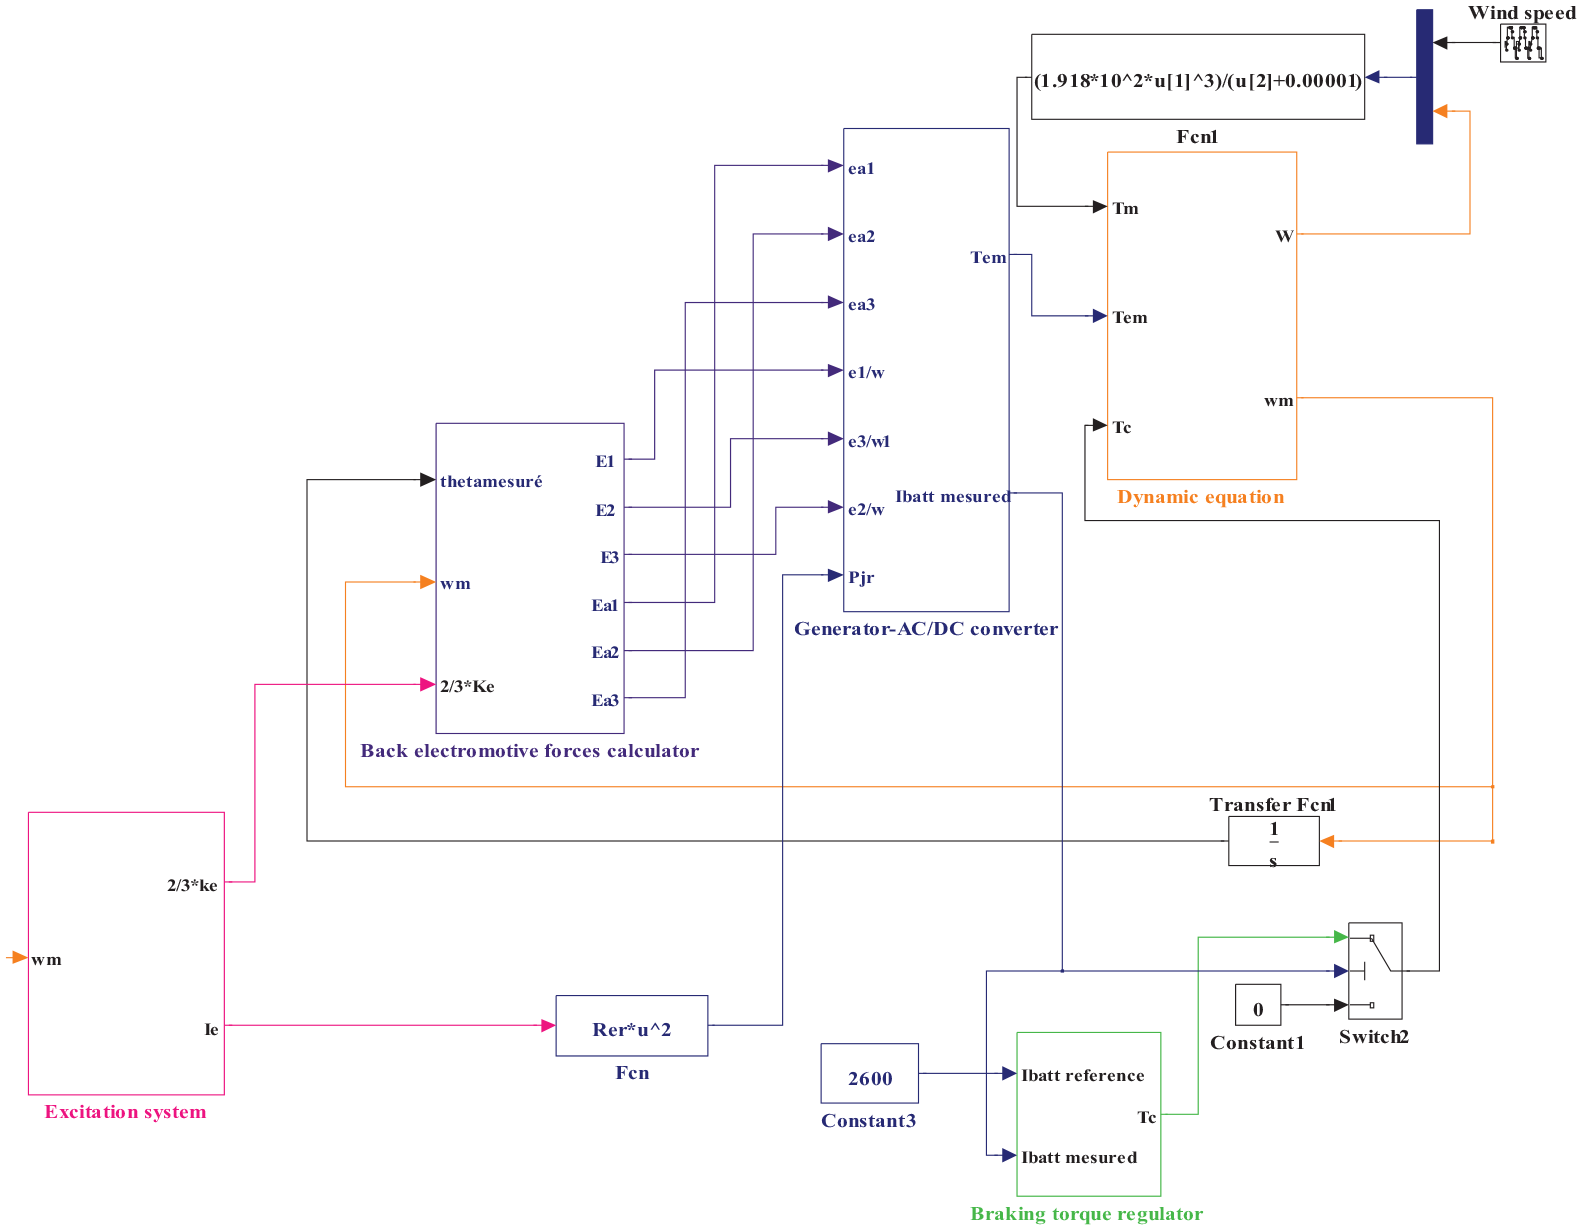
Based on studies presented on Shin et al. (2013), Nhidi et al. (2015), and Ben Amor et al. (2015), the conversion chain models are presented in Figures 17 to 19.
Simulink model of the global energy generation chain with braking system.
Simulink model of the global energy generation chain with current regulator.
Simulink model of the global energy generation chain with excitation current regulator.
Simulation results and discussion
Rated functioning regime of the turbine
Simulations of the power chain model are realized according the data extracted from wind turbine analytical model as shown in Table 1.
Simulation parameters.
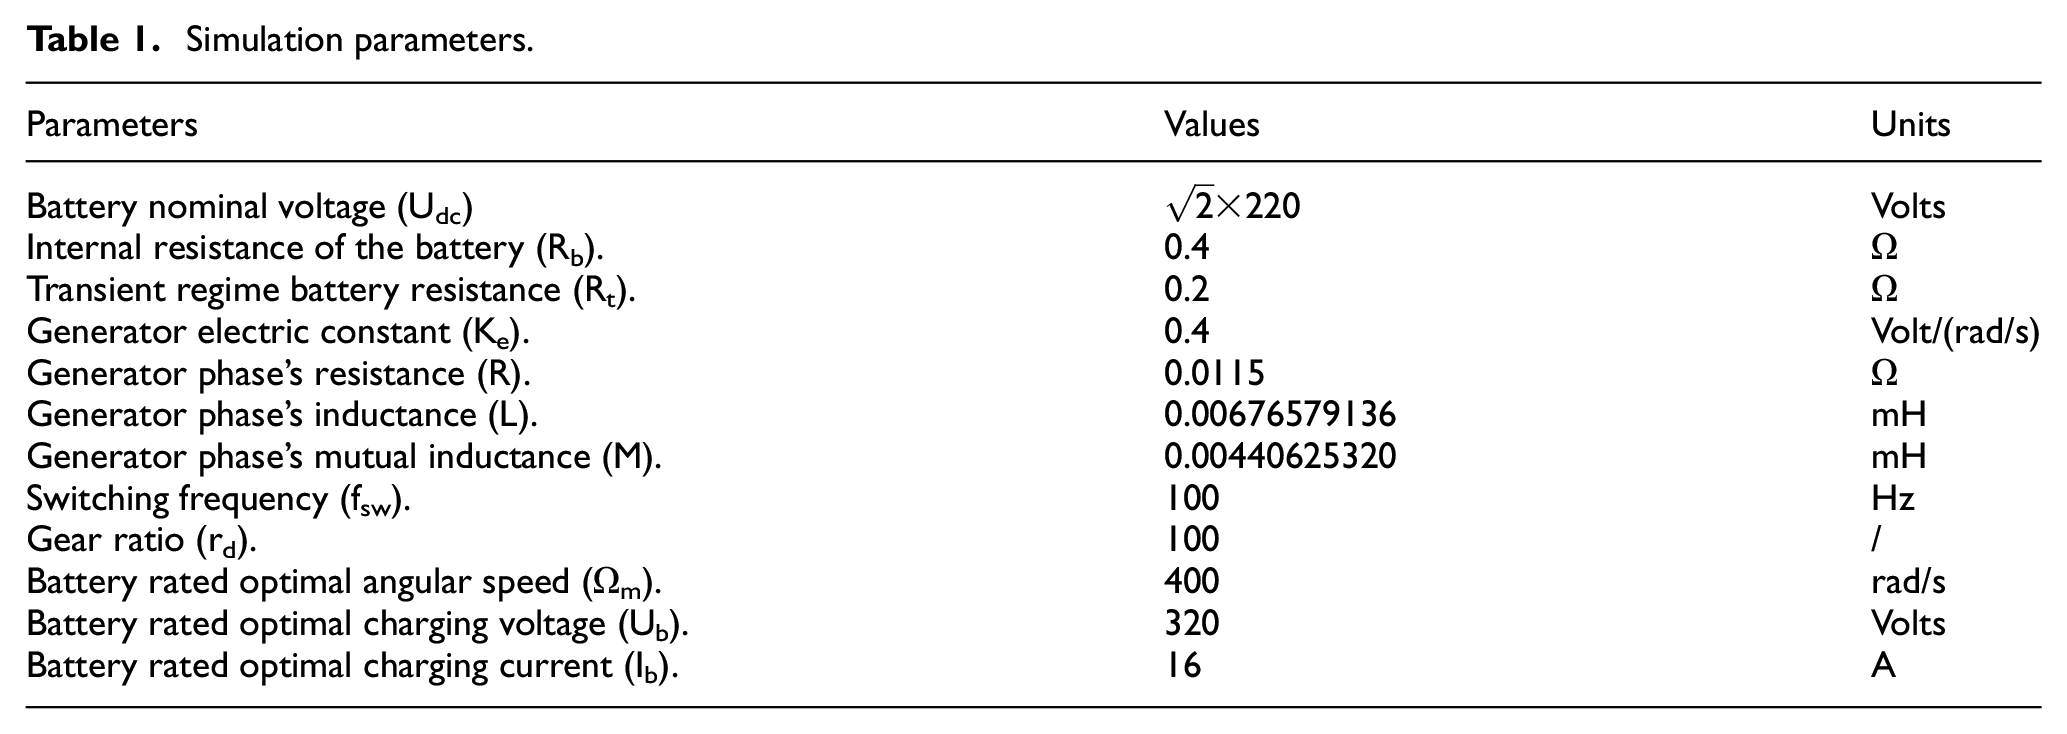
Figure 20 illustrates the wind speed cycle. Figure 20 shows that the wind speed cycle includes zones of wind over-speed and wind abrupt change of speed, this speed cycle is used to analyze the behavior of the wind turbine for critical operating points, allowing to increase the performance of the wind turbine in the case of operation with natural climatic conditions.
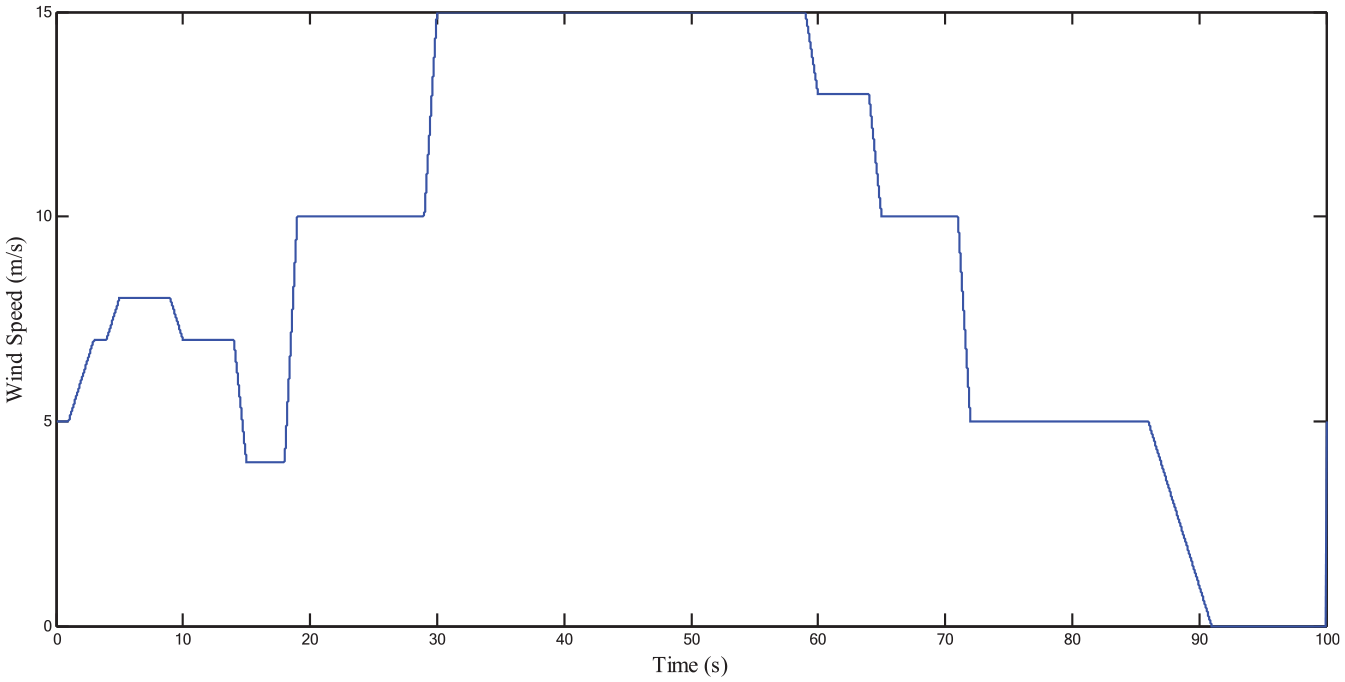
Wind speed variation in versus time.
The evolution over time of the rotational angular speeds of the generator is given by Figure 21. Figure 21 illustrates that the angular speed of the generator is regulated at its nominal value relating to optimal functioning regime. This regulation is used to set the magnitude of the induced electromotive forces in its optimal value. This property valid the global study.
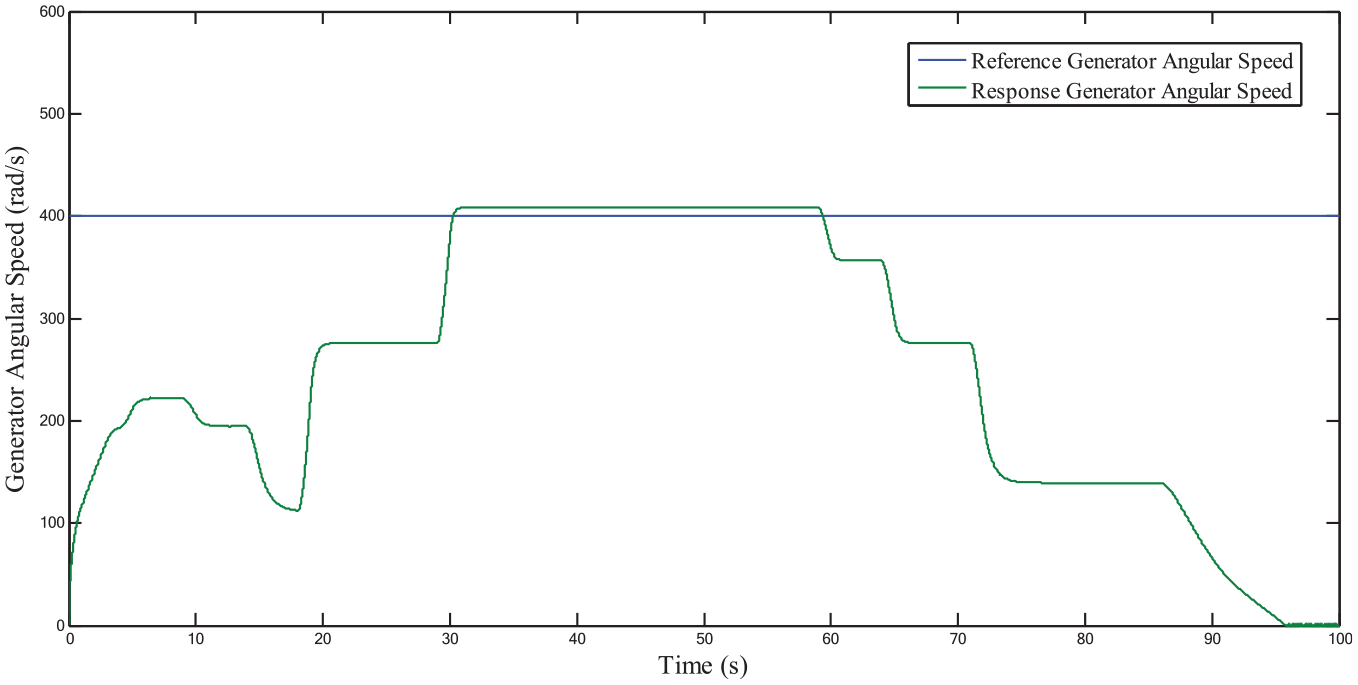
Evolution of the rotational angular speed of the generator.
Figure 22 illustrates the evolution of the three phase’s currents. Figure 22 demonstrates that the magnitude of currents is equal the 1500 A, this value is related to the maximal admissible current in the generator’s windings. This regulation is achieved by the regulation of the generator’s angular speed to its nominal speed equal to 400 rad/s. This property demonstrate that the AC- DC converter permit a speed regulation without use of braking system.
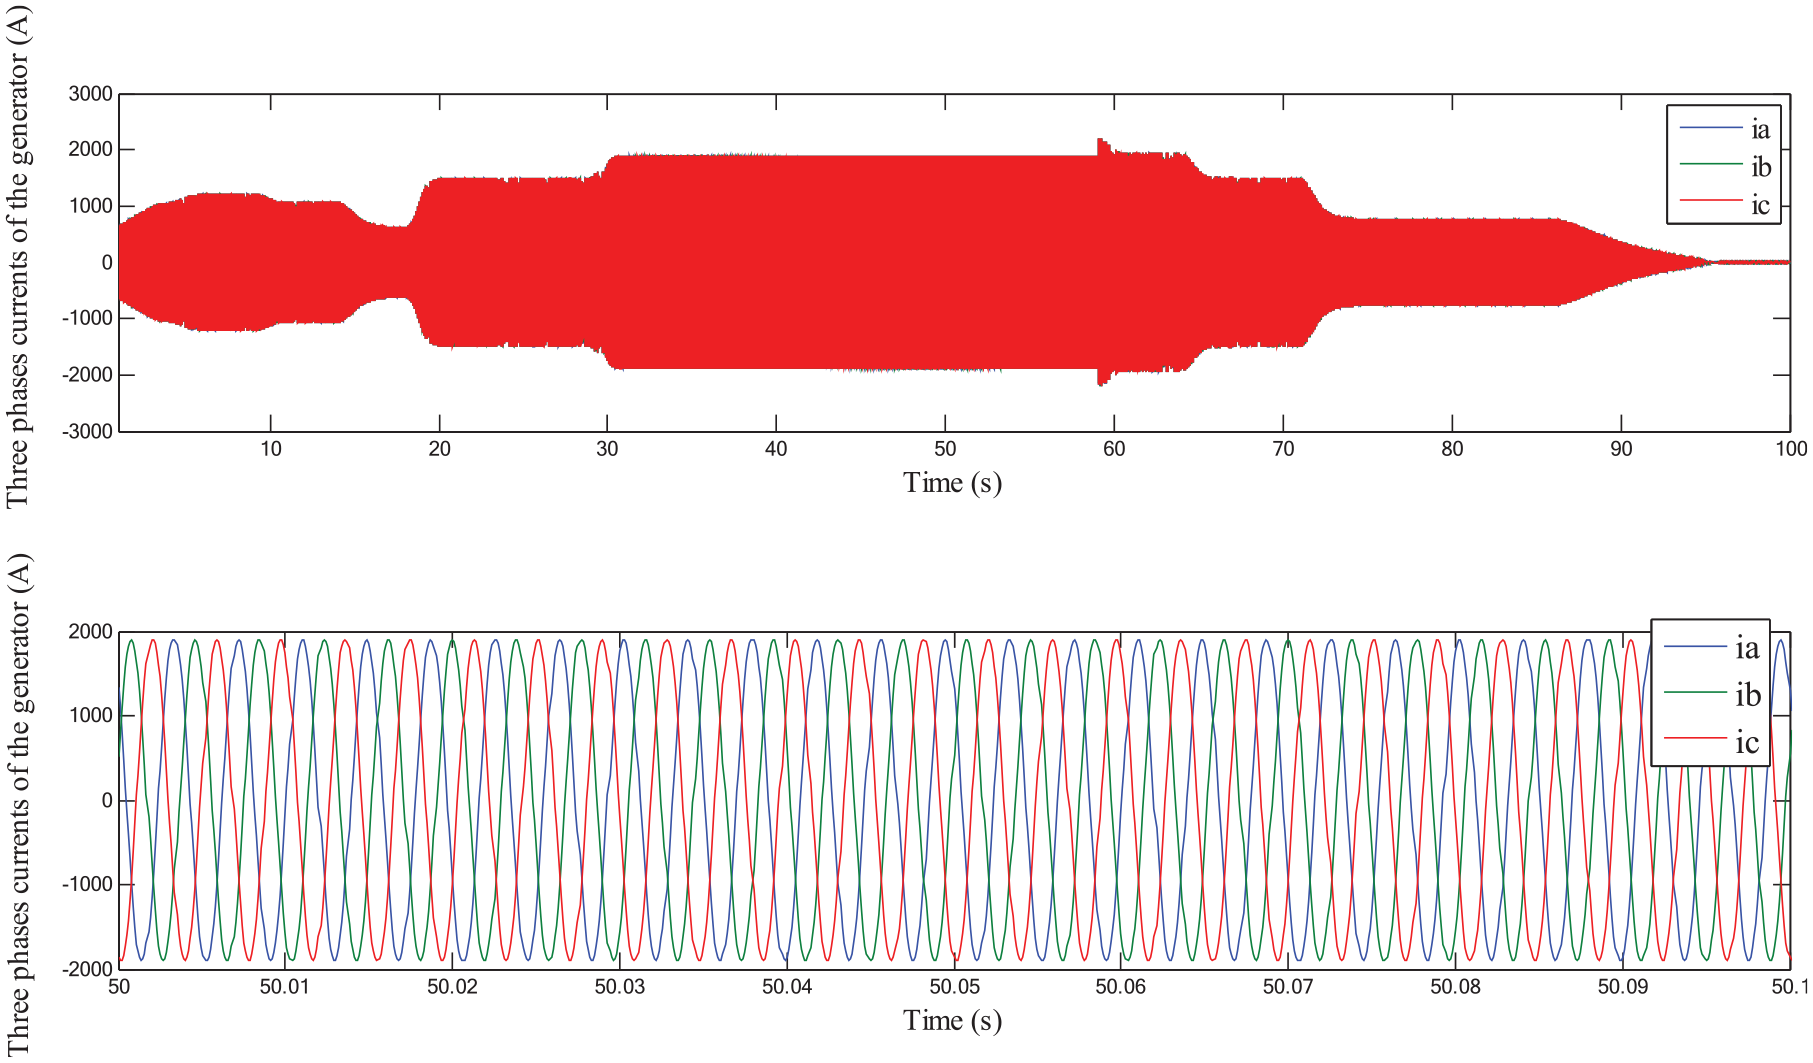
Evolutions of the generator phase’s currents in versus time.
Figure 23 shows the evolutions of the generator phase’s voltages in versus time. The magnitude of the phase’s voltages is regulated also by the regulation of the generator angular speed to its nominal value equal to 400 rad/s. The phase’s voltages magnitude influences the magnitude of the DC bus voltage.
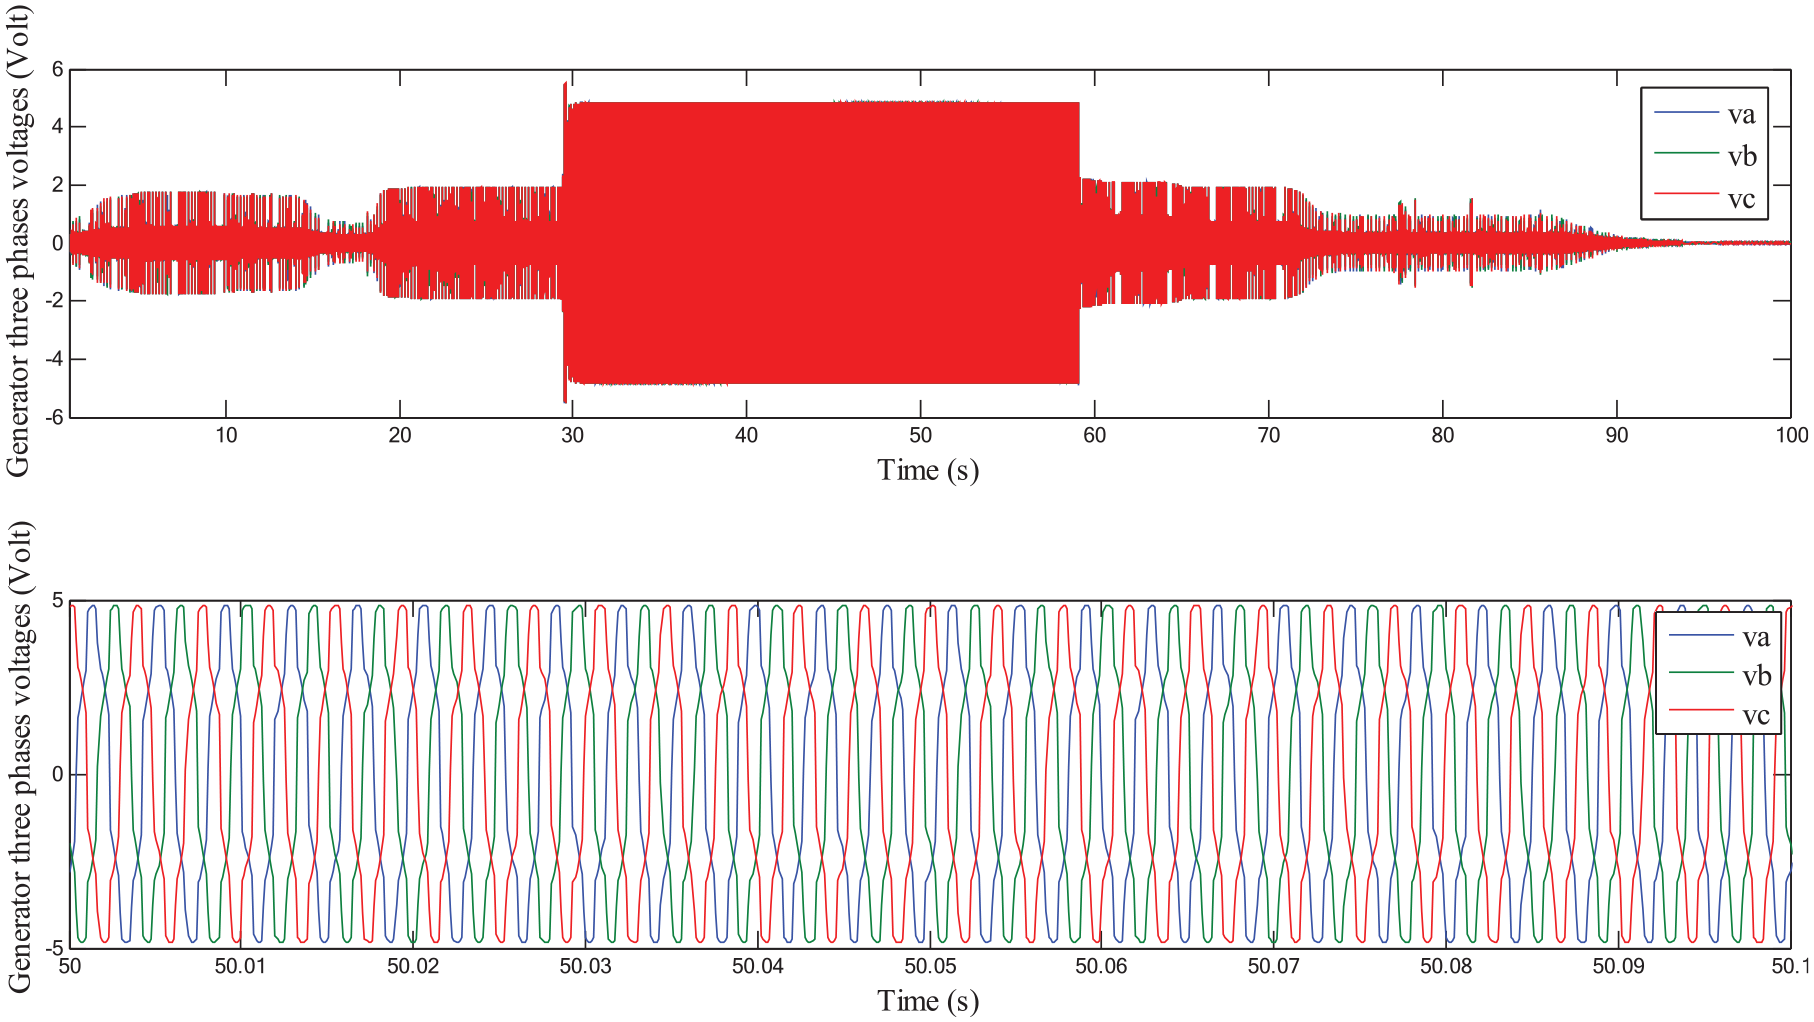
Evolutions of the generator phase’s voltages in versus time.
Figure 24 illustrates the evolutions of the generator phase’s induced electromotive forces in versus time. The magnitude of the phase’s induced electromotive forces is regulated also by the regulation of the generator angular speed to its nominal value equal to 400 rad/s.
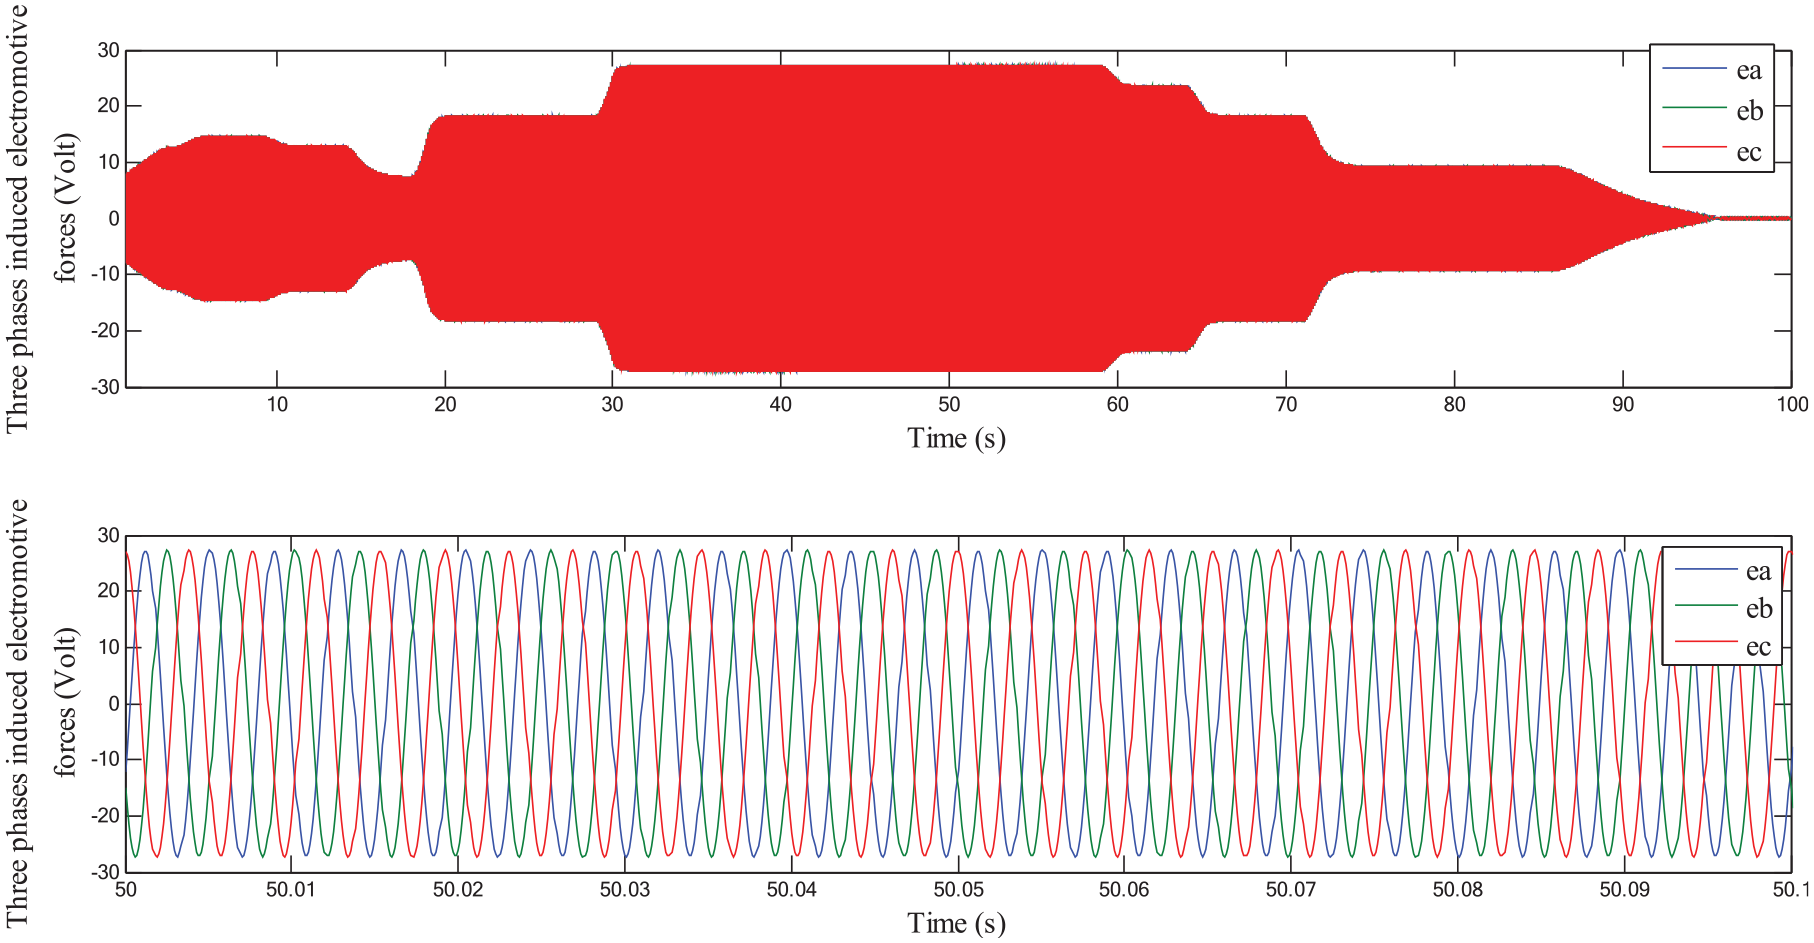
Evolutions of the generator phase’s induced electromotive forces in versus time.
Figure 25 illustrates the evolutions of the generator phase’s voltage according induced electromotive forces in versus time. Figure 25 demonstrate that the phase’s voltages va, vb, and vc are in phase respectively with the phase’s induced electromotive forces ea, eb, and ec, due to the reduced value of the generator phase’s equivalent inductance. This property valid the result obtained in section 2.
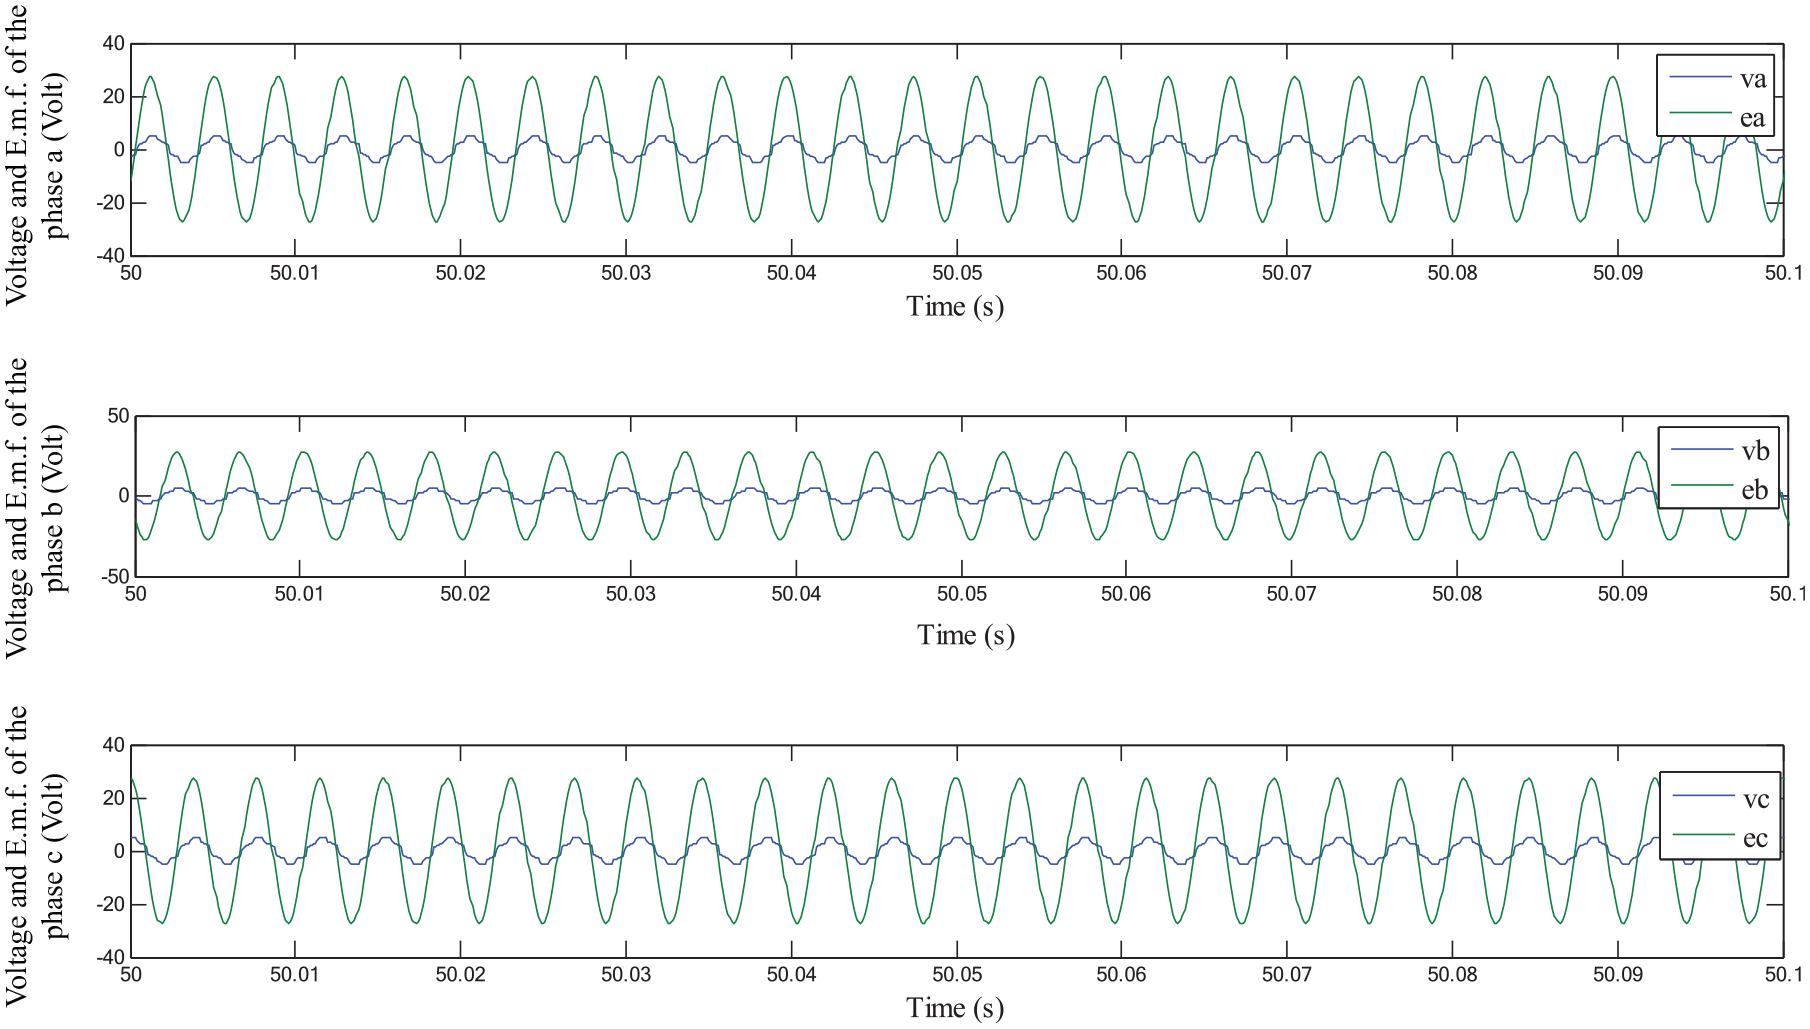
Zoom of the evolutions of the generator phase’s voltages according induced electromotive forces in versus time.
Figure 26 illustrates the paces of the generator phase’s induced electromotive force and current of the phase “a” in versus time. Figure 26 illustrates that the generator phase’s induced electromotive forces are in phase with the phase’s currents. This property validates the control law imposing the phase’s currents in phase with the electromotive forces to have an electromagnetic torque which is added to the useful torque of the turbine after amplification by the gear train. This property valid the result obtained in section 2.
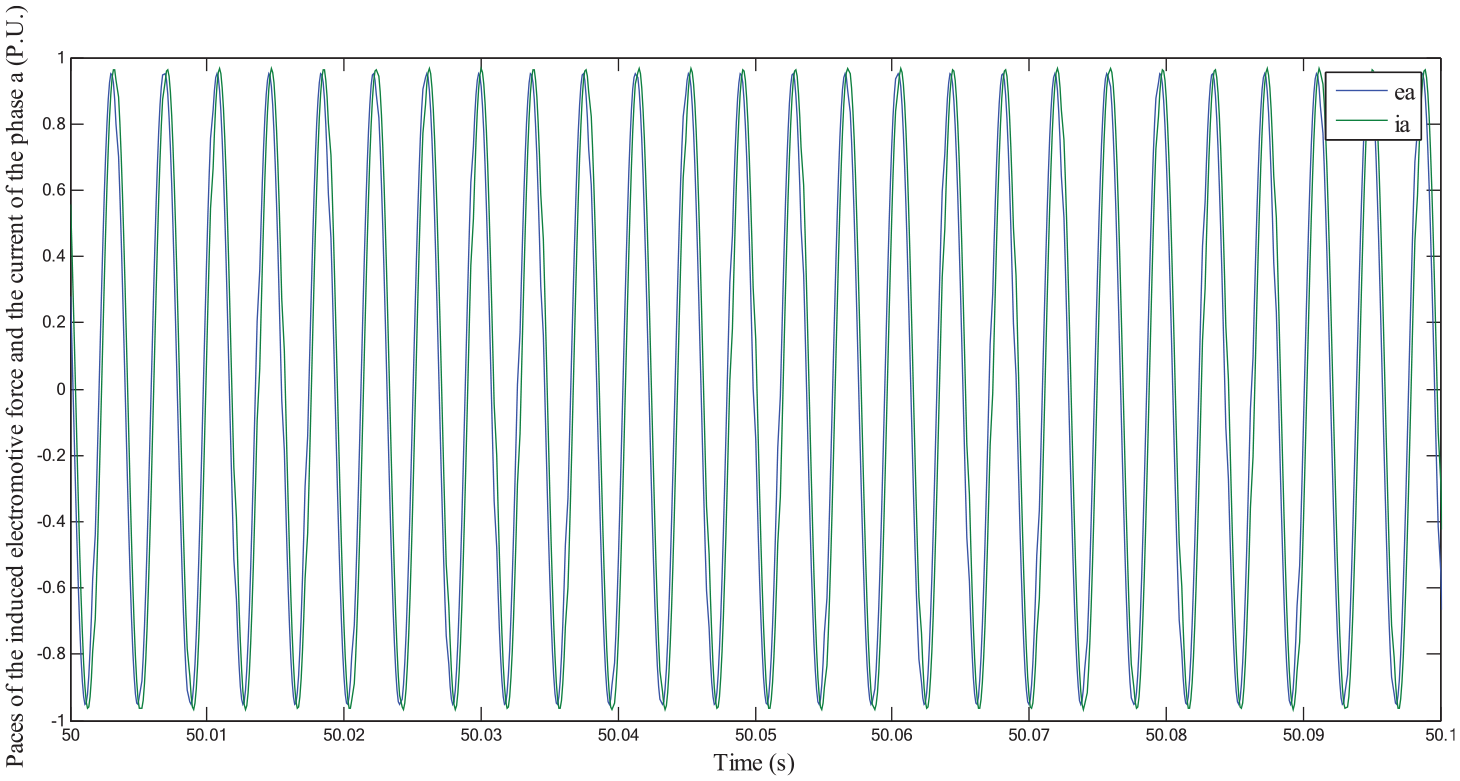
Paces of the generator phase’s induced electromotive force and current of the phase “a” in versus time.
Figure 27 illustrates the evolution of the six AC-DC converter control signals. Figure 27 shows that the two signals of each arm are complementary. The control signals show the pulse width modulation to impose the phase’s currents in phase with the induced electromotive forces to have an additive electromagnetic torque.
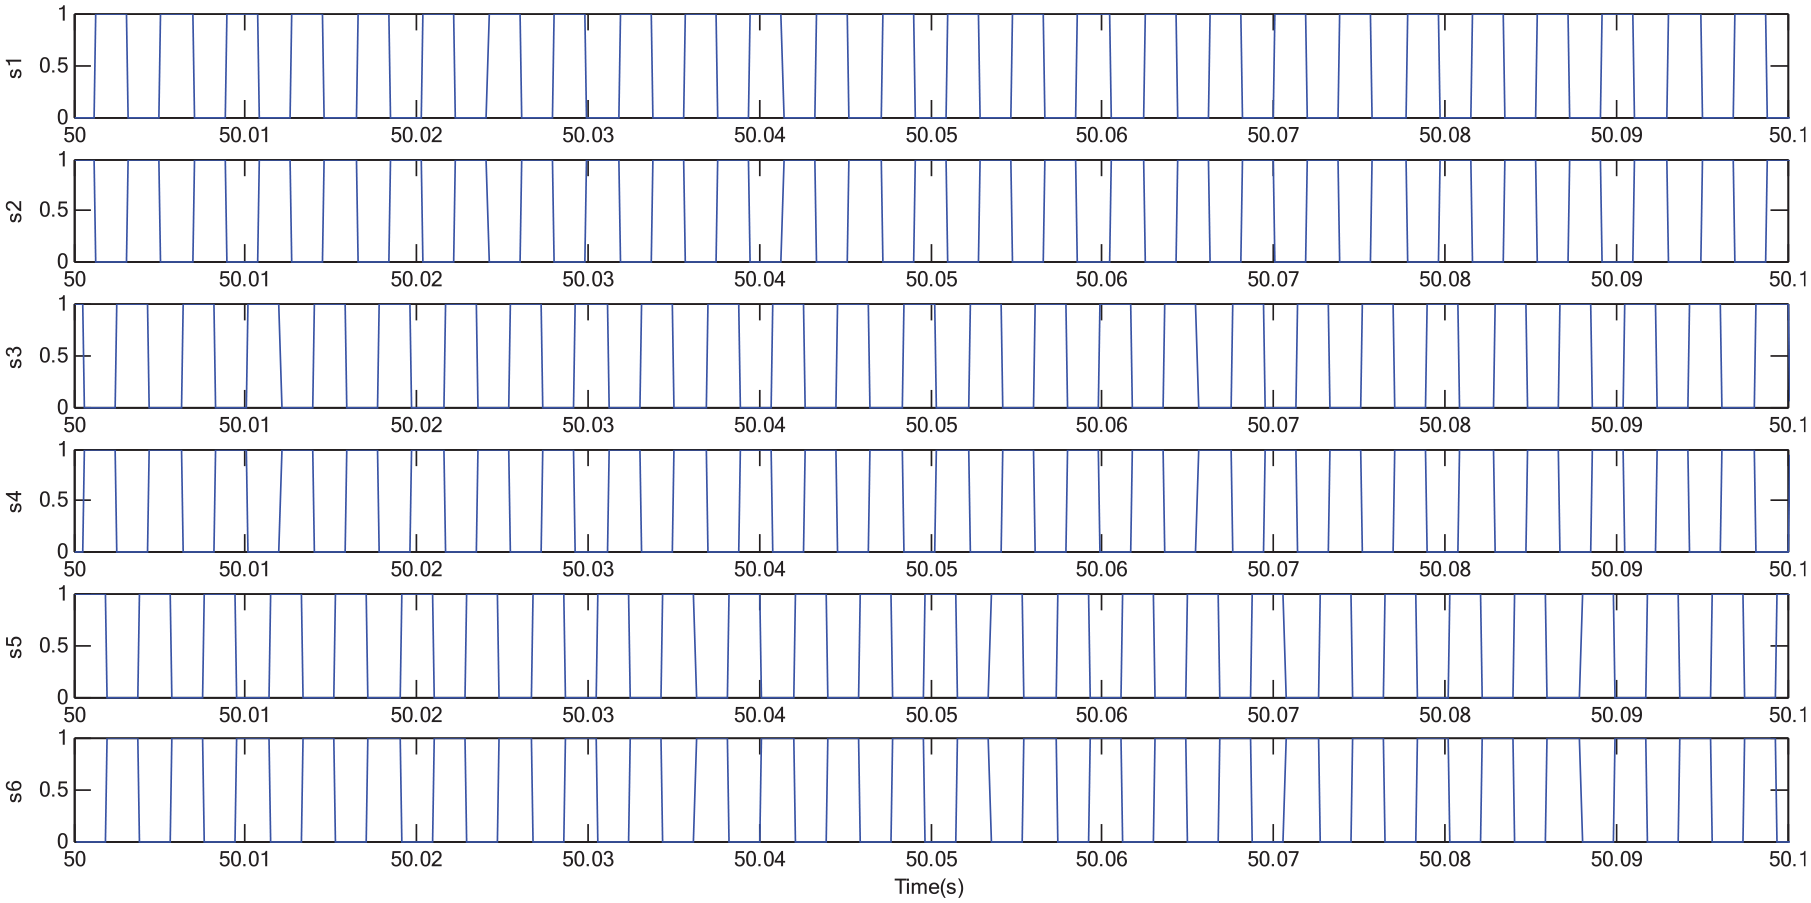
Evolution of the six AC-DC converter control signals.
Figure 28 illustrates the evolution of DC-DC converter control signal regulating the battery charging voltage to 320 V.
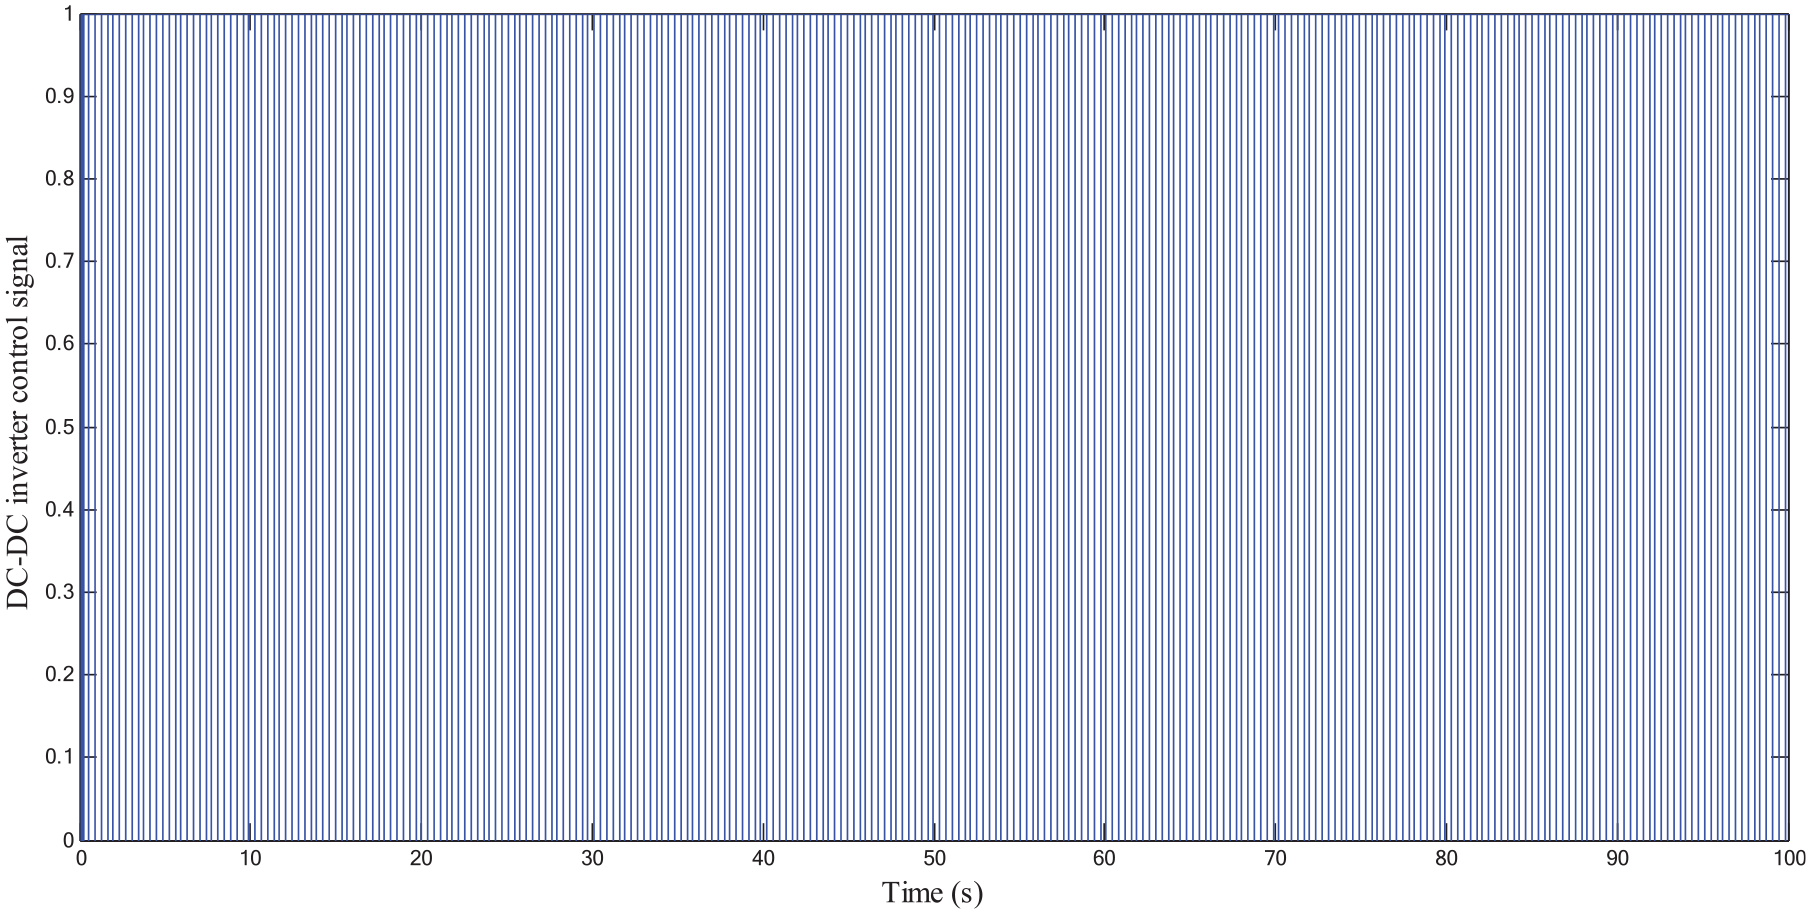
Evolution of DC-DC converter control signal.
Figure 29 illustrates the evolution of battery charging voltage. Figure 29 shows that the response charging voltage follows with good precision the reference charging voltage, which validates the performance of the developed control technique.
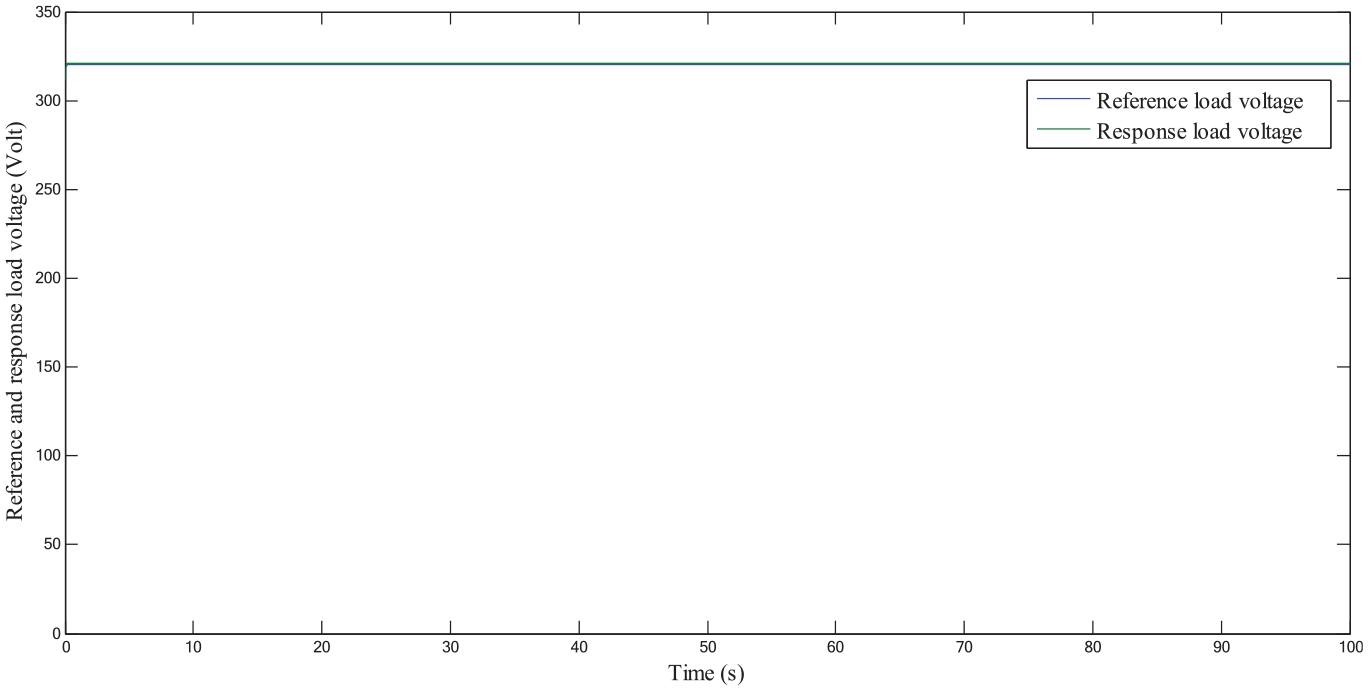
Evolution of battery charging voltage.
Figure 30 shows that the battery charging current varies relatively to the variation of the battery charging voltage. Figure 30 shows also the effect of the commuted current in DC-DC inverter inductance in the form of the battery charging current.
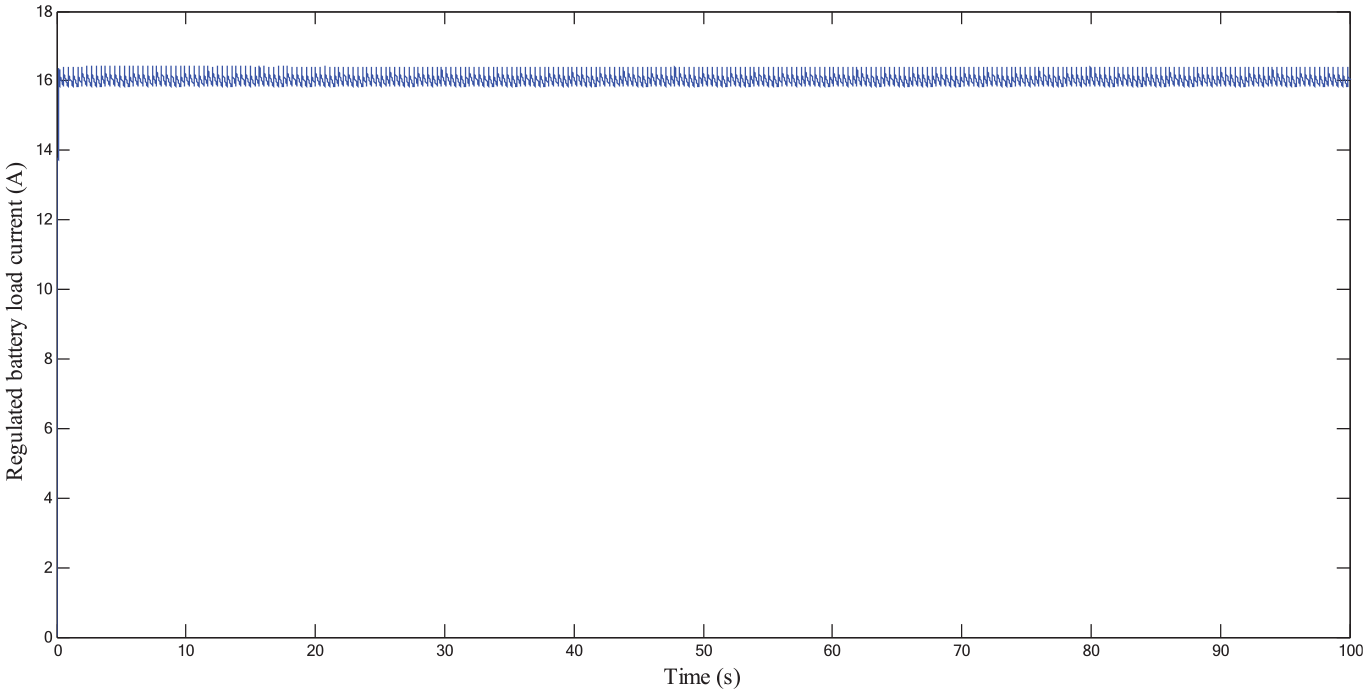
Evolution of battery charging current in versus time.
Figure 31 show that the generator electromagnetic torque varies according to the wind speed influencing the useful torque of the turbine for generator angular speed regulation. The electromagnetic torque is amplified by the gear ratio rd equal to 100.
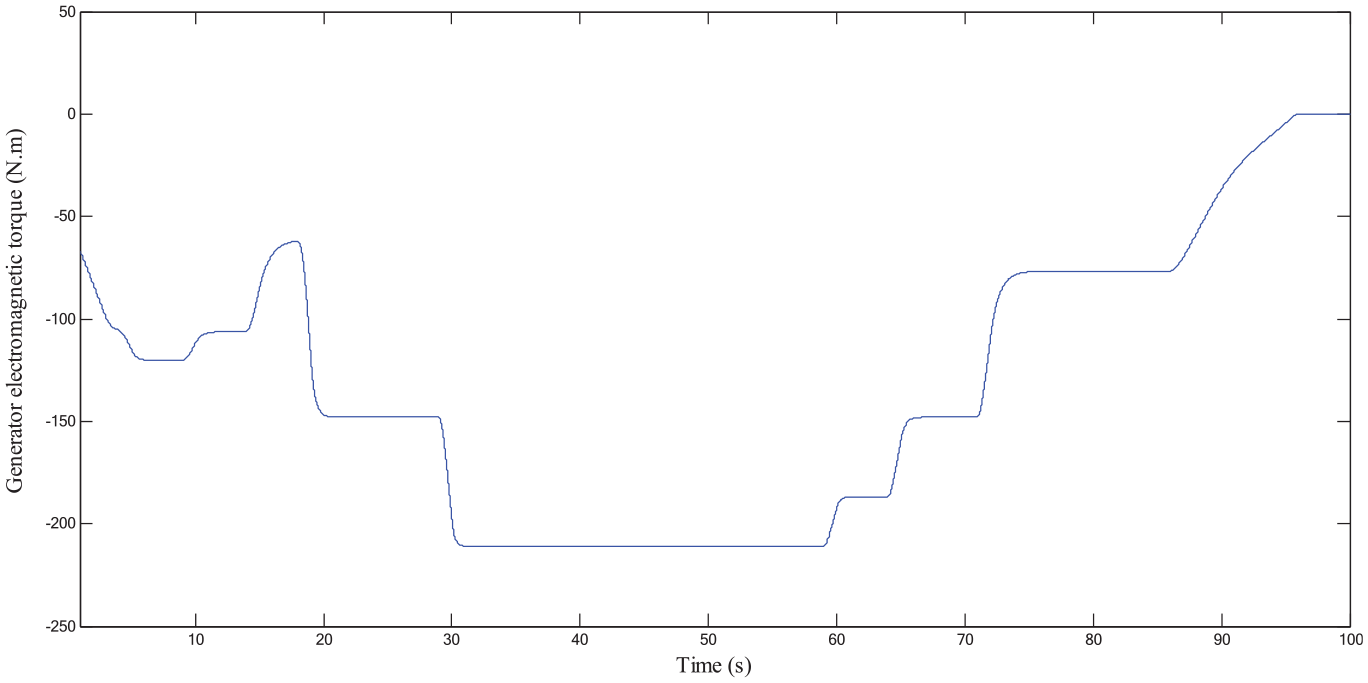
Evolution of generator electromagnetic torque in versus time.
Figure 32 shows that the evolution of the turbine useful torque in versus time is influenced by the electromagnetic torque.
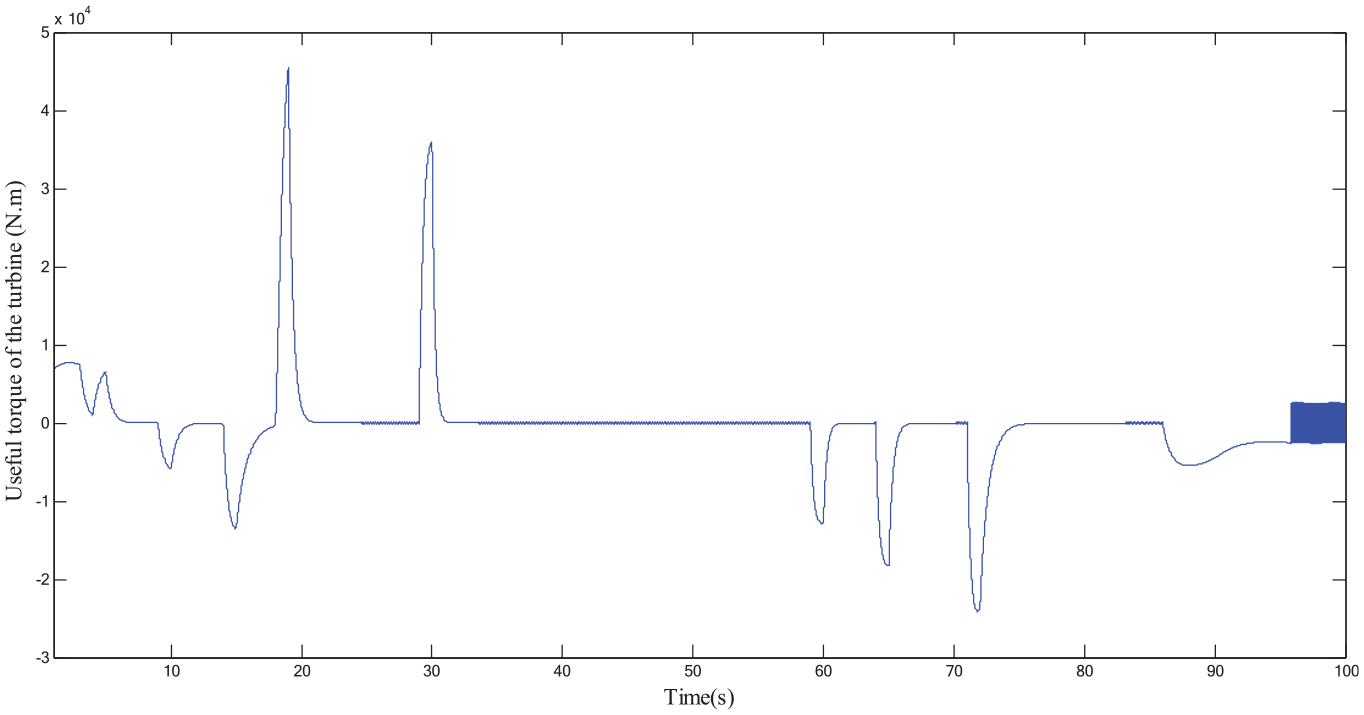
Evolution of the turbine useful torque in versus time.
Figures 33 and 34 illustrates the reduced recovered power and energy due to the reduced charging current of the battery.
Captured and recovered power of the turbine in versus time.
Evolution of the recovered energy.
Optimal functioning regime of the turbine
To extract the maximum of energy, wind turbine power system can be sized for the same nominal angular speed of the generator and for an elevated battery charging current. The nominal internal battery voltage can be maintained constant in this case, and the sizes of the wind turbine components can be determined systemically from inverse analytical program of the turbine having as inputs the maximal current in the battery. This method is used for sizing electric vehicles as shows in Shin et al. (2013), Kim et al. (2010), Buticchi et al. (2012), Kang (2017), Tounsi (2015), Nhidi et al. (2015), and Ben Amor et al.(2015).
For a maximal charging current of battery equal to 350 A, illustrated in Figure 35, battery load voltage is regulated to 500 V by DC-DC inverter as shown in Figure 36.
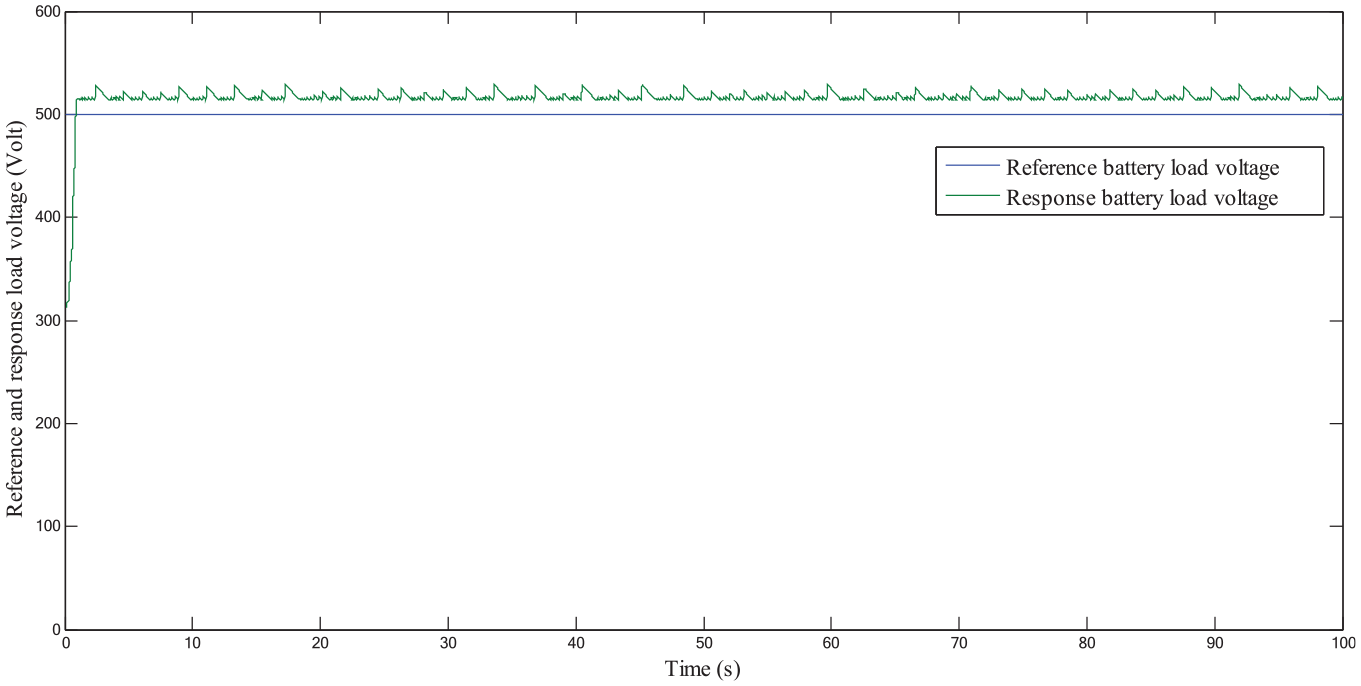
Optimized battery load voltage in versus time.
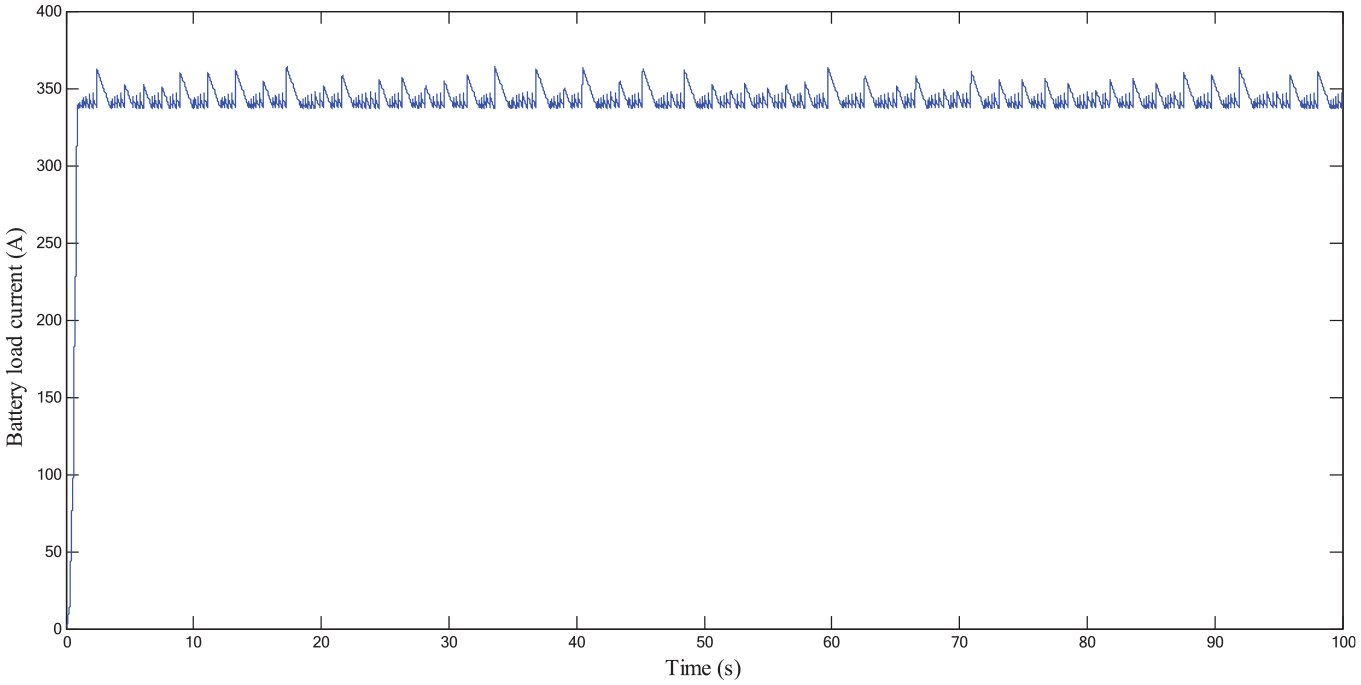
Optimized battery load current in versus time.
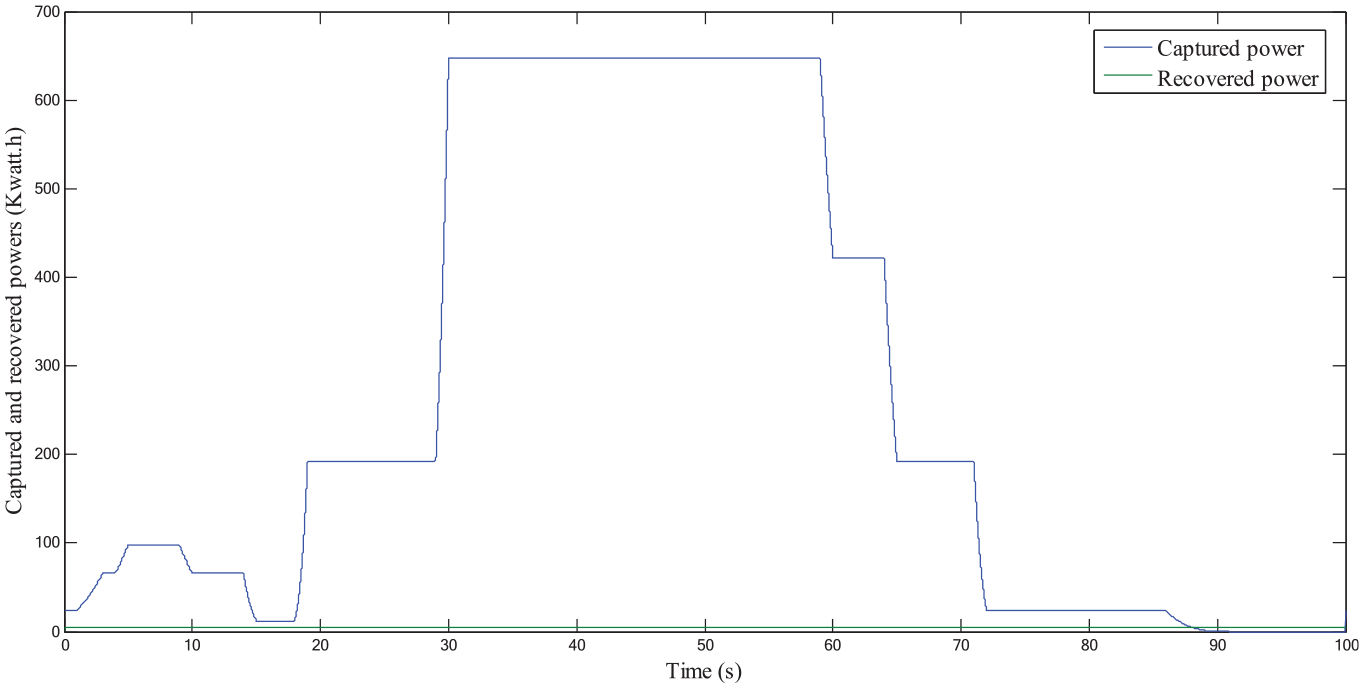
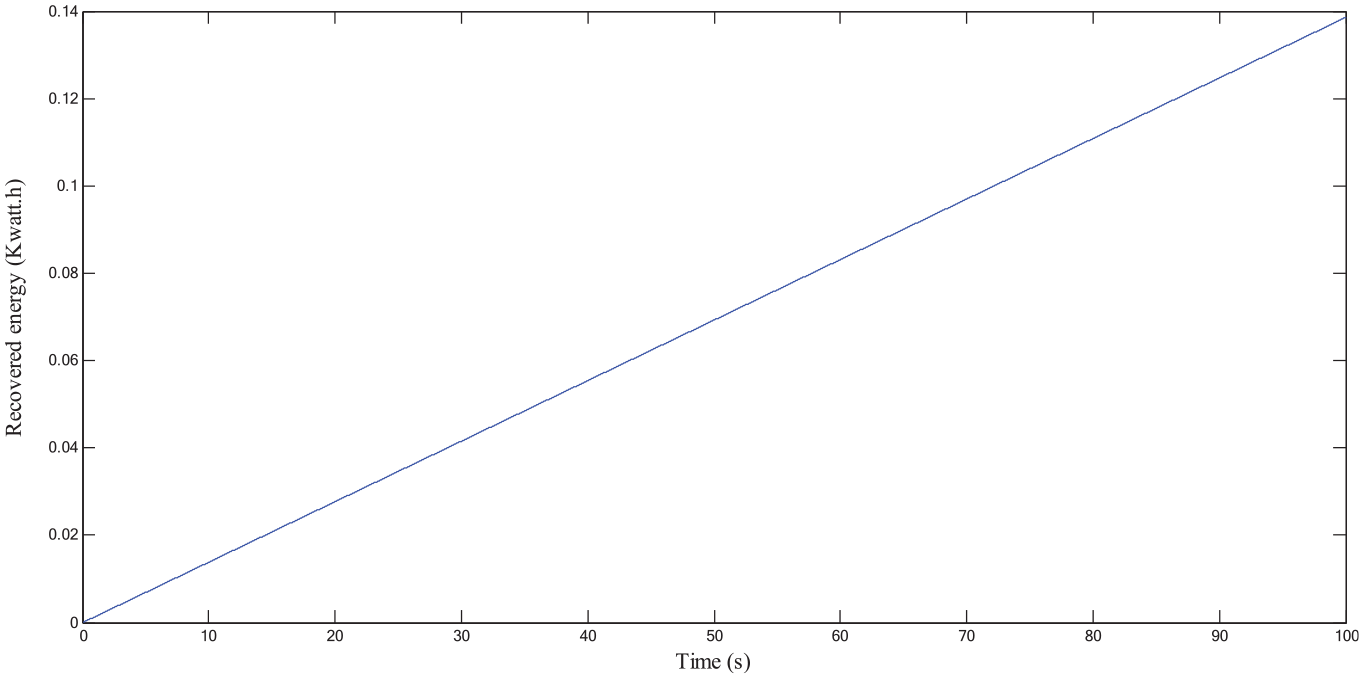
Figures 37 and 38 illustrates that the battery recovered power and energy are augmented largely regarding the first wind turbine. In conclusion, the efficiency of the wind turbine is largely improved.
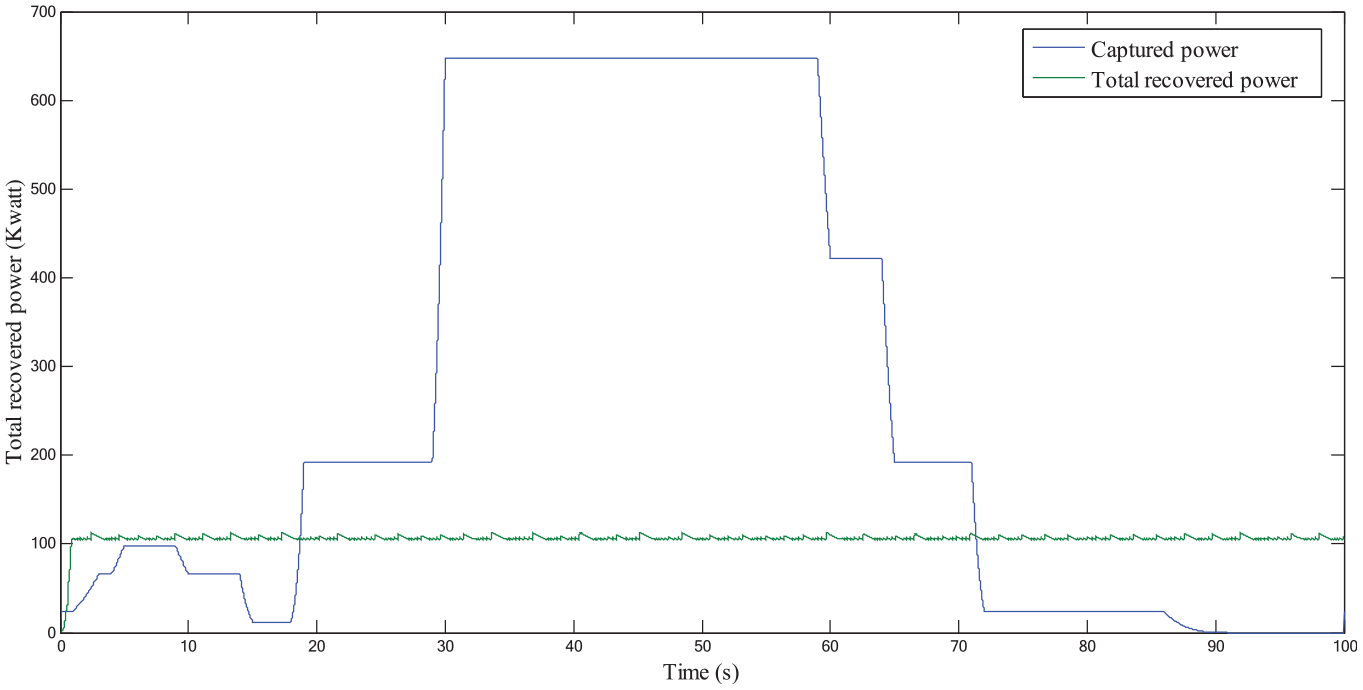
Captured and optimized recovered power in versus time.
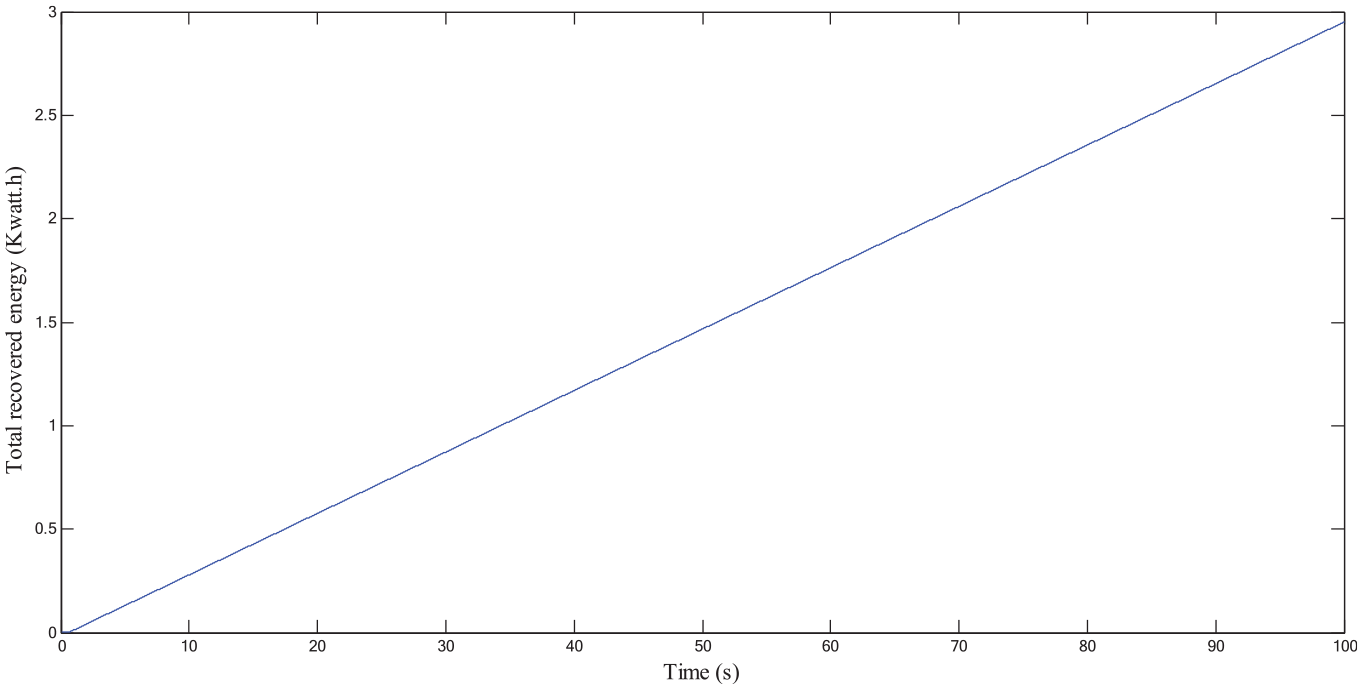
Optimized recovered energy in versus time.
To adapt the turbine to the recharge current, two modules of the same axial generator are mechanically combined.
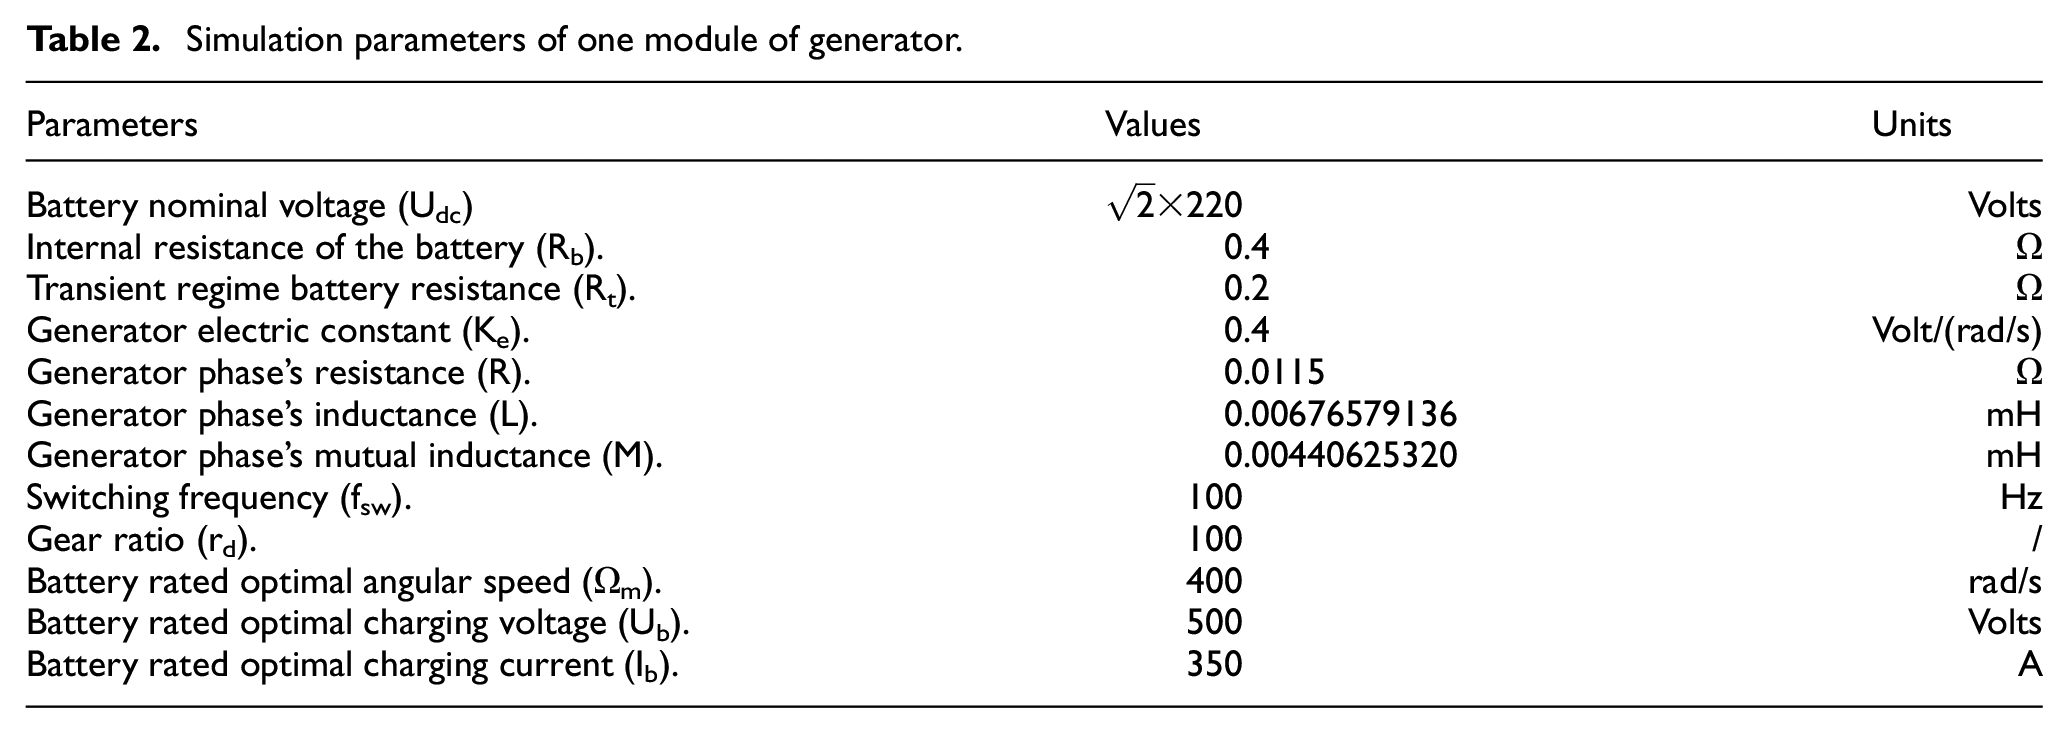
Simulations of the power chain model are realized according the data extracted from wind turbine analytical model as shown in Table 2.
Simulation parameters of one module of generator.
Classical wind energy systems models
Simulation parameters calculated from a generator sizing program are illustrated in Table 2 (Ben Amor et al., 2015; Nhidi et al., 2015; Shin et al., 2013).
For the three configurations, the battery charging voltage is shown in Figure 39.
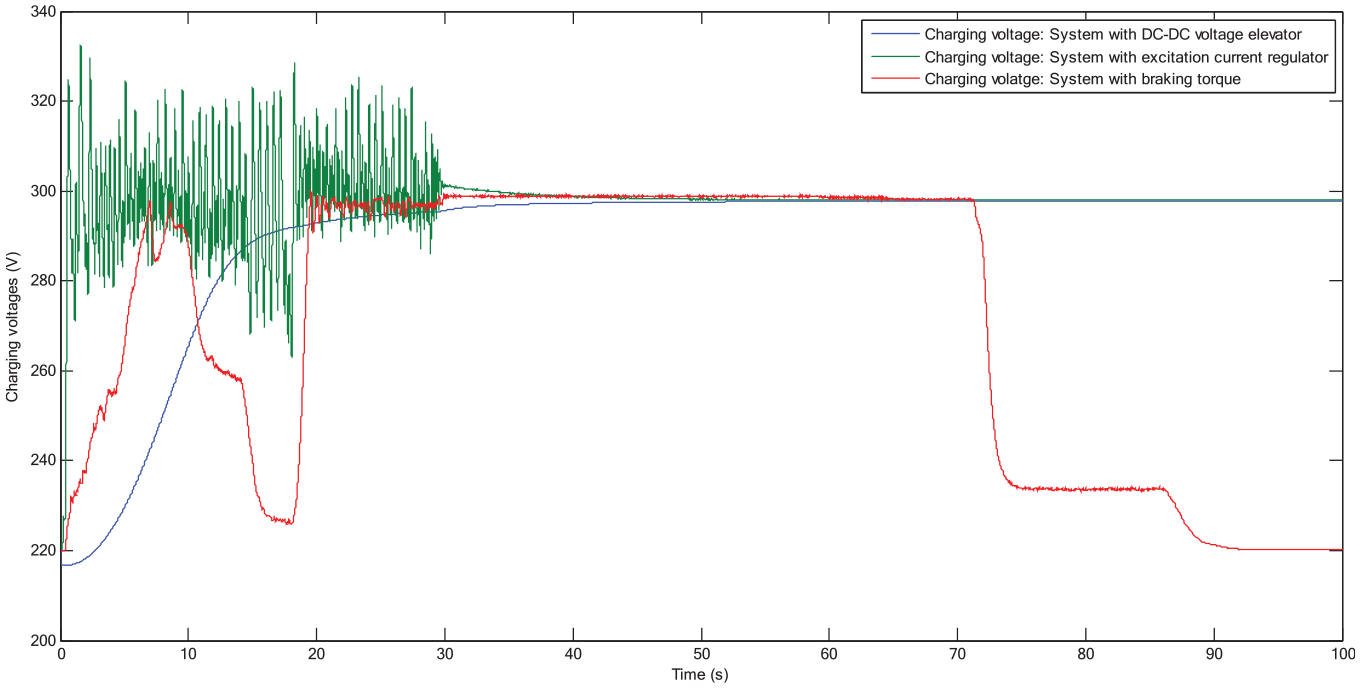
Battery charging voltage for the three configurations.
For the configurations with DC-DC elevator inverter and with excitation current regulator, Figure 39 shows that the charging voltage is maintained continuously. This confirms the effectiveness of these configurations. The amplitude of this voltage allows a continuous charging of the batteries as the nominal battery voltage is 220 V significantly below to this voltage for these configurations. For the configuration with braking torque there are areas of discontinuity showing the poor performance of this configuration regarding to the two others configurations.
For the three configurations, the batteries charging current is shown in Figure 40.
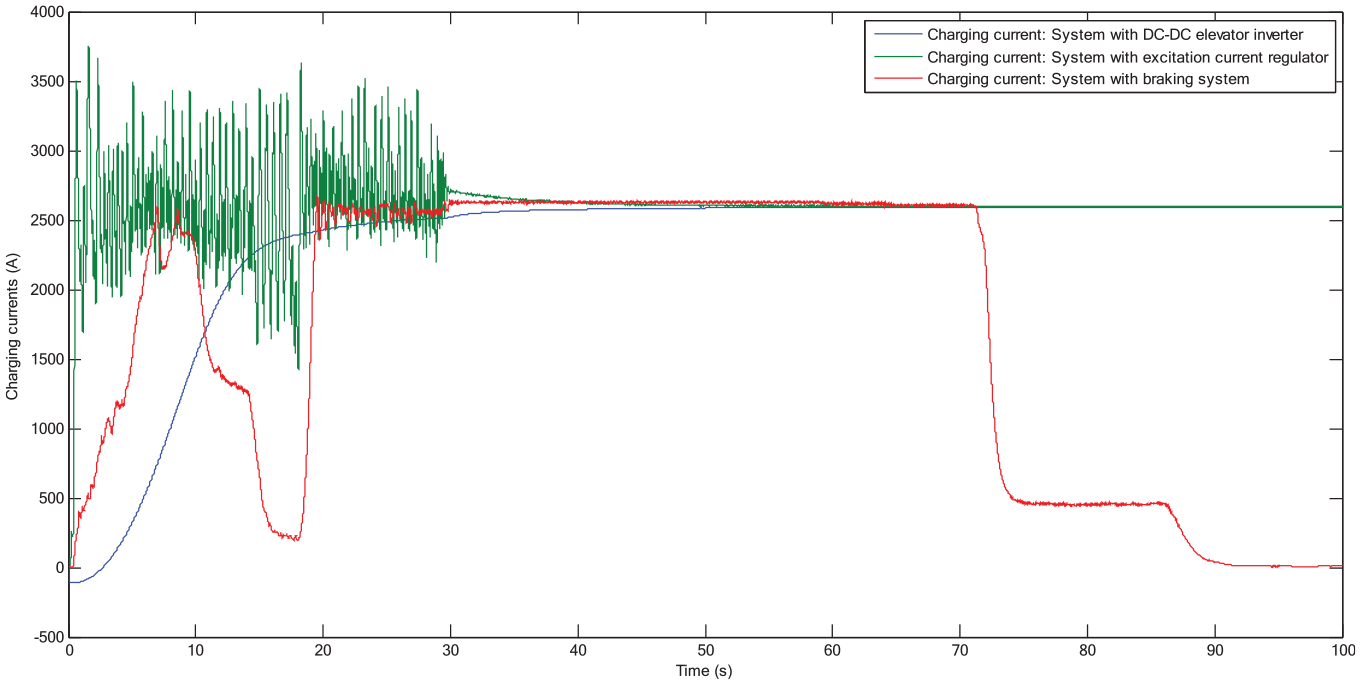
Battery charging current for the three cases.
For the configurations with DC-DC elevator inverter and with excitation current regulator, Figure 40 shows that the charging current is maintained continuously. This confirms the effectiveness of these configurations. The change versus time of this current allows a continuous charging of the batteries as the nominal battery voltage is 220 V significantly below to the charging voltages for these configurations. For the configuration with braking torque, there are areas of discontinuity, showing the poor performance of this configuration regarding to the two others configurations.
The power generated by the wind and the powers recovered by the batteries for the three cases are illustrated by the Figure 41.
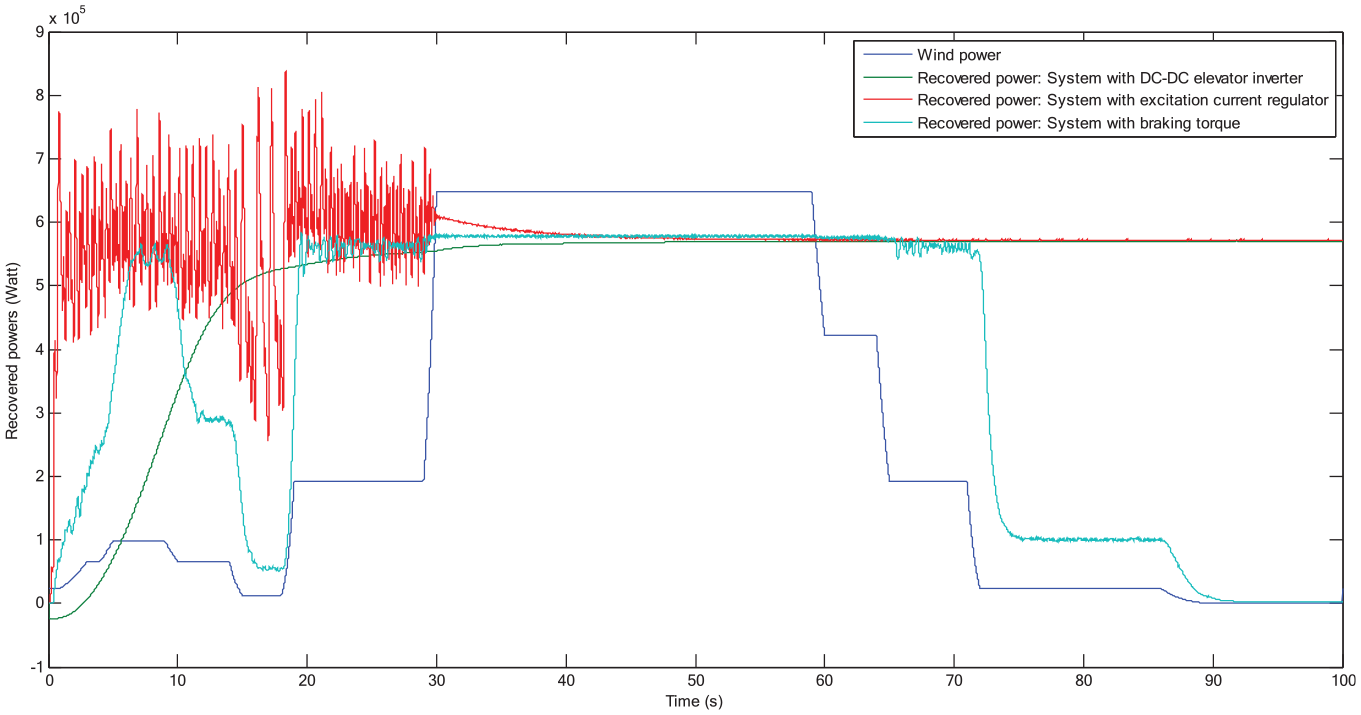
Wind and recovered powers.
The Figure 41 show that the power transferred to the batteries is lower than that developed by the wind, which is explained by the different losses of energy generation chain. Also this figure shows that the power chains with excitation current regulator and with DC-DC elevator ensures a continuous energy recovery.
For the three configurations, the energy recovered by the batteries is shown in Figure 42.
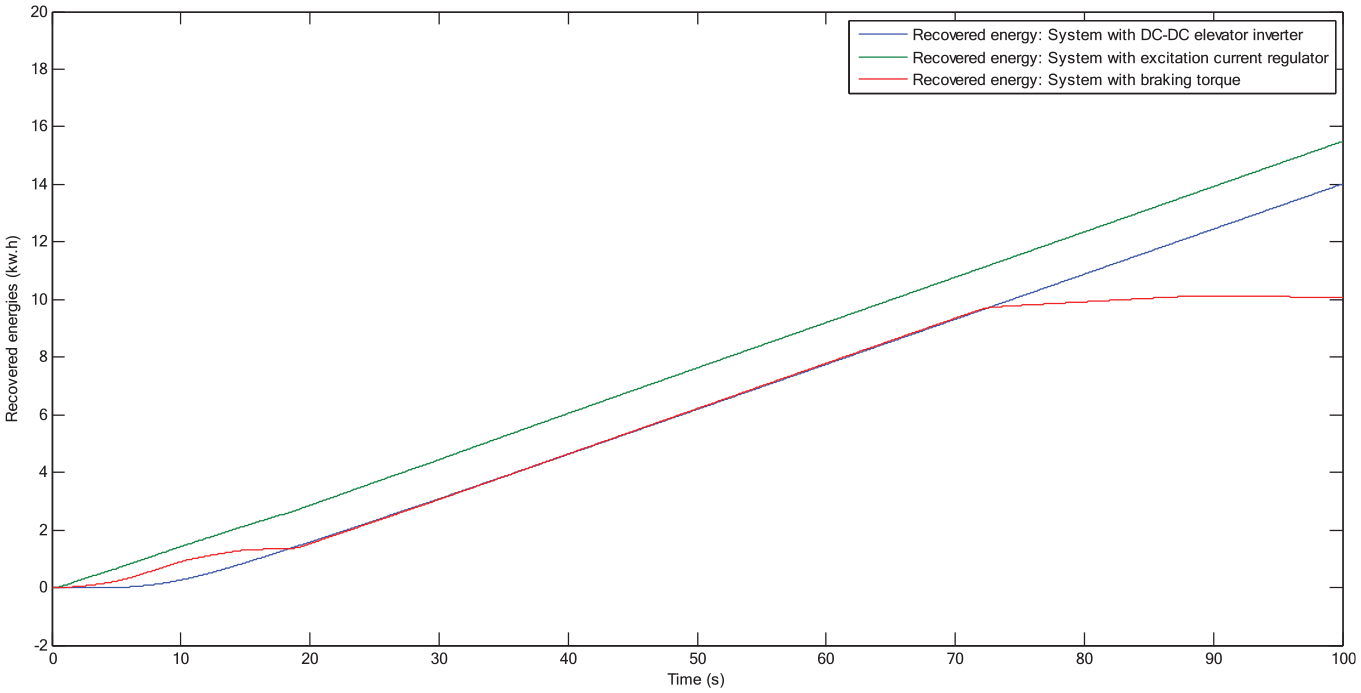
The energy recovered by the batteries.
The results obtained by the presented study are comparable to those obtained by conventional methods. For the wind system using mechanical brake Figures 40 and 41 illustrates the effects of systems vibrations.
The difference of the wind systems line in the models complexity and the production and manufacturing cost.
Conclusion
This paper describes a new control technique for wind turbines recovered energy optimization. This control technology is based on the first hand on the regulation of the electric generator angular speed at its optimal value, to protect the power chain against over-current caused by wind over-speed, and on the other hand on the regulation of the battery charging current at its optimal value to optimize the battery recovered energy. The developed control technology makes it possible to impose the electromotive forces in phase with the phase’s currents, in order to maximize the induced electromotive forces magnitude, and then maximize the recovered energy. This control technique allows a continuous recharge with maximal batteries charging current and voltage. The developed model is implemented under Matlab-Simulink simulation environment. The analysis of simulation results validates and shows the performances of the developed control technique.
As prospects, it will be interesting to industrialize the innovated wind energy system.
Footnotes
Declaration of conflicting interests
The author declared no potential conflicts of interest with respect to the research, authorship, and/or publication of this article.
Funding
The author received no financial support for the research, authorship, and/or publication of this article.