
Abstract
Automated detection of surface defects in wind turbine blades is essential for cost-effective and reliable maintenance in modern energy infrastructure. This study presents a comprehensive evaluation of recent single-stage (YOLOv8, YOLOv9, YOLOv10, YOLOv11) and two-stage (Faster R-CNN) deep learning-based object detection models for wind turbine blade inspection. To address class imbalance, StyleGAN2-ADA augmentation was applied to a real-world dataset, and detection accuracy, class-wise performance, inference speed, and model size were assessed using stratified cross-validation and an independent holdout set. Results show that all YOLO models consistently outperform Faster R-CNN in mean Average Precision (mAP@0.5), with YOLOv11 achieving the highest overall score of 0.969 on the holdout test set. The integration of synthetic data led to substantial performance gains for the minority classes and reduced variance across folds. In addition to superior accuracy, YOLO models demonstrate faster inference (<11 ms per image) and compact model sizes (48–84 MB), highlighting their suitability for real-time and edge-based industrial deployments. These findings establish the technical and practical benefits of combining advanced YOLO models with data augmentation strategies for automated wind turbine blade defect detection.
Introduction
Wind energy has emerged as a crucial component in the global effort to address climate change by reducing greenhouse gas emissions (Lv et al., 2022). As the need for renewable energy continues to grow, maintaining the reliability and operational efficiency of wind turbines is becoming increasingly critical (Yu et al., 2017). For instance, wind turbines are frequently subject to harsh environmental conditions, leading to damage such as blade cracks, surface erosion, delamination, lightning strikes, and other structural defects (Yang et al., 2021). These damages, if not promptly detected and addressed, can compromise the performance and lifespan of the turbines, resulting in significant energy losses and maintenance costs. Furthermore, wind turbine blades are vital for electricity generation and account for roughly 15% to 20% of the overall investment in a wind turbine (Tchakoua et al., 2014). However, they are fragile and vulnerable to corrosion and damage from strong wind gusts, lightning strikes, etc. They were the cause of 13.4% of the failures observed in wind turbines in Sweden between 1997 and 2005 from the survey of over 700 onshore wind turbines; they are also failing at approximately 3,800 per year, corresponding to 0.54% of the 700,000 blades currently operating worldwide (Yang et al., 2017). Therefore, it is necessary to implement dependable and effective monitoring of their condition to prevent mechanical, structural, or environmental damage (Carnero et al., 2023). Some of the current inspection techniques are visual inspection method, acoustic emission technology (Han et al., 2014), vibration detection (Wang et al., 2014), infrared thermography (Rumsey and Musial, 2001), ultrasonic flaw detection (Li et al., 2021), and strain detection (Sierra-Pérez et al., 2016). Visual inspection involves scheduling a shutdown, resulting in significant energy generation losses due to prolonged maintenance time. Additionally, it poses risks because of the tall structures of wind turbine blades and the need for human intervention (Reddy et al., 2019). Several challenges are associated with sensor installation, data storage, and transmission. Environmental changes can easily disrupt the signals collected by the sensors. Additionally, placing numerous sensors on wind turbine blades can hinder their energy capture efficiency. Therefore, these techniques are labor-intensive, costly, often inefficient, and susceptible to mistakes made by humans (Lv et al., 2022).
There has been growing interest in unmanned aerial vehicles (UAVs) in recent years for wind turbine blade inspection, as they offer an efficient, cost-effective, and assistive tool with strong potential for automating inspections. However, interpreting the data for damage assessment can be labor-intensive and complex due to the large volume of images captured by UAV cameras. A single flight can yield thousands of high-resolution images per turbine, making manual review labor-intensive and variable across inspectors. To mitigate these challenges, the computer vision-based technique is prioritized to automate this task.
There have been a limited research efforts focusing on machine learning-based approaches for detecting surface damage on wind turbine blades using drone images (Wang and Zhang, 2017). Chandrashekhar et al. (2025) presented a machine learning approach for detecting damage in wind turbine blades, using Gaussian regression to track changes in blade frequency. Similarly, Joshua et al. (2025) introduced a crack detection framework for wind turbine blades, modelling the data with multi-layer perceptrons, and demonstrating strong potential for condition monitoring. However, these studies primarily focused on detecting a single distress (i.e., a crack) and relied on traditional machine learning (ML) techniques. In parallel with inspection research, ML has advanced wind-energy forecasting, improving short-term power prediction and grid planning (Cui et al., 2025; Ibrahim et al., 2023a, 2023b). Complementing this, control and hardware studies have explored robust multi-input control, TSR-MPPT backstepping, and emulator-based converter testing (Boutabba et al., 2025; Elzein et al., 2025; Ravikumar et al., 2025). This proposed study complements these threads, focusing on the vision-based detection of blade-surface defects.
Comparative analysis between the proposed work and the existing studies.
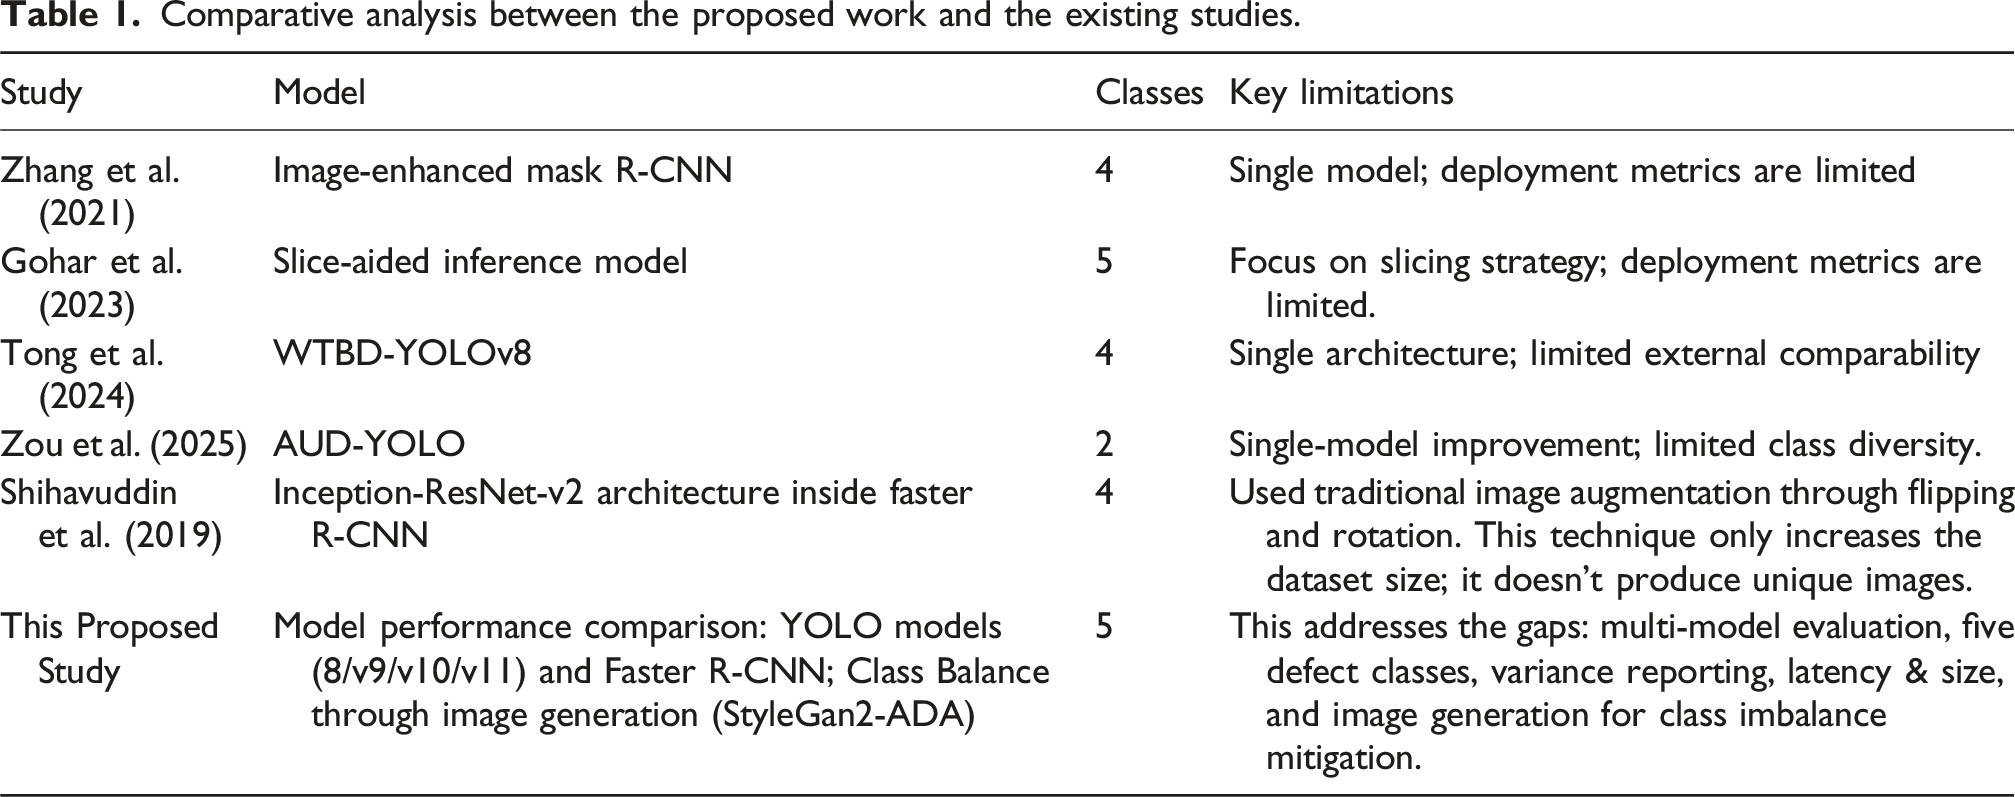
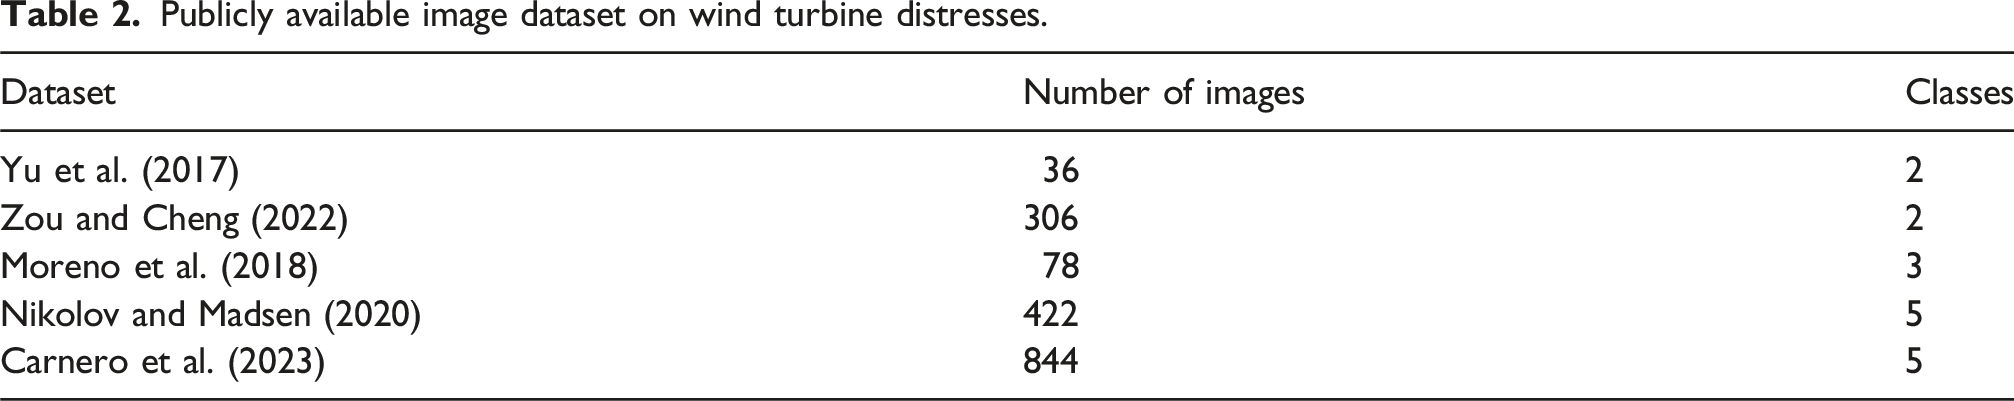
Despite this progress, the evidence base remains constrained by small, task-specific datasets, earlier detector versions, single-defect focus, and limited treatment of class imbalance (Moreno et al., 2018; Yu et al., 2017; Zou and Cheng, 2022). In practice, publicly available datasets are modest in size, with Zou and Cheng (2022) reporting 306 images, Yu et al. (2017) reporting 36 images, and Moreno et al. (2018) reporting 78 images. These sizes reflect the challenges of image acquisition on operating turbines, confidentiality constraints on industrial data, and the cost of expert annotation; even curated resources remain limited relative to the need (Carnero et al., 2023; Nikolov and Madsen, 2020). Consequently, overfitting remains a persistent risk, compromising the quality of model training (Schmedemann et al., 2022). Therefore, studies that integrate modern detectors with transparent, imbalance-aware assessments on wind turbine blade defect datasets are needed to ensure accuracy and reproducibility.
Common approaches to address limited datasets include data augmentation, transfer learning, leveraging pre-trained models, and using synthetic data. Among these, synthetic training data offers a promising solution, as it allows for the efficient and unbiased generation of large volumes of labeled images.
StyleGan2-ADA (Karras et al., 2021), a generative model, creates entirely new images that do not exist in the original dataset, providing a richer and more varied set of training samples than traditional augmentation methods. Another advantage of the image generative model is that it generates highly realistic images that can closely mimic real-world scenarios, helping the model generalize better to actual defect conditions than traditional image augmentation, which may not always create realistic variations, especially for complex patterns or defects. Furthermore, the artificial image generative model can produce a virtually unlimited number of unique images, comprehensively addressing data scarcity. Although traditional image generation can increase the dataset size, it is still limited by the number of original images and the range of possible transformations.
The major contributions of this study are: • An expertly curated and annotated dataset of wind turbine blade images with five defect types compiled from Carnero et al. (2023) and Nikolov and Madsen (2020), and formatted in both YOLO and COCO standards. • A comprehensive evaluation of four recent single-stage detectors (YOLOv8, YOLOv9, YOLOv10, and YOLOv11) alongside a representative two-stage detector (Faster R-CNN) for automated defect detection in wind turbine blades. • To mitigate severe class imbalance, StyleGAN2-ADA was utilized to generate high-quality synthetic images for underrepresented defect categories, thereby improving model generalization and achieving equitable per-class performance.
Materials and methods
The following section provides an introduction to the dataset used for training and analysis of the two model architectures applied in this study. Finally, it outlines the evaluation metrics adopted for comparison and discussion.
Dataset acquisition and preparation
Existing dataset
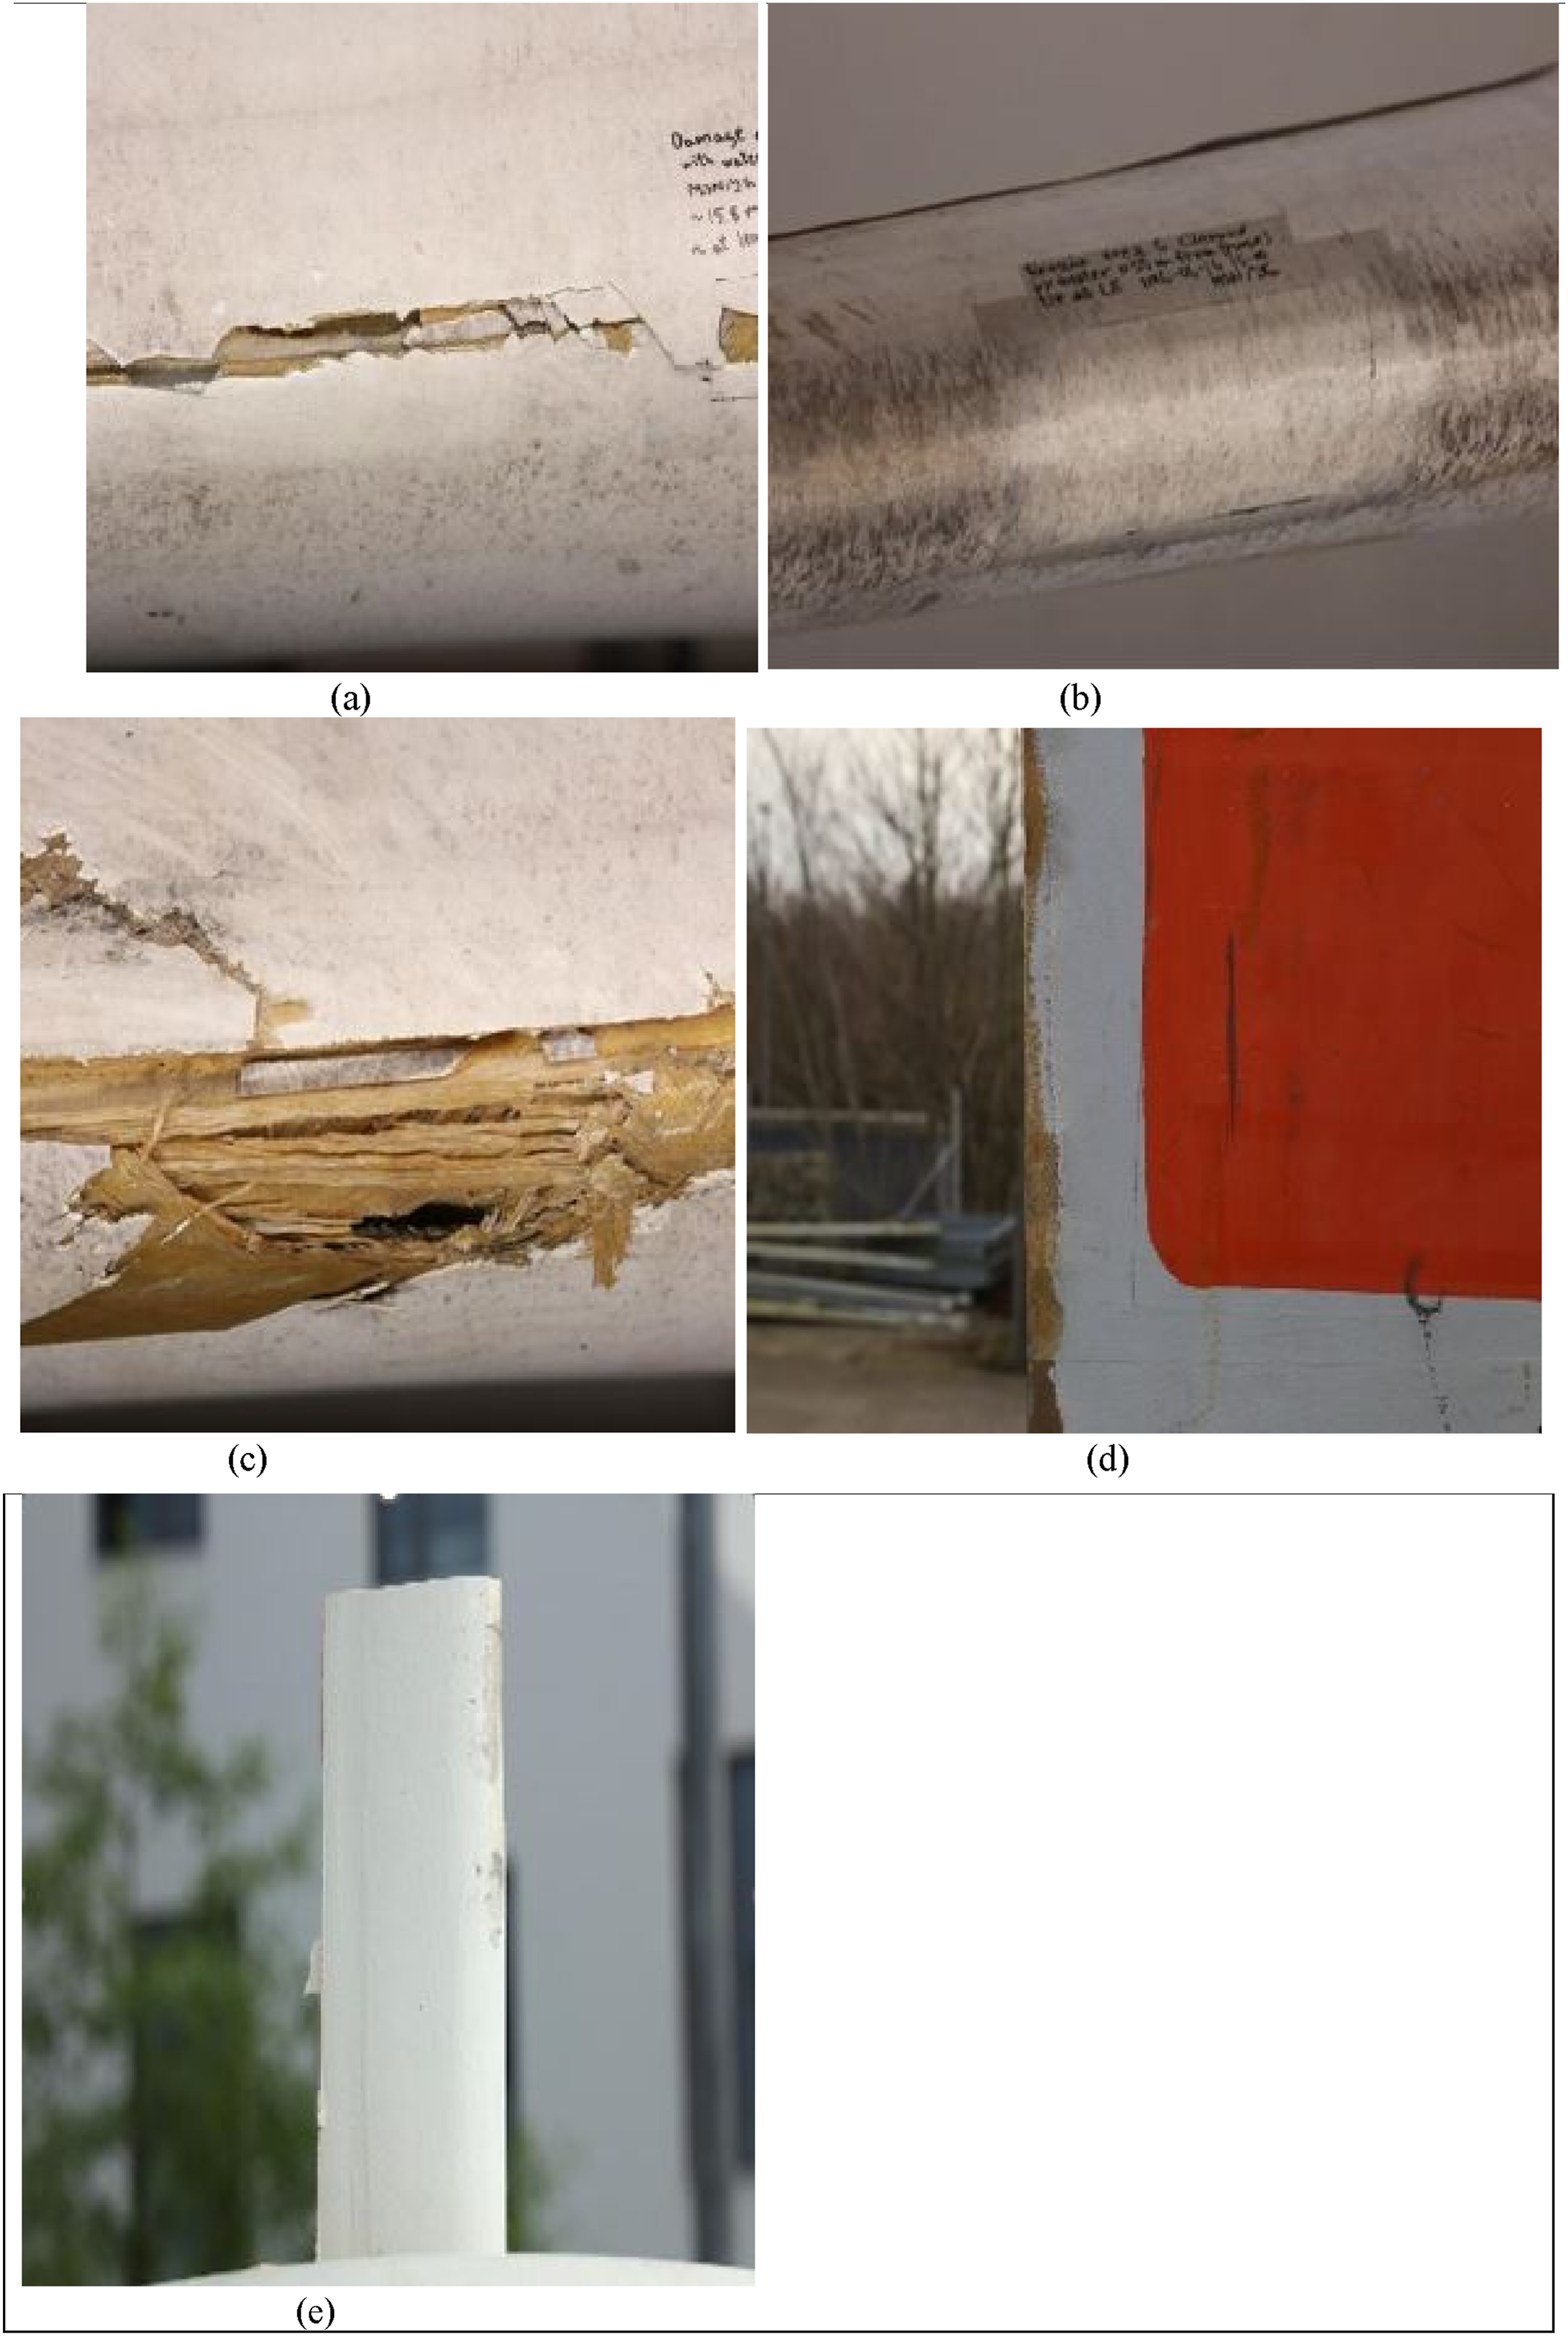
The few publicly available datasets on wind turbine blade defects are limited in size and diverse types of distresses. The majority of the inspection datasets are either private or have limited dataset. Among the available datasets, Nikolov and Madsen (2020) presented one of the more comprehensive collections, featuring 422 images that contain five common defect classes. Subsequently, Carnero et al. (2023) utilized the dataset provided by Nikolov and Madsen (2020) and performed synthetic augmentation to enhance visual diversity by applying color transformations, effectively doubling the dataset size. Figure 1 shows the distribution of image classes on the Carnero et al. (2023) dataset. These images, initially captured by drones, represent various defects on wind turbine blades. This study utilizes the augmented dataset from Carnero et al. (2023) as the base dataset due to its comprehensive coverage of common defect types and improved diversity. Table 2 shows examples of the publicly available wind turbine blade dataset. Figures 2(a)–(e) show examples of the wind turbine blade image defects in the Carnero et al. (2023) dataset. The distribution of image classes in the Carnero et al. (2023) dataset. Publicly available image dataset on wind turbine distresses. Images from Carnero et al. (2023) that capture common distresses on wind turbine blades.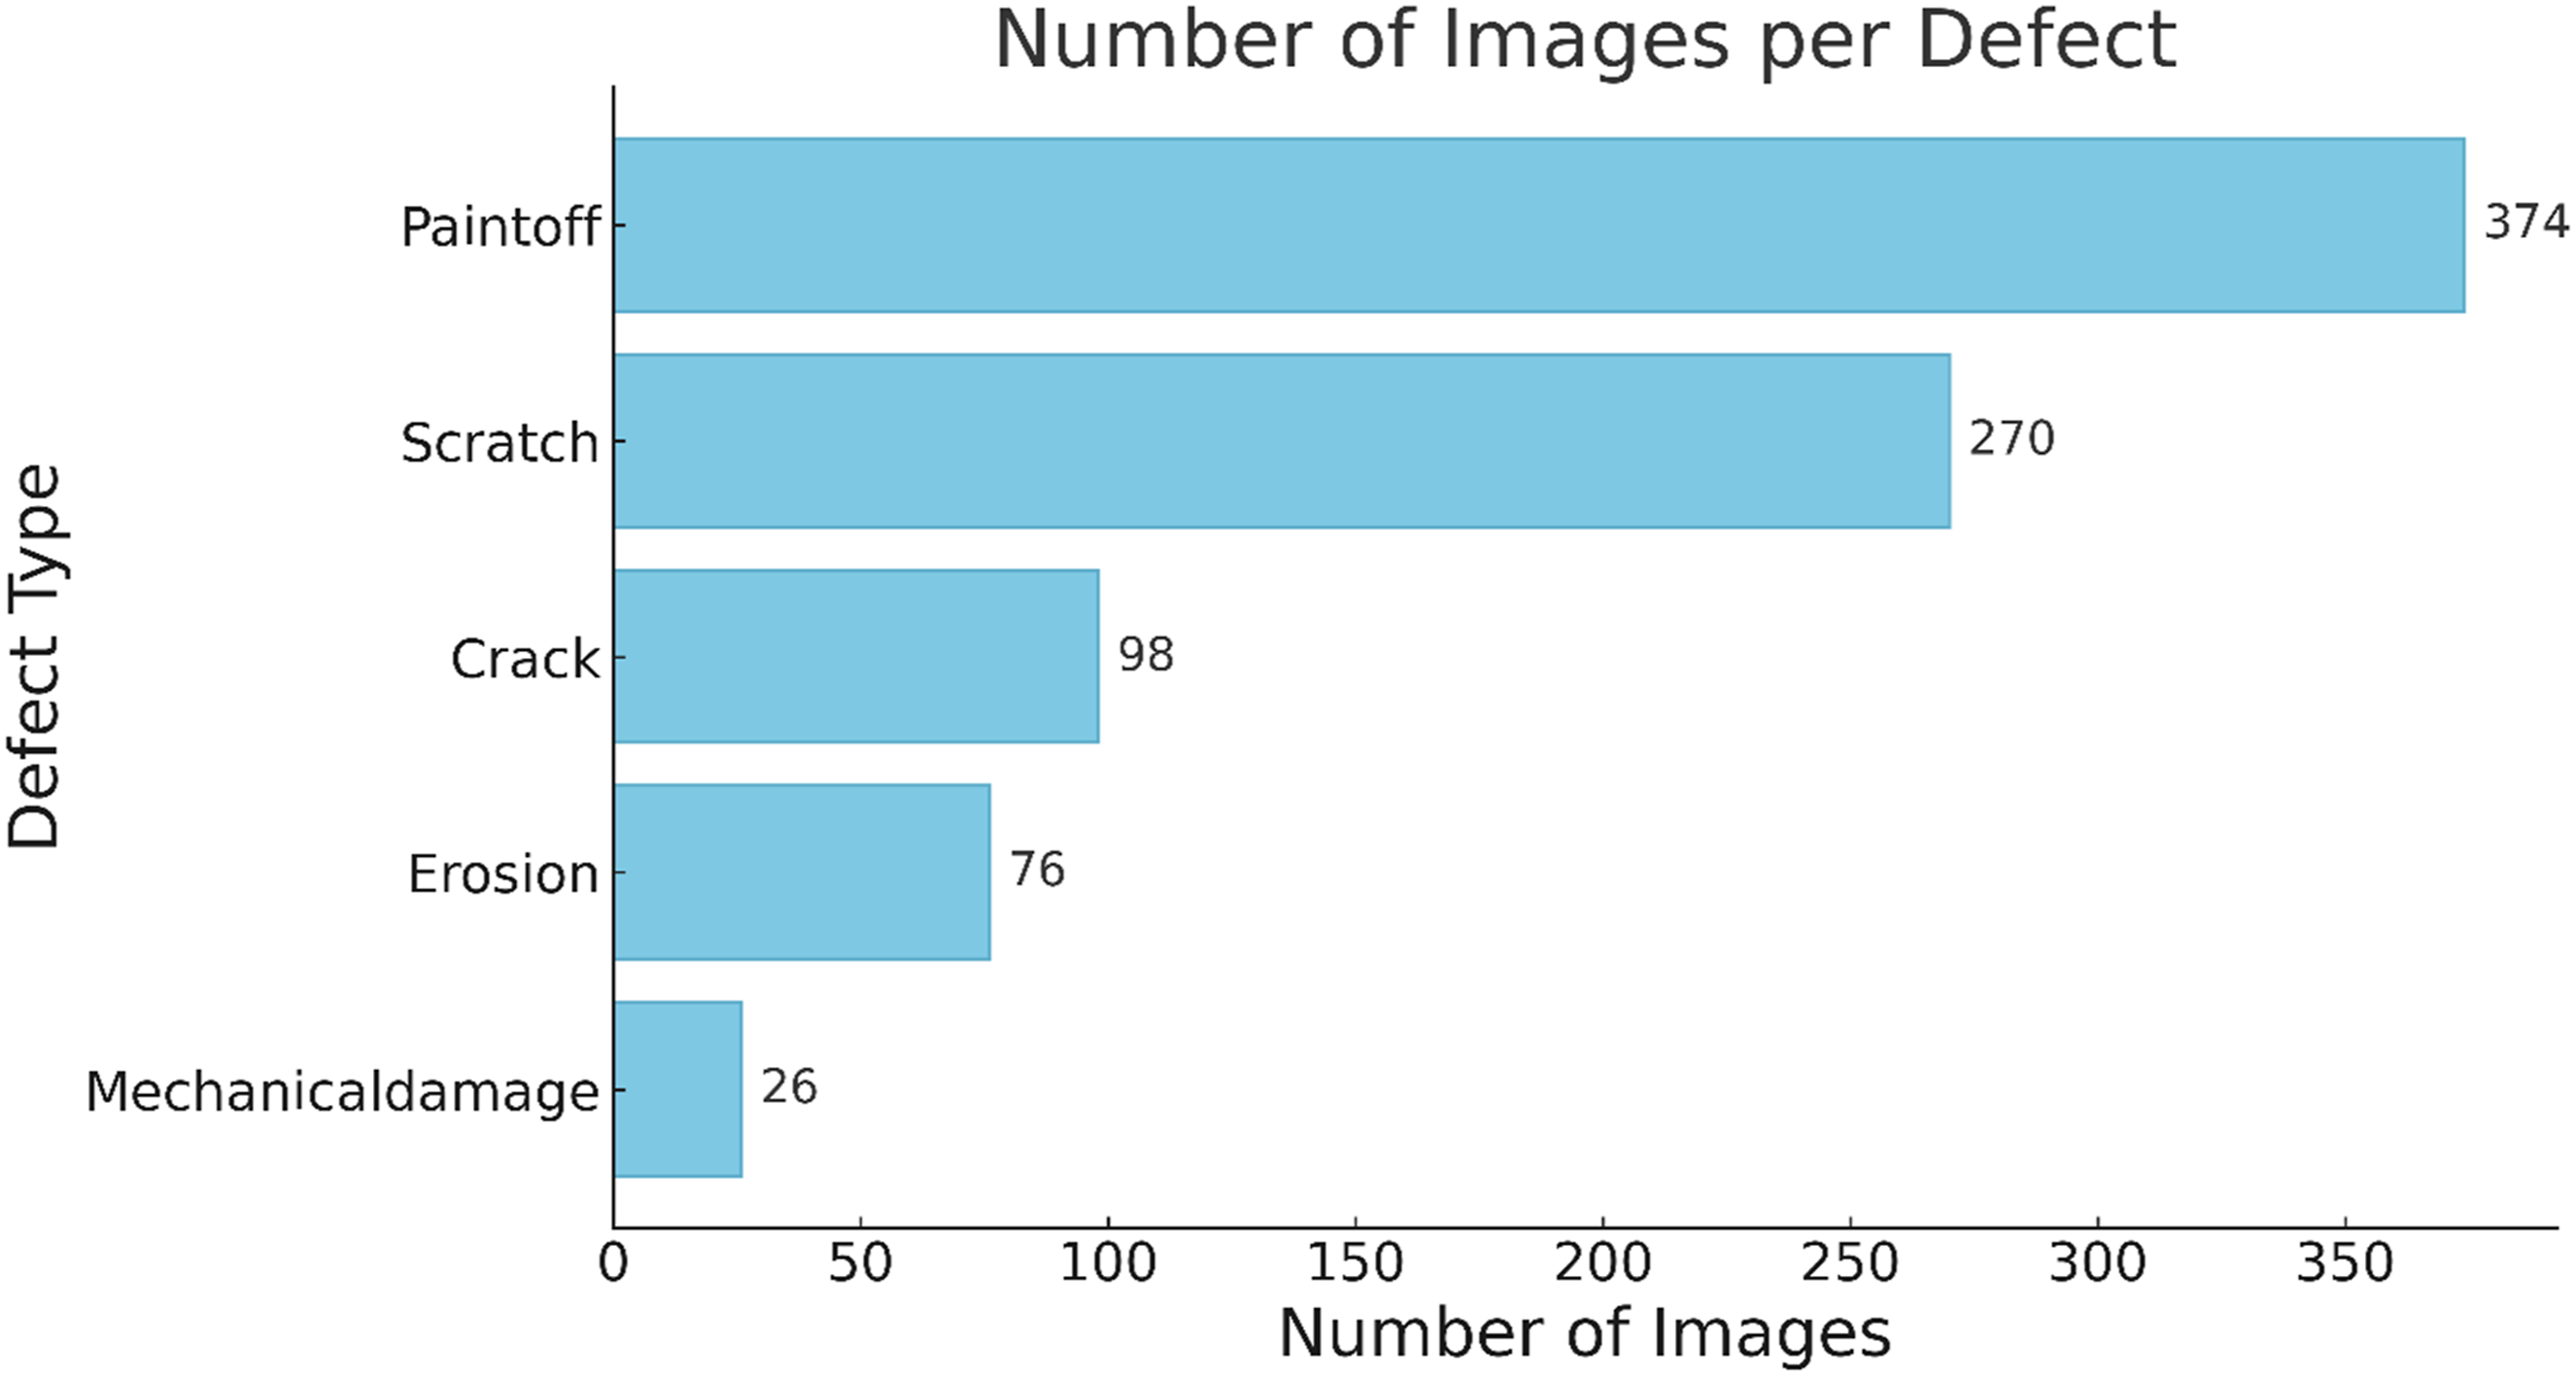
Class distribution and imbalance quantification
To quantify class balance, three global indices and one per-class index were used. (1) Normalized Shannon entropy (J'), (2) Normalized Gini impurity (G*), (3) the Coefficient of Variation on the image counts (CV), and (4) the Ratio-to-uniform.
Let (1) Normalized Shannon entropy, 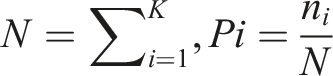

Higher J′ indicates a more even distribution (Pielou, 1966; Shannon, 1948). (2) Normalized Gini impurity,

Higher G* indicates a more even distribution (Breiman et al., 1984). (3) Coefficient of variation,

Lower CV indicates a more even distribution (Sokal and Rohlf, 2012).
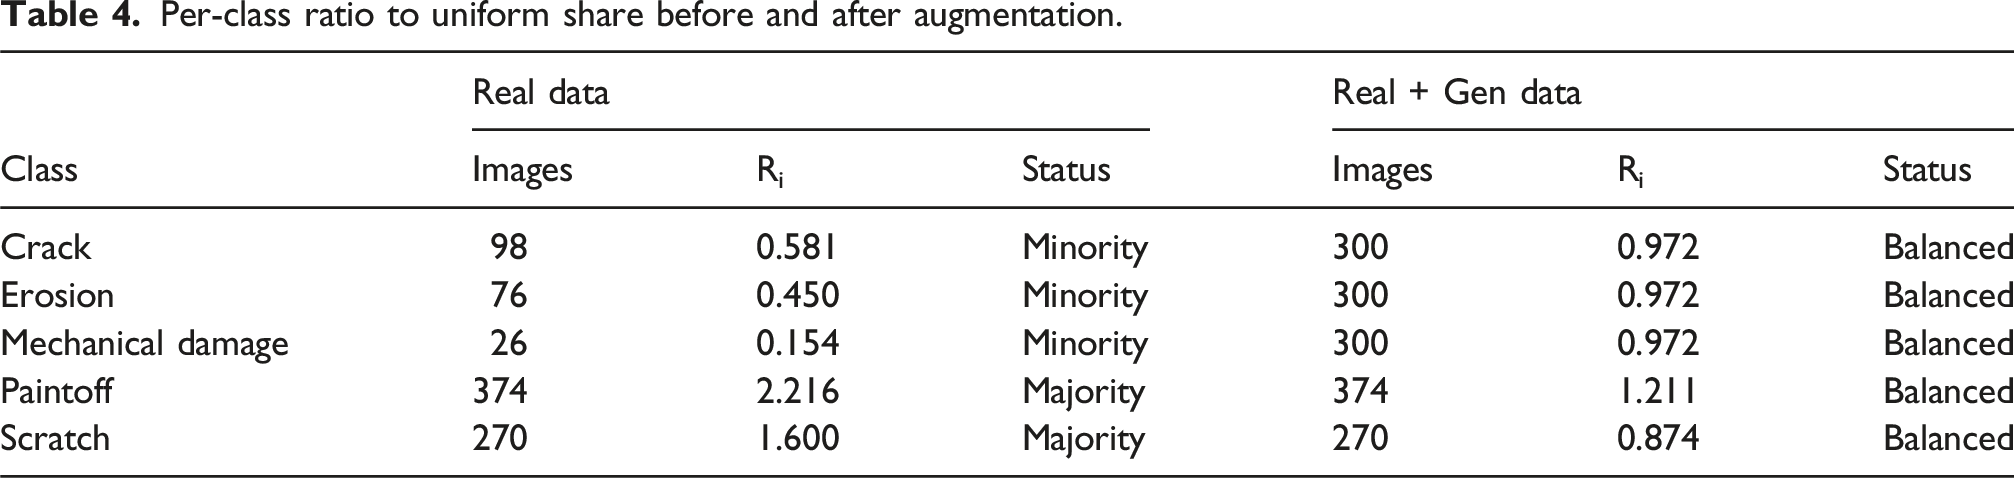
For the per-class index, the ratio to a uniform share was used, as
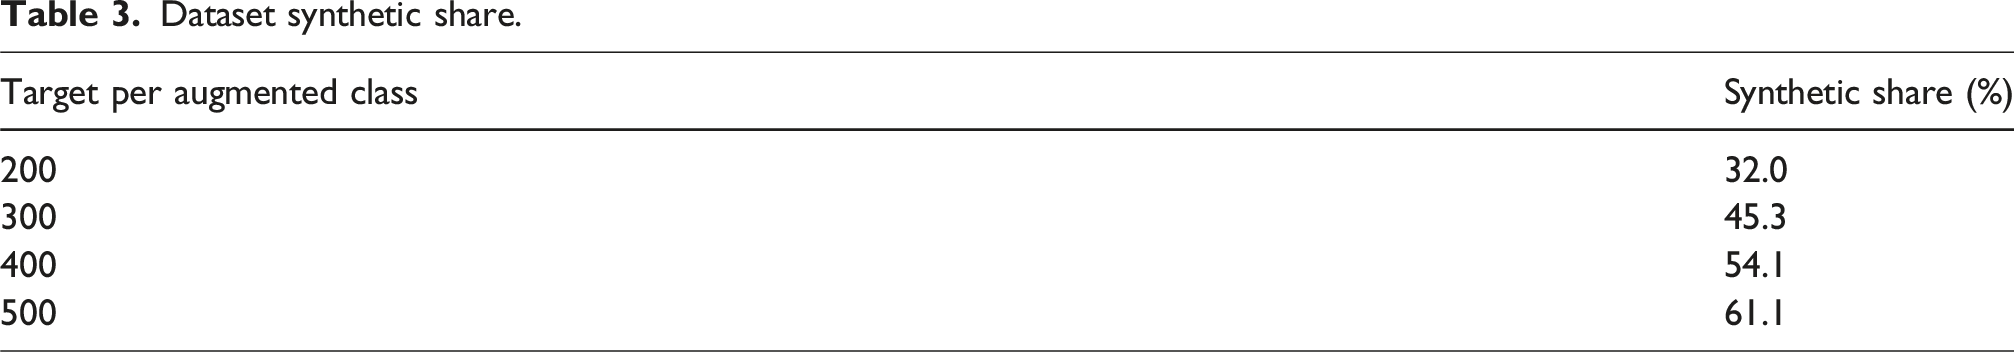
To limit over-reliance on generated data while improving class balance, the dataset-level synthetic share (SS) was capped at ≤ 50%. The synthetic share is defined as:
This practice is consistent with the synthetic-to-real studies, where the use of synthetic data alongside real data shows better accuracy than using either source alone (Richter et al., 2016; Ros et al., 2016; Tremblay et al., 2018). These prior studies report that mixed training (synthetic + real) improves performance; however, an excessive synthetic proportion can exacerbate the domain gap. Recommended practices include domain randomization and realism refinement, as well as real-only validation, to ensure real-world adaptability. Following this, our work treats ≤50% synthetic data as a guardrail rather than an optimum, and primarily uses synthetic images for minority-class balancing, caps their dataset share at ≤50%, and evaluates exclusively on real-only validation and test splits.
Dataset synthetic share.
Per-class ratio to uniform share before and after augmentation.
Global evenness indices before and after augmentation.
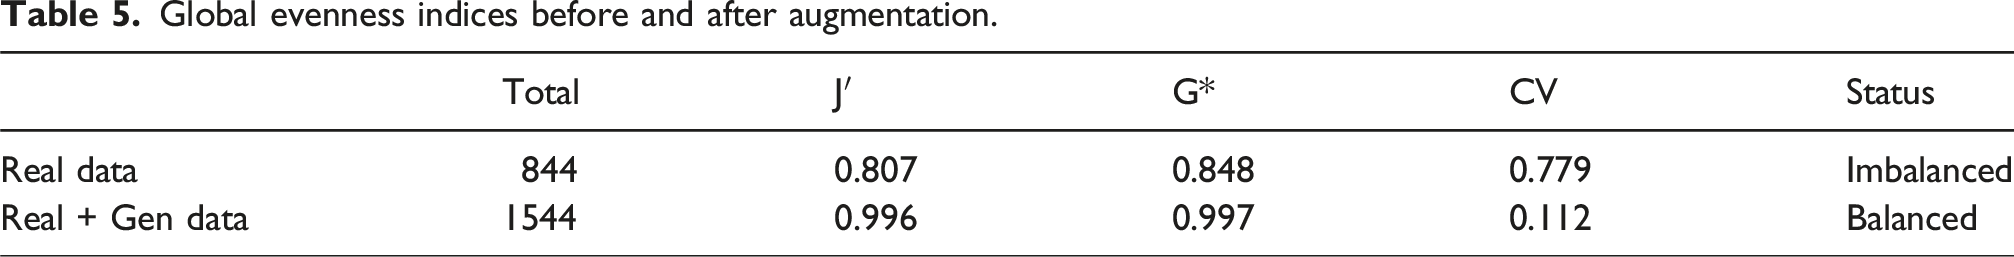
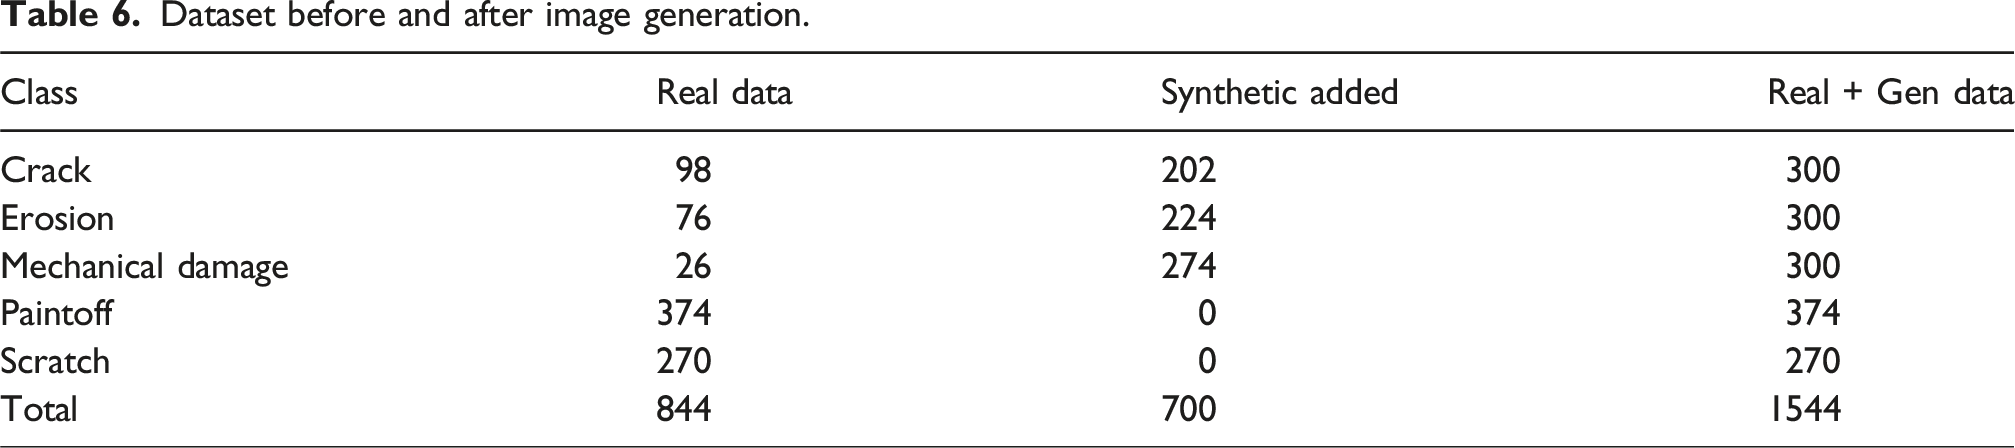
Based on Tables 3–5, which report the dataset synthetic share the per-class ratios to uniform, global evenness indices, 300 images per class is the smallest setting that meets all pre-specified criteria. Accordingly, the totals for Crack, Erosion, and Mechanical Damage were set to 300 images per class (both real and generated).
Synthetic data generation
Given the limited number of images for certain defect classes, synthetic data generation was employed using StyleGAN2-ADA (Karras et al., 2021) to enhance the size of dataset and mitigate class imbalance. Synthetic data augmentation plays a crucial role in developing deep learning models that can generalize effectively across diverse real-world inspection conditions. StyleGAN2-ADA was configured and trained specifically for classes with fewer data points (Crack, Erosion, Mechanical Damage). Training involved iteratively optimizing network parameters to ensure that the generated synthetic images closely resembled actual defects, realistically and diversely. Adaptive discriminator augmentation (ADA) techniques were integrated during training to prevent mode collapse and enhance output variability.
Dataset before and after image generation.
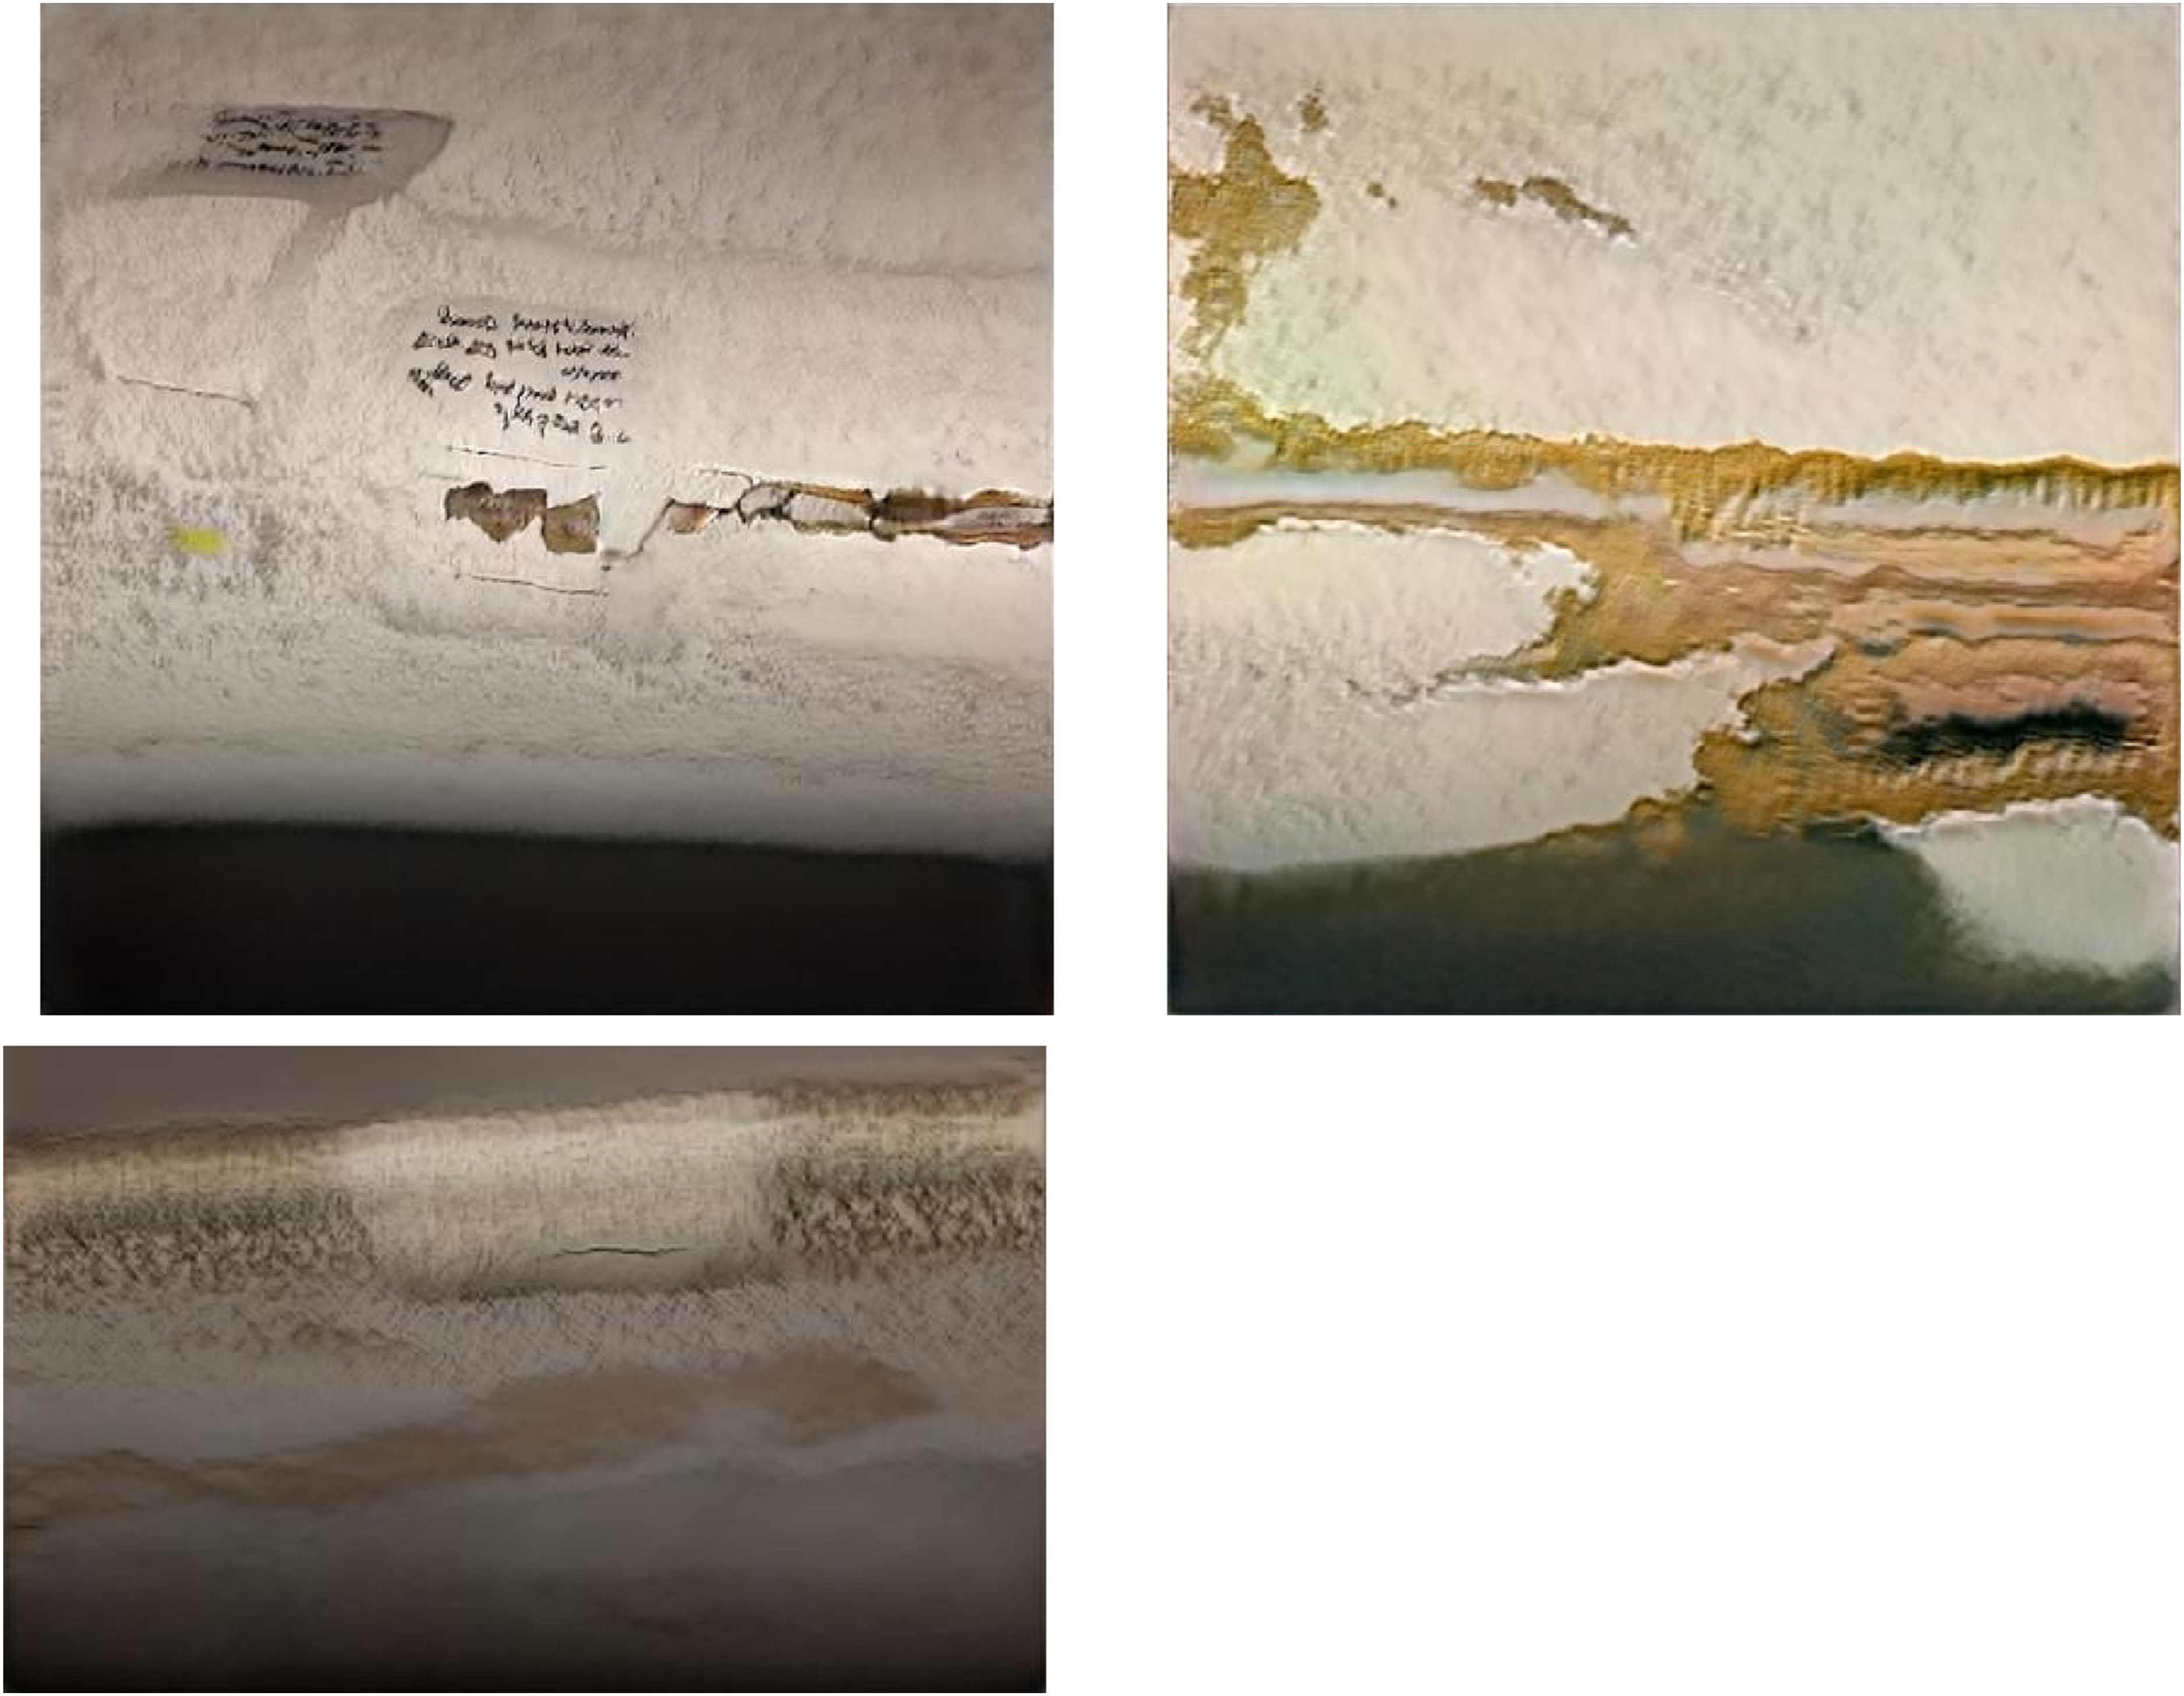
Example of generated images of wind turbine blade with distress.
Dataset splitting
The stratified K-Fold cross-validation approach was applied independently to two scenarios: (1) the original dataset of 844 real images and (2) the augmented dataset combining real images and synthetic images generated by StyleGAN2-ADA. This allowed for direct comparison of model performance across datasets with and without synthetic images. A separate, fixed holdout test set comprising 20% of the original real images was created and used for all experiments to enable fair, direct comparisons. The remaining 80% of the real images formed the development set, which was partitioned using stratified five-fold cross-validation, thereby preserving the class distribution in each fold. Within each CV iteration, models were trained on the four training folds (Real data or Real + Gen data) and validated on the remaining fold using real images only. The test set and validation folds are kept free of synthetic images to prevent leakage and optimistic bias (e.g., near-duplicates inflating accuracy) and to ensure that reported metrics reflect performance on real-world data (Nikolenko, 2021; Ros et al., 2016; Shorten and Khoshgoftaar, 2019; Tremblay et al., 2018). A schematic of the split and cross-validation procedure is provided in Figure S1.
Stratified k-fold cross-validation was adopted to provide robust and unbiased estimates of model performance, particularly in the presence of class imbalance. Unlike a single holdout validation split, stratified k-fold ensures that each fold preserves the overall class distribution, avoiding the risk of underrepresenting minority classes in the validation set. This approach ensures that every image, including those from rare classes, such as crack, erosion, and mechanical damage, serves as a validation instance exactly once, thereby enhancing the reliability and statistical significance of per-class performance metrics. Additionally, this method maximizes data utilization, reduces evaluation variance, and is considered best practice for limited and imbalanced datasets.
Cross-validation design and choice of folds
To prevent distributional leakage from synthetic data, only real images were used for validation (and for the fixed hold-out test set), as detailed previously. Of the 844 real images available, 20% were reserved as a real-only test set, leaving 80% for model development. This study adopted class-stratified K-fold cross-validation on this development set to preserve class proportions within each split. Under K = 5, the approximate number of real validation images per fold is: Crack ≈16, Erosion ≈12, Mechanical Damage ≈4, Paintoff ≈60, Scratch ≈43.
Increasing the granularity to K = 10 would reduce the minority-class sample size per fold (Mechanical Damage to ≈2), rendering class-wise average precision (AP) highly sensitive to a few instances and producing unstable precision–recall curves with wider fold-to-fold variance. Conversely, using fewer folds (e.g., K = 3) would raise per-fold counts (Mechanical Damage ≈7) but at the cost of (i) larger validation fractions per iteration and smaller training splits, potentially impairing model fitting, and (ii) fewer repeats, which increases the Monte-Carlo error of the cross-validated mean and inflates uncertainty in performance estimates.
Balancing these considerations, K = 5 is the largest fold count that preserves ∼4–5 real validation examples in the rarest class per fold while still averaging over multiple stratified splits. This choice jointly promotes (i) fold-wise metric stability for minority classes and (ii) variance reduction of summary estimates through repeated re-sampling. Throughout, mean ± standard deviation (SD) was reported across the five validation folds, which quantifies residual variability due to sampling across cross-validation partitions.
Image annotation
Annotating images is essential for training object detection models, as it enables them to learn both the positions and categories of objects present within each image. All images, including those from the original dataset and the newly generated samples, were carefully annotated to ensure high-quality ground truth data. The annotation process was performed manually using the open-source software LabelImg (Tzutalin, 2015), which offers an effective interface for bounding box annotation. Manual annotation was chosen to promote accuracy and consistency throughout the entire dataset.
Model architectures and selection
This study conducts a comprehensive comparison of modern object detection frameworks, focusing on the YOLO family (YOLOv8, YOLOv9, YOLOv10, YOLOv11) (Jocher et al., 2023, 2024; Wang et al., 2024; Wang and Zhang, 2017) and the standard two-stage Faster R-CNN (with a ResNet-50-FPN backbone) (Ren et al., 2017). The motivation for this dual selection is twofold: (1) to benchmark the most recent advancements in real-time single-stage detection against a widely recognized two-stage baseline and (2) to discuss their respective strengths and limitations for wind turbine blade defect detection, particularly in settings characterized by limited annotated data and significant class imbalance.
YOLO models
This study evaluates four recent versions of the You Only Look Once (YOLO) object detection family: YOLOv8, YOLOv9, YOLOv10, and YOLOv11. The YOLO series is recognized for its single-stage design, enabling real-time detection by predicting bounding boxes and class probabilities in a single network pass (Jocher et al., 2023). These characteristics make YOLO models particularly suitable for large-scale and edge-based inspection tasks, where speed and computational efficiency are crucial (Hussain, 2023).
YOLOv8, developed by Ultralytics, utilizes a fully convolutional architecture with an anchor-free detection head and a decoupled design, resulting in enhanced detection accuracy and speed (Jocher et al., 2023). YOLOv9 incorporates advanced methods such as programmable gradient information (PGI) and the generalized efficient layer aggregation network (GELAN), which help mitigate information loss during feature extraction and enhance computational efficiency. These improvements contribute to more reliable detection of small or difficult defects (Wang and Zhang, 2017). YOLOv10 builds on these advances, incorporating a stable dual-assignment strategy for training without NMS and prioritizing a model architecture optimized for both speed and precision, which further increases detection accuracy and model robustness, particularly beneficial for industrial defect detection tasks (Wang et al., 2024a). YOLOv11 is the newest version at the time of this study, featuring a redesigned backbone and neck, optimized attention mechanisms, and a streamlined training pipeline. This provides improved feature extraction, faster inference, and superior accuracy for challenging object detection problems (Jocher et al., 2024).
All YOLO models in this work were implemented using the official Ultralytics Python library. The “large” variants of these models were chosen for their balance between model capacity and computational efficiency, as well as for their suitability for deployment on GPU-accelerated cloud platforms and, potentially, on resource-constrained edge devices. The overview architectures of the YOLO models are shown in Figure 4. Overview of image-based distress detection using YOLO models architecture.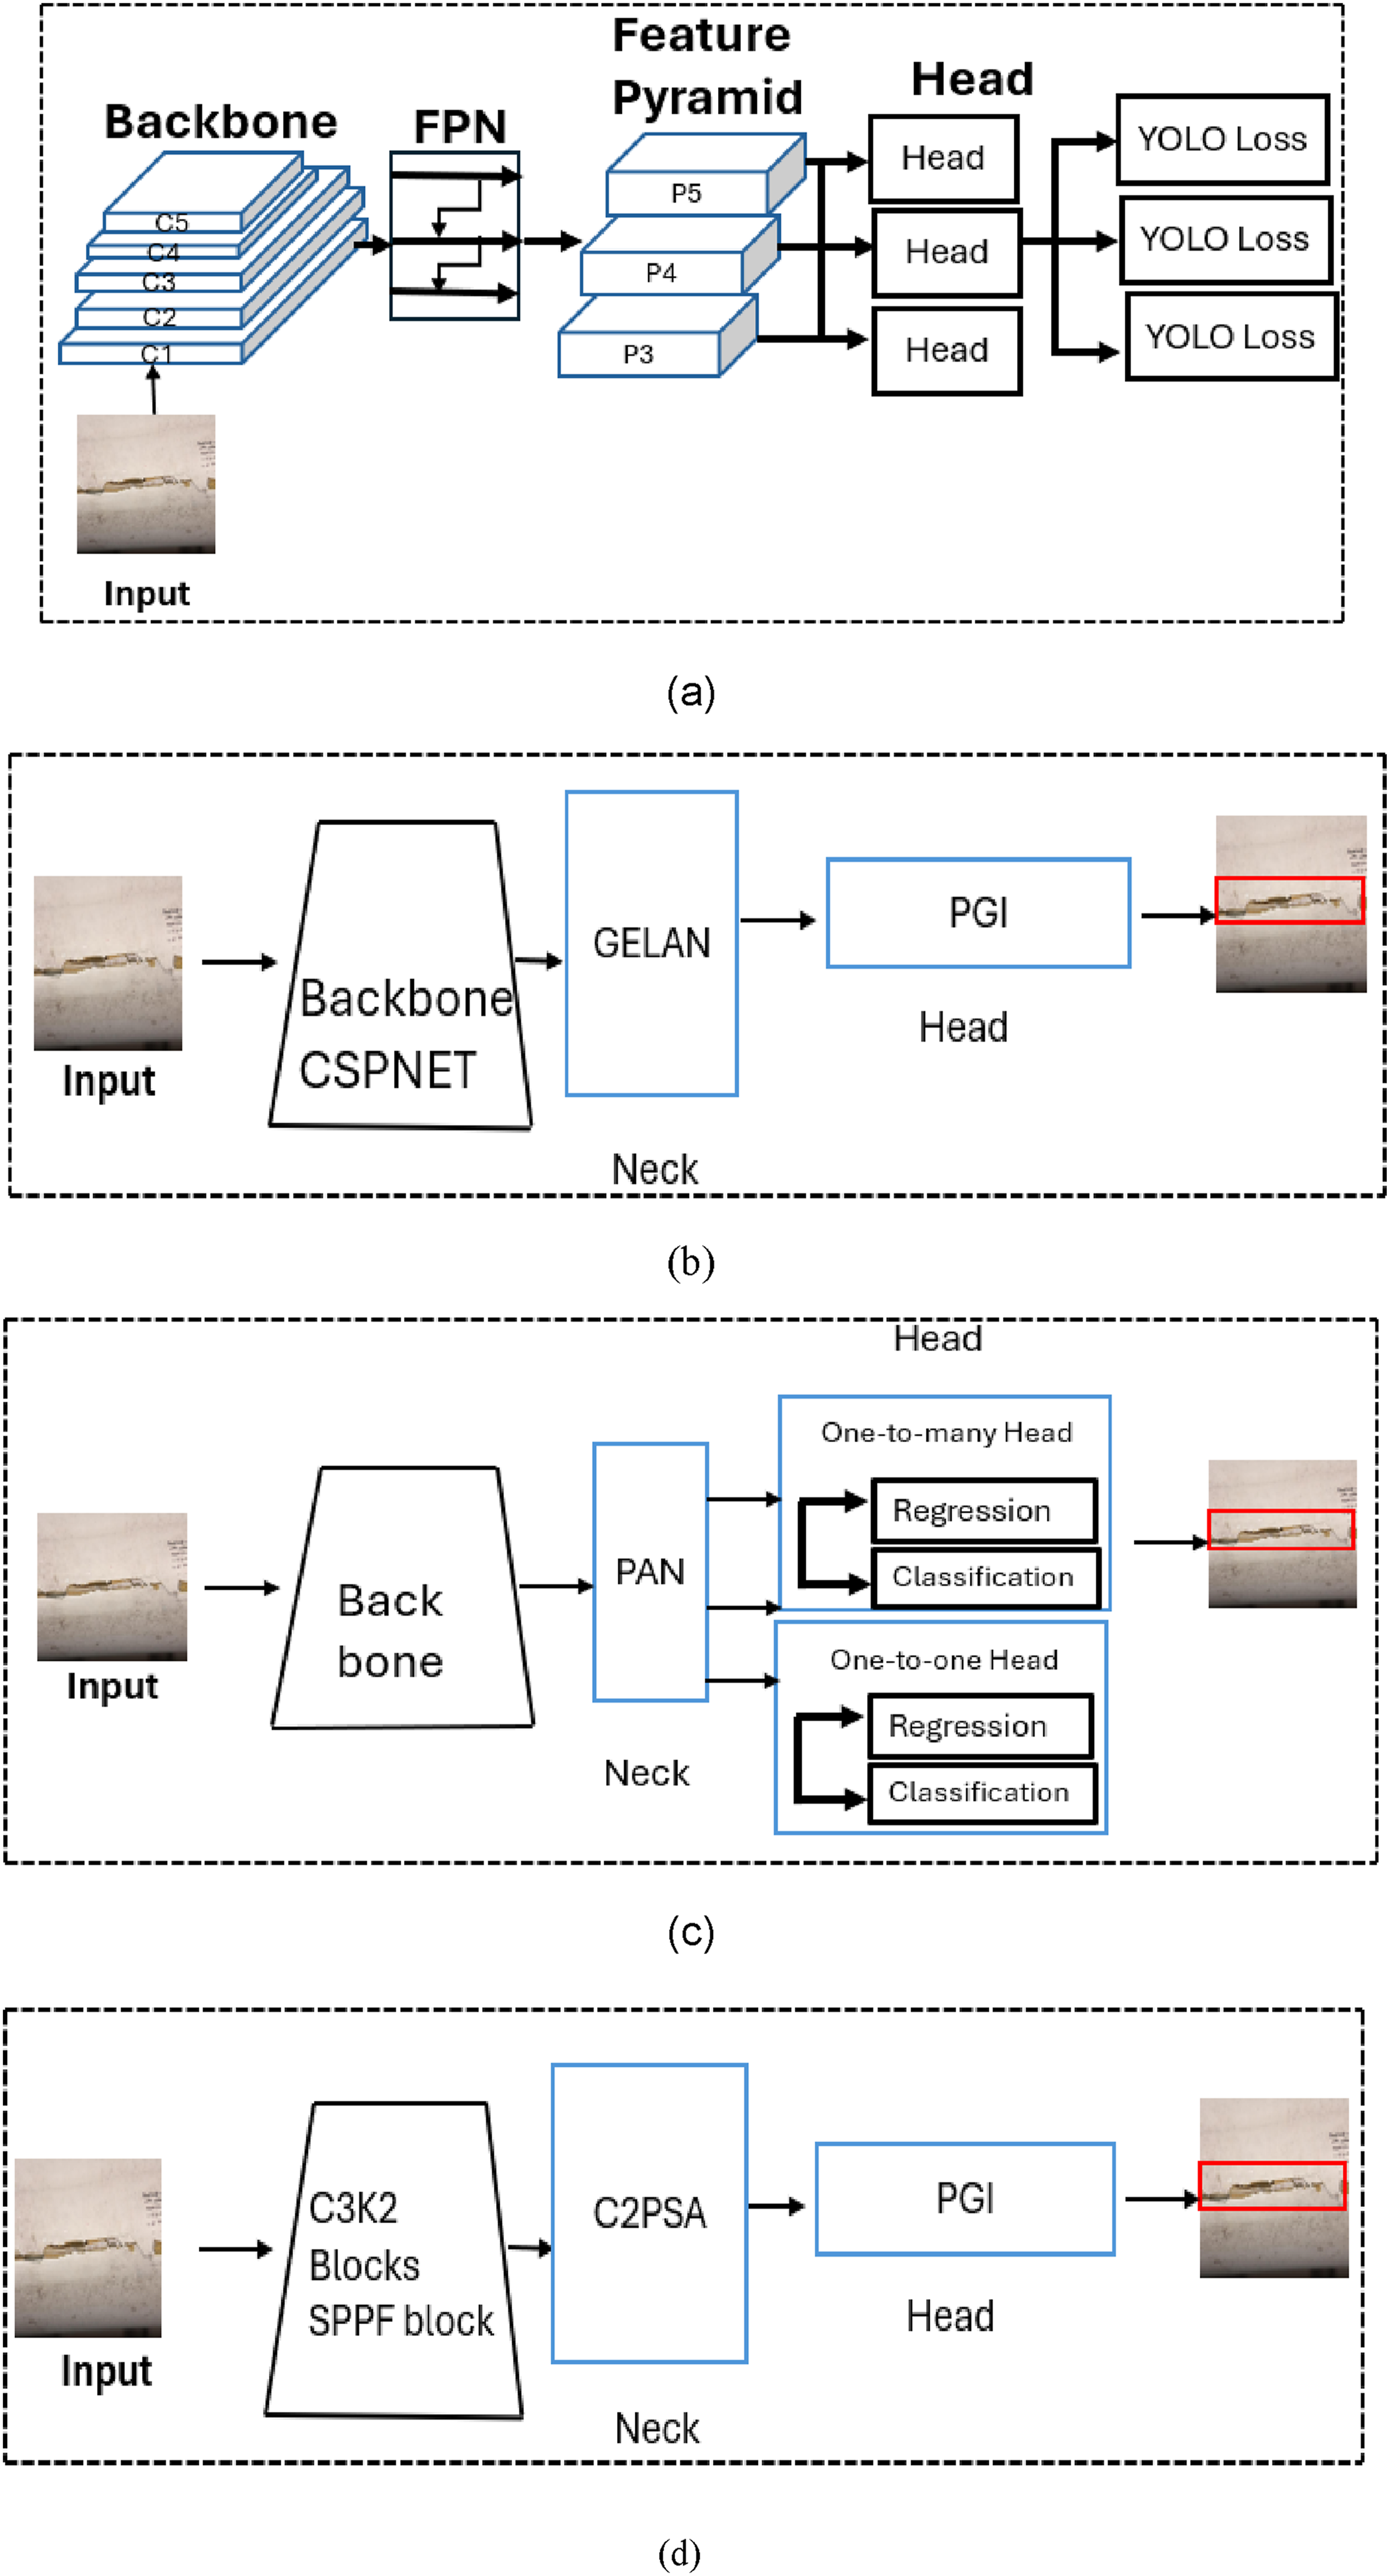
All models were initialized with weights pre-trained on the COCO dataset and trained for up to 100 epochs. The batch size, along with the learning rate, momentum, optimizer, and other key training parameters, was treated as a tunable hyperparameter and optimized using Bayesian Optimization, as elaborated in the earlier part of this paper.
Faster R-CNN with ResNet-50-FPN
Faster R-CNN, a widely adopted two-stage object detector, was included in this study to serve as a benchmark against the single-stage YOLO architectures. This model is recognized for its high localization and classification accuracy, particularly where detection precision is more crucial than real-time inference speed (Ren et al., 2017). The Faster R-CNN framework is comprised of three key components: a deep convolutional neural network backbone for extracting features, a region proposal network (RPN) for identifying potential object regions, and dedicated heads for classification and bounding box regression (Carranza-García et al., 2021). This study utilized a ResNet-50 backbone enhanced with a feature pyramid network (FPN), in accordance with the PyTorch torchvision implementation (as seen in Figure 5). The inclusion of FPN enables the model to leverage features at multiple scales, improving its ability to identify defects of varying sizes and shapes on wind turbine blades. Training was performed using the same data splits as the YOLO models, with input images standardized to 640 × 640 pixels for uniformity. Core hyperparameters, including initial learning rate, batch size, weight decay, RPN anchor configuration, and the learning rate scheduler, were tuned via Bayesian Optimization as outlined in Section 2.2.3. Overview of Faster RCNN model architecture.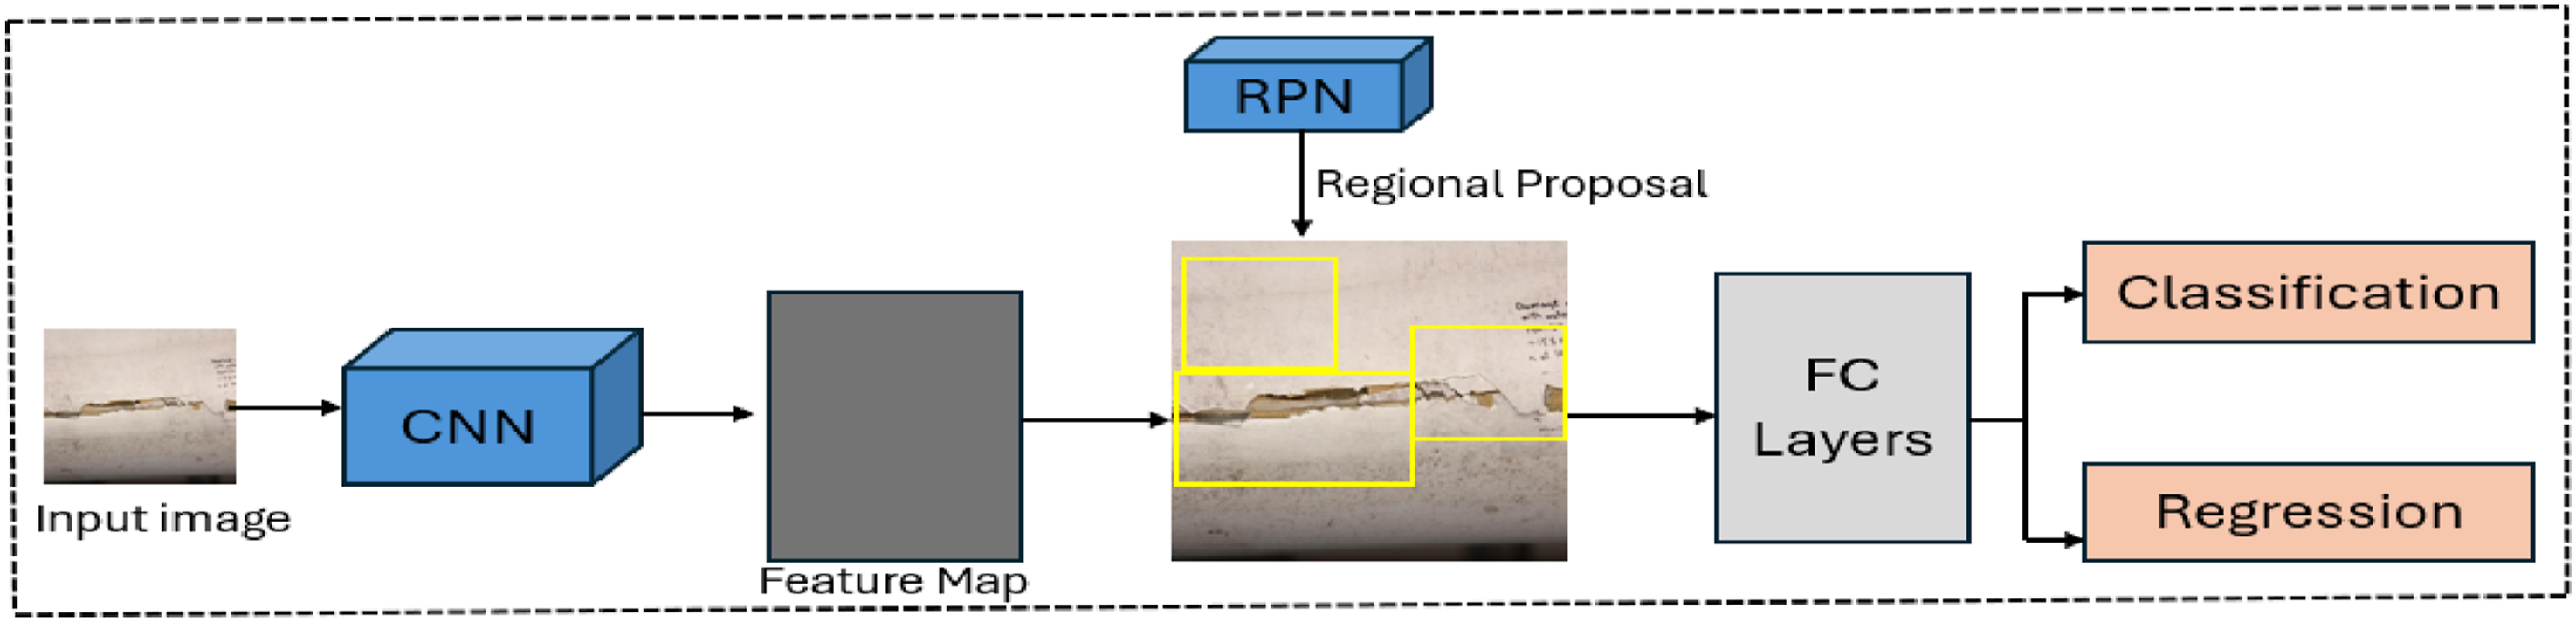
For a fair comparative analysis, all models were trained and evaluated using the same datasets, image preprocessing pipelines, and cross-validation splits. Both real and augmented (generated) datasets were utilized to assess model robustness under varying data availability and class imbalance scenarios. Training and evaluation were performed under equivalent computational settings, including preprocessing workflows, and cross-validation setups so that any observed differences in performance could be attributed to the models themselves rather than variations in experimental setup. The diagrammatic illustration of the methodology is shown in Figure 6. Illustration of the proposed methodology.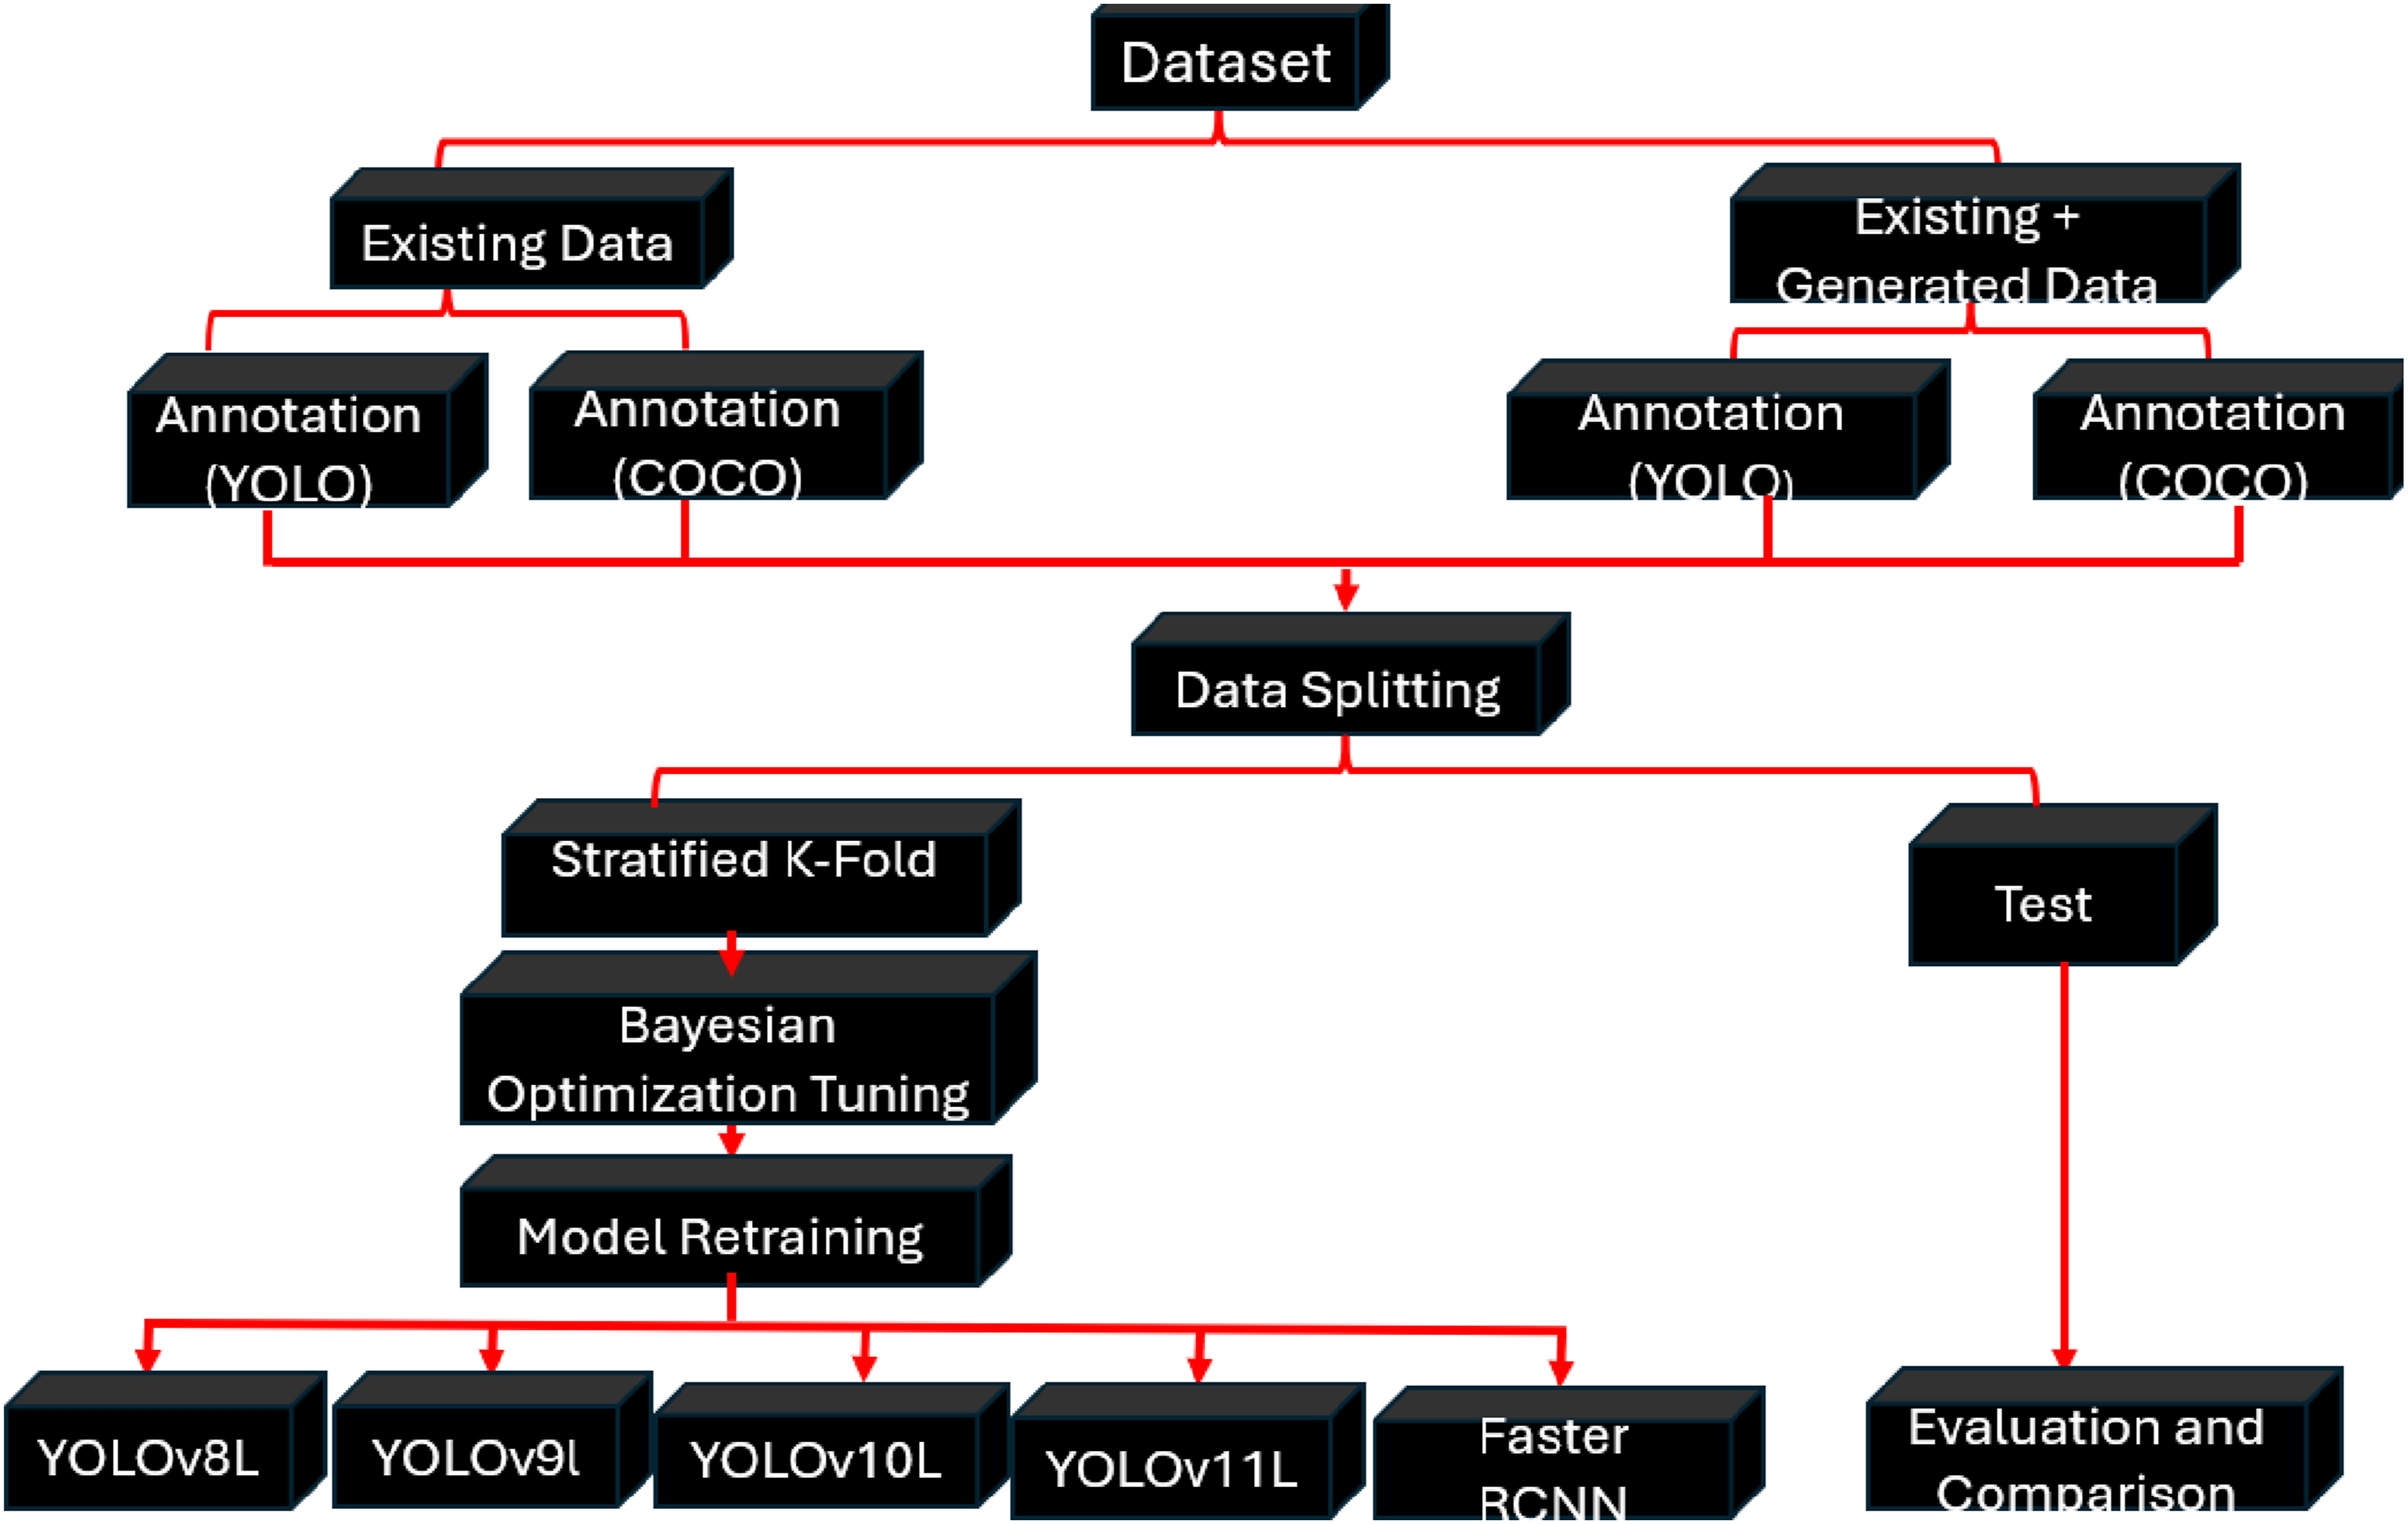
The training experiments were conducted using Google Cloud Pro, equipped with 83 GB of system RAM, 40 GB of GPU RAM, and 113 GB of disk space. An NVIDIA A100-SXM4-40GB GPU (CUDA 12.4, driver version 550.54.15) was utilized in this environment, enabling experimental runs with various learning rates and epoch values across different models.
Hyperparameter optimization
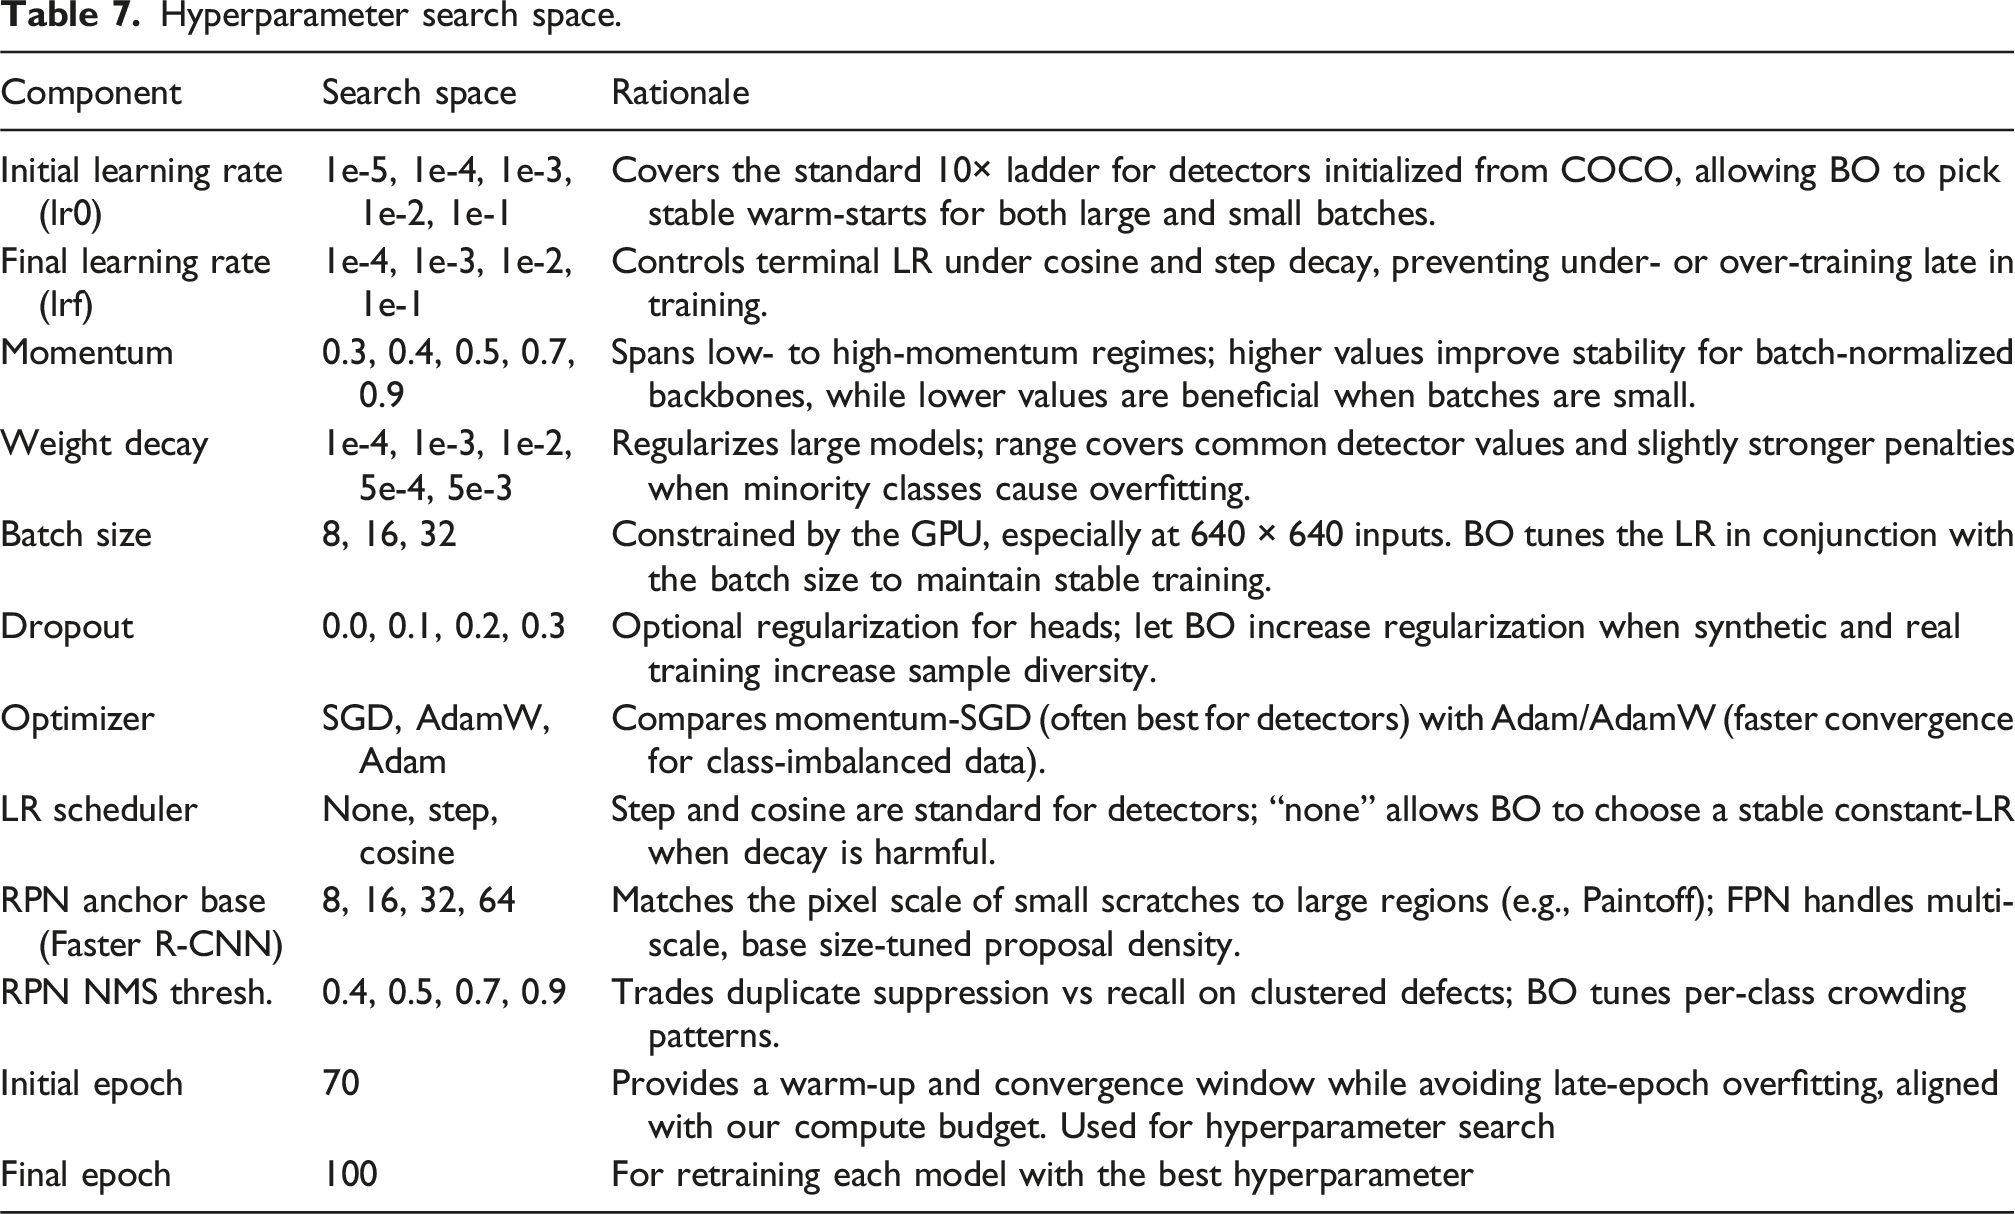
The hyperparameters of the models are fine-tuned with Bayesian Optimization (BO). Bayesian Optimization is recognized as an effective and efficient method for tuning deep learning hyperparameters, particularly in high-dimensional spaces where model training is computationally intensive (Snoek et al., 2012). Unlike manual, grid, or random search methods, BO constructs a model of the objective function and iteratively proposes hyperparameter configurations that are likely to yield improved results, thereby accelerating convergence toward optimal settings.
Hyperparameter search space.
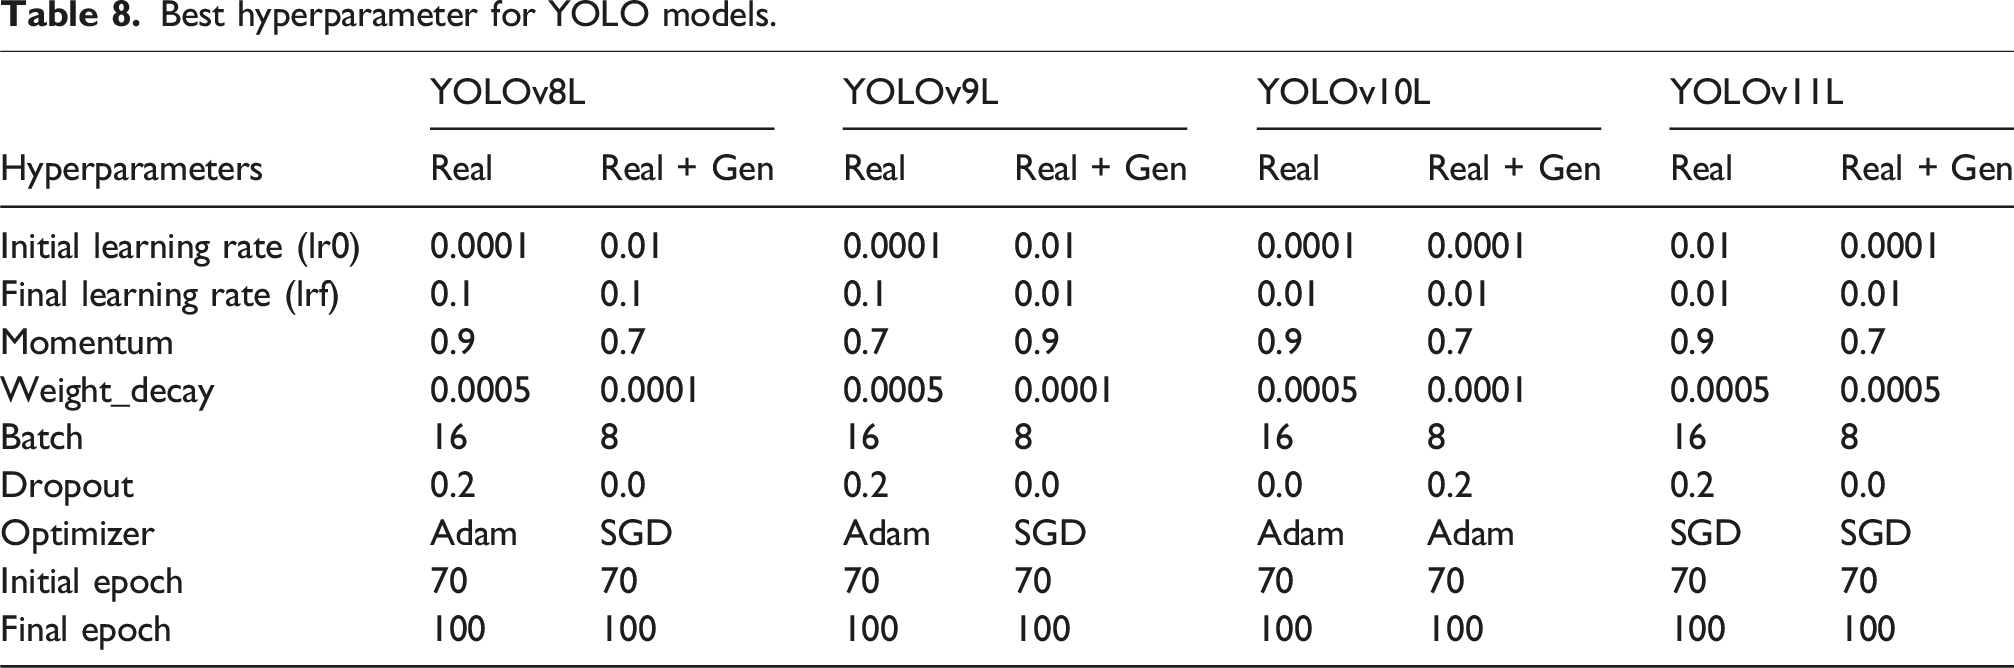
Best hyperparameter for YOLO models.
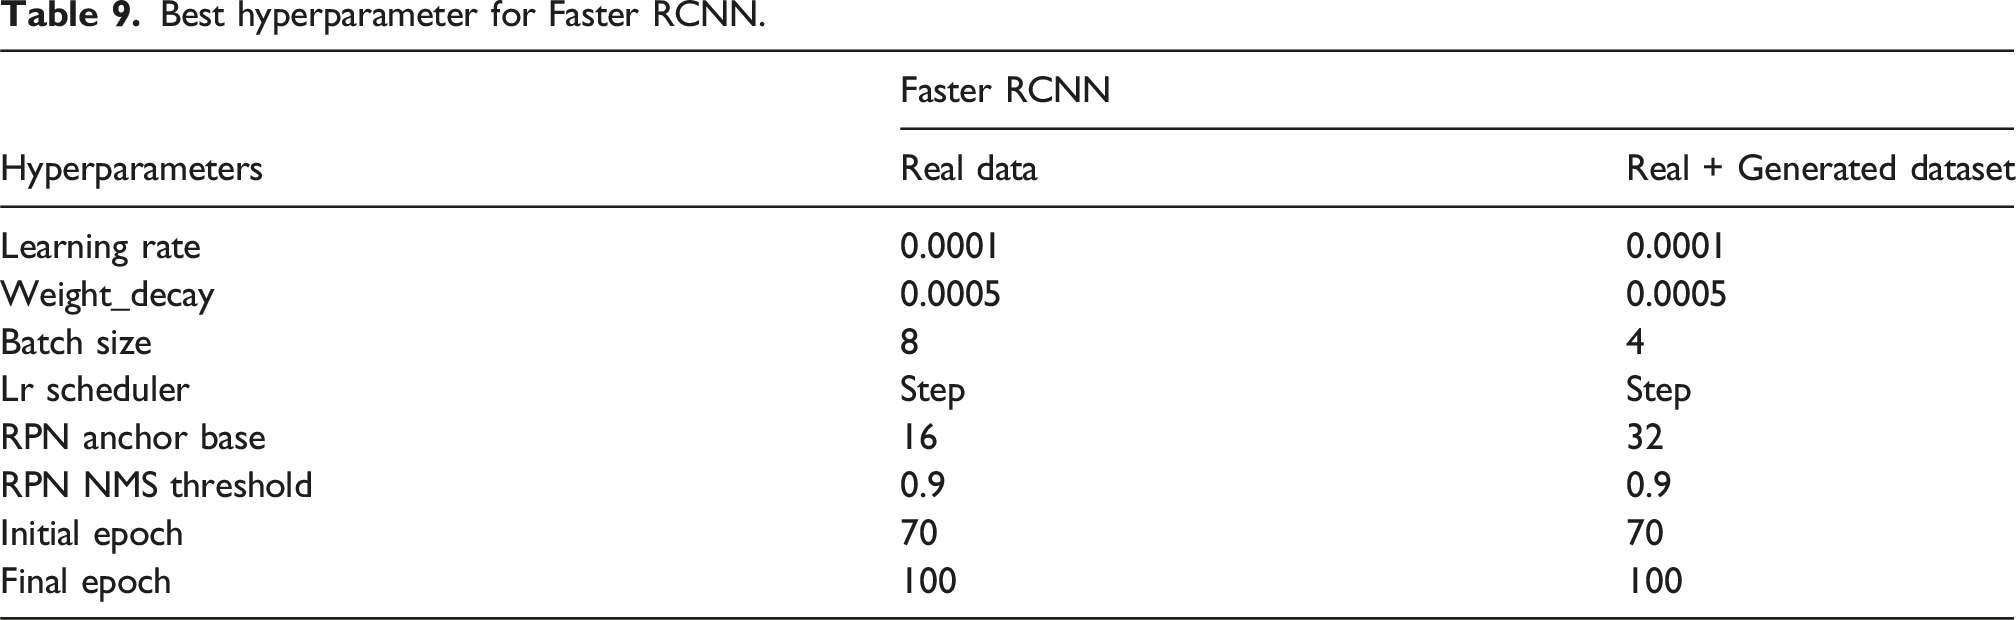
Best hyperparameter for Faster RCNN.
Evaluation metrics
The performance of the models on the wind turbine dataset was evaluated using standard metrics, including precision, recall, and mean average precision (mAP), across various intersection over union (IoU) thresholds. These metrics are essential for evaluating how accurately and reliably each model’s predicted bounding boxes align with the ground truth annotations. Precision measures the proportion of correctly predicted positive detections among all positive predictions made by the model. Recall assesses the proportion of actual positives that the model correctly detects (Padilla et al., 2020). The equations of Precision and Recall are shown in equations (6) and (7), respectively.

True positives occur when the model accurately detects an annotated object of interest. In contrast, False positives occur when the model mistakenly identifies an object that does not exist in the ground truth. False negatives occur when the model fails to detect an object that is actually present in the ground truth annotations (Padilla et al., 2020). An increased precision score indicates that the model makes fewer false positive errors, resulting in more accurate detections. Conversely, a higher recall value indicates the model’s ability to effectively identify true positive instances, highlighting its sensitivity to the target objects.
Mean Average Precision (mAP) serves as a holistic metric for evaluating detection across multiple object classes. The calculation involves first obtaining the average precision (AP) for each class, defined as the area under the precision-recall curve, which reflects the trade-off between precision and recall across different confidence levels. The mAP is subsequently determined by averaging the AP scores of all classes. A higher mAP score signifies improved overall object detection performance, indicating that the model achieves greater precision and recall for all target classes. It is expressed mathematically as:
mAP@50 is the average precision calculated at an intersection over union (IoU) threshold of 0.50. It’s a measure of the model’s accuracy considering only the easy detections. mAP@50-95 is the average of the mean average precision calculated at varying IoU thresholds, ranging from 0.50 to 0.95.
All evaluation metrics for the YOLO models were obtained using the Ultralytics framework’s built-in routines, which follow the COCO standard. For Faster R-CNN, metrics were calculated with the pycocotools library to maintain consistency and enable direct comparison between the different models. Results are reported as mean ± standard deviation across stratified 5-fold cross-validation and on the independent holdout test set.
Results
This section presents a comparative performance of the YOLO models (v8, v9, v10, v11) and Faster R-CNN on the dataset. Results are reported for both the original dataset and the augmented dataset that includes StyleGAN2-ADA-generated synthetic images. Model evaluation was conducted using stratified 5-fold cross-validation, and performance is assessed with mean Average Precision at IoU 0.5 (mAP@0.5) as the primary metric, alongside per-class results and standard deviation to reflect robustness across folds.
YOLO models and Faster RCNN performance on validation set
Per-class AP@0.50 and mAP@0.50 (mean ± SD, 5-fold) on validation folds.
In the top panel, all YOLO variants substantially outperform Faster R-CNN, especially on the most under-represented class (mechanical damage), where Faster R-CNN attains AP@0.50 = 0.569 versus 0.772–0.805 for YOLO models. The highest macro mAP@0.50 is achieved by YOLOv11L: 0.932 ± 0.017, closely followed by YOLOv9L and YOLOv10L. Performance remains lower on mechanical damage (e.g., YOLOv11L: 0.805 ± 0.108) than on the other classes (≈0.96 on average), reflecting its scarcity and complexity.
In the bottom panel, adding synthetic images improves all architectures, with the largest gains on minority classes. Across YOLO variants, macro mAP@0.50 spans 0.958–0.967 (YOLOv8L: 0.961 ± 0.007; YOLOv9L: 0.966 ± 0.011; YOLOv10L: 0.958 ± 0.011; YOLOv11L: 0.967 ± 0.007). YOLOv11L remains best on average. Faster R-CNN also improves from 0.801 ± 0.020 to 0.946 ± 0.013, though it still trails the YOLO models. For the most challenging and underrepresented class, YOLOv11L rises from 0.805 ± 0.108 (Real) to 0.969 ± 0.022 (Real + Gen), emphasizing the benefit of synthetic augmentation for minority-class detection.
YOLO models and Faster RCNN performance on holdout test set
Per class AP@50 of models on the holdout test.
Performance evaluation of models on the holdout test.
Note. Model size (MB) denotes the on-disk checkpoint footprint. Since the architecture and precision are unchanged, model size is the same for Real and Real + Gen training.
As shown in Table 10, adding generated data consistently improves the minority class (mechanical damage) across all architectures. For example, YOLOv10L improves from 0.69 to 0.95, YOLOv11L from 0.83 to 0.98, and Faster R-CNN from 0.60 to 0.71 AP@0.50. Small decreases appear for some majority classes (e.g., scratch and paintoff); this is an expected trade-off when rebalancing toward rare patterns.
As seen in Table 12, the mAP@0.50 increases for YOLOv9L (from 0.934 to 0.963), YOLOv10L (from 0.914 to 0.954), YOLOv11L (from 0.951 to 0.969), and Faster R-CNN (from 0.846 to 0.896); YOLOv8L is essentially unchanged (from 0.961 to 0.958). At stricter IoUs, mAP@[.50:.95] rises for all models, for instance, YOLOv8L from 0.686 to 0.753 and YOLOv11L from 0.690 to 0.786, indicating better localization after augmentation. Precision and recall trends mirror these gains, with the largest improvement for Faster R-CNN.
Inference times and model sizes are effectively unchanged by augmentation (YOLO ≤ ∼11 ms per image; 48–84 MB; Faster R-CNN ≈26 ms, 158 MB), so the accuracy gains do not carry a runtime or memory cost.
Conclusively, across the fixed holdout, YOLO models consistently outperform Faster R-CNN in both accuracy and efficiency. The best overall trade-off is YOLOv11L with mAP@0.50 of 0.969 at 9.7 ms per image and 48.8 MB, enabling real-time deployment on edge devices. Minority-class gains are significant: mechanical-damage AP@0.50 improves from 0.83 to 0.98 when adding StyleGAN2-ADA rebalancing, while precision and recall remain high. These trends replicate across other YOLO variants, indicating that class-balanced data, not just architecture choice, is pivotal.
The Precision-Recall curves for all evaluated models on the holdout test set, using both real plus generated images for training, are shown in Figure 7. The curves indicate that all YOLO models maintain high precision and recall across a broad range of thresholds. In contrast, Faster R-CNN’s curve falls below those of the YOLO models, especially for mechanical damage, confirming the trend seen in Table 10. Precision-recall curve of the models for Real + Generated images.
Model inference speed and resource efficiency
All YOLO models achieved <11 ms per image inference and maintained compact model sizes (48–84 MB) on the holdout test (Table 10). Among them, YOLOv11L provided the best accuracy–latency trade-off (mAP@0.50 = 0.969, mAP@[0.50:0.95] = 0.786, 9.7 ms, 48.8 MB). These characteristics make YOLOv11 well-suited for real-time deployment on resource-constrained platforms, including edge devices, UAVs, and web or mobile applications. In contrast, Faster R-CNN required substantially more compute (approx 26 ms per image; 158 MB), which limits its practicality for time-sensitive or embedded settings.
These findings emphasize the practical advantages of adopting modern single-stage detectors for automated wind turbine blade defect detection. Deploying accurate and efficient models, such as YOLOv11, on embedded or mobile platforms enables real-time monitoring of blade conditions and facilitates rapid maintenance interventions when defects are detected. Overall, the YOLO family, particularly YOLOv11L, offers a favorable balance between detection performance and computational efficiency, supporting scalable, industry-ready solutions for reliable wind turbine blade health assessment. Figure 8 shows visual examples of YOLOv11L detections on holdout images, illustrating accurate localization on minority defects; additional examples appear in Figure S2. YOLOv11L detections on the real-only holdout test set: (a) Crack, (b) Erosion, (c) Mechanical Damage, (d) Paintoff, (e) Scratch.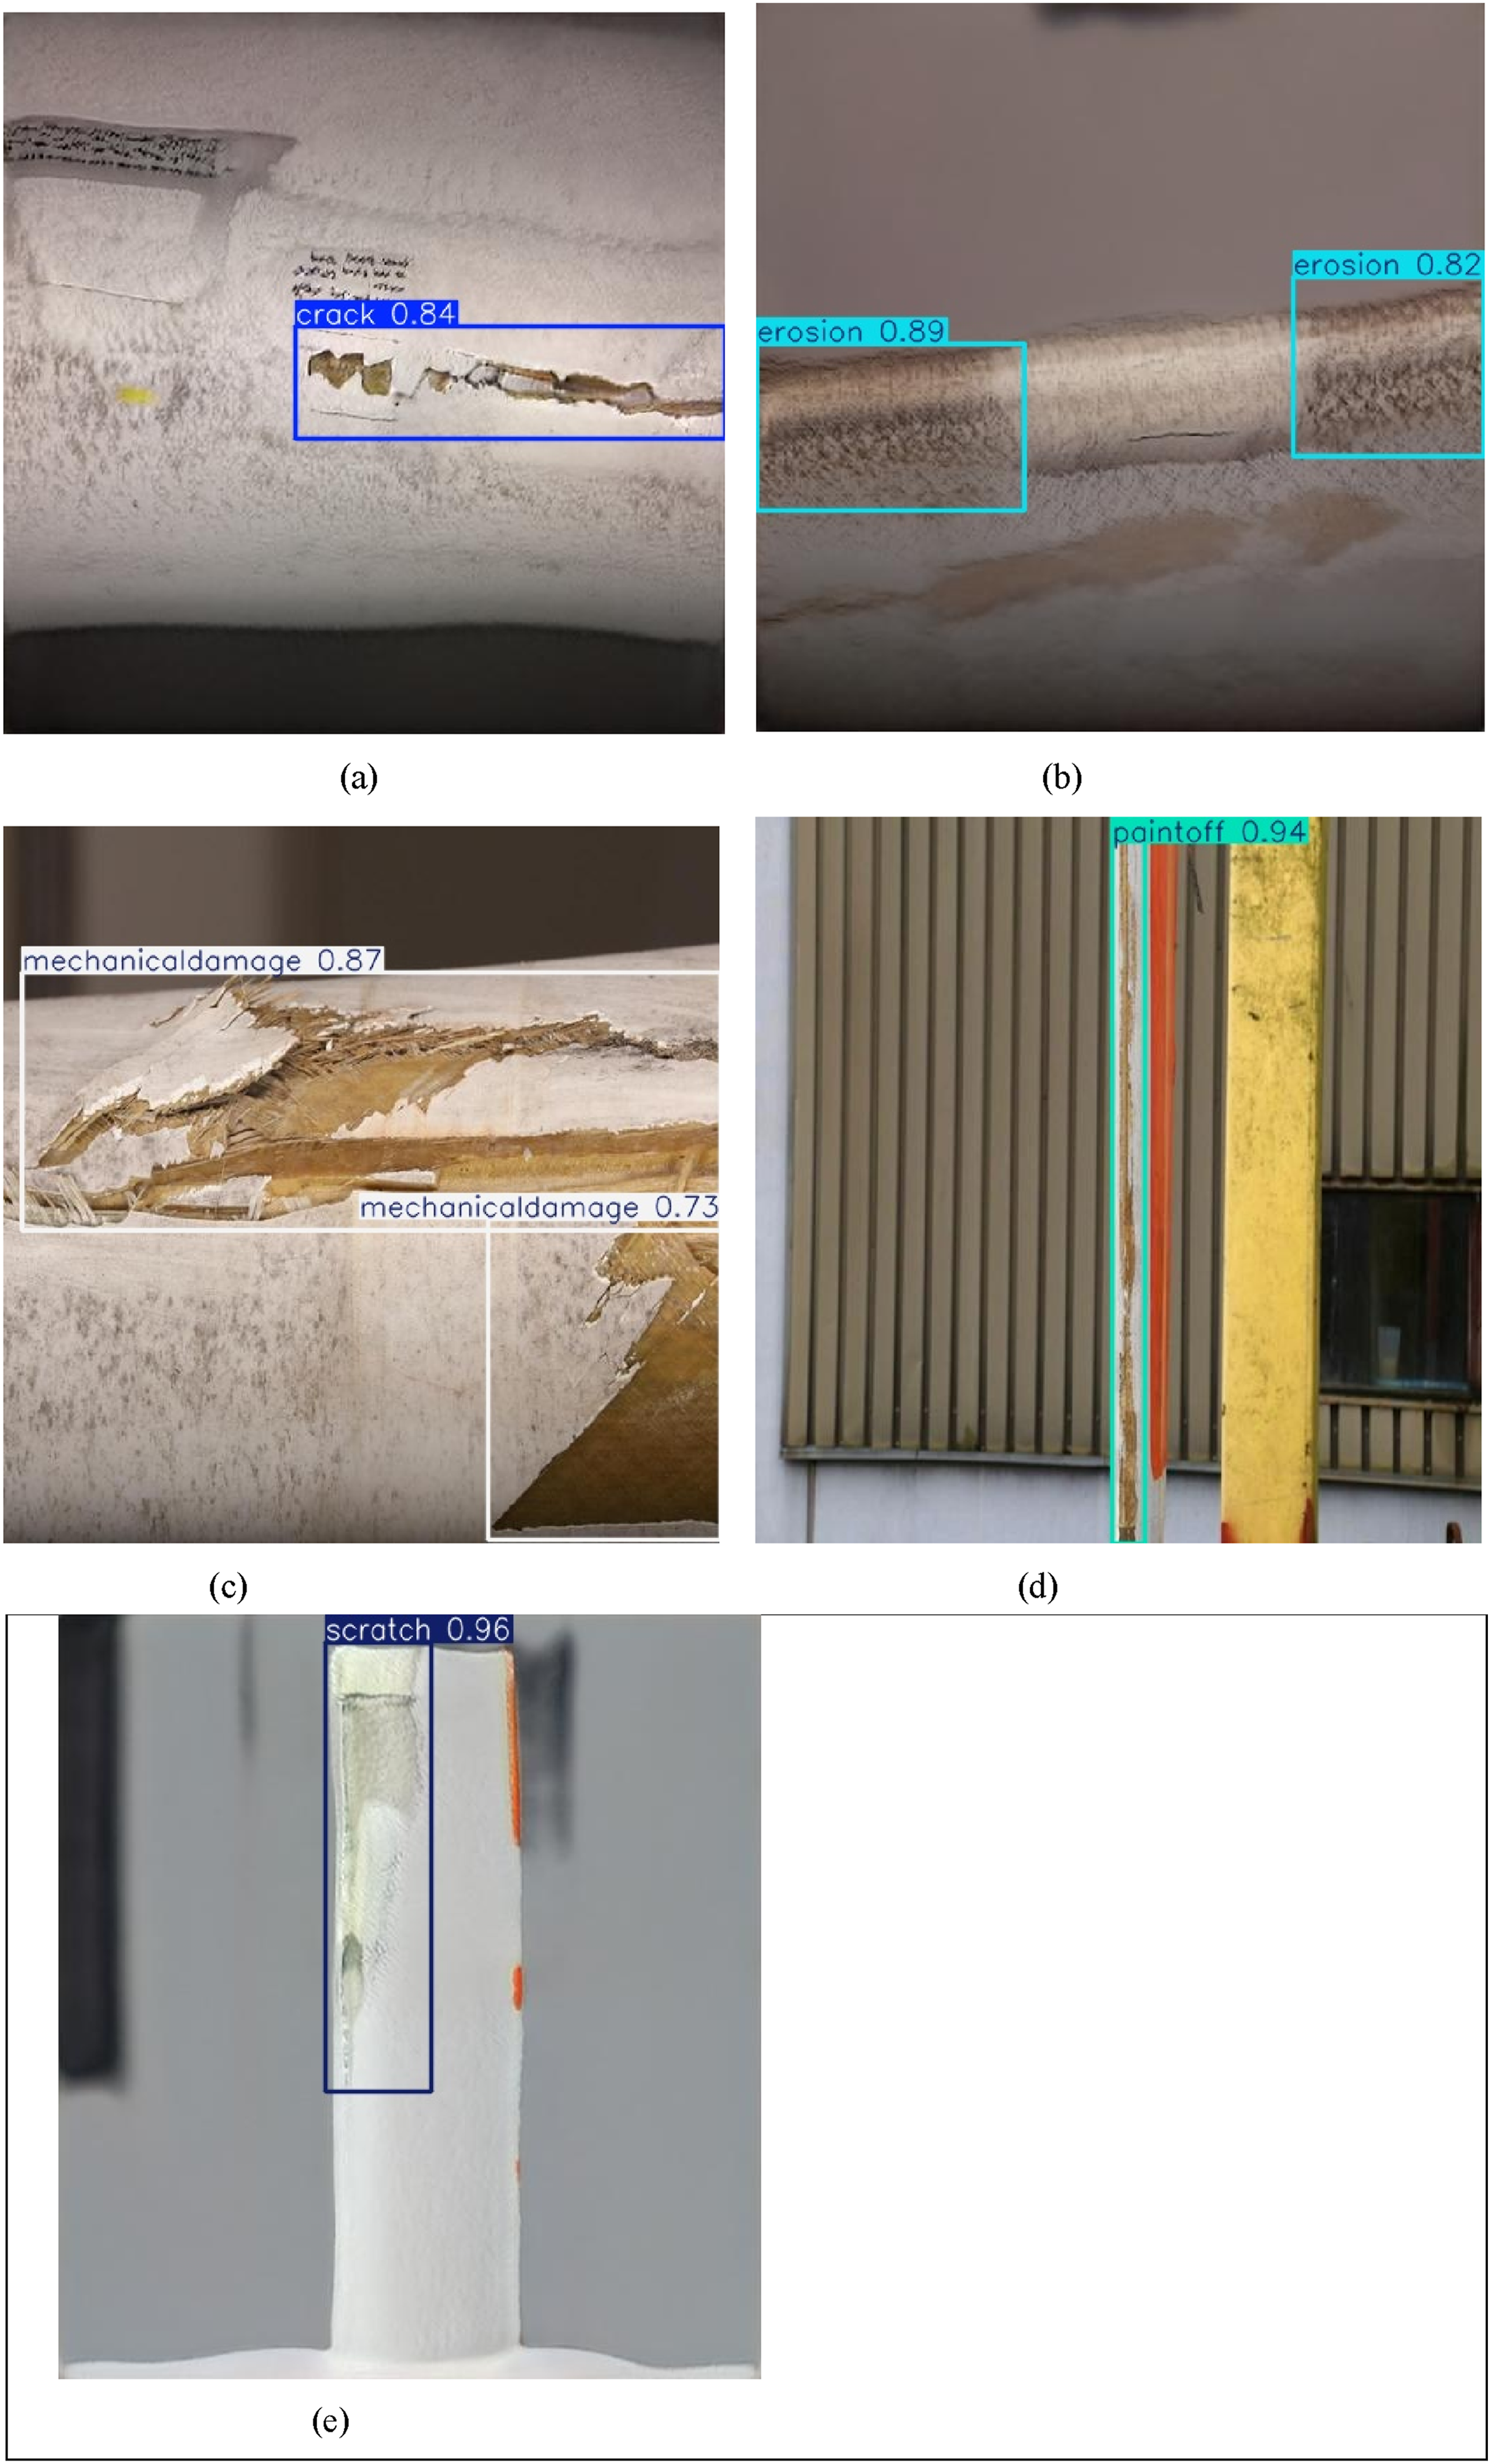
Impact of input resolution on small-defect detection
After training all detectors at 640 × 640, we evaluated inference at image sizes of 320, 512, 640, 800, and 1024. YOLOv11 peaked at 640 px (mAP@0.5 = 0.9691); moving to 800 and 1024 px changed performance by only −0.18% and −0.38%, respectively, confirming robustness above 640 px. Reducing to 320 px decreased mAP by 4.30%, consistent with down-scaling effects on small-defect sensitivity. Other YOLO variants exhibit similar saturation around their peaks (≤0.8% change above peak), whereas Faster R-CNN displays a flatter curve but a lower overall mAP50, as shown in Figure 9. Overall, 640 px offers the best accuracy–latency trade-off, with only marginal changes at higher resolutions. Model mAP@0.5 across input sizes.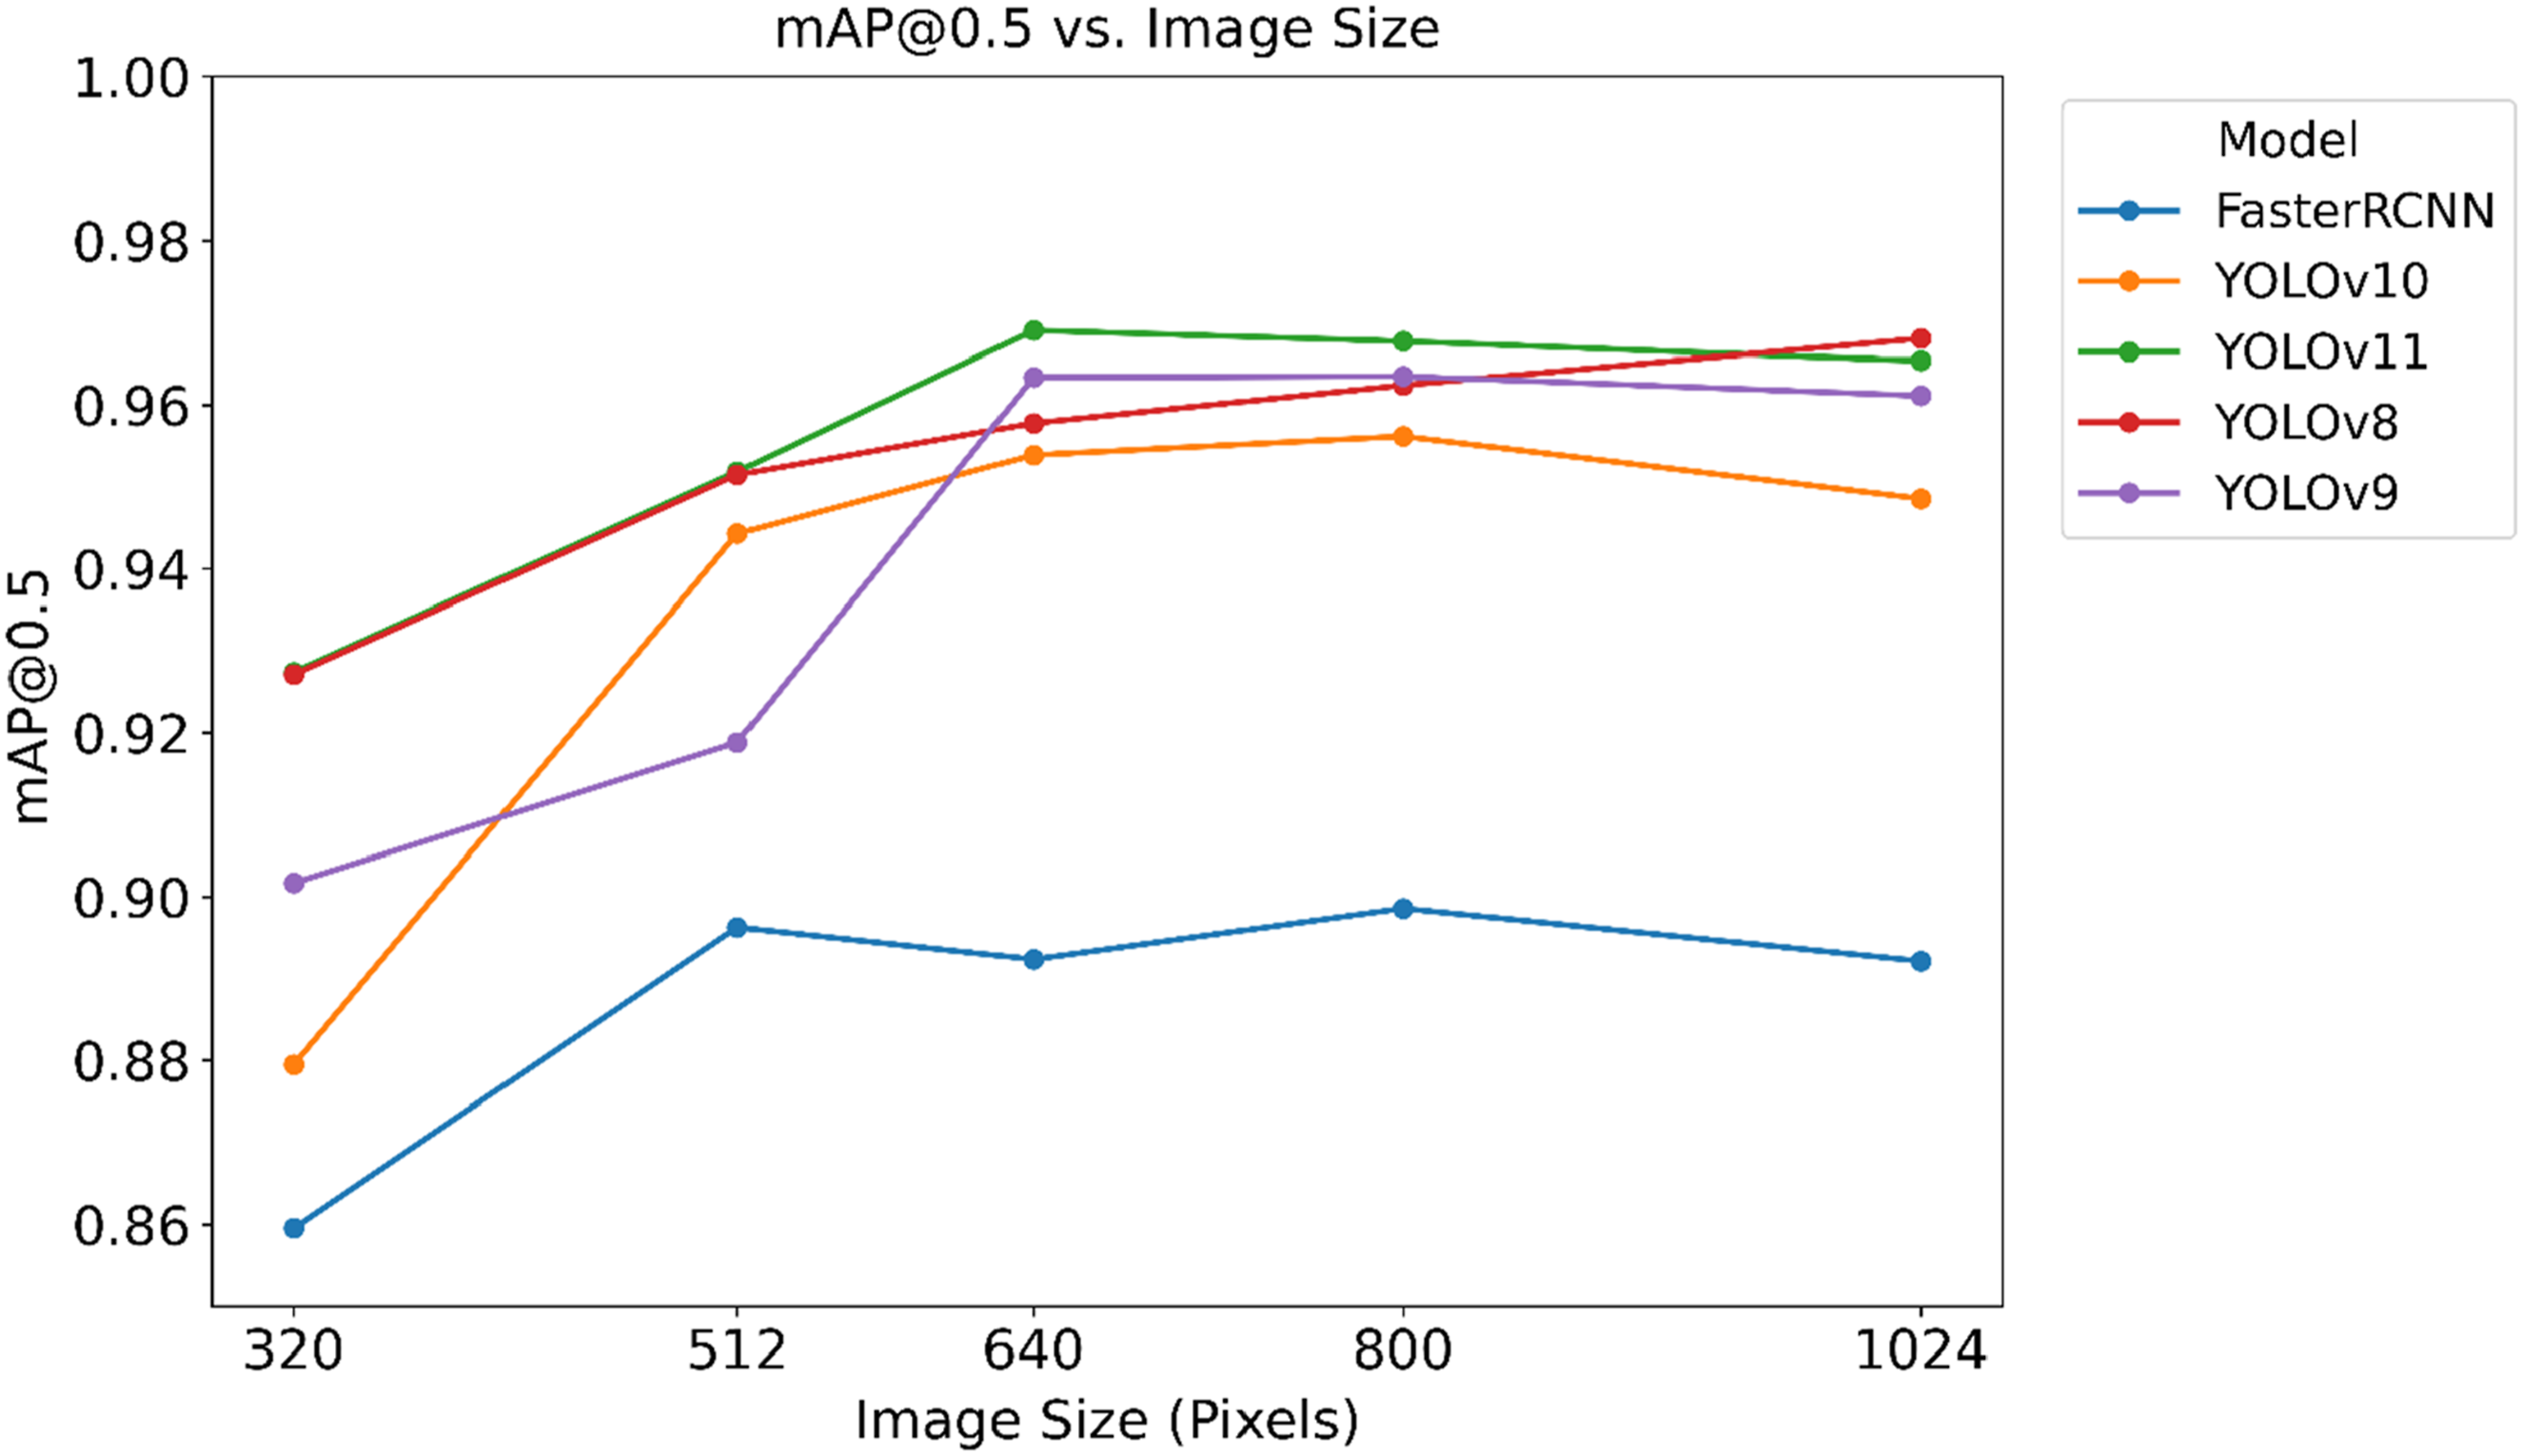
Discussion
This study provides a comprehensive comparison of advanced single-stage (YOLOv8, YOLOv9, YOLOv10, YOLOv11) and two-stage (Faster R-CNN) object detection models for the task of automated wind turbine blade defect detection. The findings demonstrate that the YOLO models consistently outperform Faster R-CNN across nearly all detection metrics on both validation and independent holdout test sets (see Tables 7–10), aligned with earlier studies on object detection tasks (Jin et al., 2022; Sharma et al., 2024). YOLO variants achieved higher overall mAP@0.5 values, with balanced and robust performance across well-represented classes (paintoff and scratch). The original minority classes (crack, erosion, and mechanical damage), which typically present significant challenges due to limited training data, also benefited markedly from targeted augmentation.
Synthetic data augmentation using StyleGAN2-ADA proved especially valuable in addressing class imbalance and improving detection accuracy. The inclusion of generated images led to substantial gains in mAP@0.5 for mechanical damage and also reduced variance across cross-validation folds (as shown in Tables 7–9). These results align with recent studies that have highlighted the effectiveness of GAN-based synthetic augmentation for enhancing visual inspection models, particularly when rare defect classes are underrepresented (Frid-Adar et al., 2018).
Although all detectors were trained at 640 × 640 for comparability, a test-time resolution sweep was conducted at different input sizes to assess adaptability (see Figure 9). YOLOv11, our best overall model, achieves its peak performance at 640 px (mAP@0.5 = 0.9691). Increasing input size beyond 640 yields only −0.18% (800 px) and −0.38% (1024 px) relative to the peak, indicating robustness above 640 px with diminishing returns. Reducing resolution to 320 px lowers mAP by 4.49%, consistent with loss of small-defect detail under down-scaling. Other YOLO variants exhibit similar saturation near their respective peaks (≤0.8% change beyond peak). Collectively, these results suggest 640 px as the accuracy–latency sweet spot for field deployment; 512 px is a viable fallback when compute is tight, while 800–1024 px offer negligible gains on this dataset.
Model deployment considerations, such as inference speed and model size, further highlight the advantages of the YOLO family. All YOLO variants exhibited low inference times (under 11 ms per image) and compact model sizes (48–84 MB), as seen in Table 10, making them well-suited for real-time or edge-based deployment, including web applications and drone-mounted inspection systems. In contrast, Faster R-CNN’s larger model size and slower inference time (25.8 ms per image) present challenges for practical, time-sensitive applications.
Nevertheless, while synthetic data augmentation helped to balance the dataset and improve rare class detection, the realism and diversity of generated images are inherently limited by the GAN’s capabilities and the diversity present in the original data. Future research should focus on exploring more advanced generative approaches to enhance performance on rare and emerging defect types.
Overall, the results demonstrate that integrating state-of-the-art YOLO architectures with generated image data yields a robust and deployable solution for automated detection of wind turbine blade defects. These findings support the use of modern single-stage detectors and GAN-based augmentation in infrastructure inspection workflows, offering promising directions for future advances in automated infrastructure monitoring.
Conclusion
This work presents a comprehensive comparative evaluation of leading single-stage (YOLOv8, YOLOv9, YOLOv10, YOLOv11) and two-stage (Faster R-CNN) object detection models for automated wind turbine blade defect detection. By leveraging both real and GAN-augmented (StyleGAN2-ADA) datasets, our results demonstrate that recent YOLO architectures consistently outperform Faster R-CNN in mAP@0.50 and per-class AP@0.50, particularly when addressing the challenges of class imbalance through targeted data augmentation. The study reveals that incorporating synthetic data not only enhances the detection of the minority class (crack, erosion, and mechanical damage) but also stabilizes performance across cross-validation folds. These results emphasize the crucial role of generative models in addressing data scarcity and improving model robustness for real-world inspection applications.
On the independent holdout set, YOLOv11L achieved a mAP@0.5 of 0.969 at 9.7 ms per img with a 48.8 MB checkpoint, outperforming Faster R-CNN, which achieved a mAP@0.5 of 0.896 at 26 ms per img with a 158 MB checkpoint. StyleGAN2-ADA augmentation particularly improved the underrepresented Mechanical Damage class, from 0.83 to 0.98 AP@0.5, while maintaining high performance on the majority classes. These results indicate that YOLOv11L offers the best accuracy–latency trade-off for real-time and edge deployments in wind turbine blade inspection. Additionally, these trends replicate across other YOLO variants, indicating that class-balanced data, not just architecture choice, is pivotal.
While the findings substantiate the impact of combining advanced single-stage detectors with GAN-based data augmentation, future research should explore the use of advanced generative approaches and focus on deploying the models in web applications and UAV systems for real-time defect detection.
Collectively, this study advances the state-of-the-art in automated wind turbine blade inspection and provides a robust methodological framework for the deployment of deep learning–based defect detection in the broader domain of structural health monitoring.
Supplemental material
Supplemental material - Comparison study of advanced computer vision models for wind turbine blade defect detection
Supplemental material for Comparison study of advanced computer vision models for wind turbine blade defect detection by Jamiu Lateef, Xiong (Bill) Yu in Wind Engineering
Footnotes
Acknowledgements
The authors would like to thank the US National Science Foundation for partial support of this research (Grant No. 2026612).
Author contributions
Funding
The authors disclosed receipt of the following financial support for the research, authorship, and/or publication of this article: This research is partially funded by the US National Science Foundation (Grant No. 2026612).
Declaration of conflicting interests
The authors declared no potential conflicts of interest with respect to the research, authorship, and/or publication of this article.
Data Availability Statement
Supporting datasets used in this study are available from the corresponding author on request.
Supplemental material
Supplemental material for this article is available online.
References
Supplementary Material
Please find the following supplemental material available below.
For Open Access articles published under a Creative Commons License, all supplemental material carries the same license as the article it is associated with.
For non-Open Access articles published, all supplemental material carries a non-exclusive license, and permission requests for re-use of supplemental material or any part of supplemental material shall be sent directly to the copyright owner as specified in the copyright notice associated with the article.