






Abstract
Wake interaction in wind farms modifies the inflow conditions for downstream turbines. However, their influence on the aerodynamic performance of individual turbines remains unclear. This study investigates how wake-added turbulence (WAT) and the disturbed inflow shift the normalised power coefficient (
Keywords
Introduction
Concerns about energy crises, pollution, and climate change motivate the world to rely on cleaner energy sources. Among these, wind energy is one of the most widely tapped renewable energy sources and could serve as a reliable, scalable solution to meet global energy demand while reducing dependence on fossil fuels. For these reasons, the installation of wind farms has increased globally over the past decades (Jung, 2024; Tumse et al., 2024). There are two main types of wind turbines based on the orientation of their hub axis: horizontal-axis wind turbines (HAWT) and vertical-axis wind turbines (VAWT). The HAWT, which has a comparatively higher efficiency due to its operation in the lift effect, has been widely used (Manwell et al., 2010); among these, the three-bladed HAWT is the most common. The turbine’s capacity, hub height, rotor diameter, and all other parameters depend on the site’s potential. Hence, the numerous turbines will be installed to utilise a site’s full potential.
The major problem that a wind farm faces is the wake effect. For a lower power density, it is always recommended to occupy a smaller area by the wind farm (Denholm et al., 2000). The major problem with keeping the turbines closer is the wake effect. When an upstream turbine rotates in one direction, it extracts the energy from the inflow wind, generating a wake region behind it with a deficit velocity (Sanderse et al., 2011). This effect not only affects the power production of downstream machines, but also their fatigue life (Karlina-Barber et al., 2016; Thomsen and Sørensen, 1999) by inducing higher turbulence in the inflow, depending on the position of the downstream rotors (Meng et al., 2018; Rinker et al., 2021).
While analysing the performance of a single turbine, the power coefficient (
It is important to consider the WAT, which accounts for the additional turbulent kinetic energy generated by rotor and vortex breakdowns (Lignarolo et al., 2015). Considering WAT to analyse wake-induced effects on dynamic loading, power production, and altered performance of downstream turbines will help accurately understand the downstream turbines (Göçmen et al., 2016). In addition, wake superimposed models have been developed to account for multiple overlapping wakes in wind farm arrangements (Jonkman and Shaler, 2021). Even though high-fidelity computational fluid dynamics (CFD) methods, such as Reynolds-averaged Navier-Stokes (RANS) and large-eddy simulations (LES), have been utilised to accurately study wake mixing and wake characteristics (Sanz Rodrigo et al., 2017), their high computational costs and duration are major drawbacks for large-scale studies. Hence, mid-fidelity engineering tools have gained popularity for their lower computational expense and their ability to capture physical realism. Several experimental and numerical studies utilising high-fidelity tools have addressed wake characteristics (Cao et al., 2023; Dörenkämper et al., 2015; Li et al., 2016; Zhang et al., 2023). Studies have shown that mid-fidelity tools can also account for significant effects on power loss, rotor effects, and wake recovery, compared with high-fidelity tools (Jonkman et al., 2018; Shaler et al., 2020). Most engineering applications of these wake models have focused solely on understanding farm-level power production and structural loads (Li et al., 2025; Liu et al., 2020; Wu et al., 2020; Xu et al., 2024). Few studies have been conducted to understand how wake-altered inflow will affect the aerodynamic equilibrium of each downstream turbine, particularly in terms of
Despite this great progress in wake modelling and wind farm layout optimisation (Cao et al., 2022; He et al., 2024; Sinner and Fleming, 2024; Zhao et al., 2022) knowledge gap remains in analysing the characterisation of the wake-induced shift in aerodynamic operating equilibrium. Specifically, it is unclear how downstream rotors adjust their TSR and power coefficient in response to wake-added turbulence compared with steady ambient conditions. Studies had quantified the power loss compared to upstream turbines, but rarely analysed the modification in
The present study addresses this research gap by investigating wake-induced changes in aerodynamic performance in an aligned configuration of multiple turbine arrangements using a validated mid-fidelity engineering tool. Unlike other wake studies, which mainly focus on farm-level power production and dynamic responses, this study focuses on the altered aerodynamic equilibrium induced by wake-affected inflow for each downstream turbine. By systematically varying inter-turbine spacing and evaluating downstream turbine performance under controlled steady ambient conditions with WAT enabled to quantify shifts in the optimal power coefficient (
Numerical modelling
The present study was conducted utilising Fast.Farm, which is a Multiphysics mid-fidelity tool for predicting the power and structural load in a wind farm (Jonkman et al., 2017). It uses various OpenFast modules to complete the analysis. In addition, it solves complex wake features, such as wake advection, deflection, and merging. To study the wake interaction effect on the performance and aerodynamic efficiency of the downstream turbines, four turbines are placed back-to-back to capture the complete wake effect on downstream turbines (Jonkman et al., 2018) where the upstream turbine is named T1, the downstream machines are named T2 to T4. After the fourth row, the variation in the effect of wake is negligible (Li et al., 2025). To generate a Cp–λ curve for the downstream turbines and compare it with the upstream turbine, a series of steady-state ambient winds is generated from 4 m/s to 25 m/s at 1 m/s intervals, enabling wake-added turbulence, which is already validated by Fast.Farm (Branlard et al., 2024).
This introduces turbulence into the system, which in turn facilitates the breakdown of the vortices. So, it is easy to compare how the downstream turbine aerodynamic efficiency changes as turbulence or WAT are encountered. The effect of wake changes with wind speed as well as the inter-turbine spacing, or the distance up to which the wake is travelled. To account for this, these four turbines are arranged in two different inter-turbine spacing with 7.5D and 10D, where D represents the rotor diameter. The schematic representation of farm layouts and turbine position is shown in Figure 1. For this study, the NREL 5 MW baseline turbine is used, and its details are presented in Table 1. Schematic representation of wind farm layout; (a) ITS 7.5D; (b) ITS 10D. 5 MW baseline description.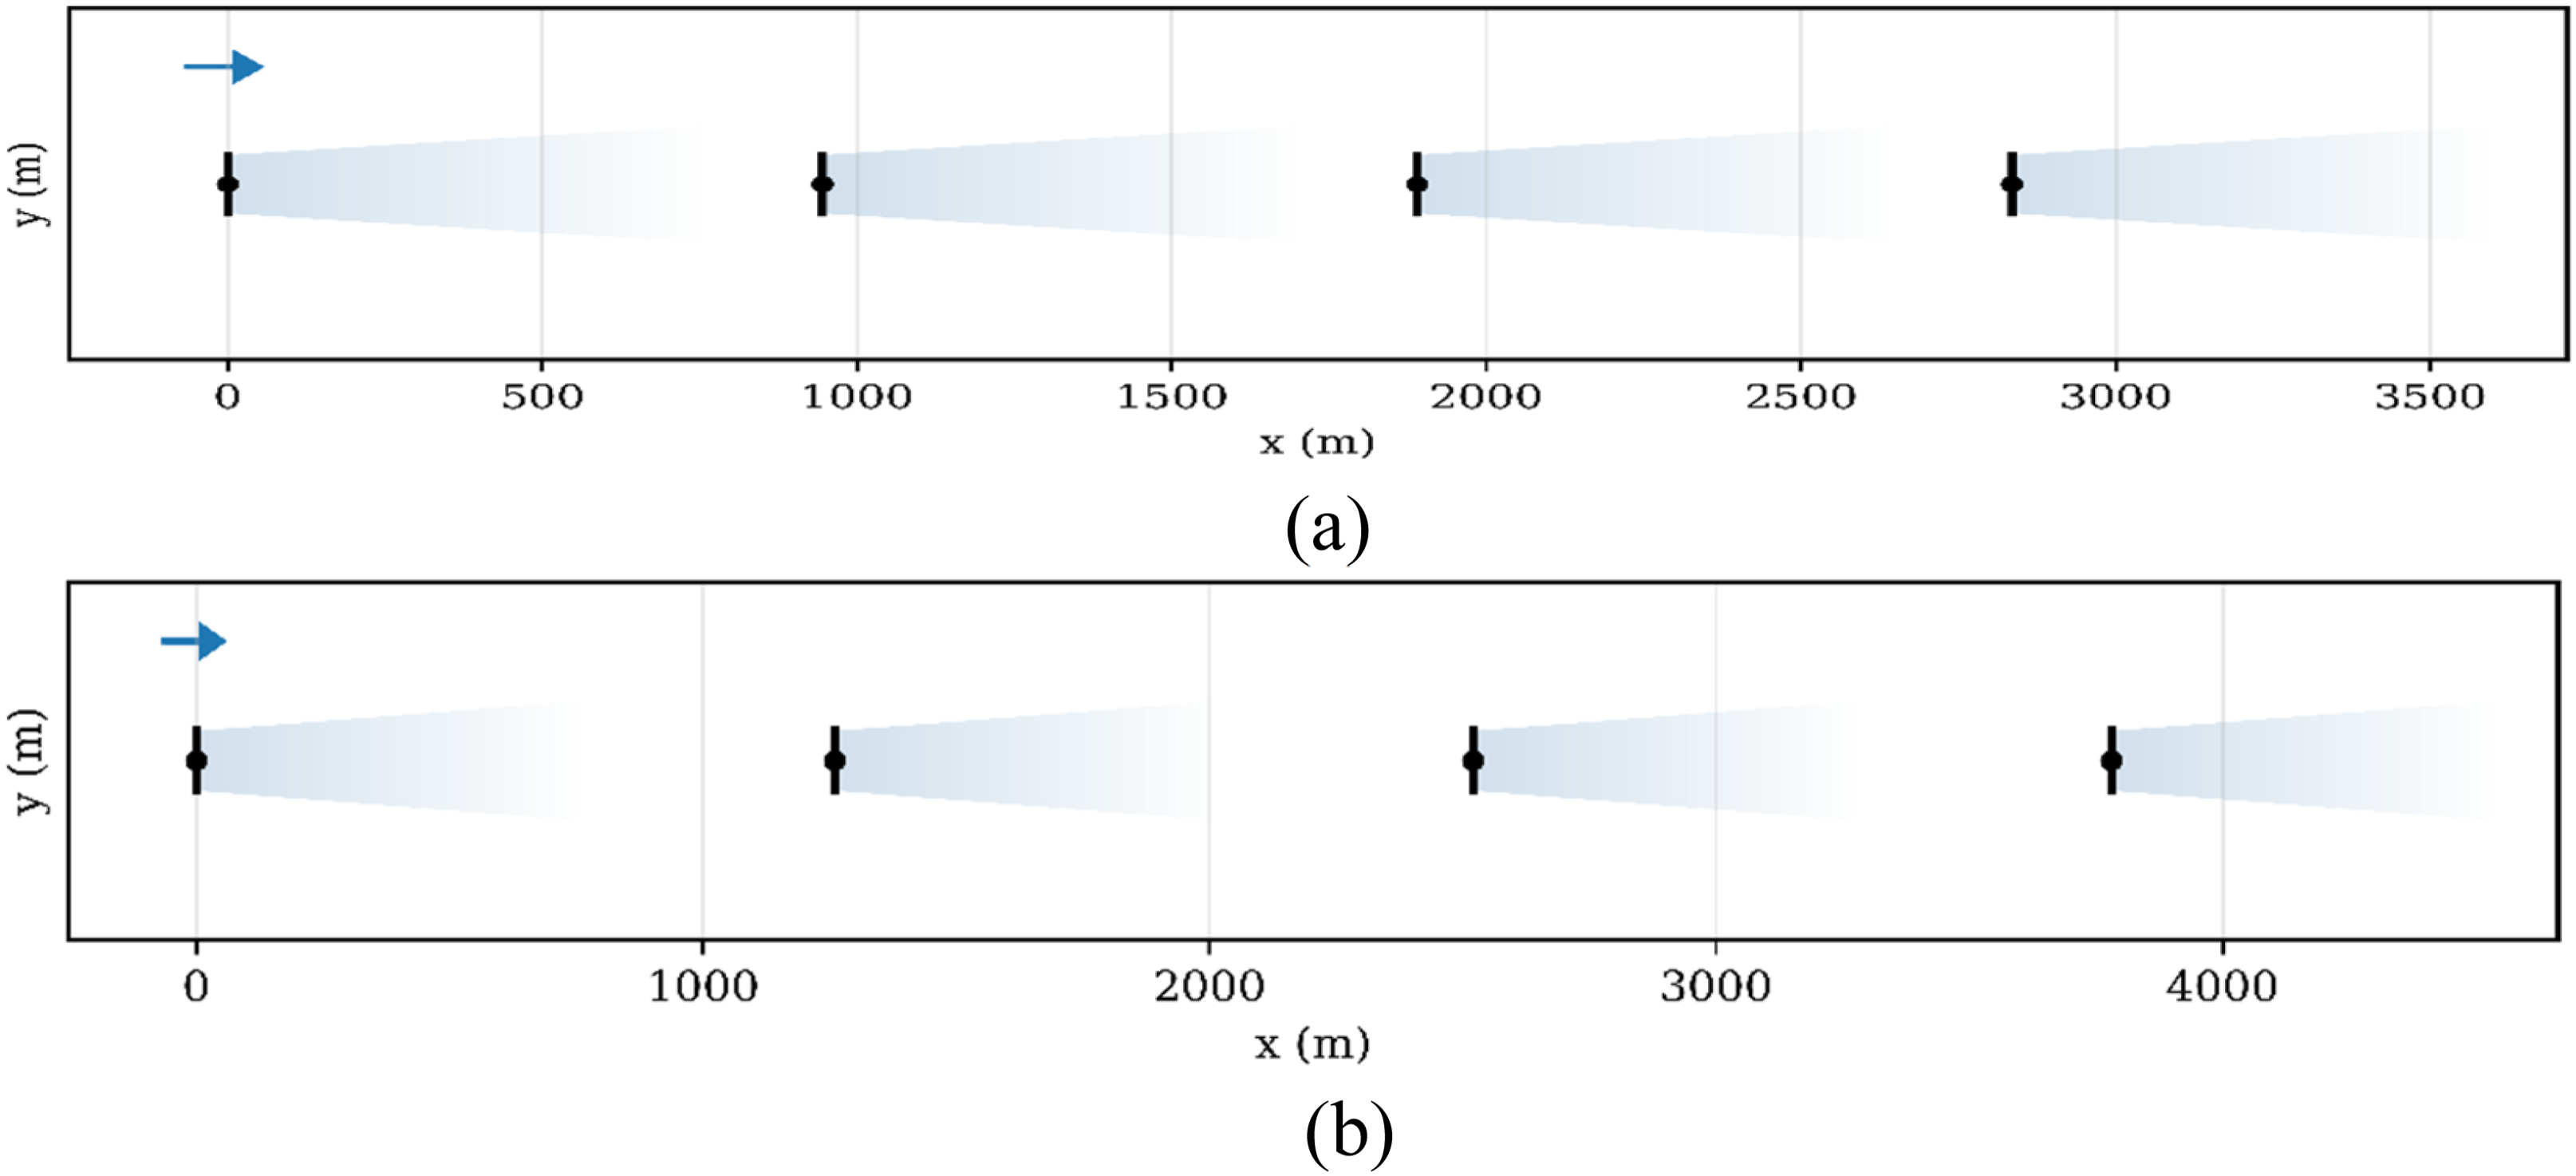
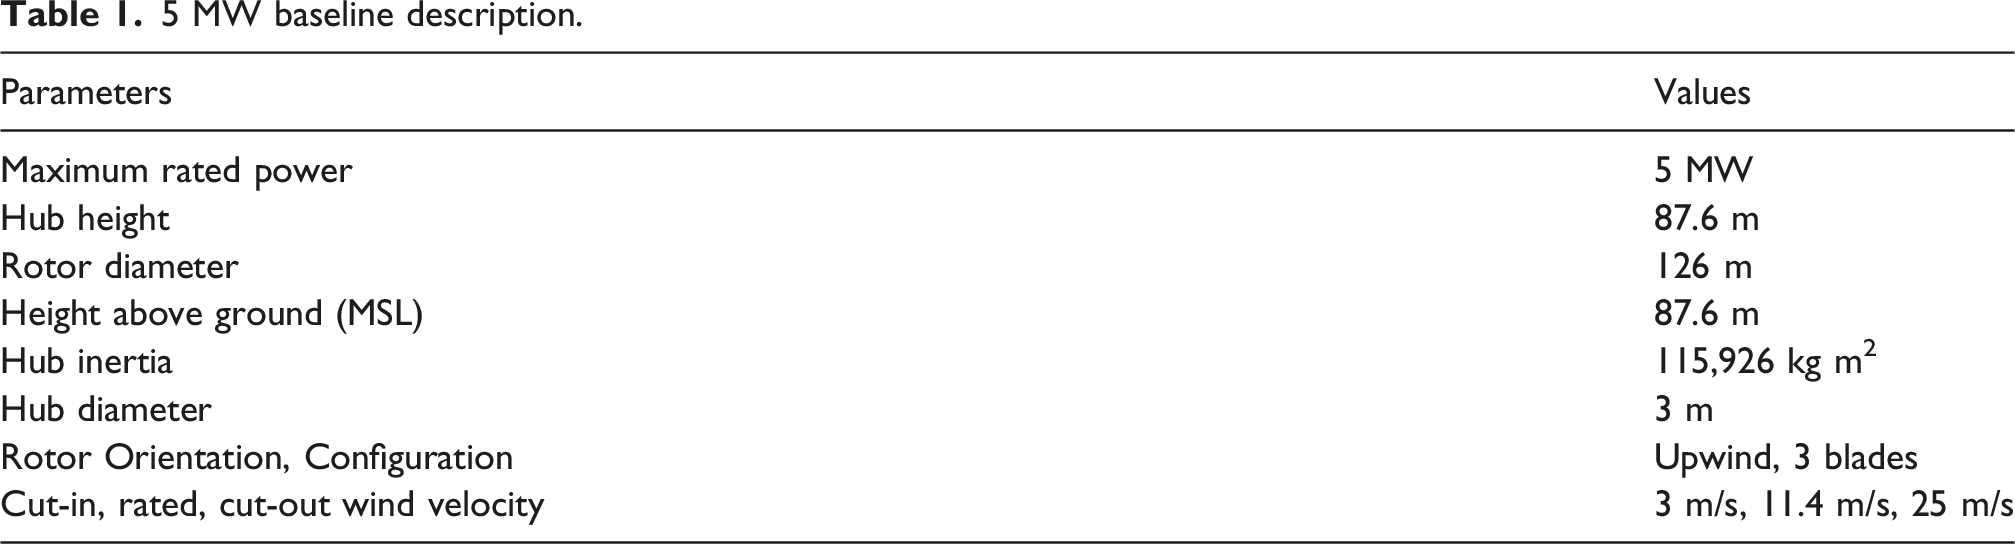
The domain width and height to accommodate the growing wake are selected as per (Jonkman et al., 2018) and the domain length is 6 km. For each wind speed, the spatial and temporal discretisation changes; hence, these values can vary from simulation to simulation, as this study considers several wind velocities. The discretisation values for both low and high-resolution domains are selected less than recommended by (Jonkman and Shaler, 2021) for every velocity and for higher accuracy.
The power coefficient 
Where
This represents the rotor’s efficiency to extract power from the wind. The generated power is not the same as the rotor power; it should also account for gearbox, generator, and other mechanical efficiencies. So, the optimum 
From ideal momentum theory, the optimum 
Resulting in an optimum
Wake deficit model
Recent models discovered that the wake deficit has a Gaussian profile in radius R (Jonkman and Shaler, 2021) such as

The major contribution of wake is that it alters the turbulence. Fast.Farm explicitly add small wake-added turbulence of each turbine. This WAT model assumes that this extra turbulence is proportional to the local velocity deficit and its gradient. Hence, a scaling factor represented in equation (6) is calculated for each wake plane in its meandering frame.
Fast.Farm modelling framework
Fast.Farm couples these wake models with other turbine dynamics. It utilises multiple OpenFast modules for each turbine, where it calculates the thrust from the incoming disturbed flow. These individual turbines solve the blade-element momentum equations, also with tip-loss and yaw corrections. At the same time wake dynamic (WD) module uses each turbine’s
Numerical validation
To show the credibility of this study and the author’s ability to correctly utilise the tool, the upstream turbine shown in Figure 2 is considered for validation. As mentioned earlier, a series of simulations was done with wind velocity ranging from 4 m/s to 25 m/s, with steady-state increments of 1 m/s, enabling wake-added turbulence, which will alter the inflow to downstream turbines. So, the upstream turbine experiencing steady wind will give each point on the Fast.Farm setup for validation.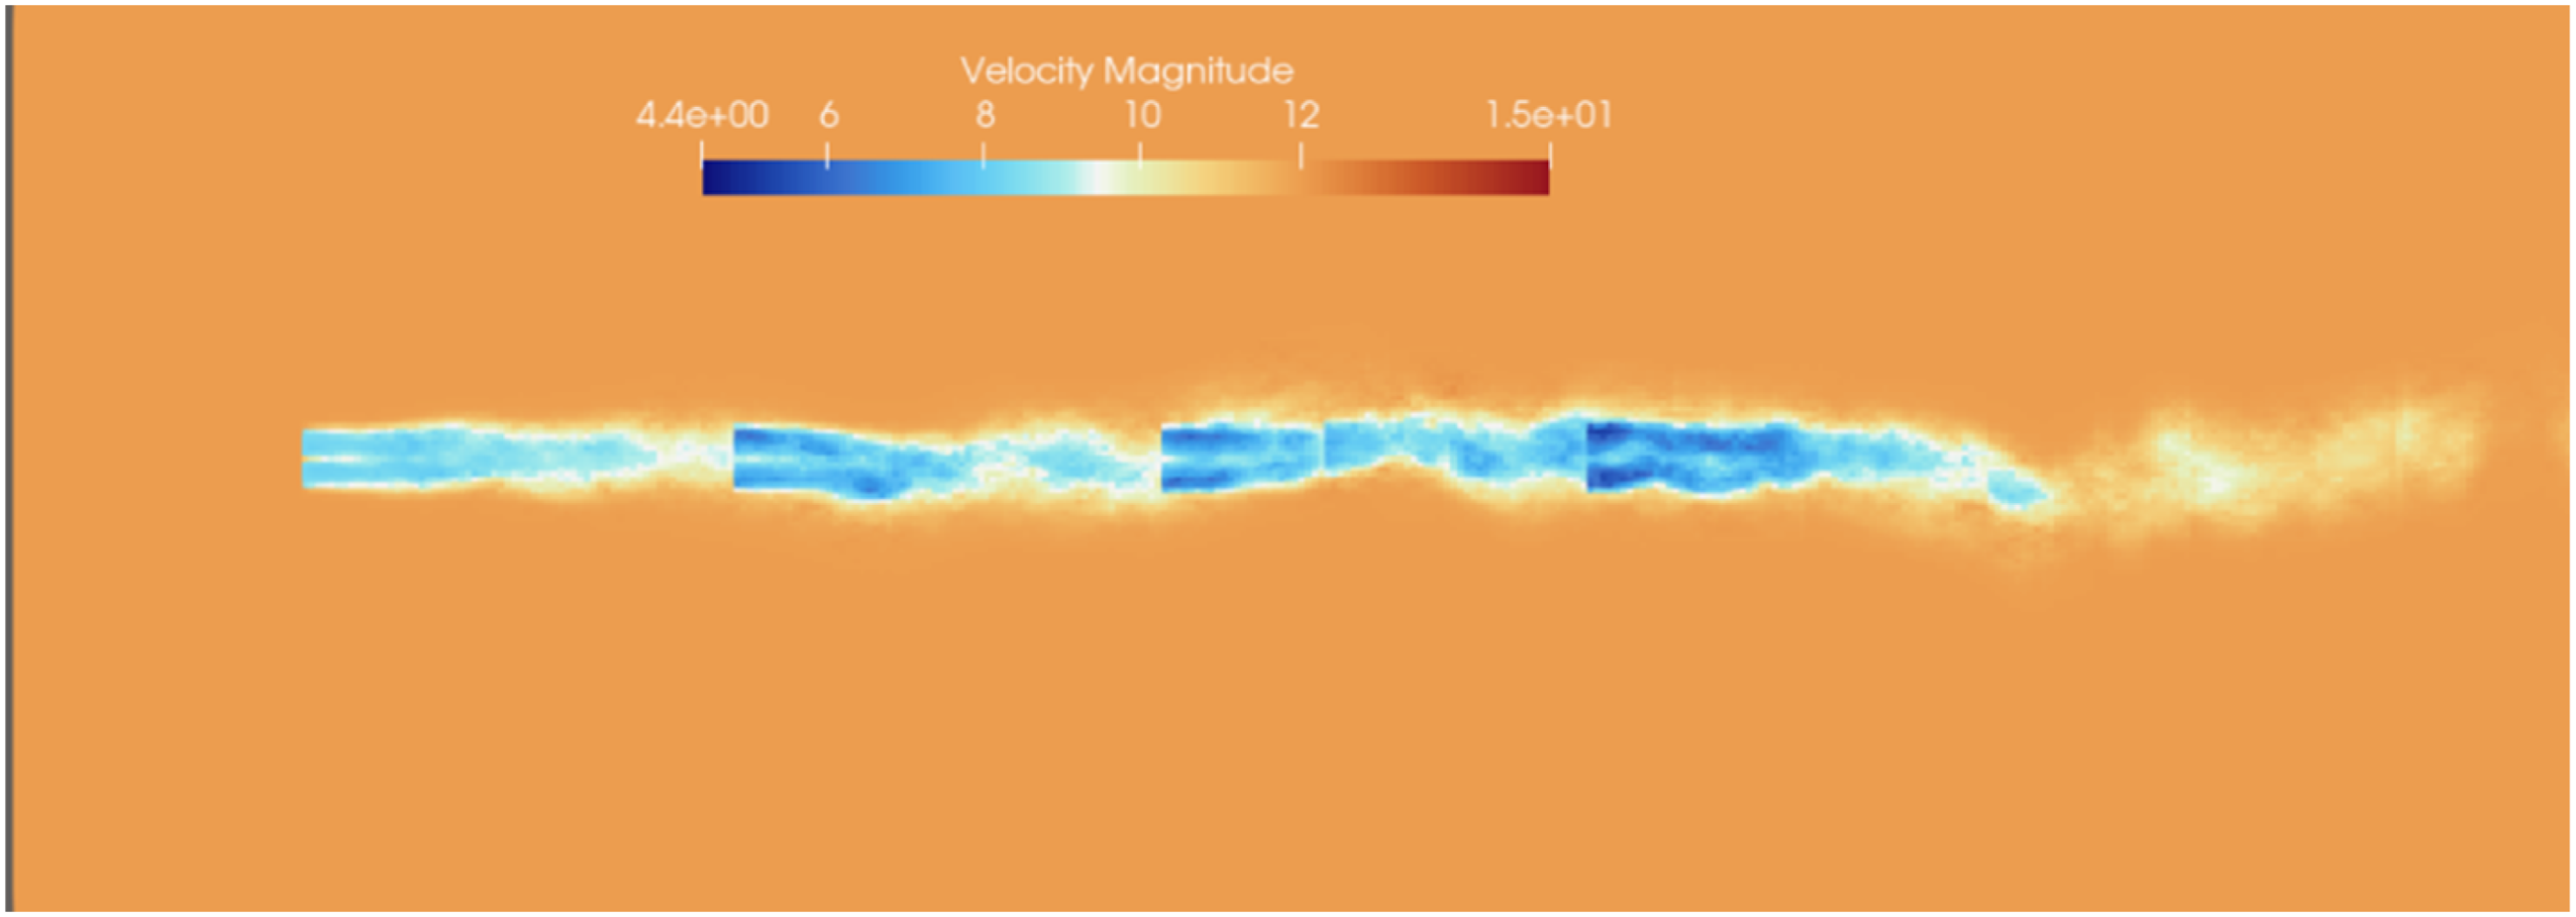
Figure 3 compares the normalised 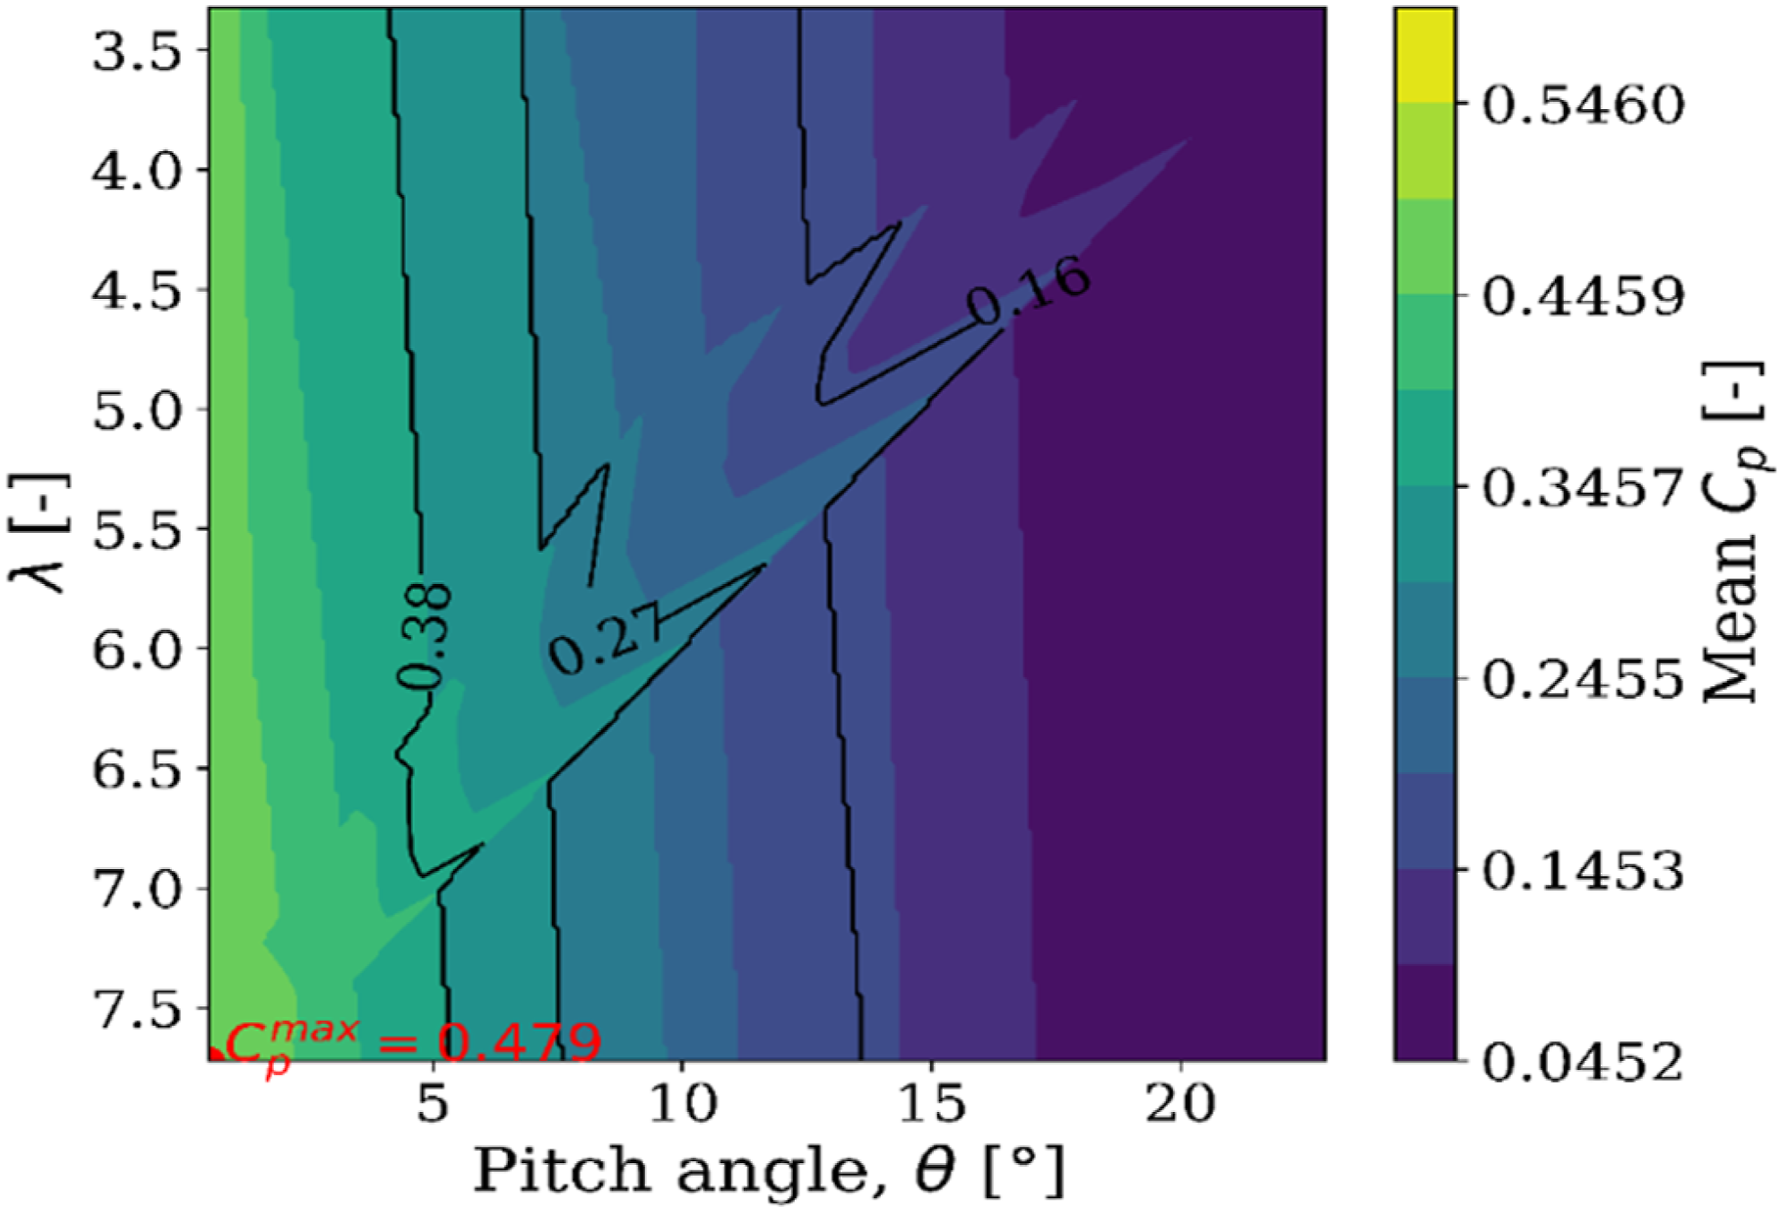
Numerical methodology
Unlike a steady-state condition, the outputs from a turbulent operating turbine will differ. Figure 4 represents when T1 operates at a steady wind speed of 12 m/s how the WAT is altering the (a) 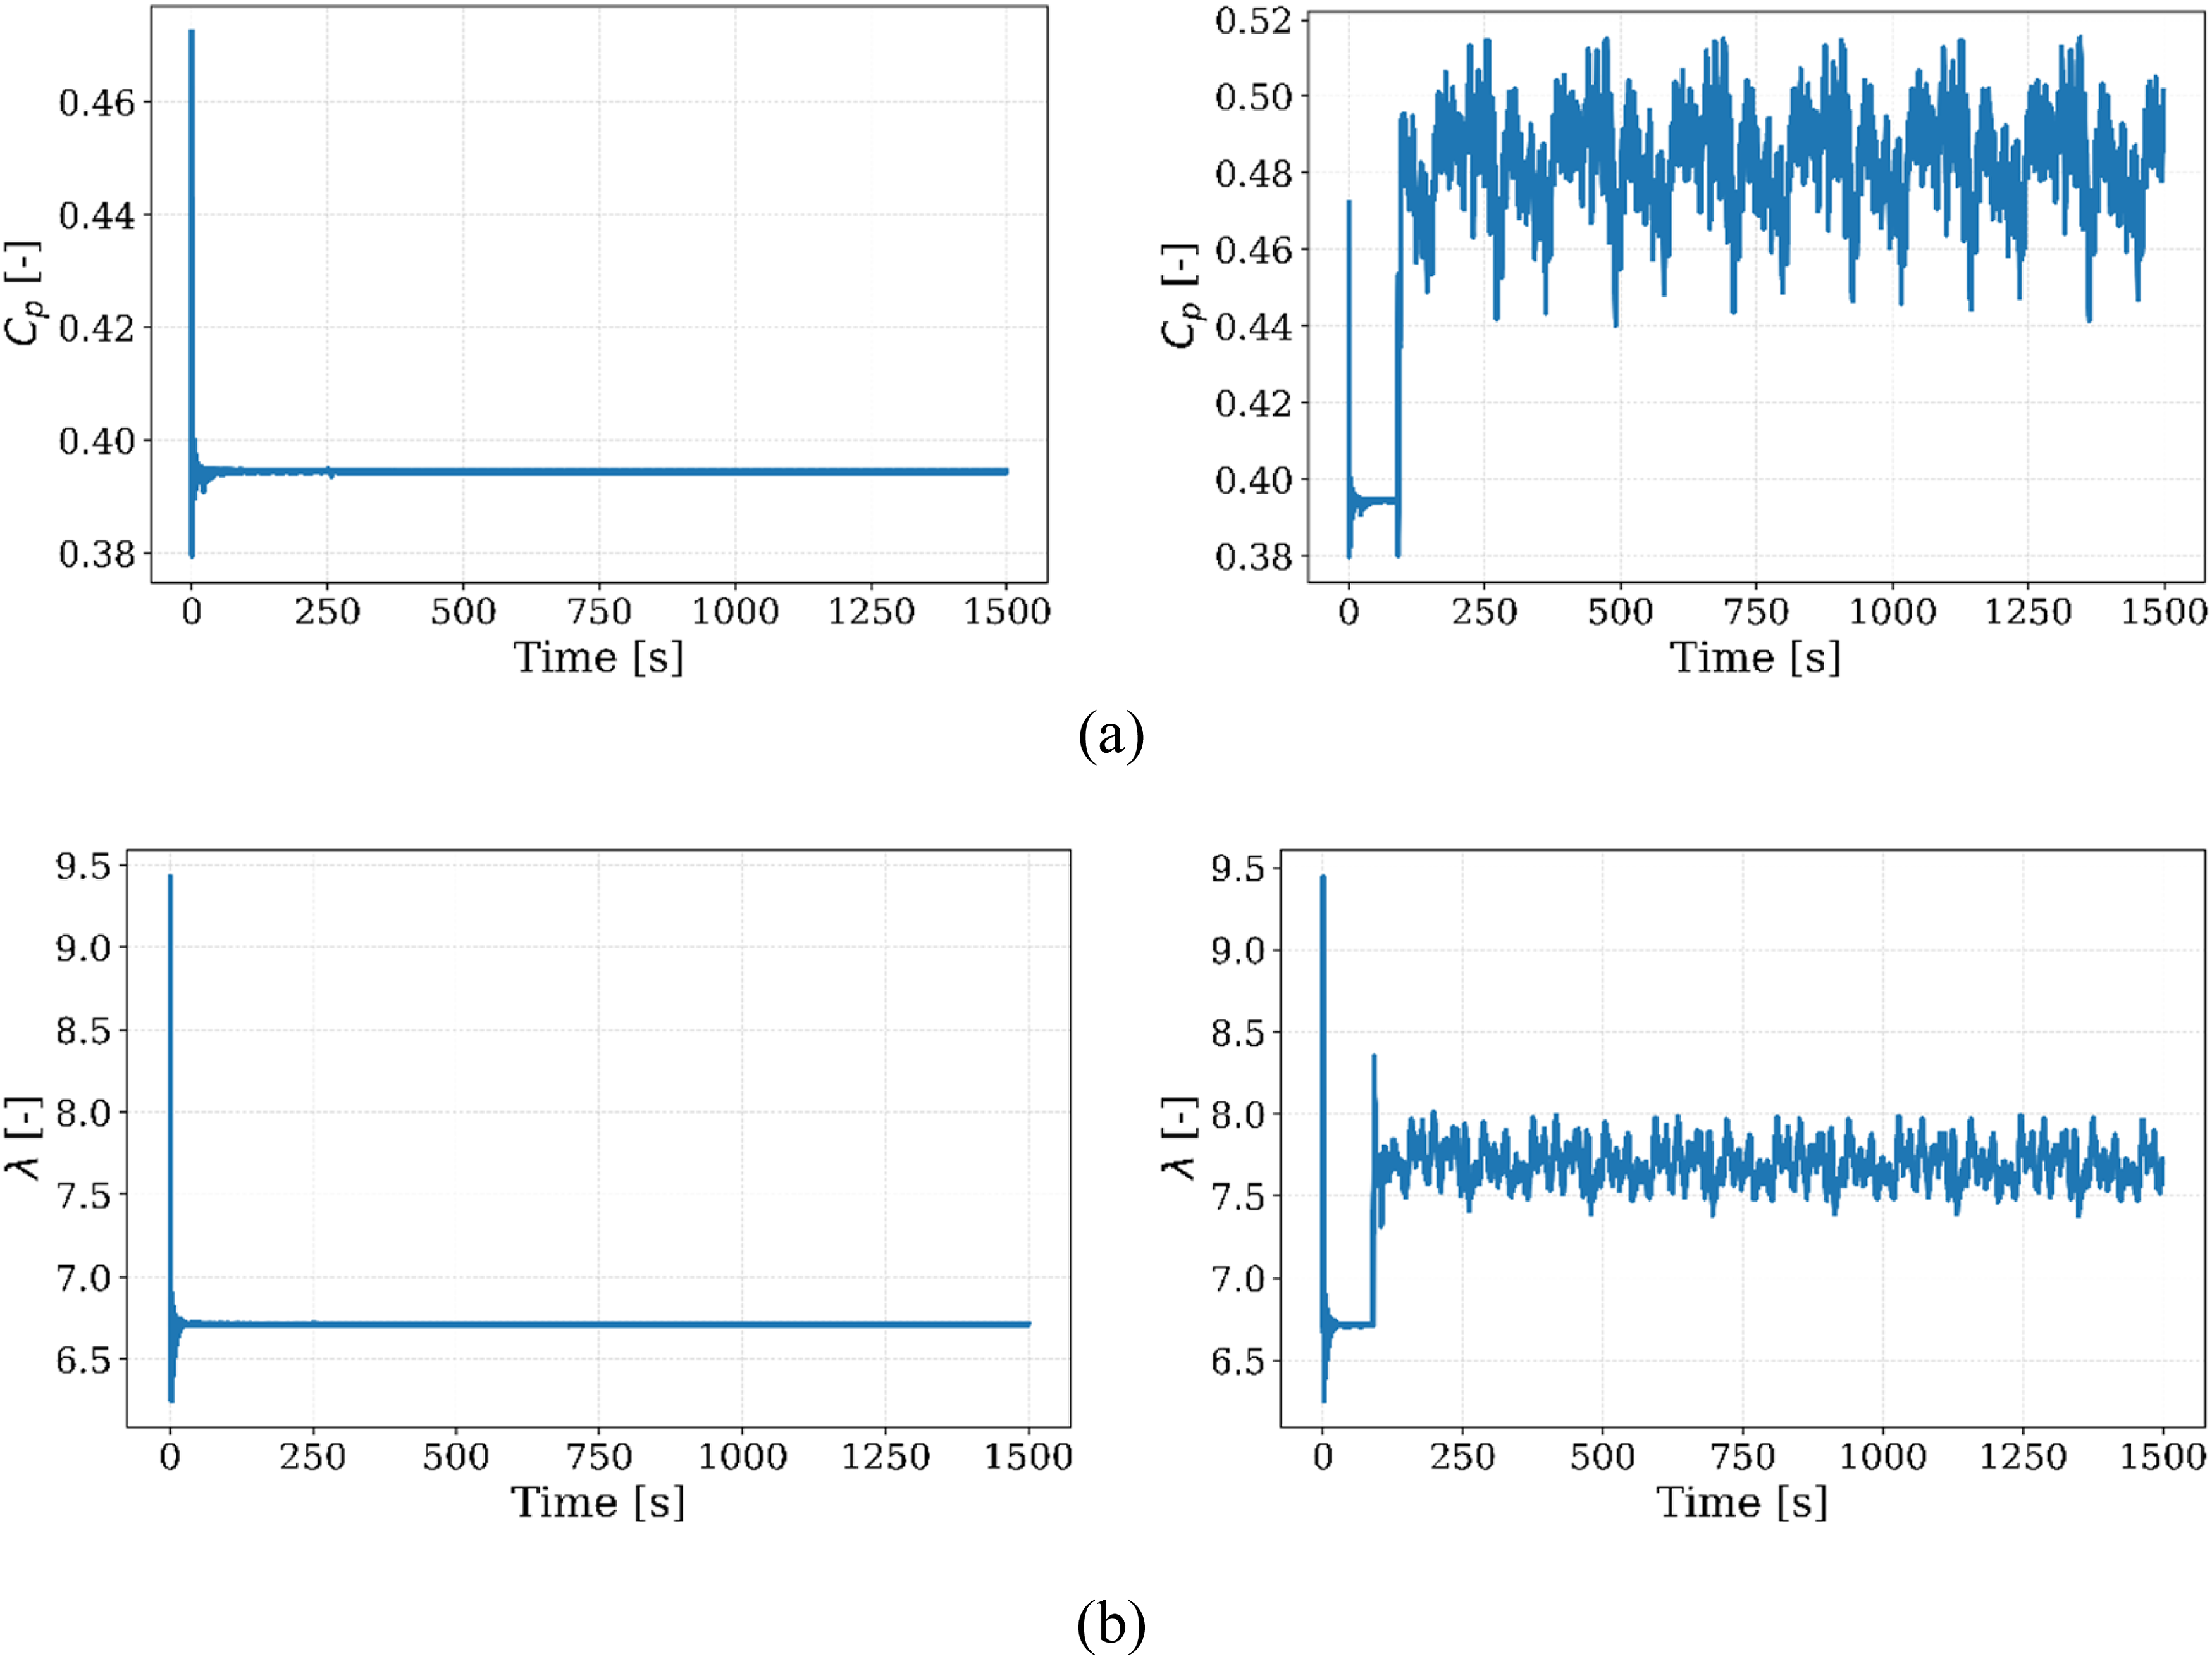
In the present study, the aerodynamic coefficients of each downstream turbine were obtained from the AeroDyn outputs of individual turbines. This approach considers rotor-disc averaged wind velocity normal to the rotor plane and instantaneous rotor swept area for the calculation of the non-dimensional parameter (Cp). Hence, the normalisation quantities change with time under wake-influenced turbulent inflow conditions. This consideration helps in understanding the wake-affected behaviour of each individual downstream turbine rather than at the farm scale. Therefore, the reported values of
The aerodynamic performance data were extracted from simulations for each turbine in the farm layout as shown in Figure 2. 
Results and discussion
Aerodynamic performance analysis
After processing the outputs as per Section 4, the resulting plots are shown in Figure 5. This contour plot shows how the aerodynamic performance and its optimum conditions are altered when the turbine interacts with wake inflow. While analysing Figure 5, the optimum value of Bin-averaged 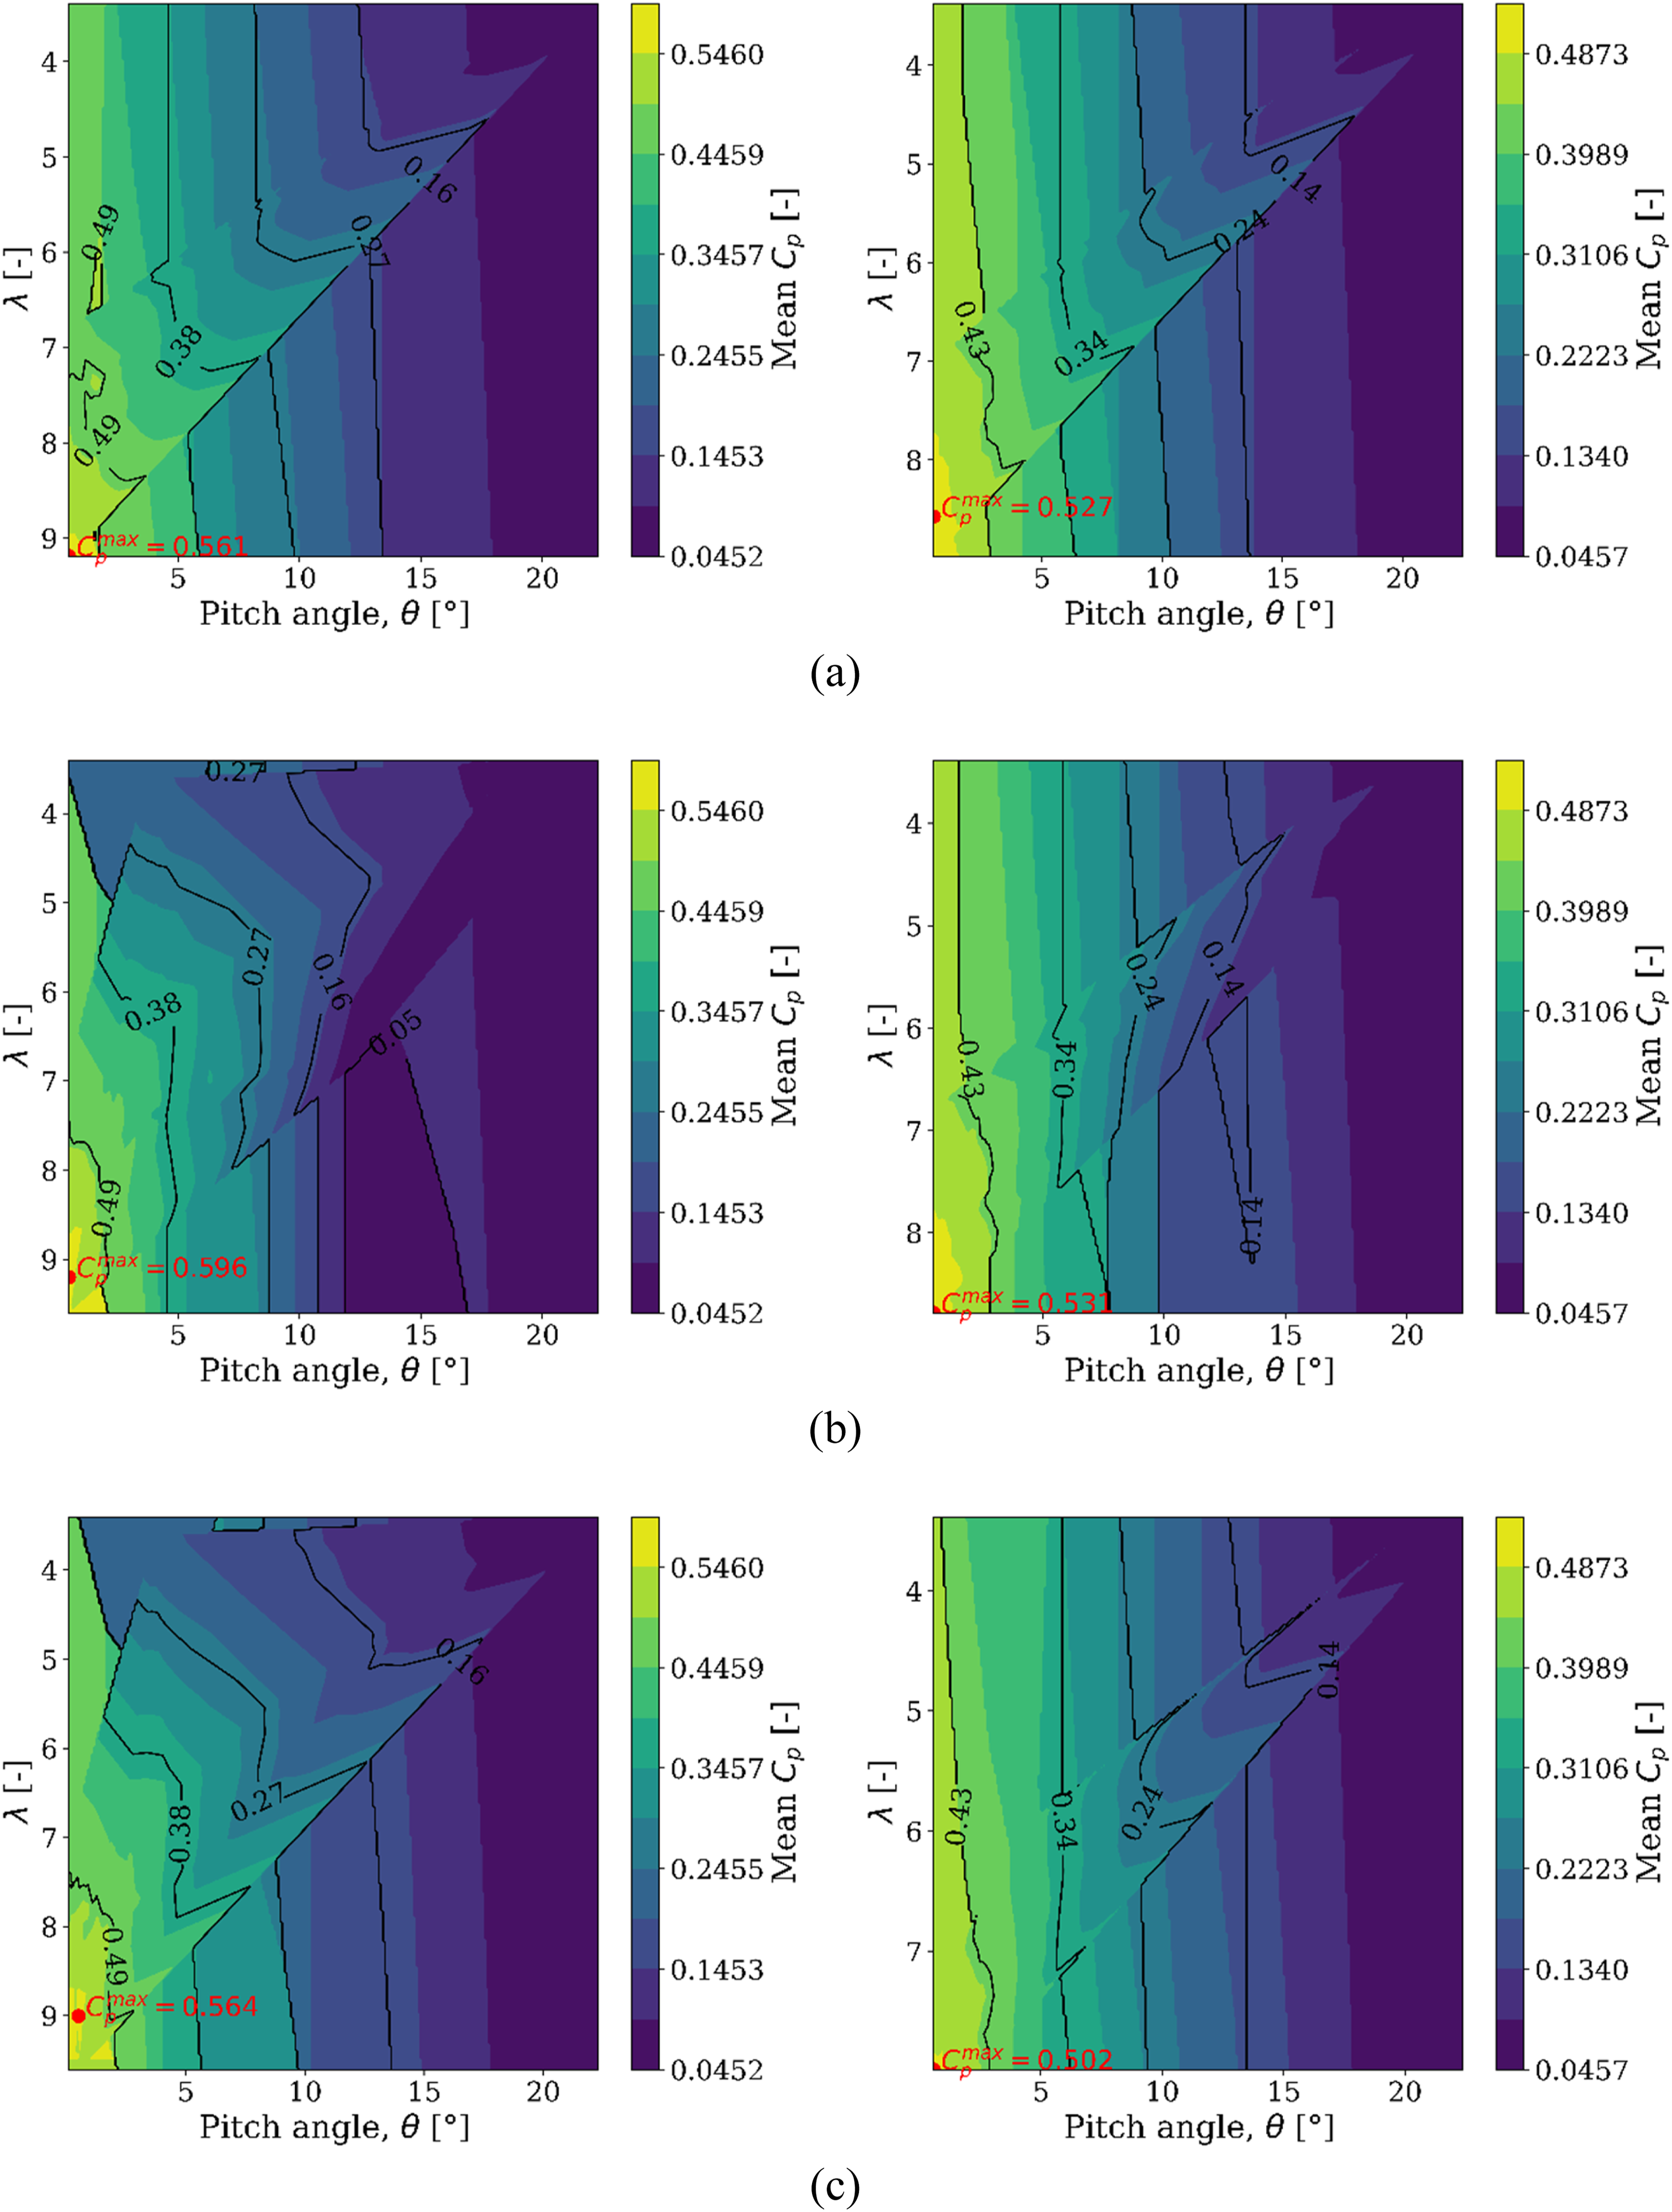
From the plot for T2, which is operating under the wake of T1 with considerable turbulence, the
While observing T3, which is operating in a wake superimposed zone, that is having a higher turbulent flow than T2, the optimum
Every downstream turbine’s optimum
The tip-speed ratio
For these reasons, T3, which has a higher turbulent inflow and a requirement for a rotor for rapid adjustment of its speed to the highly fluctuating wind inflow, exhibits higher optimal Generator power vs wind velocity; (a) ITS 7.5D; (b) ITS 10D.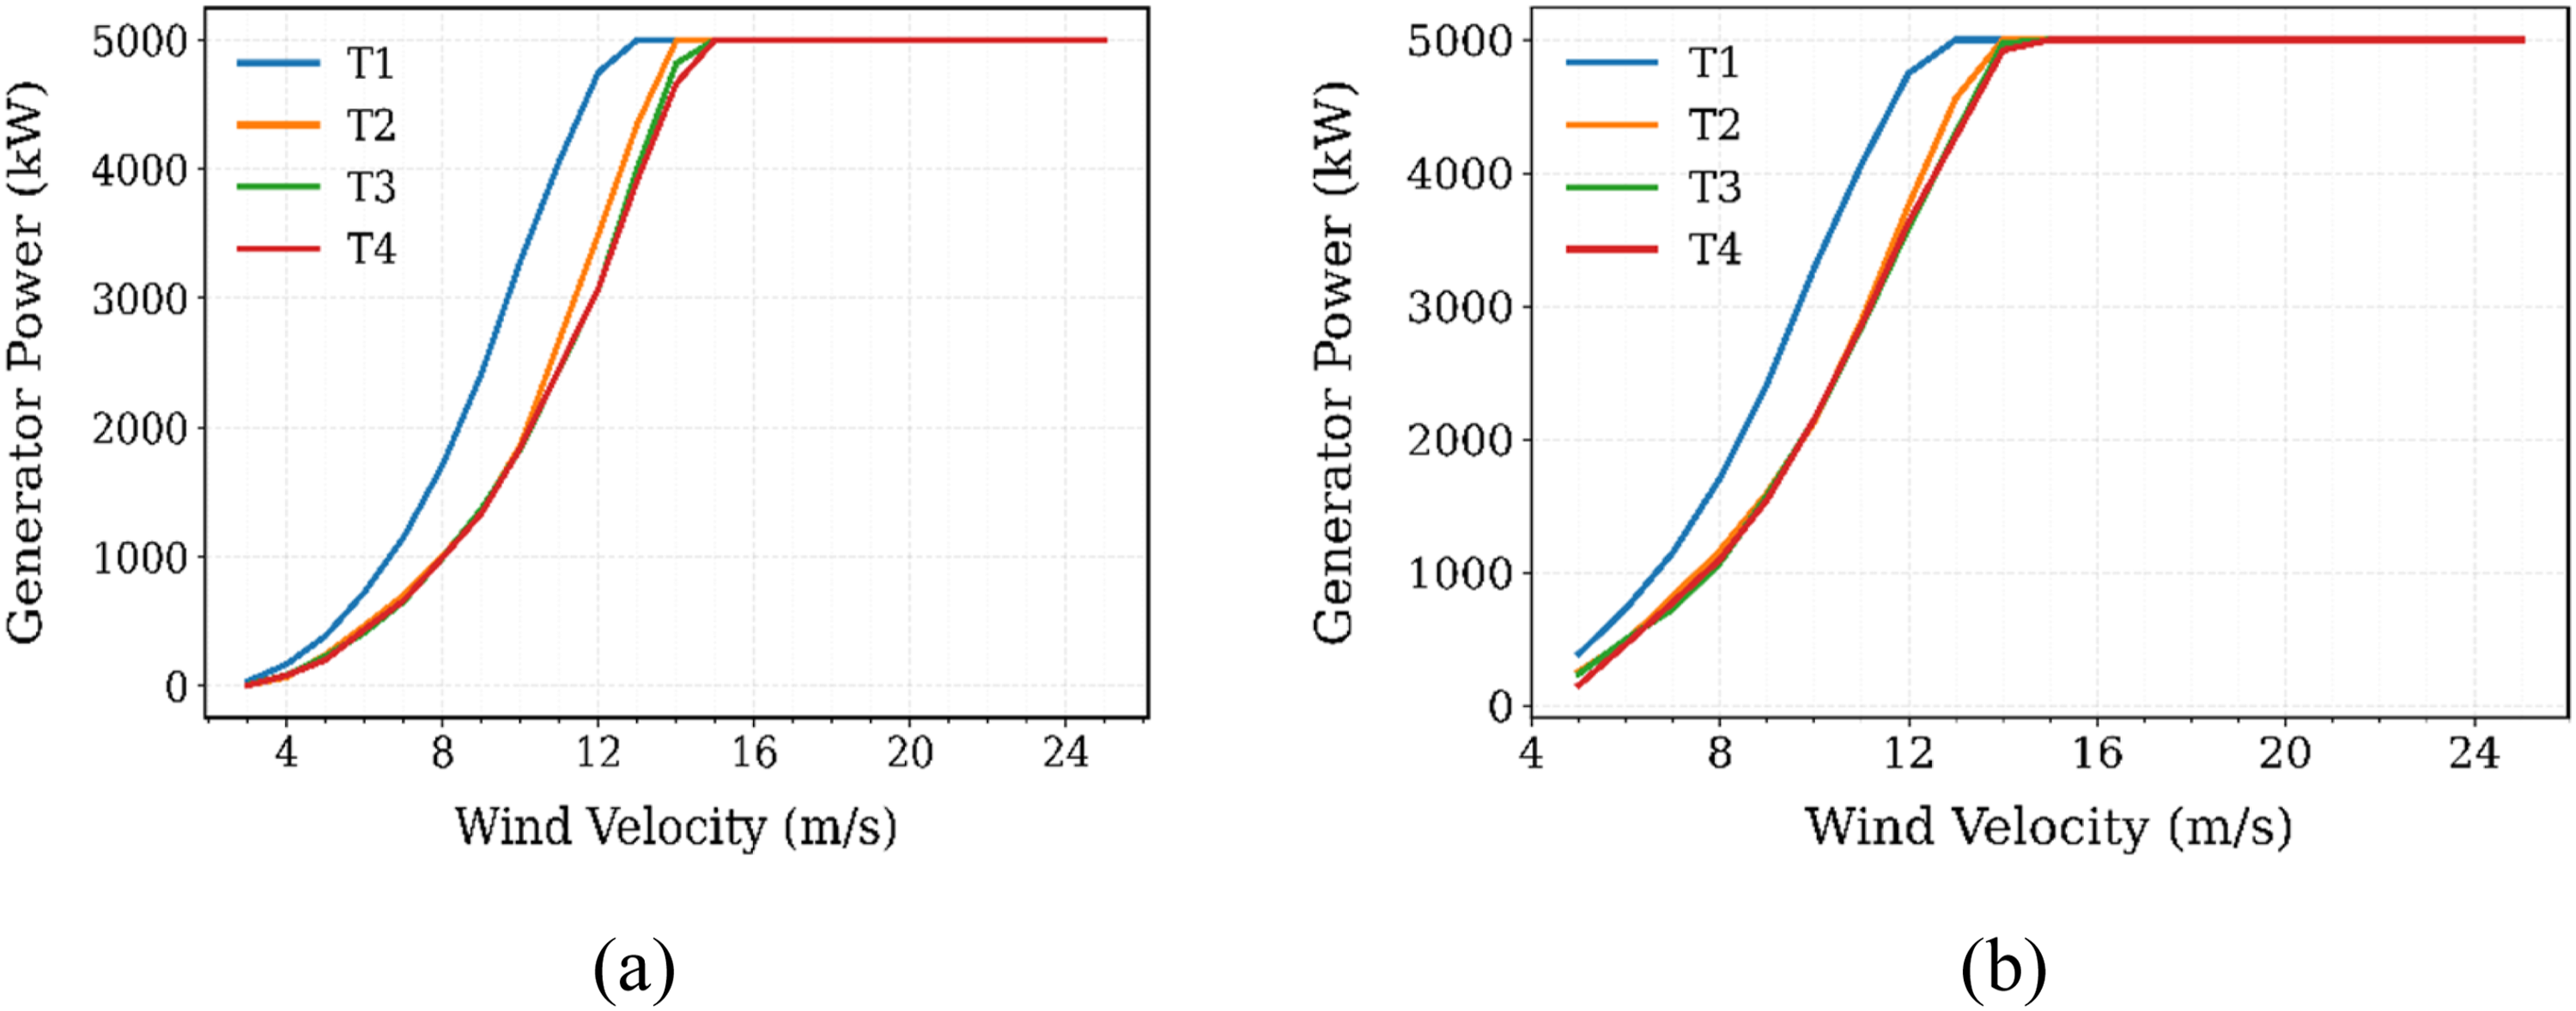
From Figure 6, it is clear how increasing ITS from 7.5D to 10D results in an improvement of the generator power of downstream turbines. This improvement with ITS was dominant in the sub-rated and near-rated region (8 m/s to 12 m/s), where power is very sensitive to inflow velocity. When turbines are closely spaced, WAT and velocity deficit together result in power reduction in T2 to T4, even though they found better
To show how the wake influences downstream turbines in other aspects, a separate study is carried out at one of the velocities (12 m/s) in the next section.
Wake effects on different inflow angles (12 m/s ambient)
Instead of just assessing the effects of wake on velocity deficit, TI, and rotor thrust on the downstream turbine, a secondary study was also conducted to show how these effects vary with different inflow angles for the above turbine arrangements. As per the visualisation shown in Figure 7, for a downstream turbine, the effect of the upstream wake was fully escaped when the inflow angle is at Fast.Farm visualisation for different wind inflow angles; (a) Schematic representation of wake growth using the Jensen Model (wake tail considered at 8D position);(a) 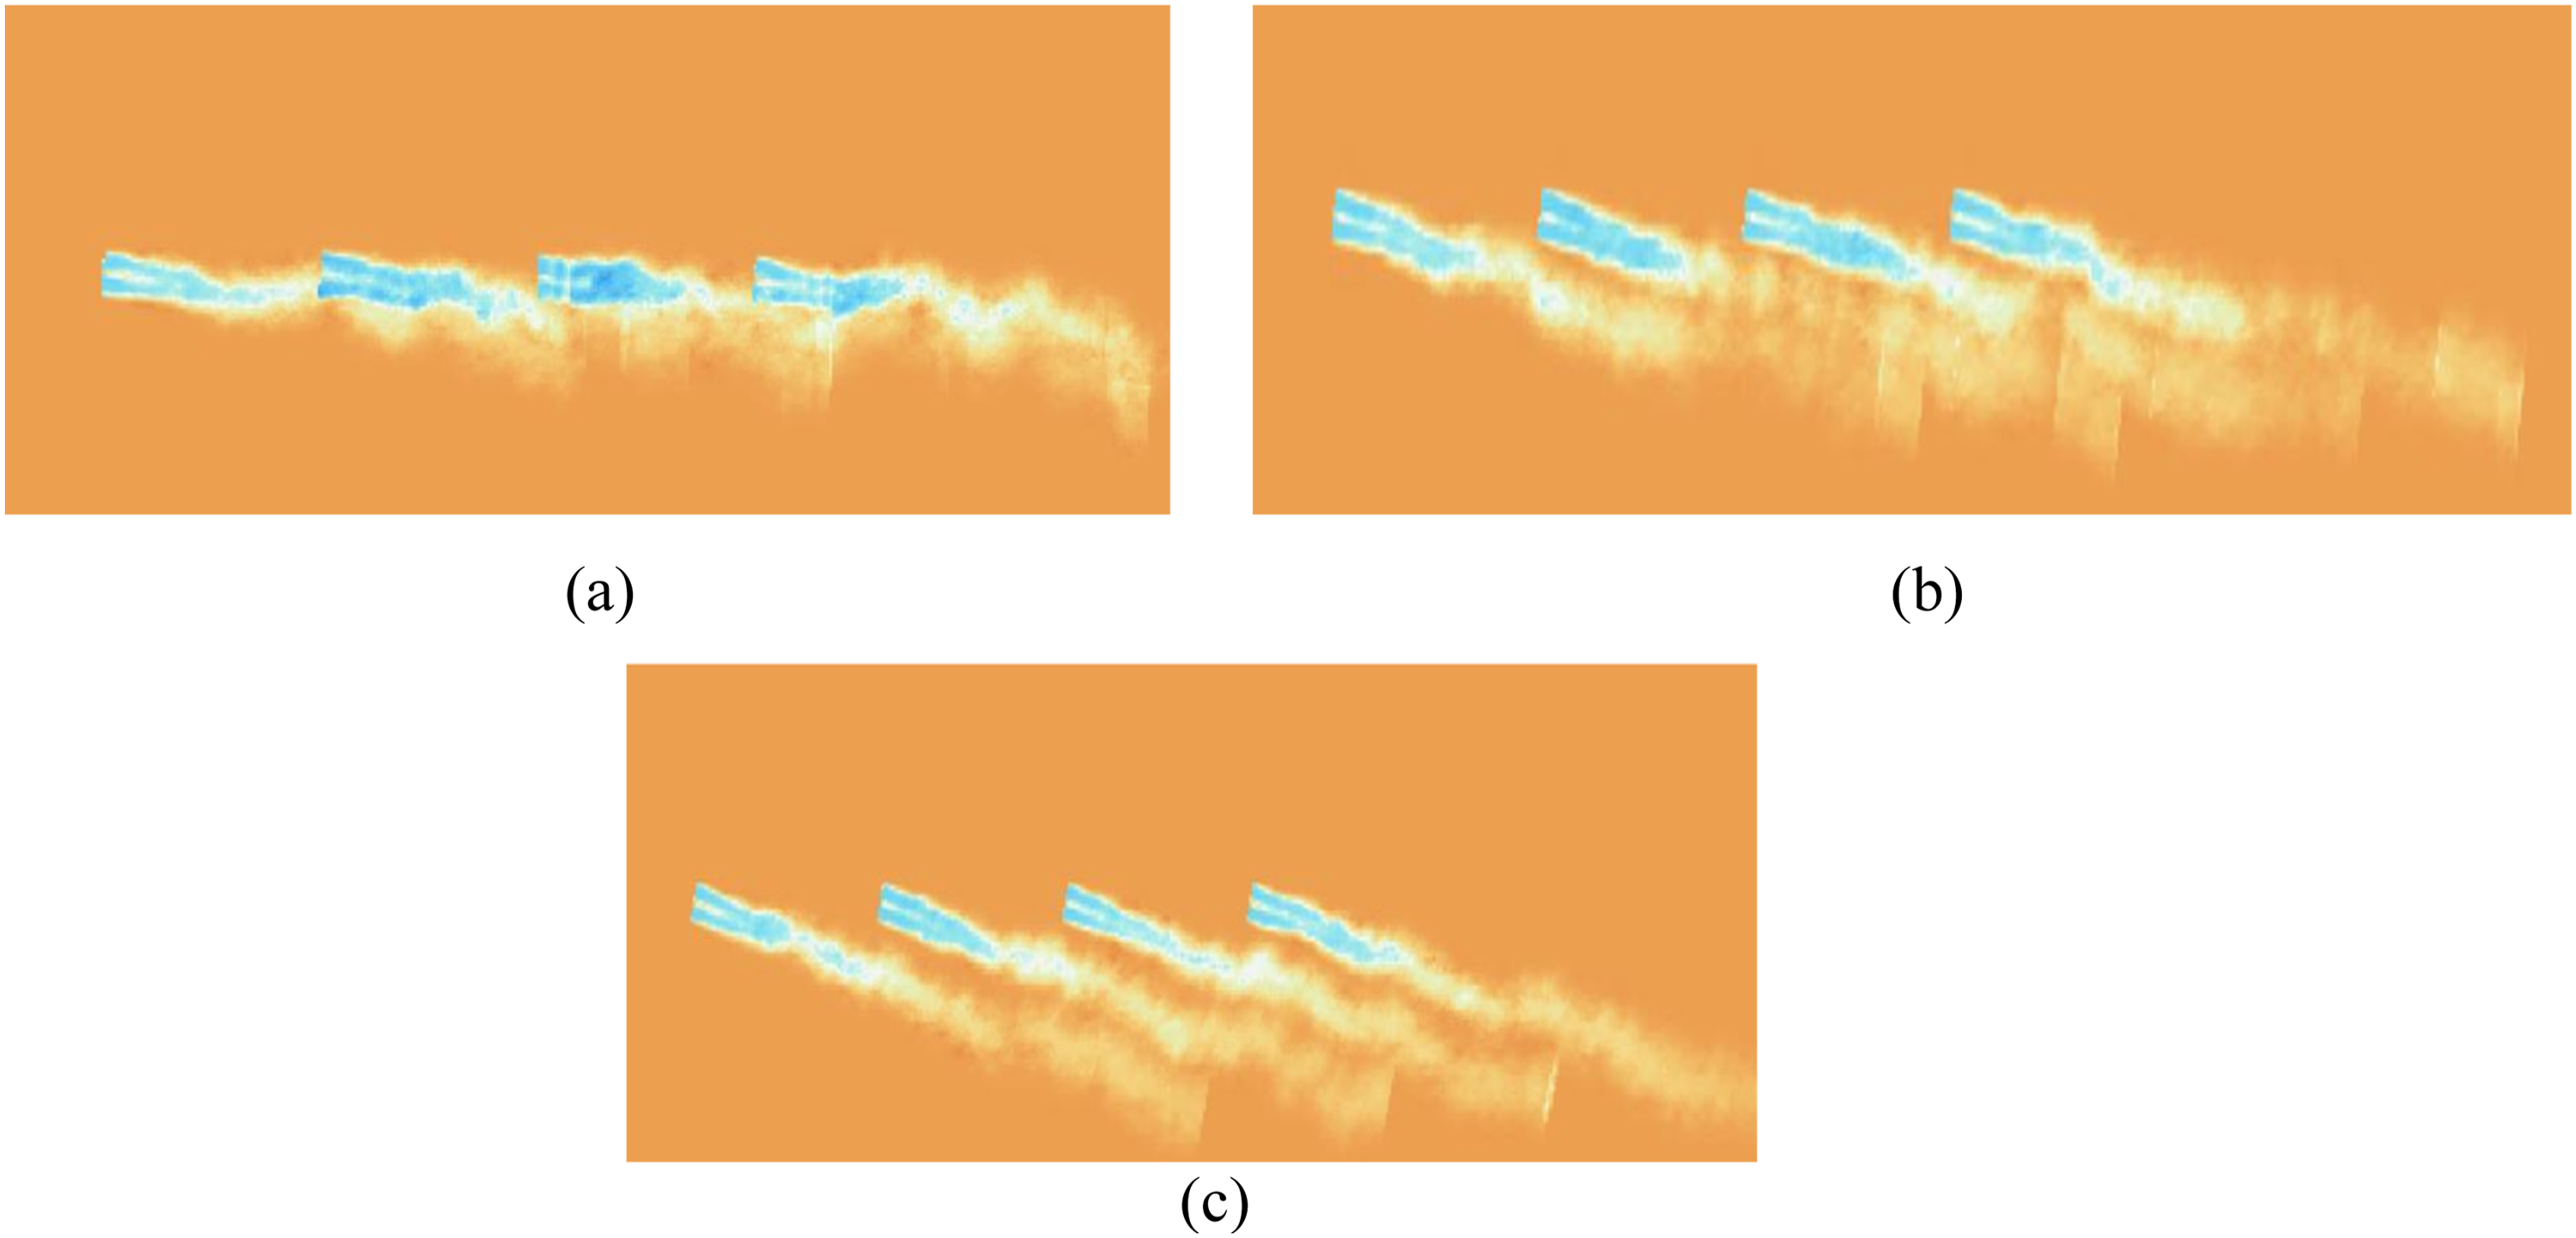

The Equation used is given below as follows:
Where d is the rotor diameter, x is the distance at which the radius of the wake is calculated, and
For this section, only the 12 m/s ambient condition is considered, which is near the rated speed (11.4 m/s) of the NREL 5-MW reference turbine. As per equation (8), the wake geometry (for a given induction setting) is qualitatively the same at other speeds. However, in practice, the
The rotor behaviour for different inflow angle from Figure 9 infers that, when the inflow angle is Effect of inflow angle on downstream wake characteristics and turbine performance (12 m/s): (a) wind velocity, (b) turbulence intensity, (c) rotor thrust, and (d) generator power.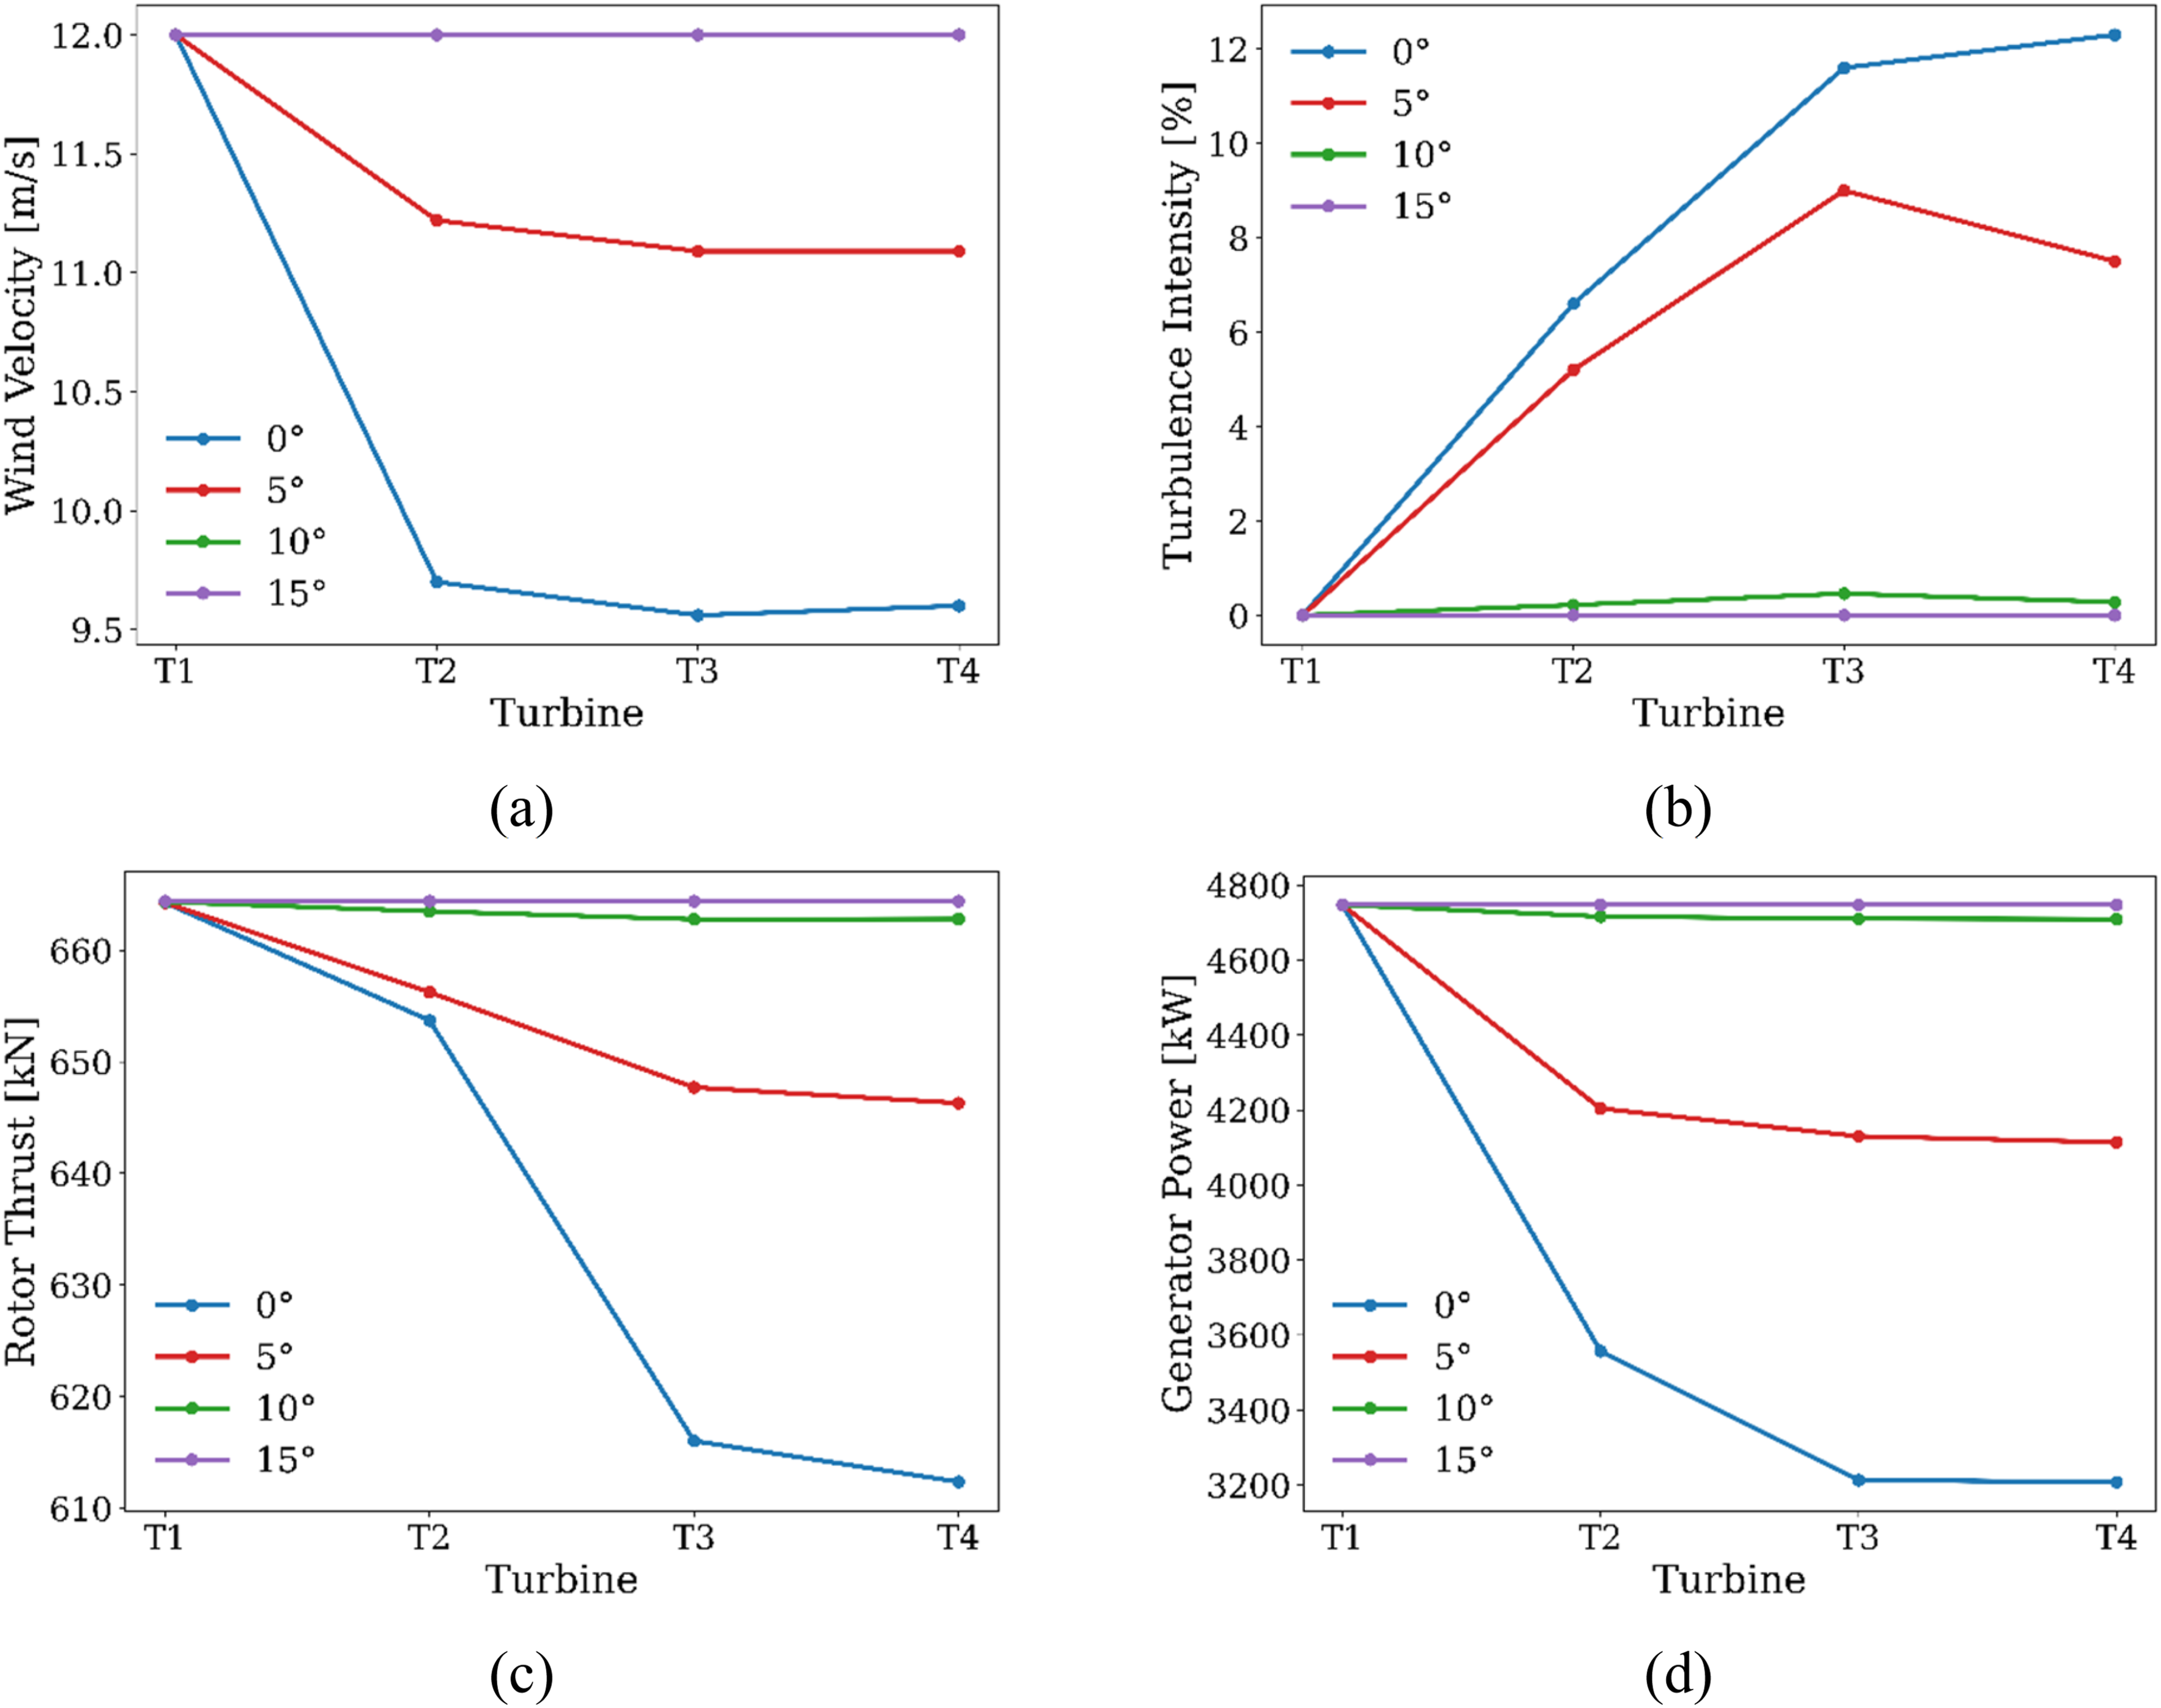
For every angle, this trend remains the same, with a gradual progression to the ambient condition when the angle progresses to
Conclusion
The present study shows how the aerodynamic performance of downstream turbines changes under the influence of wake-added turbulence, compared with common steady-state performance analysis. By comparing aligned and yawed inflow cases, the present study examines how wake deficit and turbulence modify both rotor efficiency and overall farm performance. Providing useful guidance for wind farm layout design and wake mitigation strategy. Below are a few key takeaways from the present study: 1. The downstream rotors operating under WAT exhibited higher peak power coefficients and larger optimal tip-speed ratios than the upstream steady case. The 2. The present study observed a nearly 11% reduction in 3. For a fixed farm layout, changing the inflow angle effectively navigates the wake away from downstream turbines. With sufficient angular offset, the downstream machines experience lesser wake interference, resulting in significant progress in thrust and power output. Planning wind farm layout at angles to the dominant wind direction will help reduce wake interference.
In conclusion, this study highlights the importance of understanding wake behaviour when planning wind farm layouts, accounting for performance losses. Understanding
Limitations and future scope
The present study utilises steady ambient wind conditions to facilitate comparison with ideal aerodynamic characteristics. Implying a realistic turbulent wind field could possibly capture realistic features of the wake and
Analysing the shift in the operating equilibrium under different atmospheric stability conditions may provide more insight into realistic conditions. In addition, Fast.Farm is a mid-fidelity engineering framework which does not resolve all turbulent structures that are achievable using a high-fidelity framework.
Future work may extend the present study by incorporating realistic atmospheric and ambient turbulent conditions, varying atmospheric stability, and conducting detailed validation against experimental or high-fidelity LES datasets. Further studies may also investigate blade pitch control strategies to utilise the increase in normalised
Footnotes
Acknowledgements
The authors would like to convey their gratitude to the Department of Civil Engineering, NIT Calicut, for providing the facilities for carrying out this present study.

Author contributions
Roshan Thomas: Writing original draft, Formal analysis, Investigation, Software implementation, Validation, Conceptualisation.
Satheesh Jothinathan: Conceptualisation, Methodology, and supervision.
R. Prethiv Kumar: Conceptualisation, Methodology, Investigation, Review & Editing and supervision.
Funding
The authors received no financial support for the research, authorship, and/or publication of this article.
Declaration of conflicting interests
The authors declared no potential conflicts of interest with respect to the research, authorship, and/or publication of this article.
Data Availability Statement
All relevant data are available from the authors upon reasonable request.